comparison of seismic performance of rc precast fabricated ... · comparison of seismic performance...
TRANSCRIPT
Comparison of seismic performance of RC precast fabricated shear wall with different infilled opening
*Xi-Mei Zhai1) and Wen-Bo Hu2)
1), 2) Key Lab of Structures Dynamic Behavior and Control of the Ministry of Education, Harbin Institute of Technology, Harbin, Heilongjiang, 150090, China
1) [email protected]; 2) [email protected]
ABSTRACT
Precast fabricated RC shear wall structure meets the requirement of residential industrialization and has a broad prospect of application in china. An integration construction method of setting hollow pipes in the opening to be infilled of RC shear wall was proposed in this paper, which can decrease the stiffness, weight and construction period of the wall. In this paper, three geometrically identical RC precast fabricated shear wall specimens were experimented under constant axial load and quasi-static cyclic lateral loading. The methods to infill the opening of the wall were respectively integration infill (W3), masonry infill (W2) and without infill (W1). Hysteretic curves, skeleton curves, cracking, failure process and mode, variation of the longitudinal rebar strain of walls, stiffness, ductility and energy-dissipating capacity were obtained. The results showed that the integration infill greatly enhanced the integrality, lateral stiffness, bearing capacity and energy-dissipating capacity while decreased the ductility comparing with masonry infilled wall and wall without infill. Meanwhile, numerical simulation of three specimens was conducted by using finite element (FE) software OpenSees. Based on the reasonable modeling and the application of multi-layer shell element, the FE numerical results, were verified with the experimental results. 1. INTRODUCTION With growing urban population, the requirement for quantity and quality of buildings are higher. Thus residential industrialization is vigorously developing in China to improve the quality, productivity and environmental protection property. RC precast fabricated concrete structure is an important part. In concrete shear wall structure, some openings of the wall needs to be infilled, commonly by masonry. In China, a new method to infill the opening is put forward. Firstly, in the region to be infilled, lay two layers of rebar grid and a layer of hollow circular pipes in the middle. Then precast the infilled wall together with the structural wall, and the precast fabricated integration shear wall is formed. Actual earthquake damage indicates that infilled wall share a part of earthquake shear force, and interact in a complicated way with the structure. Previous studies
1)
Professor 2)
Graduate Student
mainly focused on the performance of concrete panels infilled frames or masonry infilled frames. The studies (Canbay 2001; Klingner 1978; Saatcioglu 2003 & Altin 1992) showed that the stiffness, bearing capacity and energy-dissipating capacity were greatly increased in infilled frames in comparison with bare frames. Three concrete shear wall were constructed and experimented under quasi-static reversed cyclic lateral loading. Based on the failure phenomena, process and the experimental results including hysteretic curves, skeleton curves, rebar strain, stiffness, ductility and energy-dissipating capacity, comparisons and analyses were conducted in three wall specimens with different infilled opening. Finally, finite element software OpenSees was used to build the fine FE model corresponding to the three experimented RC precast fabricated shear wall specimens. The FE results were validated to guarantee the precision and feasibility for finite element analysis in this paper. 2. QUASI-STATIC EXPERIMENT
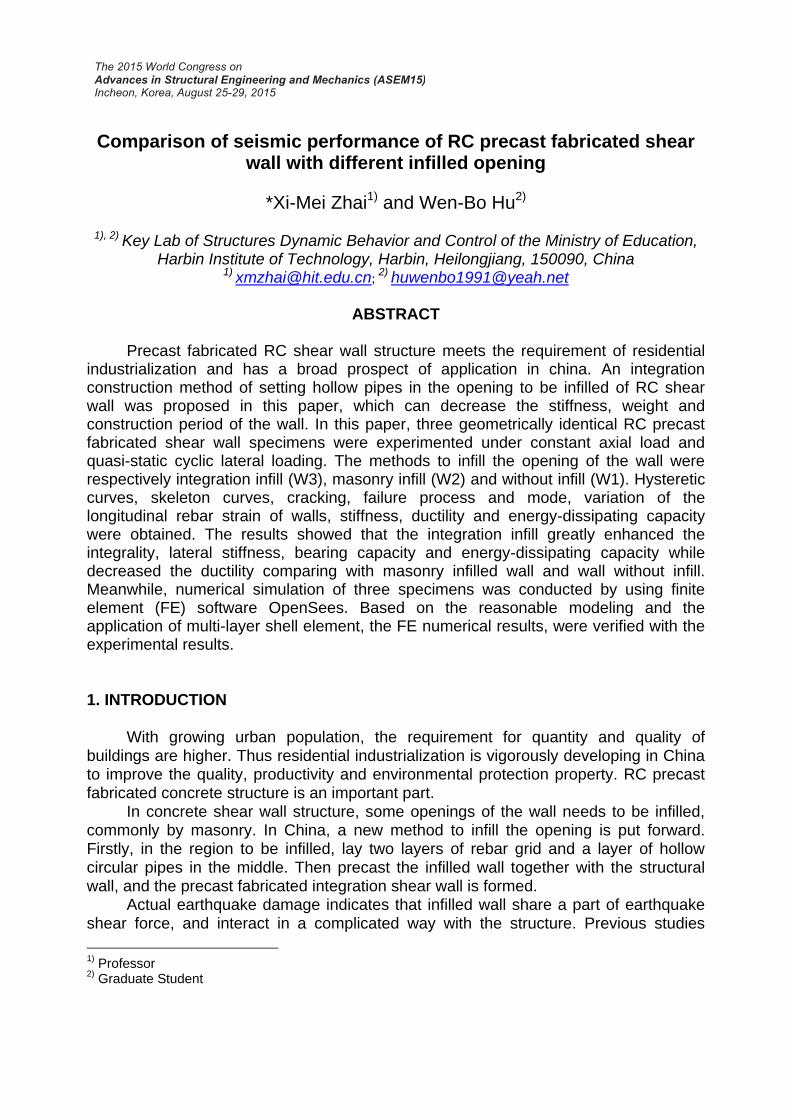
2.1 Specimen design This paper mainly studies the seismic performance of different infilling methods for concrete shear wall. Three wall specimens were designed as short-leg shear wall with coupling beam. The middle part of the wall was infilled wall. The infilling methods were respectively integration infill, masonry infill and without infill. In addition, three identical bottom beams were designed for each specimen. The wall and bottom beam were fabricated together by the restraint grouting-anchoring overlap joint (Jiang 2011). Dimensions and reinforcement of three wall are identical, only infilling method altered. Design parameters are shown in Table 1. Dimensions, reinforcement and connection details of W3 are illustrated in Fig. 1.
Fig. 1 Dimensions, reinforcement and connection details of W3
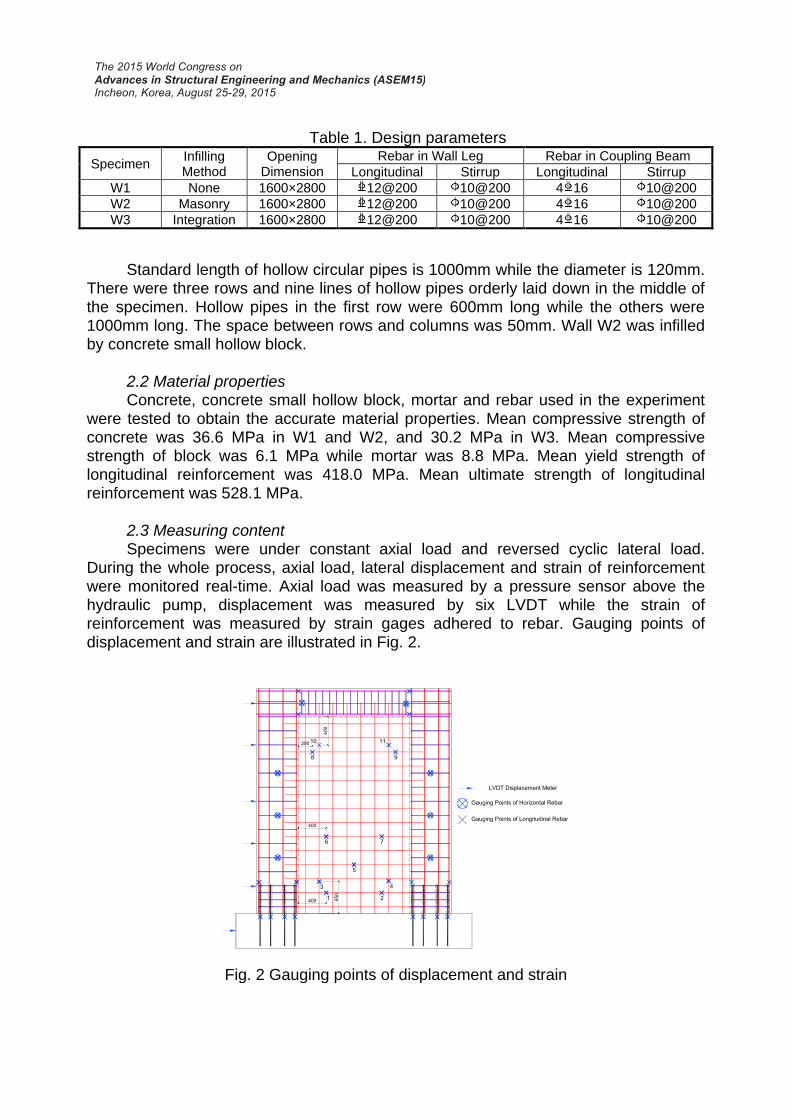
Table 1. Design parameters
Specimen Infilling Method
Opening Dimension
Rebar in Wall Leg Rebar in Coupling Beam
Longitudinal Stirrup Longitudinal Stirrup
W1 None 1600×2800 12@200 10@200 4 16 10@200
W2 Masonry 1600×2800 12@200 10@200 4 16 10@200
W3 Integration 1600×2800 12@200 10@200 4 16 10@200
Standard length of hollow circular pipes is 1000mm while the diameter is 120mm. There were three rows and nine lines of hollow pipes orderly laid down in the middle of the specimen. Hollow pipes in the first row were 600mm long while the others were 1000mm long. The space between rows and columns was 50mm. Wall W2 was infilled by concrete small hollow block.
2.2 Material properties Concrete, concrete small hollow block, mortar and rebar used in the experiment
were tested to obtain the accurate material properties. Mean compressive strength of concrete was 36.6 MPa in W1 and W2, and 30.2 MPa in W3. Mean compressive strength of block was 6.1 MPa while mortar was 8.8 MPa. Mean yield strength of longitudinal reinforcement was 418.0 MPa. Mean ultimate strength of longitudinal reinforcement was 528.1 MPa.
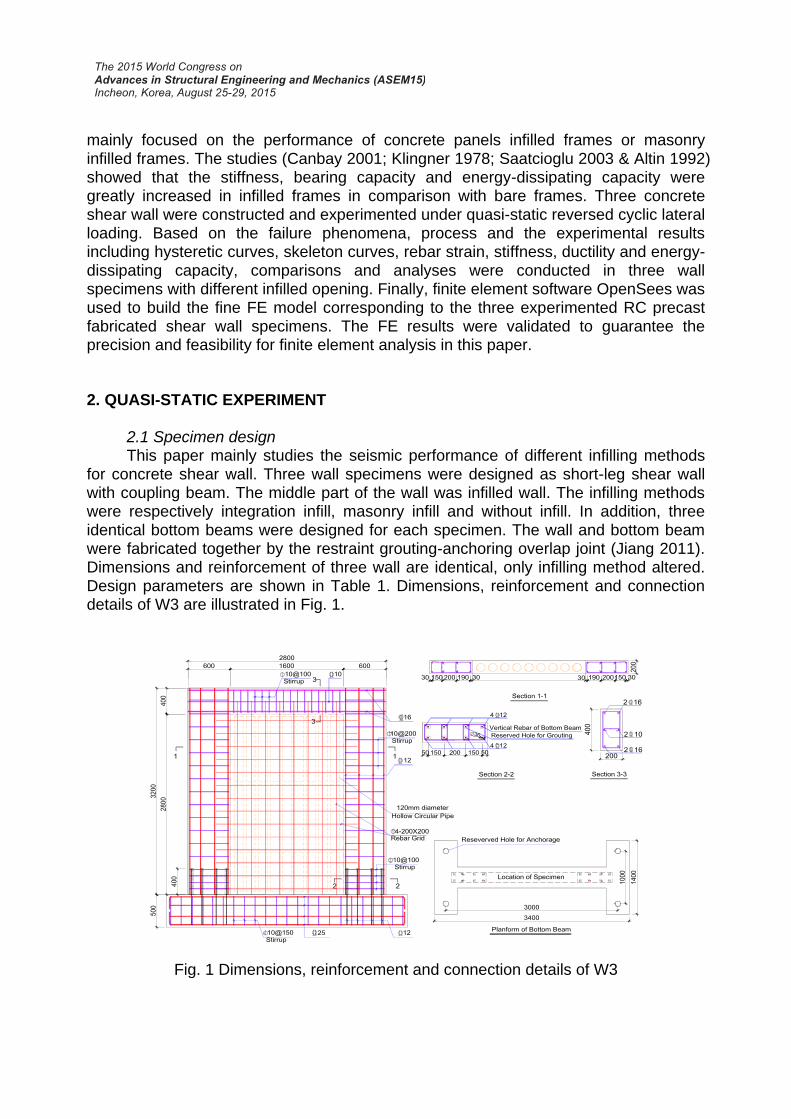
2.3 Measuring content
Specimens were under constant axial load and reversed cyclic lateral load. During the whole process, axial load, lateral displacement and strain of reinforcement were monitored real-time. Axial load was measured by a pressure sensor above the hydraulic pump, displacement was measured by six LVDT while the strain of reinforcement was measured by strain gages adhered to rebar. Gauging points of displacement and strain are illustrated in Fig. 2.
Fig. 2 Gauging points of displacement and strain
2.4 Experiment setup and loading scheme Both vertical and horizontal load were applied to the wall using a rigid beam made
of steel. The specimens were embedded and clamped in the steel beam. The steel beam served to deliver the horizontal load and distribute the vertical load to the two legs of wall. Bottom beam was clamped and fixed to the rigid floor of the laboratory, simulated a rigid foundation. Vertical load was generated by a hydraulic pump above the steel beam while the horizontal load was generated by a horizontally positioned MTS actuator. During the experiment, constant axial load of 1000kN was delivered to the steel beam by a one-way hinge. The one-way hinge also assured the equivalent load distributed to the two wall legs. Experiment setup is illustrated in Fig. 3.
Fig. 3 Experiment setup Loading scheme was designed according to the requirements of Chinese
Specification of Testing Methods for Earthquake-Resistant Building JGJ 101-96 (1997). Quasi-static reversed cyclic lateral loading was applied firstly in force control, and in displacement control after yielded. In displacement control, each displacement was applied twice.
3. EXPERIMENTAL RESULTS AND ANALYSIS
3.1 Experimental phenomena
Load and displacement of each stage are shown in Table 2. Cracking load and displacement stand for the horizontal load and corresponding displacement when

horizontal cracks first appeared in the tensile zone of concrete. Yield load and displacement corresponds to the equivalent yield point, which can be obtained from skeleton curve. Ultimate load means the maximum load appeared in the whole experiment. Ultimate displacement means the maximum displacement appeared in the experiment.
Table 2. Load and displacement of each stage
Specimen
Axial
Load
(kN)
Cracking
Load
(kN)
Cracking
Displacement
(mm)
Yield
Load
(kN)
Yield
Displacement
(mm)
Ultimate
Load
(kN)
Ultimate
Displacement
(mm)
W1 1000 168.8 10.5 188.5 14.1 239.2 90.1
W2 1000 200.9 13.3 285.3 19.3 336.1 90.0
W3 1000 360.8 3.1 583.8 7.3 681.1 35.1
During the experiment of W1, horizontal cracks first appeared in both sides of bottom wall legs. At the meantime, tensile cracks appeared at the end of the coupling beam. With the increase of horizontal load, horizontal cracks appeared in the upper area of wall legs. The existing cracks extended and became slant. After that, the number of horizontal cracks stabilized, width of the cracks grew slightly, the bearing capacity of the wall reached maximum. When bearing capacity was decreasing, concrete of bottom wall legs started to be crushed. Ultimately, both bottom wall legs and the joint area of wall legs and coupling beam damaged seriously. Ultimate displacement reached 90.1mm and bearing capacity decreased to 82% of the maximum. Failure phenomena are shown in Fig. 4(a).
During the experiment of W2, the connection of wall and masonry started to separate in some area at a relatively low load. With increasing load, horizontal cracks appeared in both sides of bottom wall legs. Meanwhile, horizontal and slant cracks appeared along mortar joint in bottom masonry. Then cracks appeared in the upper area of wall legs and the end of coupling beam, existing cracks prolonged aslant. After maximum bearing capacity, surface of concrete started to be crushed, mortar joint cracked in a larger area, bottom horizontal cracks ran through the masonry, several blocks in the corner began to be crushed. Specimen W2 ultimate displacement reached 90mm, bearing capacity decreased to 65% of the maximum. The corner of masonry was seriously crushed thus the whole masonry part was tore down after the experiment. Failure phenomena are shown in Fig. 4(b).
During the experiment of W3, load increased rapidly in the earlier stage without obvious phenomena. When load exceeded 440kN, horizontal cracks appeared in wall legs. Subsequently, horizontal cracks was increasing and extending in a 45-degree direction into the integration infilled region. With the increase of load, diagonal cracks rapidly ran through the integration infilled region. Then the structure reached maximum bearing capacity, concrete of bottom legs began to be crushed. Ultimately, one wall leg was crushed seriously so that the bearing capacity decreased a lot to 61% of the maximum. After loading, horizontal cracks were found in the range of 2m while relatively long 45-degree and diagonal cracks appeared in the integration-infilled region. Failure phenomena are shown in Fig. 4(c).
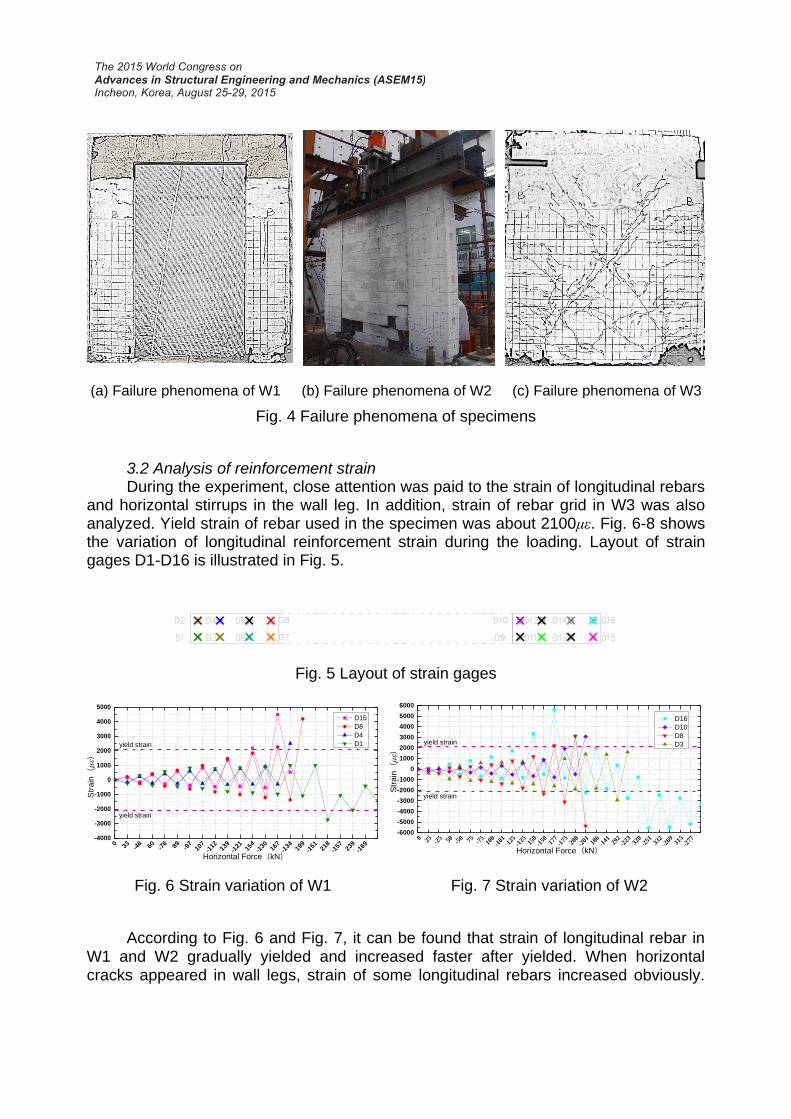
(a) Failure phenomena of W1 (b) Failure phenomena of W2 (c) Failure phenomena of W3
Fig. 4 Failure phenomena of specimens
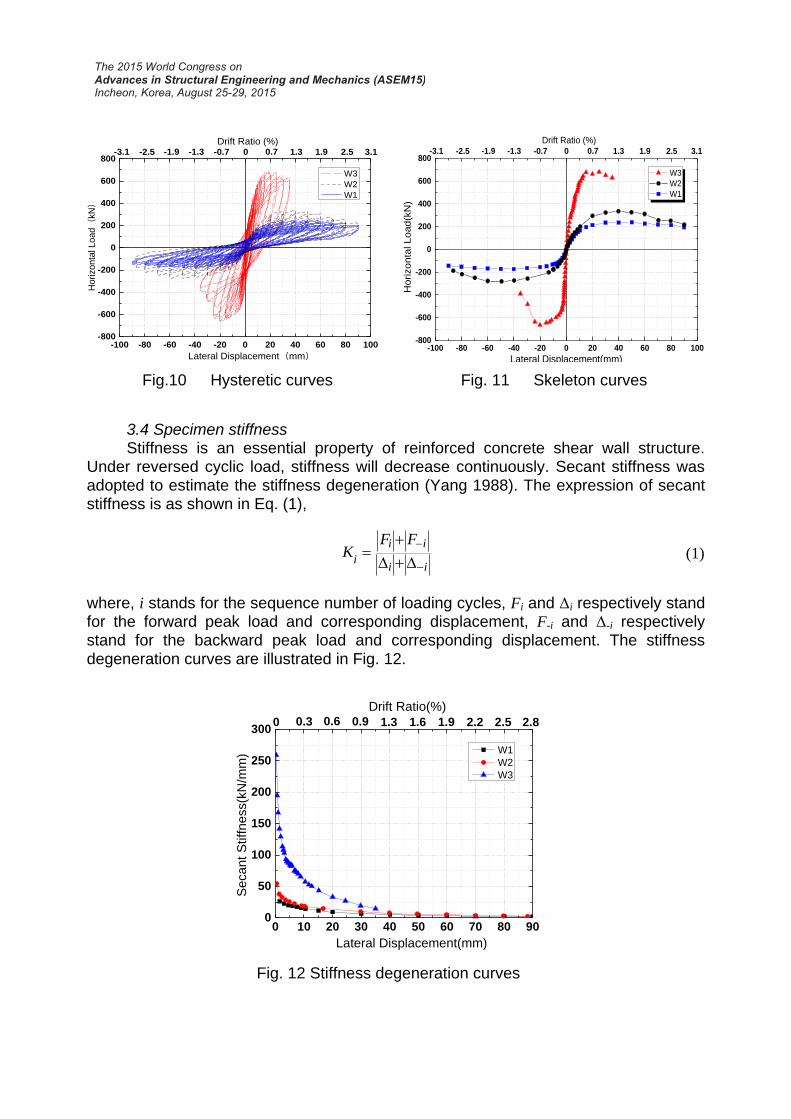
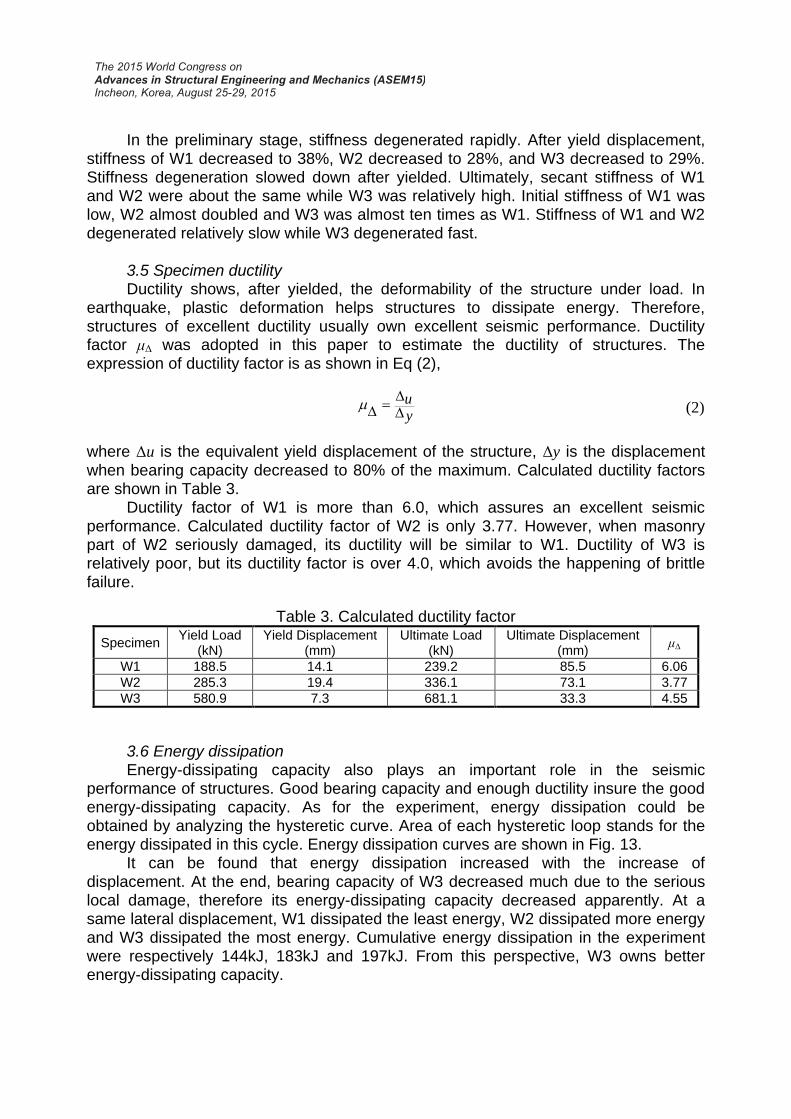
3.2 Analysis of reinforcement strain During the experiment, close attention was paid to the strain of longitudinal rebars
and horizontal stirrups in the wall leg. In addition, strain of rebar grid in W3 was also analyzed. Yield strain of rebar used in the specimen was about 2100με. Fig. 6-8 shows the variation of longitudinal reinforcement strain during the loading. Layout of strain gages D1-D16 is illustrated in Fig. 5.
Fig. 5 Layout of strain gages
0 33 -46 60 -7
6 89 -97
107
-112 13
9-1
21 154
-130 16
7-1
34 199
-151 21
8-1
57 239
-169
-4000
-3000
-2000
-1000
0
1000
2000
3000
4000
5000
yield strain
D15
D8
D4
D1
Horizontal Force(kN)
Str
ain
()
yield strain
0 25 -25 50 -5
0 75 -75
100
-101 12
5-1
25 150
-150 17
7-1
75 200
-201 18
6-1
41 292
-223 32
0-2
51 332
-269 31
5-2
77-6000
-5000
-4000
-3000
-2000
-1000
0
1000
2000
3000
4000
5000
6000
yield strain
yield strain
Str
ain
()
Horizontal Force(kN)
D16
D10
D8
D3
Fig. 6 Strain variation of W1 Fig. 7 Strain variation of W2
According to Fig. 6 and Fig. 7, it can be found that strain of longitudinal rebar in W1 and W2 gradually yielded and increased faster after yielded. When horizontal cracks appeared in wall legs, strain of some longitudinal rebars increased obviously.
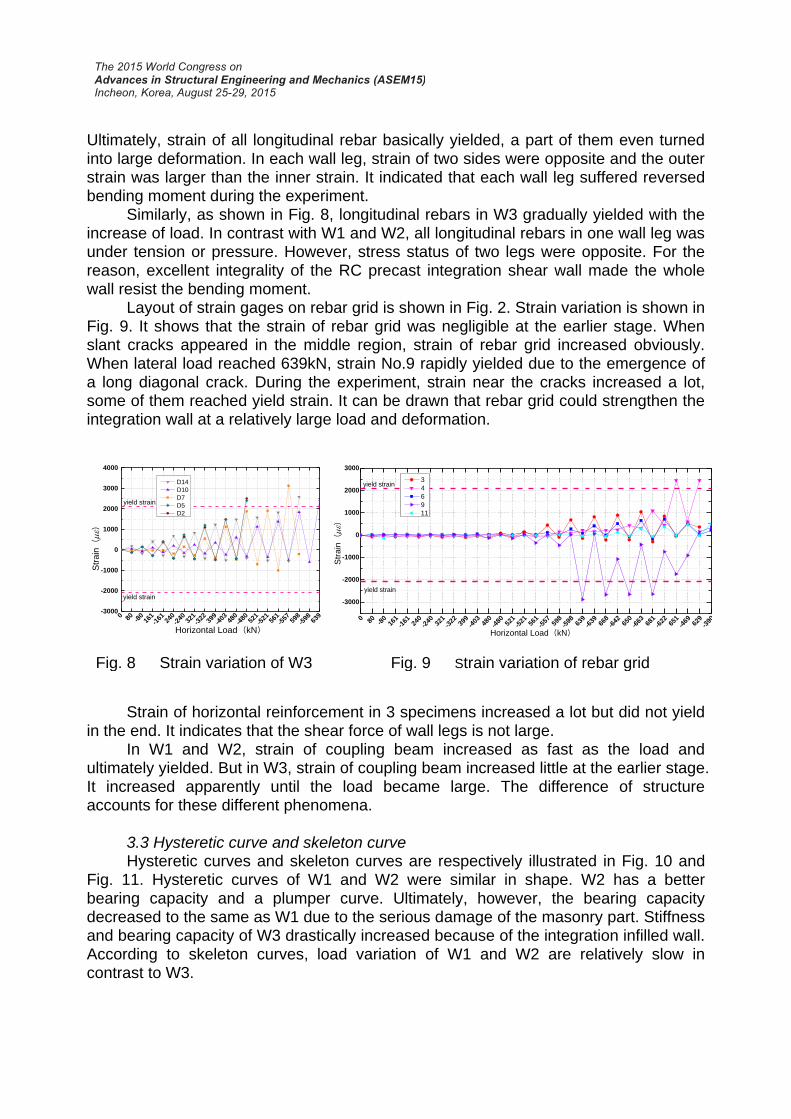
Ultimately, strain of all longitudinal rebar basically yielded, a part of them even turned into large deformation. In each wall leg, strain of two sides were opposite and the outer strain was larger than the inner strain. It indicated that each wall leg suffered reversed bending moment during the experiment.
Similarly, as shown in Fig. 8, longitudinal rebars in W3 gradually yielded with the increase of load. In contrast with W1 and W2, all longitudinal rebars in one wall leg was under tension or pressure. However, stress status of two legs were opposite. For the reason, excellent integrality of the RC precast integration shear wall made the whole wall resist the bending moment.
Layout of strain gages on rebar grid is shown in Fig. 2. Strain variation is shown in Fig. 9. It shows that the strain of rebar grid was negligible at the earlier stage. When slant cracks appeared in the middle region, strain of rebar grid increased obviously. When lateral load reached 639kN, strain No.9 rapidly yielded due to the emergence of a long diagonal crack. During the experiment, strain near the cracks increased a lot, some of them reached yield strain. It can be drawn that rebar grid could strengthen the integration wall at a relatively large load and deformation.
0 80 -80
161-1
61 240-2
40 321-3
22 399-4
03 480-4
80 521-5
21 561-5
57 598-5
98 639
-3000
-2000
-1000
0
1000
2000
3000
4000
yield strain
yield strain
Str
ain
()
Horizontal Load(kN)
D14
D10
D7
D5
D2
0 80 -8
016
1-1
61 240
-240 32
1-3
22 399
-403 48
0-4
80 521
-521 56
1-5
57 598
-598 63
9-6
39 668
-642 65
0-6
63 681
-622 65
1-4
69 629
-390
-3000
-2000
-1000
0
1000
2000
3000
yield strain
yield strain
Str
ain
()
Horizontal Load(kN)
3
4
6
9
11
Fig. 8 Strain variation of W3 Fig. 9 Strain variation of rebar grid
Strain of horizontal reinforcement in 3 specimens increased a lot but did not yield in the end. It indicates that the shear force of wall legs is not large.
In W1 and W2, strain of coupling beam increased as fast as the load and ultimately yielded. But in W3, strain of coupling beam increased little at the earlier stage. It increased apparently until the load became large. The difference of structure accounts for these different phenomena.
3.3 Hysteretic curve and skeleton curve Hysteretic curves and skeleton curves are respectively illustrated in Fig. 10 and
Fig. 11. Hysteretic curves of W1 and W2 were similar in shape. W2 has a better bearing capacity and a plumper curve. Ultimately, however, the bearing capacity decreased to the same as W1 due to the serious damage of the masonry part. Stiffness and bearing capacity of W3 drastically increased because of the integration infilled wall. According to skeleton curves, load variation of W1 and W2 are relatively slow in contrast to W3.
-100 -80 -60 -40 -20 0 20 40 60 80 100-800
-600
-400
-200
0
200
400
600
8003.12.51.91.30.70-0.7-1.3-1.9-2.5
Drift Ratio (%)
Horizonta
l Load(
kN
)
Lateral Displacement(mm)
W3
W2
W1
-3.1
-100 -80 -60 -40 -20 0 20 40 60 80 100
-800
-600
-400
-200
0
200
400
600
800
W3
W2
W1
Lateral Displacement(mm)
Horizonta
l Load(k
N)
3.12.51.91.30.70-0.7-1.3-1.9-2.5
Drift Ratio (%)-3.1
Fig.10 Hysteretic curves Fig. 11 Skeleton curves
3.4 Specimen stiffness Stiffness is an essential property of reinforced concrete shear wall structure.
Under reversed cyclic load, stiffness will decrease continuously. Secant stiffness was adopted to estimate the stiffness degeneration (Yang 1988). The expression of secant stiffness is as shown in Eq. (1),
i i
ii i
F FK
(1)
where, i stands for the sequence number of loading cycles, Fi and Δi respectively stand for the forward peak load and corresponding displacement, F-i and Δ-i respectively stand for the backward peak load and corresponding displacement. The stiffness degeneration curves are illustrated in Fig. 12.
0 10 20 30 40 50 60 70 80 900
50
100
150
200
250
300
Seca
nt
Stiffn
ess(k
N/m
m)
Lateral Displacement(mm)
W1
W2
W3
2.82.52.21.91.61.30.90.60.3
Drift Ratio(%)
0
Fig. 12 Stiffness degeneration curves
In the preliminary stage, stiffness degenerated rapidly. After yield displacement, stiffness of W1 decreased to 38%, W2 decreased to 28%, and W3 decreased to 29%. Stiffness degeneration slowed down after yielded. Ultimately, secant stiffness of W1 and W2 were about the same while W3 was relatively high. Initial stiffness of W1 was low, W2 almost doubled and W3 was almost ten times as W1. Stiffness of W1 and W2 degenerated relatively slow while W3 degenerated fast.
3.5 Specimen ductility Ductility shows, after yielded, the deformability of the structure under load. In
earthquake, plastic deformation helps structures to dissipate energy. Therefore, structures of excellent ductility usually own excellent seismic performance. Ductility factor μΔ was adopted in this paper to estimate the ductility of structures. The expression of ductility factor is as shown in Eq (2),
u
y
(2)
where Δu is the equivalent yield displacement of the structure, Δy is the displacement
when bearing capacity decreased to 80% of the maximum. Calculated ductility factors are shown in Table 3.
Ductility factor of W1 is more than 6.0, which assures an excellent seismic performance. Calculated ductility factor of W2 is only 3.77. However, when masonry part of W2 seriously damaged, its ductility will be similar to W1. Ductility of W3 is relatively poor, but its ductility factor is over 4.0, which avoids the happening of brittle failure.
Table 3. Calculated ductility factor
Specimen Yield Load
(kN) Yield Displacement
(mm) Ultimate Load
(kN) Ultimate Displacement
(mm) μΔ
W1 188.5 14.1 239.2 85.5 6.06
W2 285.3 19.4 336.1 73.1 3.77
W3 580.9 7.3 681.1 33.3 4.55
3.6 Energy dissipation Energy-dissipating capacity also plays an important role in the seismic
performance of structures. Good bearing capacity and enough ductility insure the good energy-dissipating capacity. As for the experiment, energy dissipation could be obtained by analyzing the hysteretic curve. Area of each hysteretic loop stands for the energy dissipated in this cycle. Energy dissipation curves are shown in Fig. 13.
It can be found that energy dissipation increased with the increase of displacement. At the end, bearing capacity of W3 decreased much due to the serious local damage, therefore its energy-dissipating capacity decreased apparently. At a same lateral displacement, W1 dissipated the least energy, W2 dissipated more energy and W3 dissipated the most energy. Cumulative energy dissipation in the experiment were respectively 144kJ, 183kJ and 197kJ. From this perspective, W3 owns better energy-dissipating capacity.

0 10 20 30 40 50 60 70 80 90 1000
3000
6000
9000
12000
15000
18000
21000
Ene
rgy D
issip
atio
n(k
N·m
m)
Lateral Displacement(mm)
W1
W2
W3
3.12.82.52.21.91.61.30.90.60.3
Drift Ratio(%)
0
0 10 20 30 40 50 60 70 80 90 100
0.0
0.5
1.0
1.5
2.0
2.5
En
erg
y D
issip
atio
n F
acto
r
Lateral Displacement(mm)
W1
W2
W3
3.12.82.52.21.91.61.30.90.60.3
Drift Ratio(%)
0
Fig. 13 Energy dissipation curves Fig. 14 Energy dissipation factor curves In order to describe the ratio of the energy dissipated to the elastic potential
energy at the maximum displacement in one cycle, energy dissipation factor was introduced in Chinese Specification of Testing Methods for Earthquake-Resistant Building JGJ 101-96 (1997). Energy dissipation factor curves are shown in Fig. 14. Higher value stands for better energy-dissipating capacity. As displacement more than 5.0 mm, energy dissipation factor of W3 was always at a higher level while W2 was relatively low and W1 was the least. Therefore, considering energy-dissipating capacity, W3 works better than W1 and W2.
4. NUMERICAL SIMULATION
4.1 Modeling method FEA software OpenSees was adopted to simulate and verify the experiment
results. Based on existing element ShellMITC4, a kind of multi-layer shell element for the simulation of shear wall was developed by Lu (2013). The multi-layer shell element was used to simulate the concrete, stirrups and distributing rebars in the wall.
The multi-layer shell element is based on the principles of composite material mechanics. It is made up of a number of layers with different thicknesses and different material properties (i.e. concrete layers or rebar layers), as shown in Fig. 15(a). The rebars are smeared into one or more layers and these rebar layers can be either isotropic or orthotropic depending on the reinforcement ratio in the longitudinal and transverse directions, as shown in Fig. 15(b). Truss element was applied to simulate longitudinal rebars in wall leg and coupling beam.
In order to simulate the integration region in W3, a hollow layer could be set in the multi-layer shell element. The elastic modulus and strength of the hollow layer should be very small thus the results could be similar. Hollow element and solid element are spaced so as to simplify the section of integration infill, as shown in Fig. 16.
Wall leg, coupling beam and infill part were defined as different multi-layer sections. The wall leg and coupling beam were divided into 8 layers while the infill part was divided into 10 layers.
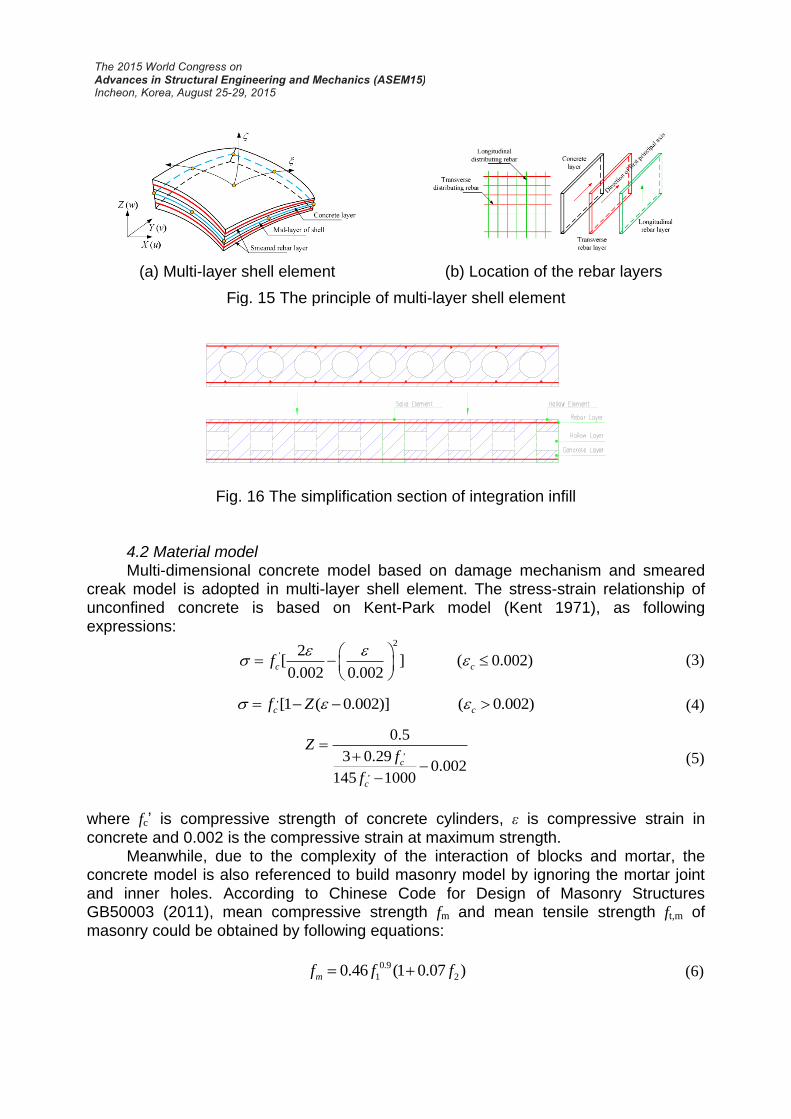
(a) Multi-layer shell element (b) Location of the rebar layers
Fig. 15 The principle of multi-layer shell element
Fig. 16 The simplification section of integration infill
4.2 Material model Multi-dimensional concrete model based on damage mechanism and smeared
creak model is adopted in multi-layer shell element. The stress-strain relationship of unconfined concrete is based on Kent-Park model (Kent 1971), as following expressions:
2
' 2[ ] ( 0.002)0.002 0.002
c cf
(3)
,[1 ( 0.002)] ( 0.002)c cf Z (4)
,
,
0.5
3 0.290.002
145 1000c
c
Zf
f
(5)
where fc’ is compressive strength of concrete cylinders, ε is compressive strain in
concrete and 0.002 is the compressive strain at maximum strength. Meanwhile, due to the complexity of the interaction of blocks and mortar, the
concrete model is also referenced to build masonry model by ignoring the mortar joint and inner holes. According to Chinese Code for Design of Masonry Structures GB50003 (2011), mean compressive strength fm and mean tensile strength ft,m of masonry could be obtained by following equations:
0.9
1 20.46 (1 0.07 )mf f f
(6)

, 20.069t mf f (7)
where f1 is mean compressive strength of concrete block,f2 is mean compressive
strength of mortar. The constitutive stress-strain curve from the result of Zhu (1998) is accepted, as following equations:
00
0
( )0.2 0.8( )mf
(8)
0 01.2 0.2( ) ( )mf
(9)
where ε is compressive strain in masonry, ε0 is strain at maximum strength. Based on above stress-strain relations of concrete and masonry, parameters for simulation are obtained and shown in Table 4.
Table 4. Parameters of concrete and masonry
Specimen fc
(MPa) ft
(MPa) fcu
(MPa) epsc0(
0 ) epscu( cu ) epstu( tu ) stc
W1 24.5 2.45 -4.90 -0.002 -0.0058 0.001 0.02
W2 24.5 2.45 -4.90 -0.002 -0.0058 0.001 0.03
W3 20.2 2.02 -4.04 -0.002 -0.0066 0.001 0.03
Masonry 3.8 0.2 -0.76 -0.002 -0.0100 0.001 0.03
where fc is concrete compressive strength at 28 days, ft is concrete tensile strength, fcu
is concrete crushing strength, epscu is the compressive strain at crushing strength, epstu is the ultimate tensile strain and stc is the shear retention factor. ft is assumed to be 0.1fc while fcu is assumed to be 0.2fc.
The stress-strain model of rebar is Steel02 in OpenSees, a uniaxial Giuffre-Menegotto-Pinto steel material with isotropic strain hardening (Mazzoni 2004). Parameters are shown in Table 5.
Table 5. Parameters of rebar
Diameter (mm)
Area (mm2)
Yield Stress (MPa)
E (×103N/mm2)
b R0 cR1 cR2
4 12.6 528.1 235 0.01 12 0.925 0.15
10 78.5 330.0 170 0.01 18 0.925 0.15
12 113.0 418.0 208 0.01 18 0.925 0.15
16 201.0 427.3 196 0.01 18 0.925 0.15
where E is initial elastic tangent, b is the ratio between post-yield tangent and initial elastic tangent. R0, cR1 and cR2 are parameters that control the transition from elastic to plastic branches, recommended values were adopted.
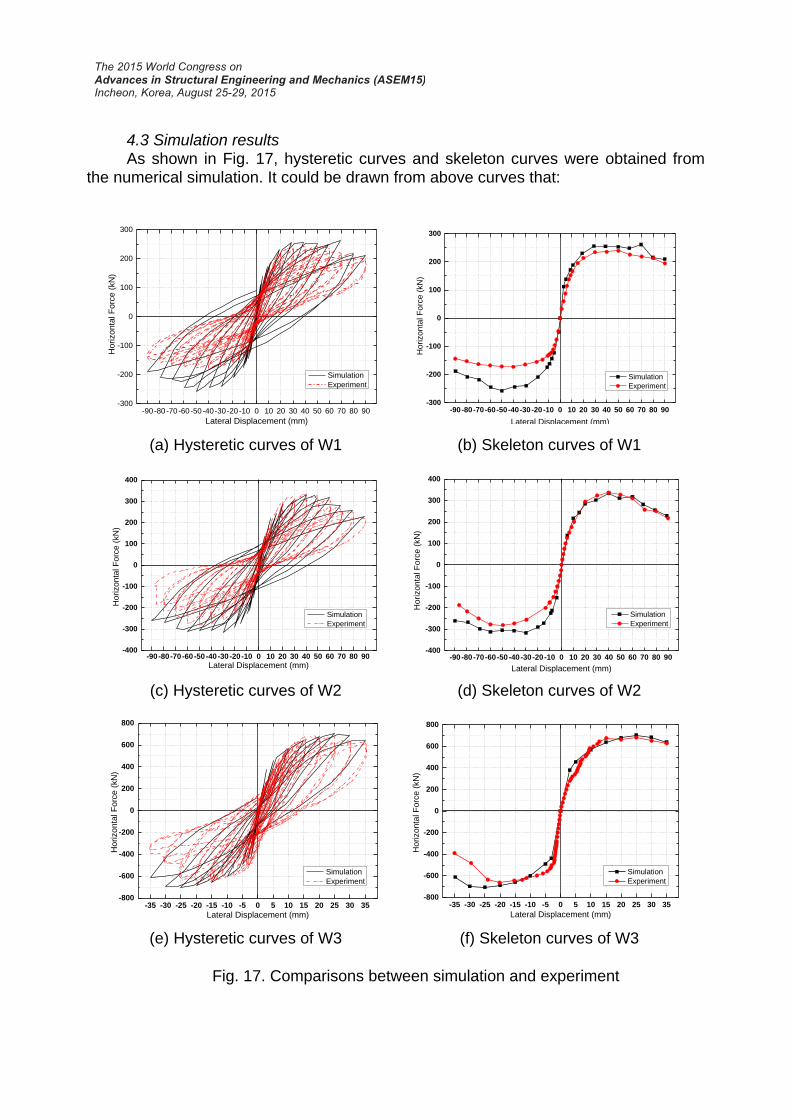
4.3 Simulation results
As shown in Fig. 17, hysteretic curves and skeleton curves were obtained from the numerical simulation. It could be drawn from above curves that:
-90-80-70-60-50-40-30-20-10 0 10 20 30 40 50 60 70 80 90-300
-200
-100
0
100
200
300
Horizonta
l F
orc
e (
kN
)
Lateral Displacement (mm)
Simulation
Experiment
-90-80-70-60-50-40-30-20-10 0 10 20 30 40 50 60 70 80 90
-300
-200
-100
0
100
200
300
Simulation
Experiment
Horizonta
l F
orc
e (
kN
)Lateral Displacement (mm)
(a) Hysteretic curves of W1 (b) Skeleton curves of W1
-90-80-70-60-50-40-30-20-10 0 10 20 30 40 50 60 70 80 90-400
-300
-200
-100
0
100
200
300
400
Horizonta
l F
orc
e (
kN
)
Lateral Displacement (mm)
Simulation
Experiment
-90-80-70-60-50-40-30-20-10 0 10 20 30 40 50 60 70 80 90
-400
-300
-200
-100
0
100
200
300
400
Simulation
Experiment
Ho
rizon
tal F
orc
e (
kN
)
Lateral Displacement (mm)
(c) Hysteretic curves of W2 (d) Skeleton curves of W2
-35 -30 -25 -20 -15 -10 -5 0 5 10 15 20 25 30 35-800
-600
-400
-200
0
200
400
600
800
Ho
rizon
tal F
orc
e (
kN
)
Lateral Displacement (mm)
Simulation
Experiment
-35 -30 -25 -20 -15 -10 -5 0 5 10 15 20 25 30 35-800
-600
-400
-200
0
200
400
600
800
Simulation
Experiment
Ho
rizon
tal F
orc
e (
kN
)
Lateral Displacement (mm)
(e) Hysteretic curves of W3 (f) Skeleton curves of W3
Fig. 17. Comparisons between simulation and experiment

(1) Bearing capacity obtained from simulation matches with the experiment. The differences of forward bearing capacity are less than 10% while the differences of backward bearing capacity are mainly due to the defects of specimen itself.
(2) For W2, conformable result was obtained. It indicates that homogenous concrete model could be applied to build the masonry infill wall.
(3) Multi-layer shell element with a hollow layer worked well to simplify and simulate the integration infill in W3.
Besides, analyses of stress state in the Truss element shows that strain variation of longitudinal rebars in wall leg and coupling beam is similar to the experiment. Longitudinal rebars basically yielded but usually yielded 1 or 2 load steps later than the experiment. 5. CONCLUSIONS
(1) The wall legs of RC precast integration shear wall cracked horizontally, which showed a bending failure mode. Diagonal and 45-degree cracks appeared in integration infilled region, which showed a shearing failure mode. Hence, RC precast integration shear wall was destroyed due to a combined action of bending and shear under cyclic lateral load. Failure modes of the RC precast shear wall without infill and block masonry infilled wall were similar, most of the cracks in bottom wall legs were horizontal, a few in the middle were slant, which indicated a bending failure mode.
(2) The integration infill greatly enhanced the integrality, lateral stiffness, bearing capacity and energy-dissipating capacity while decreased the ductility for the RC precast wall. As for masonry infilled wall, lateral stiffness, bearing capacity and energy-dissipating capacity also enhanced. However, the range of the increase was relatively low because of the weak connection between concrete wall and masonry. The wall without infill and masonry infilled wall own good ductility and deformability.
(3) The FE model built in this paper, by using Multi-layer shell element and Truss element based on OpenSees, could effectively simulate RC precast fabricated shear wall with different infilled openings.
ACKNOWLEDGEMENTS
The authors gratefully acknowledge the financial support provided by The National Key Technology R&D Program of China under the Grant No. 2011BAJ10B01.
REFERENCES Atlin, S., Ersoy, U. & Tankut, T. (1992), “Hysteretic Response of Reinforced Concrete
Infilled Frames,” Journal of Structural Engineering, 118(8), 2133-2150. Canbay, E. (2001), “Contribution of Reinforced Concrete Infills to the Seismic Behavior
of Structural Systems,” Ph.D. thesis, Middle East Technical University, Ankara, Turkey.

GB 50003. (2011), “Code for Design of Masonry Structures,” Standards China, Beijing. (in Chinese)
Jiang, H.B., Zhang, H.S. and Liu, W.Q. (2011), “Anchorage Performance of Restraint Grouting-Anchoring Overlap Rebar Joint for Precast Concrete Structures,” Journal of Harbin Institute of Technology, 43(4), 28-33. (in Chinese)
JGJ 101-96. (1997), “Specification of Testing Methods for Earthquaking-Resisting Buildings,” Specifications China, Beijing. (in Chinese)
Klingner, R.E. & Bertero, V.V. (1978), “Earthquake Resistance of Infilled Frames,” Proc. of the ASCE, 104(ST6), 973-989.
Lu, X.Z. (2013), “A Multi-layer Shell Element for Shear Walls Based on OpenSEES—THUShell,”http://www.luxinzheng.net/download/OpenSEES/En_THUShell_OpenSEES.html
Saatcioglu, M. (2003), “Seismic Assessment and Rehabilitation of Existing Buildings,” Edited by Wasti, S.T. and Ozcebe, G., Nato Science Series, IV. Earth and Environmental Series, 29. 457-486.
Kent, D.C. and Park, R (1971), "Flexural members with confined concrete," Journal of the Structural Division, Proc. of the American Society of Civil Engineers, 97(ST7), 1969-1990.
Mazzoni, S., McKenna, F., Scott, M.H. and Fenves, G.L. (2004), “OpenSees Users Manual,” PEER, University of California, Berkeley.
Zhu, B.L. (1998), “Design Principles of Masonry Structures,” Tongji University Publishers, Shanghai, China. (in Chinese).