comparison of test methods on the compressive …etd.lib.metu.edu.tr/upload/12617422/index.pdf ·...
TRANSCRIPT

COMPARISON OF TEST METHODS ON THE
COMPRESSIVE STRENGTH OF FLY ASH BLENDED CEMENTS
A THESIS SUBMITTED TO
THE GRADUATE SCHOOL OF NATURAL AND APPLIED SCIENCES
OF
MIDDLE EAST TECHNICAL UNIVERSITY
BY
HASAN TUNÇ
IN PARTIAL FULFILLMENT OF THE REQUIREMENTS
FOR
THE DEGREE OF MASTER OF SCIENCE
IN
CIVIL ENGINEERING
JUNE 2014


Approval of the thesis:
COMPARISON OF TEST METHODS ON THE
COMPRESSIVE STRENGTH OF FLY ASH BLENDED CEMENTS
submitted by HASAN TUNÇ in partial fulfillment of the requirements for the degree
of Master of Science in Civil Engineering Department, Middle East Technical
University by,
Prof. Dr. Canan Özgen _____________________
Dean, Graduate School of Natural and Applied Sciences
Prof. Dr. Ahmet Cevdet Yalçıner _____________________
Head of Department, Civil Engineering
Prof. Dr. İsmail Özgür Yaman _____________________
Supervisor, Civil Engineering Dept., METU
Prof. Dr. Mustafa Tokyay _____________________
Co-Supervisor, Civil Engineering Dept., METU
Examining Committee Members:
Assoc. Prof. Dr. Sinan Turhan Erdoğan _____________________
Civil Engineering Dept., METU
Prof. Dr. İsmail Özgür Yaman _____________________
Supervisor, Civil Engineering Dept., METU
Prof. Dr. Mustafa Tokyay _____________________
Co-Supervisor, Civil Engineering Dept., METU
Asst. Prof. Dr. Çağla Meral _____________________
Civil Engineering Dept., METU
Assoc. Prof. Dr. Mustafa Şahmaran _____________________
Civil Engineering Dept., Gazi University
Date:
, 2010
19.06.2014

iv
I hereby declare that all information in this document has been obtained and
presented in accordance with academic rules and ethical conduct. I also declare
that, as required by these rules and conduct, I have fully cited and referenced
all material and results that are not original to this work.
Name, Last name: Hasan Tunç
Signature:
v
ABSTRACT
COMPARISON OF TEST METHODS ON THE
COMPRESSIVE STRENGTH OF FLY ASH BLENDED CEMENTS
Tunç, Hasan
M.Sc., Department of Civil Engineering
Supervisor: Prof. Dr. İsmail ÖzgürYaman
Co-Supervisor: Prof. Dr. Mustafa Tokyay
June 2014, 54 pages
In Turkey the compressive strength of cements are determined according to TS EN
196-1. That standard suggests the use of a constant water-cement ratio of 0.50 in
preparation of mortar specimens for all types of cements. On the other hand, in USA
cement producers use ASTM C 109 to determine the compressive strength of
cements, which is based on a constant consistency of cement mortars for blended
cements only. The main difference of these methods is the needed amount of water to
produce cement mortar.
When a constant w/c is used to prepare mortar specimens as specified by TS EN 196-
1, especially for certain blended cements insufficient compaction may occur and
compressive strength may not be obtained in a standard repeatable manner. On the
other hand, when ASTM C 109 is used, higher amount of water may be used to
obtain a constant consistency and the compressive strength can be lower. Therefore,
in this study, unlike EN 196-1 and ASTM C 109, a constant water/cementitious by
volume method is suggested to prepare mortar specimens to determine their strength.

vi
The aim of this thesis is to demonstrate the variabilities that can be confronted with
the determination of compressive strength of fly ash blended cements. For this
purpose, portlant cement clinker was replaced with fly ash (FA) at 20 %, 35 %, 55
% replacement levels, by using three different methods which are acquired by the
constant water/cementitious by mass (EN 196-1), constant flow (ASTM) and
constant water/cementitious by volume methods,7-day and 28-day compressive
strength of mortars were obtained. Then, coefficient of variation (CoV) of the results
obtained by three different methods were compared.
After the experimental study, it was observed that a less deviation in the compressive
strength results were obtained by constant water/cementitious by volume method and
ASTM C109 method. However, for the constant water/cementitious by mass method
(EN 196-1), higher deviance in the compressive strength results were obtained. As a
result, it was determined that the constant water/cementitious by mass method (EN
196-1) is not proper for fly ash blended cements.
Keywords: Fly Ash, Compressive Strength, Coefficient of Variation, Mortar

vii
ÖZ
TEST YÖNTEMLERİNİN UÇUCU KÜLLÜ ÇİMENTOLARIN
BASINÇ DAYANIMLARI ÜZERİNDEN KARŞILAŞTIRILMASI
Tunç, Hasan
Yüksek Lisans, İnşaat Mühendisliği Bölümü
Tez Yöneticisi: Prof. Dr. İsmail Özgür Yaman
Ortak Tez Yöneticisi: Prof. Dr. Mustafa Tokyay
Haziran 2014, 54 sayfa
Türkiye’de basınç dayanımları TS EN 196-1 göre belirlenmektedir. Bu standard
bütün çimento tiplerinin hazırlanması için sabit 0,50 su-çimento oranını
önermektedir. Diğer taraftan Amerika çimento üreticileri basınç dayanımlarının
belirlenmesi için sabit kıvam değerini esas alan ASTM C 109 kullanmaktadır. Bu
methodlar arasındaki ana fark harçların hazırlanmasında gerekli olan su miktarıdır.
Katkılı çimento harcı üretmek için TS EN 196-1 kullanıldığı zaman yetersiz
sıkıştırma problemleri oluşabilir ve basınç dayanımları standardta istenilen şekilde
elde edilemeyebilir. Diğer taraftan ASTM C 109 yöntemi kullanıldığında sabit bir
kıvam elde etmek için yüksek su miktarı kullanılabilir ve bu durum basınç
dayanımının azalmasına neden olabilir. Belirtilen sebeplerden dolayı, bu tezde TS
EN 196-1 ve ASTM C 109 yöntemlerinden farklı olarak dayanım numunelerinin
hazırlanması için hacimsel sabit su-çimento oranı önerilmektedir.
Bu tezin amacı uçucu küllü katkılı çimentoların basınç dayanımlarının ölçümünde
karşılaşılabilen değişkenlikleri göstermektir. Bu amaç için uçucu kül içeren katkılı
çimentolar kullanılmıştır. % 20, % 35, % 55 uçucu kül içeren katkılı çimentolar
viii
hazırlanarak kütlece sabit su/bağlayıcı oranı (TS EN 196-1), sabit yayılma değeri
(ASTM) ve hacimce sabit su/bağlayıcı oranı olarak 3 farklı yönteme göre 7 ve 28
günlük basınç dayanımları elde edilmiştir. Daha sonra, üç yöntemden elde edilen
basınç dayanım sonuçlarının varyasyon katsayıları karşılaştırılmıştır.
Deneysel çalışmalar sonrasında, hacimsel sabit su-çimento oranı ve ASTM C 109
yöntemiyle elde edilen harçların basınç dayanım sonuçlarındaki sapmalar daha düşük
olarak gözlemlenmiştir. EN 196-1 yöntemleriyle elde edilen harçların basınç
dayanım sonuçlarındaki sapmalar daha fazladır. Sonuç olarak katkılı çimentolar için
kütlece sabit su/bağlayıcı oranı yönteminin (TS EN 196-1) kullanılmasının uygun
olmadığı sonucuna varılmıştır.
Anahtar Sözcükler: Uçucu Kül, Çimento Basınç Dayanımı, Varyasyon Katsayısı,
Harç

ix
To My Family

x
ACKNOWLEDGMENTS
I would like to express my sincere gratitude to my supervisor Prof. Dr. İsmail Özgür
Yaman and my co-supervisor Prof. Dr. Mustafa Tokyay for their guidance and
suggestions and support throughout this research.
I appreciate the help provided by Abdullah Usame TOKGÖZ especially for his
assistance and comments.
Sincere thanks are extended to TSE for allowing laboratory facilities to use and
TCMA for supplying all the cements that I used throughout my thesis study.
I also would like to thank to my colleague and my friend Erhan TETIK in TSE for
his enthusiastic support during the thesis.
Finally; I am grateful to my parents, especially my mother, for their patience,
encouragement and support.
xi
TABLE OF CONTENTS
ABSTRACT ................................................................................................................. v
ÖZ .............................................................................................................................. vii
ACKNOWLEDGMENTS ........................................................................................... x
TABLE OF CONTENTS ............................................................................................ xi
LIST OF TABLES .................................................................................................... xiii
LIST OF FIGURES .................................................................................................. xiv
LIST OF ABBREVIATIONS ................................................................................... xvi
CHAPTERS ................................................................................................................. 1
1.INTRODUCTION .................................................................................................... 1
1.1. General .............................................................................................................. 1
1.2. Objective and Scope of the Thesis .................................................................... 3
2.THEORETICAL CONSIDERATIONS ................................................................... 5
2.1. Production of Portland Cement ......................................................................... 5
2.2 Main Constituents of Cement ............................................................................. 6
2.2.1 Fly Ash (FA) ................................................................................................ 7
2.2.1.1 Class F Fly Ash ......................................................................................... 9
2.2.1.2 Class C Fly Ash ...................................................................................... 10
2.2.1.3 Fly Ash Chemistry .................................................................................. 10
2.2.1.4 Effects of FA on Concrete Properties ..................................................... 11
3.EXPERIMENTAL STUDY .................................................................................... 15
3.1 General ............................................................................................................. 15
3.2 Materials ........................................................................................................... 15
3.3 Mixture Preparation of Mortars ........................................................................ 19
3.4 Compressive Strength Test Procedure ............................................................. 22
xii
3.5 Comparison of Test Methods ........................................................................... 23
4.RESULTS AND DISCUSSIONS ........................................................................... 25
4.1 General .............................................................................................................. 25
4.2 Compressive Strength Test Results .................................................................. 25
4.2.1 20% Fly Ash-Blended Cement (FA20) ...................................................... 25
4.2.2 35% Fly Ash-Blended Cement (FA35) ...................................................... 33
4.2.3 55% Fly Ash-Blended Cement (FA55) ...................................................... 40
4.3 Comparison of the Compressive Strength Test Results for FA20, FA35 and FA
55 Blended-Cements............................................................................................... 47
4.4 Comparison of Coefficient of Variance for Different Test Methods ............... 48
5.SUMMARY AND CONCLUSIONS ...................................................................... 51
5.1 General .............................................................................................................. 51
5.2 Recommendations for Further Studies ............................................................. 52
REFERENCES ........................................................................................................... 53

xiii
LIST OF TABLES
TABLES
Table 1 Percentage of Cement Composition ................................................................ 7
Table 2 Typical Chemical Composition of Fly Ash .................................................... 9
Table 3 Chemical Composition of the Materials ....................................................... 16
Table 4 Proportions of Ingredients .......................................................................... 16
Table 5 Ingredients Used In Mixture of the Cement Mortars .................................... 19
Table 6 Specific Gravity of Ingredients ..................................................................... 21
Table 7 Water Content for C-Volume Method .......................................................... 22
Table 8 Comparison of ASTM C 109 & EN 196-1 ................................................... 23
Table 9 Compressive Strength Test Results of FA 20 ............................................... 26
Table 10 Compressive Strength Test Results of FA 35 ............................................. 34
Table 11 Compressive Strength Test Results of FA 55 ............................................. 41

xiv
LIST OF FIGURES
FIGURES
Figure 1 Yearly Cement Production in Turkey [1] ...................................................... 1
Figure 2 Process of Fly Ash Production [5] ................................................................. 8
Figure 3 Effect of fly ash fineness on water demand for equal slump [14] ............... 12
Figure 4 Effect of fly ash on compressive strength development[15] ....................... 13
Figure 5 Typical Class F fly ash sample as viewed via SEM at 2000 x magnification
.................................................................................................................................... 17
Figure 6 SEM of fly ashes used in study at 1250 x magnification ............................. 18
Figure 7 W/C Ratio For Fly Ash-Blended Cements .................................................. 20
Figure 8 Max- Min Compressive Strength Test Results of FA 20. ............................ 27
Figure 9 Probability Distribution Function (pdf) of FA 20-Blended Cements .......... 29
Figure 10 Relation Between Strength and Water/Cement Ratio [1]. ......................... 30
Figure 11 Compressive Strength Test Results of FA 20-Blended Cement ................ 31
Figure 12 The Consistency of FA 20 Blended Cement Mortars ................................ 32
Figure 13 Coefficient of variance (CoV) of Compressive Strength Test Results for
FA 20-Blended Cement .............................................................................................. 33
Figure 14 Max- Min Compressive Strength Test Results of FA 35........................... 35
Figure 15 Probability Distribution Function (pdf) of FA 35-Blended Cements ........ 37
Figure 16 Compressive Strength Test Results of FA 35-Blended Cement ................ 38
Figure 17 The Consistency of FA 35 Blended Cement Mortars ................................ 39
Figure 18 Coefficient of variance (CoV) of Compressive Strength Test Results for
FA 35-Blended Cement .............................................................................................. 40
Figure 19 Max- Min Compressive Strength Test Results of FA 55........................... 42
Figure 20 Probability Distribution Function (pdf) of FA 55-Blended Cements ........ 44
Figure 21 Compressive Strength Test Results of FA 55-Blended Cement ................ 45
Figure 22 The Consistency of FA 55 Blended Cement Mortars ................................ 46

xv
Figure 23 Coefficient of variance (CoV) of Compressive Strength Test Results for
FA 55-Blended Cement.............................................................................................. 47
Figure 24 Compressive Strength Test Results of Fly Ash-Blended Cements ........... 48
Figure 25 Coefficient of variance (CoV) of Compressive Strength Test Results for
Fly ash-Blended Cements .......................................................................................... 49

xvi
LIST OF ABBREVIATIONS
ASTM : American Society for Testing Materials
C-Flow : Constant Flow
C-Mass : Constant Water/Cementitious by Mass
C-Volume : Constant Water/Cementitious by Volume
CoV : Coefficient of Variation
EN : European Norm
FA 20 : 20 % Fly Ash-Blended Cement
FA 35 : 35 % Fly Ash -Blended Cement
FA 55 : 55 % Fly Ash -Blended Cement
METU : Middle East Technical University
pdf : Probability Distribution Function
SEM : Scanning Electron Microscope
TCMA : Turkish Cement Manufacturers’ Association
TS : Turkish Standard
TSE : Turkish Standard Institute
1
CHAPTER 1
INTRODUCTION
1.1. General
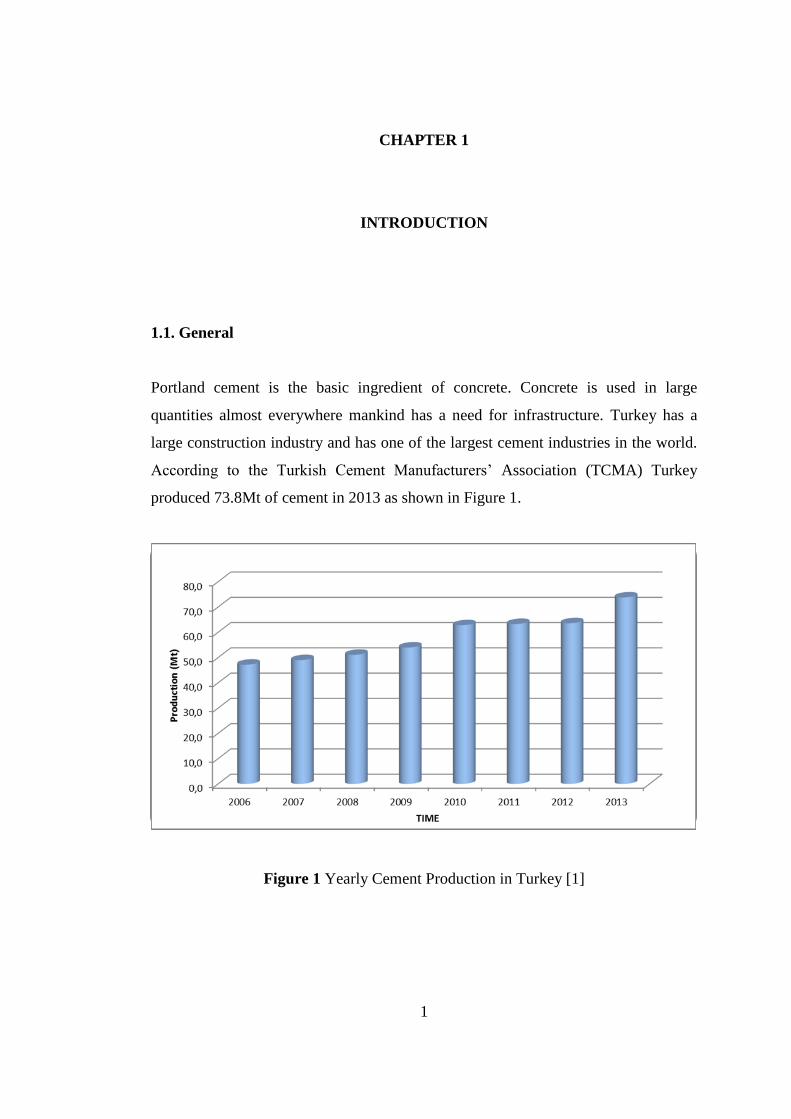
Portland cement is the basic ingredient of concrete. Concrete is used in large
quantities almost everywhere mankind has a need for infrastructure. Turkey has a
large construction industry and has one of the largest cement industries in the world.
According to the Turkish Cement Manufacturers’ Association (TCMA) Turkey
produced 73.8Mt of cement in 2013 as shown in Figure 1.
Figure 1 Yearly Cement Production in Turkey [1]
CEM I -Type Cement; 2006; 22
CEM I -Type Cement; 2007; 23
CEM I -Type Cement; 2008; 25
CEM I -Type Cement; 2009; 27
CEM I -Type Cement; 2010; 32
CEM I -Type Cement; 2011; 33
CEM I -Type Cement; 2012; 32
Blended Cement; 2006; 25
Blended Cement; 2007; 26
Blended Cement; 2008; 26
Blended Cement; 2009; 27
Blended Cement; 2010; 31
Blended Cement; 2011; 30
Blended Cement; 2012; 32
Ce
me
nt
Pro
du
ctio
n (
Mt)
YEARS
Blended Cement
CEM I -Type Cement
2
The cement production is an energy intensive industry. Its energy cost represents a
significant part of total production costs. Generally, natural resources are used to
produce cement. In 2011, the European cement producers consumed an energy
equivalent of about 18 Mt of coal, fossil fuel, for the production of 196 Mt of cement
[2].
The main constituent of cement is clinker. The clinker granulating stage uses
approximately one-third of the energy needed to manufacture one ton of cement [3].
Since these stages consume excessive energy based on natural resources, the cement
industry not only needs to care about the environmental sustainability but also to
lower the cost of its product.
In order to produce environmentally friendly products, cement producers
manufacture blended cements to decrease the clinker content. In blended cement
production, part of the clinker is replaced with alternative constituents such as fly
ash, natural pozzolan, etc [4].
In Turkey the compressive strength of cements are determined by TS EN 196-1, that
is based on constant water/cementitious ratio for all types of cements. On the other
hand, USA cement producers use ASTM C 109 standard to determine the
compressive strength of cements, which is based on constant flow for blended
cement. The main difference between these two methods is the amount of water to
produce cement mortar.

3
1.2. Objective and Scope of the Thesis
The aim of this research is to show the variabilities that can be confronted with the
determination of compressive strength of blended cements. For this purpose, fly ash
(FA) blended cements were used. Portland cement clinker was replaced with fly ash
(FA) at 20 %, 35 %, 55 % replacement levels and cement morters were prepaired by
three different methods. The water content of each mortar was changed by using
different amounts of water as follows;
Constant water/cementitious by mass (EN 196-1)
Constant flow (ASTM),
Constant water/cementitious by volume
Then, coefficient of variation of the results obtained by three different methods were
compared.
This study consists of five chapters:
In Chapter 2, role of the cement in concrete is briefly mentioned. Then, according
to TS EN 197-1 cement types are defined. Then general classifications. Moreover,
fly ash used in the cement production and effects of fly ash on the properties of
cement are briefly explained. Finally, the quality control applications for cements are
outlined and two different compressive strength test methods (ASTM C 109 and EN
196-1) are compared.
In Chapter 3, the properties of materials used in the study and the details of mixture
preparation are given. Then evaluation procedure of strength test data was presented.

4
In Chapter 4, the compressive strength test results of cement types FA20, FA35,
FA55 are presented. Also, results are statistically analyzed and evaluated for all
methods.
In Chapter 5, the conclusions and recommendations for further studies are provided.

5
CHAPTER 2
THEORETICAL CONSIDERATIONS
2.1. Production of Portland Cement
The clinker is main component of cement. Clinker is produced from raw materials,
such as limestone and clay, which are crushed and fed into a rotary kiln. The clinker
burning takes place at a material temperature of 1450°C which is needed to form the
new compounds. Clinker mainly consists of calcium, silicium, aluminium and iron-
oxides. The next step is handled in a cement grinding mill. Gypsum and other
additional materials (such as slag, fly ash, natural pozzolanas, etc.) are added to the
clinker. All constituents are ground leading to a fine and homogenous powder called
cement [5].
In Turkey and European zone, Harmonized EN 197-1 is used, which has 27 different
main types of cement according to its chemical composition. Specifically, Turkish
harmonized standard (TS EN 197-1) not only contains portland cements but also
includes blended cements [6]. However, in USA there are three different types of
standards which are ASTM C 150 for Portland cements, ASTM C 595 for blended
cements and ASTM C 1157 for hydraulic cements.
6
2.2 Main Constituents of Cement
Cement and concrete producers have to evolve in the terms of the environment
within a sustainable development perspective, which means that more mineral
components will be blended with clinker and water/cementitious ratio will be
lowered if they want to increase the life cycle of concrete structures and lengthen as
much as possible the use of hydraulic binders and aggregates [2].
As the cement types alter, the percentage of these main constituents in cements
change. Composition of main constituents of the cements in TS EN 197-1 is given in
Table 1.

7
Table 1 Percentage of Cement Composition [6].
2.2.1 Fly Ash (FA)
Fly ash is produced in furnaces of coal burning power plants. Fly ashes are very fine
predominantly spherical glassy particles collected in the dust collection systems from
the exhaust gases of fossil fuel powder [3].
Specifically, in the power plants, coal is first pulverized in grinding mills before
being fed into the burning zone of the boiler. In this zone the coal combusts
producing heat with temperatures reaching approximately 1500°C.
8
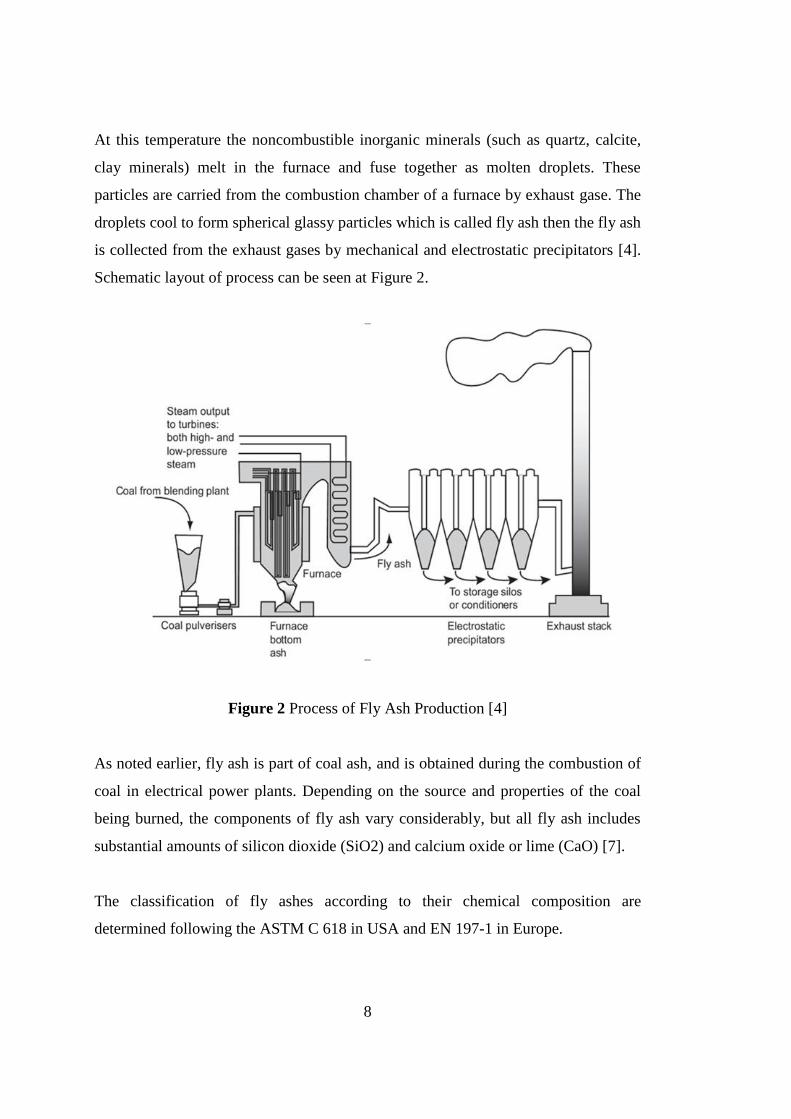
At this temperature the noncombustible inorganic minerals (such as quartz, calcite,
clay minerals) melt in the furnace and fuse together as molten droplets. These
particles are carried from the combustion chamber of a furnace by exhaust gase. The
droplets cool to form spherical glassy particles which is called fly ash then the fly ash
is collected from the exhaust gases by mechanical and electrostatic precipitators [4].
Schematic layout of process can be seen at Figure 2.
Figure 2 Process of Fly Ash Production [4]
As noted earlier, fly ash is part of coal ash, and is obtained during the combustion of
coal in electrical power plants. Depending on the source and properties of the coal
being burned, the components of fly ash vary considerably, but all fly ash includes
substantial amounts of silicon dioxide (SiO2) and calcium oxide or lime (CaO) [7].
The classification of fly ashes according to their chemical composition are
determined following the ASTM C 618 in USA and EN 197-1 in Europe.

9
Two classes of fly ash are defined by ASTM C 618: Class F fly and Class C fly
ashes. The main difference between these classes is the amount of calcium, silica,
alumina, and iron content in the ash [8]. Table 2 shows the chemical composition of
fly ash classes. On the other hand, EN 197-1 defines fly ashes into two groups;
namely, siliceous and calcareous fly ashes, depending upon the required fly ash
content [6].
Table 2 Typical Chemical Composition of Fly Ash [8]
Percent of Composition
Chemical
Composition
Typical
Class C
Typical
Class F
Typical
Portland
Cement
CaO 24 9 64
SiO2 40 55 23
Al2O3 17 26 4
Fe2O3 5 7 2
MgO 5 2 2
SO3 3 1 2
In addition, color is one of the important physical properties of fly ash in terms of
estimating the lime content qualitatively. It is suggested that lighter color indicate the
presence of high calcium oxide and darker colors suggest high organic content [9].
2.2.1.1 Class F Fly Ash
Class F fly ash is normally produced from burning anthracite or bituminous coal.
Class F fly ashes meet the chemical requirement Equation 2.1. This type has low-
calcium ( 10 % CaO ). This class of fly ash has pozzolanic properties [8, 10].
10
SiO2 + Al2O3 + Fe2O3 ≥ 70 % (2. 1)
2.2.1.2 Class C Fly Ash
Class C Fly ash is normally produced from lignite or sub-bituminous coal. This class
of fly ashes meet the chemical requirement Equation 2.2. Class C fly ashes contain
lime contents higher than 10% ( 10 % CaO). Moreover, this type of fly ash, in
addition to having pozzolanic properties, also has some cementitious properties [8,
10].
SiO2 + Al2O3 + Fe2O3 ≥ 50 % (2. 2)
2.2.1.3 Fly Ash Chemistry
Chemical constituents of fly ash are generally reletad on the chemical composition of
the coal. However, fly ash that are produced from the same source and which have
very similar chemical composition, can have significantly different ash mineralogies
depending on the coal combustion technology used. When the maximum temperature
of the combustion process is approximately 1200o C and the cooling time is short, the
ash produced is mostly glassy phase material. Where boiler design or operation
allows a more gradual cooling of the ash particles, crystalline phase calcium
compounds are formed [11].
The factors that influence the mineralogy of a fly ash are [12]:
Chemical composition of the coal.
Coal combustion process including coal pulvarization, combustion, flue gas
clean up, and fly ash collection operations.
Additives used, including oil additives for flame stabilization and corrosion
control additives.
11
2.2.1.4 Effects of FA on Concrete Properties
As mentioned early fly ash is a pozzolanic material with a finely amorphous siliceous
or siliceous and aluminous material with varying amounts of calcium. The material
reacts with the calcium hydroxide released by the hydration of portland cement to
produce various calcium-silicate hydrates (C-S-H) and calcium-aluminate hydrates.
2.2.1.4.1 Workability and Water Demand
The term workability refers to the ease with which fresh concrete can be mixed,
placed, molded, consolidated and finished. A well-proportioned fly ash concrete
mixture improves workability when compared with a portland cement concrete of the
same slump [13], which means fly ash concrete flows and consolidates better than a
conventional portland cement concrete when vibrated.
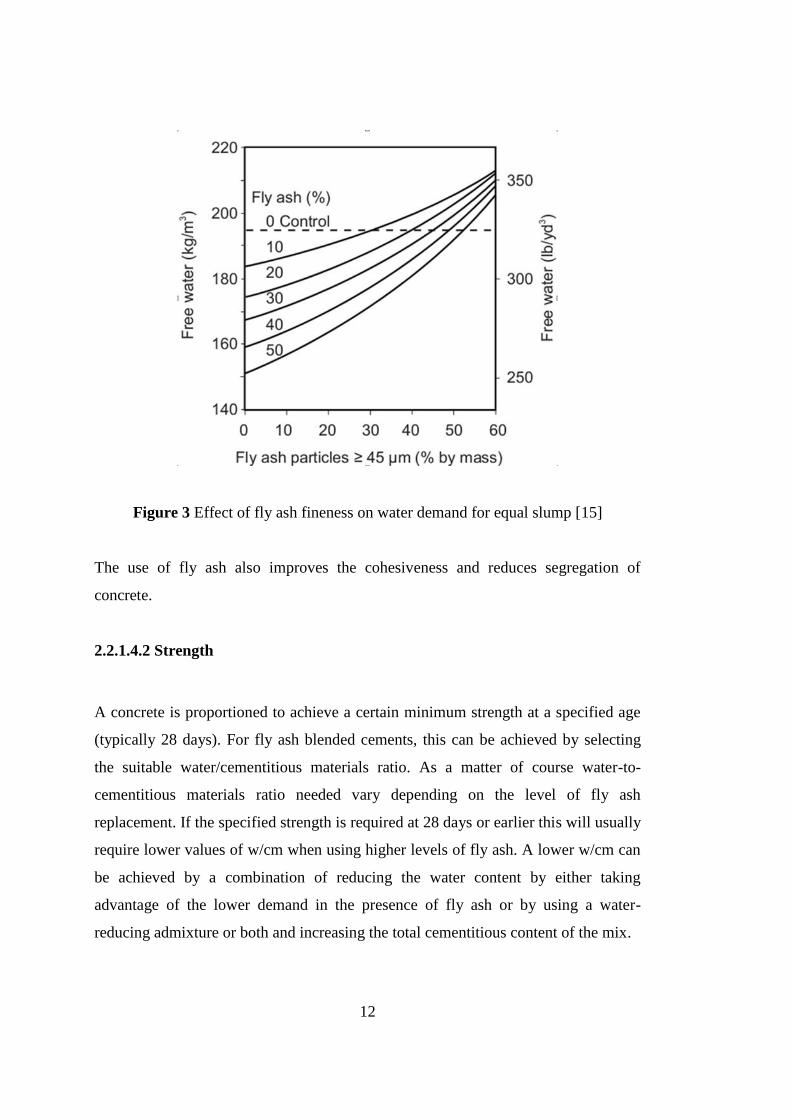
The use of fly ash with a high fineness and low carbon content reduces the water
demand of concrete, thus the use of fly ash permit the concrete to be produced at
lower water content when compared to a portland cement concrete of the same
workability as depicted in Figures 3. Despite the fact that the same amount of water
reduction varies generally with the nature of the fly ash and other parameters of the
mixture. It is stated by Thomas (2013) that each 10% of fly ash approximately allow
a water reduction of at least 3% [14].
12
Figure 3 Effect of fly ash fineness on water demand for equal slump [15]
The use of fly ash also improves the cohesiveness and reduces segregation of
concrete.
2.2.1.4.2 Strength
A concrete is proportioned to achieve a certain minimum strength at a specified age
(typically 28 days). For fly ash blended cements, this can be achieved by selecting
the suitable water/cementitious materials ratio. As a matter of course water-to-
cementitious materials ratio needed vary depending on the level of fly ash
replacement. If the specified strength is required at 28 days or earlier this will usually
require lower values of w/cm when using higher levels of fly ash. A lower w/cm can
be achieved by a combination of reducing the water content by either taking
advantage of the lower demand in the presence of fly ash or by using a water-
reducing admixture or both and increasing the total cementitious content of the mix.
13
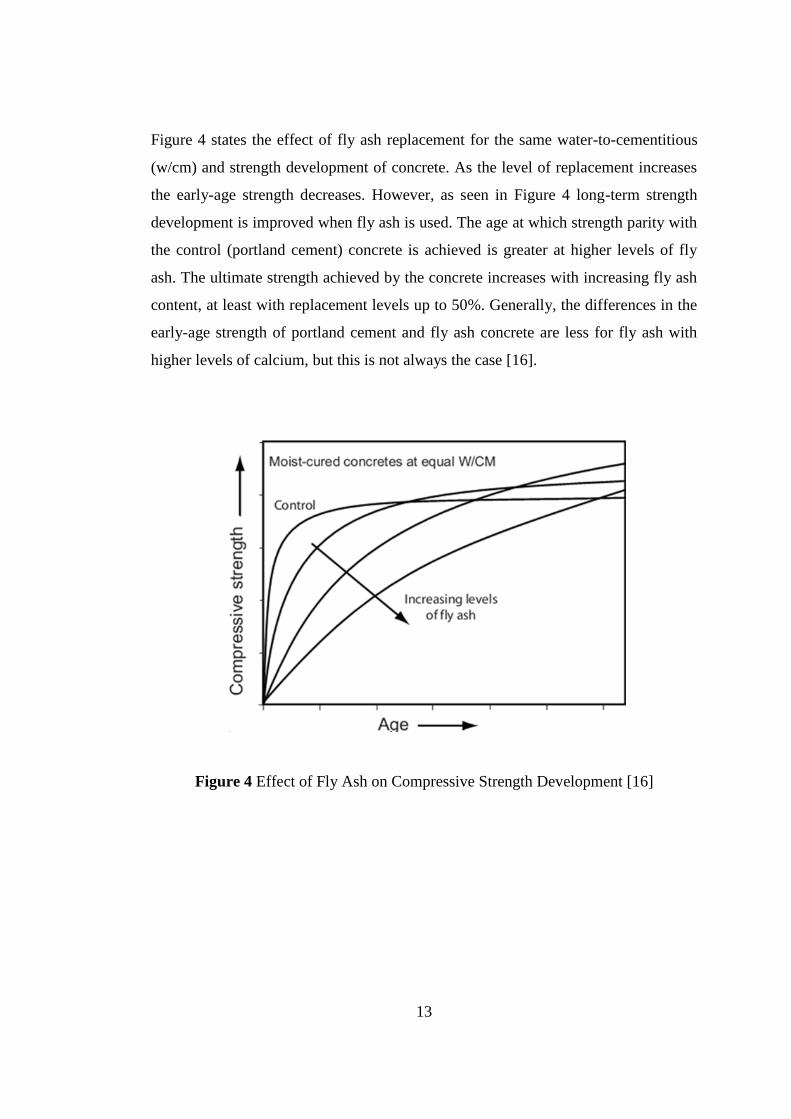
Figure 4 states the effect of fly ash replacement for the same water-to-cementitious
(w/cm) and strength development of concrete. As the level of replacement increases
the early-age strength decreases. However, as seen in Figure 4 long-term strength
development is improved when fly ash is used. The age at which strength parity with
the control (portland cement) concrete is achieved is greater at higher levels of fly
ash. The ultimate strength achieved by the concrete increases with increasing fly ash
content, at least with replacement levels up to 50%. Generally, the differences in the
early-age strength of portland cement and fly ash concrete are less for fly ash with
higher levels of calcium, but this is not always the case [16].
Figure 4 Effect of Fly Ash on Compressive Strength Development [16]

14
15
CHAPTER 3
EXPERIMENTAL STUDY
3.1 General
In the preparation of the blended cements, portland cement clinker, fly ash and
gypsum are used. Then portland cement clinker was replaced with fly ash at 20 %, 35
%, 55 % replacement levels, namely describing CEM II and CEM IV in EN 197. The
blended cements used were prepared by TCMA-R&D laboratory and in order to
perform the compressive strength test of fly ash-cements the Construction Materials
Laboratory of Turkish Standard Institute (TSE) was chosen. Then, compressive
strength of mortars for each fly ash-cement types were obtained by the constant
water/cementitious by mass (EN 196-1), constant flow (ASTM) and constant
water/cementitious by volume methods.
3.2 Materials
The clinker that used in this study is obtained from Oyak Bolu Cement Plant. Fly ash
was taken from Seyitömer power plant. In this research fly ash and clinker were
separately ground. The chemical composition of the materials which were used in
this study is presented in Table 3. The fineness of the ingredients which are clinker,
gypsum and mineral additives (FA) were selected as 3500 ± 200 cm2/g, 4000 ± 200
cm2/g and 3850 ± 200 cm
2/g respectively. Ingredients which were used in mixture
were stated in Table 4. Amount of gypsum was selected as 4 % for 20 % and 35 %
fly ash cements and 3 % for 55 % fly ash cements. The blended cements used in
study were labeled as FA 20, FA 35, FA 55 according to additive amounts.

16
All of the cements and CEN Standard Sand conforming TS EN 196-1 were obtained
by TCMA-R&D laboratory.
Table 3 Chemical Composition of the Materials
Chemical
Composition
(%)
Fly Ash
(FA)
Clinker
(C)
Gypsum
(G)
SiO2 54.30 20.43 2.26
Al2O3 16.80 5.73 0.08
Fe2O3 10.50 3.25 0.28
CaO 7.70 65.50 32.16
MgO 4.50 2.67 0.68
SO3 1.20 0.42 42.68
Na2O 0.50 0.37 0.34
K2O 1.70 0.58 0.12
Cl- - 0.0098 -
Loss on Ignition 2.30 1.02 21.54
Table 4 Proportions of Ingredients
Label Mix Proportions, by mass
Clinker
(C)
Gypsum
(G)
Fly Ash
(FA)
FA20 80 4 20
FA35 65 4 35
FA55 45 3 55

17
Generally, the particles of fly ash are mostly glassy spherical solids, range in size
from 1 to 100 microns (0.1mm). The average size is about 20 microns, which is
similar to portland cement average particle size [17]. ]. When fly ash with spherical
shape is added into the concrete, the workability of the mix is improved during
pouring. This is due to the spherical shape of its particles. Fly ash in the mix allows
concrete to flow and pump better than 100% Portland cement concrete. Moreover,
the improved workability can be achieved with less water. The amount of water in
the mix is decreased in direct proportion to the amount of fly ash added to the mix
[18]. Figure 5 shows the surface morphology of typical fly ash particles.
Figure 5 Typical Class F fly ash sample as viewed via SEM at 2000x magnification
[19]
The particle morphology (shape) and the size distribution of fly ash are related on
coal origin, the state of combustion of the coal, pulverization conditions (temperature
and oxygen level), the uniformity of the combustion process and the type of powder
collection system [20].
18
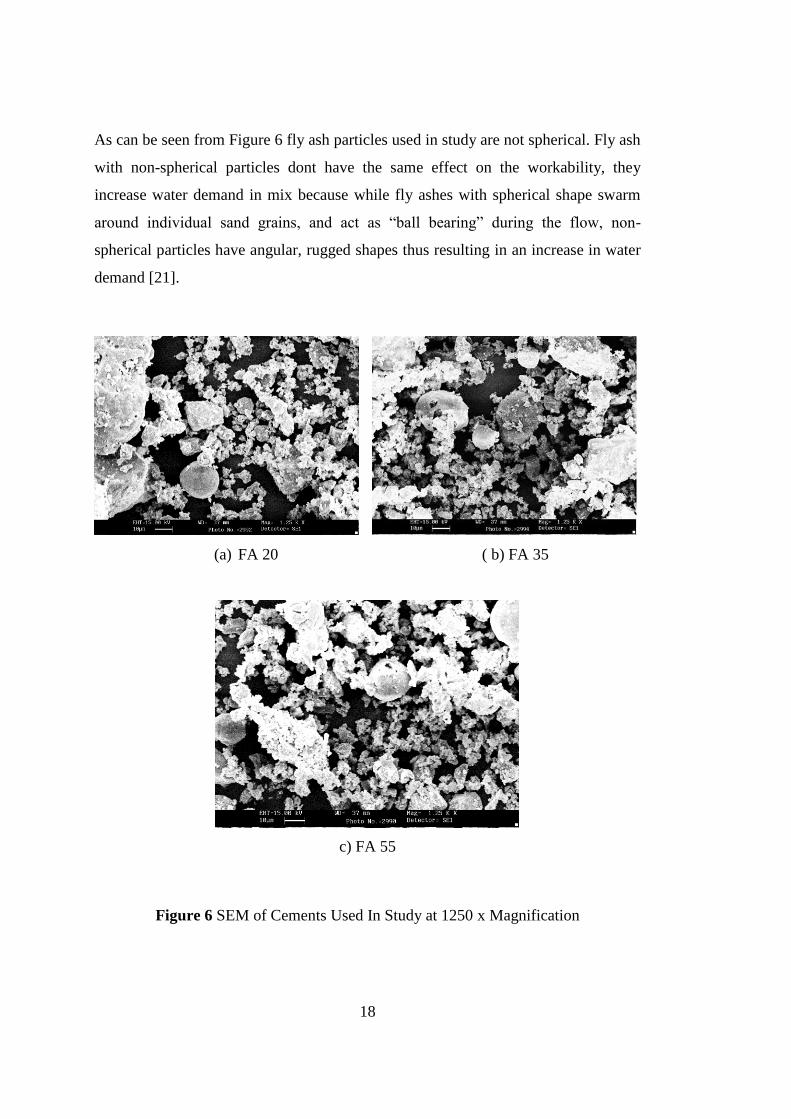
As can be seen from Figure 6 fly ash particles used in study are not spherical. Fly ash
with non-spherical particles dont have the same effect on the workability, they
increase water demand in mix because while fly ashes with spherical shape swarm
around individual sand grains, and act as “ball bearing” during the flow, non-
spherical particles have angular, rugged shapes thus resulting in an increase in water
demand [21].
(a) FA 20 ( b) FA 35
c) FA 55
Figure 6 SEM of Cements Used In Study at 1250 x Magnification
19
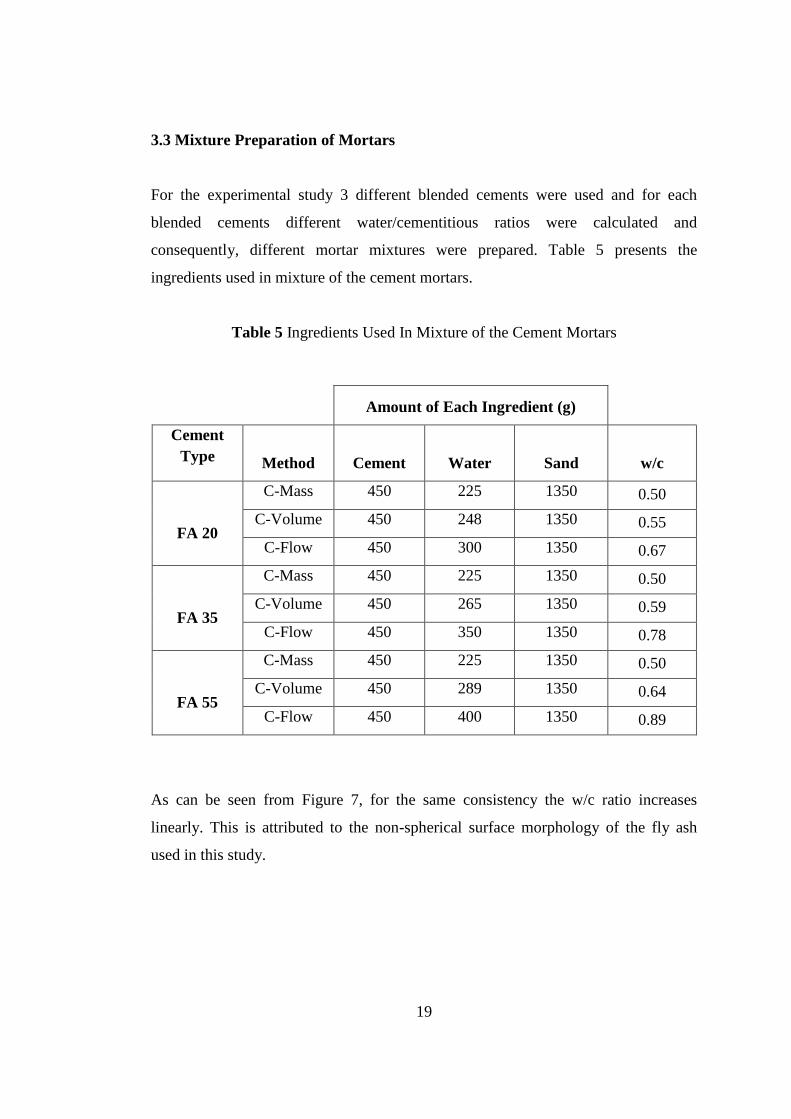
3.3 Mixture Preparation of Mortars
For the experimental study 3 different blended cements were used and for each
blended cements different water/cementitious ratios were calculated and
consequently, different mortar mixtures were prepared. Table 5 presents the
ingredients used in mixture of the cement mortars.
Table 5 Ingredients Used In Mixture of the Cement Mortars
Amount of Each Ingredient (g)
Cement
Type Method Cement Water Sand w/c
FA 20
C-Mass 450 225 1350 0.50
C-Volume 450 248 1350 0.55
C-Flow 450 300 1350 0.67
FA 35
C-Mass 450 225 1350 0.50
C-Volume 450 265 1350 0.59
C-Flow 450 350 1350 0.78
FA 55
C-Mass 450 225 1350 0.50
C-Volume 450 289 1350 0.64
C-Flow 450 400 1350 0.89
As can be seen from Figure 7, for the same consistency the w/c ratio increases
linearly. This is attributed to the non-spherical surface morphology of the fly ash
used in this study.
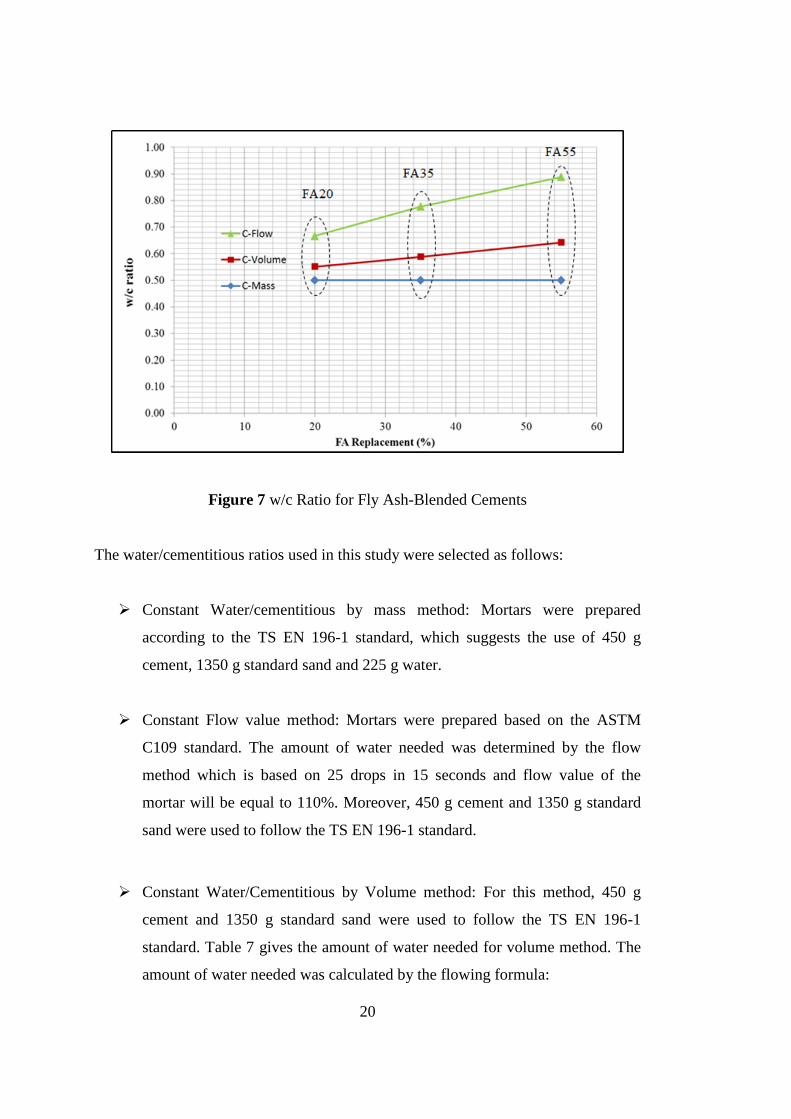
20
Figure 7 w/c Ratio for Fly Ash-Blended Cements
The water/cementitious ratios used in this study were selected as follows:
Constant Water/cementitious by mass method: Mortars were prepared
according to the TS EN 196-1 standard, which suggests the use of 450 g
cement, 1350 g standard sand and 225 g water.
Constant Flow value method: Mortars were prepared based on the ASTM
C109 standard. The amount of water needed was determined by the flow
method which is based on 25 drops in 15 seconds and flow value of the
mortar will be equal to 110%. Moreover, 450 g cement and 1350 g standard
sand were used to follow the TS EN 196-1 standard.
Constant Water/Cementitious by Volume method: For this method, 450 g
cement and 1350 g standard sand were used to follow the TS EN 196-1
standard. Table 7 gives the amount of water needed for volume method. The
amount of water needed was calculated by the flowing formula:

21
Volume Equivalence Formula (3. 1)
Where,
w: Water content (by mass)
c: Cement content (by mass)
p: Pozzolan content (by mass)
Gp: Specific gravity of pozzolan
Gc: Specific gravity of cement
Fw: Pozzolan/total binder (by mass)
Fv: Pozzolan/total binder (by volume)
In the formula, specific gravity of pozzolan and cement was given in Table 6.
Table 6 Specific Gravity of Ingredients
Clinker + Gypsum Fly ash
3.19 2.09

22
Table 7 Water Content for C-Volume Method
Water Method
% of Ingredients
Cement
Type
Clinker +
Gypsum Fly ash
Fw Fv w/(c+p) water
(g) C 105.0 0.0
FA20 84.0 20.0 0.19 0.27 0.55 248
FA35 68.3 35.0 0.34 0.44 0.59 265
FA55 47.3 55.0 0.54 0.64 0.64 289
3.4 Compressive Strength Test Procedure
In order to obtain compressive strength test results from three different test method
three batches of cement mortar were used for each test method and for each batch
three prismatic specimens were prepared. Therefore, for each test method total of 9
specimens were used. The compressive strength results were determined from two
measurements for 1 specimen, consequently a total of 18 compressive strength
results were obtained for each test method.
In order to determine compressive strength test results prismatic specimens of
40x40x1600 mm were used. The calculation of compressive strength was achieved
by the flowing formula:
Where, σ is the Compressive strength [N/mm2], F is the maximum force applied [N]
and A is the area [mm2] which is equal to 1600 mm
2 .
23
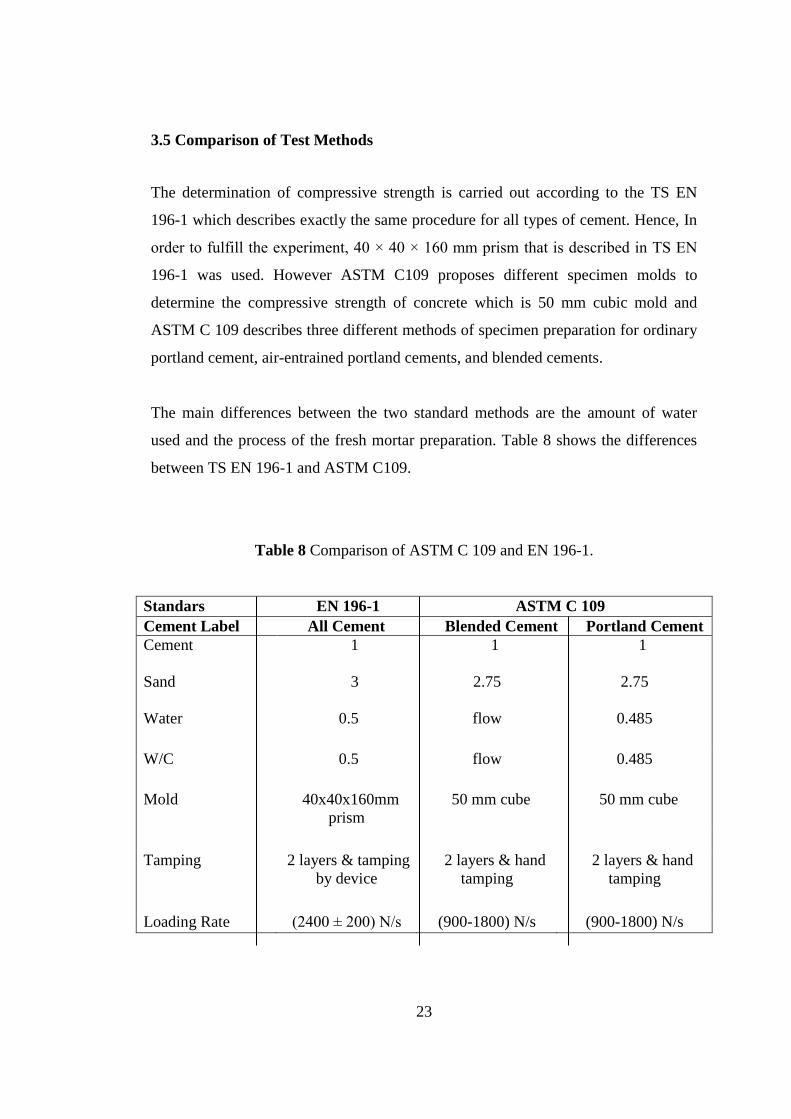
3.5 Comparison of Test Methods
The determination of compressive strength is carried out according to the TS EN
196-1 which describes exactly the same procedure for all types of cement. Hence, In
order to fulfill the experiment, 40 × 40 × 160 mm prism that is described in TS EN
196-1 was used. However ASTM C109 proposes different specimen molds to
determine the compressive strength of concrete which is 50 mm cubic mold and
ASTM C 109 describes three different methods of specimen preparation for ordinary
portland cement, air-entrained portland cements, and blended cements.
The main differences between the two standard methods are the amount of water
used and the process of the fresh mortar preparation. Table 8 shows the differences
between TS EN 196-1 and ASTM C109.
Table 8 Comparison of ASTM C 109 and EN 196-1.
Standars EN 196-1 ASTM C 109
Cement Label All Cement Blended Cement Portland Cement
Cement
Sand
1
3
1
2.75
1
2.75
Water 0.5 flow
0.485
W/C 0.5 flow
0.485
Mold 40x40x160mm
prism
50 mm cube 50 mm cube
Tamping 2 layers & tamping
by device
2 layers & hand
tamping
2 layers & hand
tamping
Loading Rate (2400 ± 200) N/s (900-1800) N/s (900-1800) N/s

24

25
CHAPTER 4
RESULTS AND DISCUSSIONS
4.1 General
In this study, three different types of blended cements namely, FA20, FA35, FA55
were used. For each type of cement, three different cement mortars were prepared
and for each type of mortar three molds were cast and compressive strength of these
mortars were tested at 7 and 28 days.
4.2 Compressive Strength Test Results
Three different Fly ash-blended cements labeled as FA20, FA35 and FA55 are
separately analyzed.
4.2.1 20 % Fly ash-Blended Cement (FA20)
The results of 7 and 28-day compressive strength test results of FA 20 mortar are
given in Table 9.
According to Table 9 the results of C-Mass mortar for 7 day compressive strength
vary in between 3.5 MPa and 6.3 MPa. The results for C-Volume 7 day compressive
strength vary in between 13.9 MPa and 18.5 MPa and the results of C-Flow mortar
for 7 day compressive strength vary in between 14.3 MPa and 17.6 MPa. Difference
between upper and lower compressive strength results of C-Mass method is 2.6 MPa,
C-Volume method is 4.6 MPa and C-Flow method is 3.3 MPa.

26
Mol
d-1
Mol
d-2
Mol
d-3
Mol
d-1
Mol
d-2
Mol
d-3
Mol
d-1
Mol
d-2
Mol
d-3
4.9
4.4
5.8
15.3
16.0
15.1
17.1
14.5
15.9
5.0
4.6
5.6
17.7
15.4
15.0
16.1
15.7
15.7
4.9
5.4
5.5
17.9
17.2
14.6
17.6
14.3
14.9
5.1
3.5
6.3
13.9
18.5
14.8
16.1
15.8
16.3
5.5
4.6
4.6
16.5
17.4
14.9
16.4
16.3
15.1
4.6
5.5
3.8
14.5
15.0
15.4
15.6
15.5
16.1
Mea
n5.
04.
75.
316
.016
.615
.016
.515
.415
.7
CV
(%
)5.
915
.717
.210
.48.
11.
84.
55.
13.
6
10.3
11.2
9.5
25.1
22.8
23.5
24.0
21.7
23.6
9.6
10.4
11.3
25.9
21.9
20.8
25.9
22.8
24.1
9.3
9.5
11.7
26.9
20.1
22.4
23.8
22.4
24.3
9.2
11.5
9.6
26.8
24.7
23.1
24.0
22.6
24.6
6.8
11.4
14.5
25.9
23.6
23.9
24.5
23.1
23.9
6.8
11.2
11.2
27.6
18.6
24.0
26.3
22.8
22.6
Mea
n8.
710
.911
.326
.422
.023
.024
.822
.623
.9
CV
(%
)17
.37.
116
.13.
410
.35.
24.
42.
12.
9
Tab
le 9
Com
pres
sive
Str
engt
h T
est R
esul
ts o
f FA
20
Com
pres
sive
Str
engt
h (M
Pa)
C-M
ass
C-V
olum
eC
-Flo
w
7-D
ay
28-D
ay

27
According to Table 9 the results of C-Mass mortar for 28 day compressive strength
vary in between 6.8 MPa and 14.5 MPa. The results for C-Volume 28 day
compressive strength vary in between 18.6 MPa and 27.6 MPa and the results of C-
Flow mortar for 28 day compressive strength vary in between 21.7 MPa and 26.3
Mpa. Difference between upper and lower compressive strength results of C-Mass
method is 7.7 MPa, C-Volume method is 9.0 MPa and C-Flow method is 4.6 MPa.
Even though the difference between maximum and minimum values are higher for
C-Mass test method, strength obtained for this method is also low. Therefore, a better
way of intergreting the data is to obtain a dimensional parameter by dividing the
variation to the mean value as presented in Figure 8.
Figure 8 Max-Min Compressive Strength Test Results of FA 20
As seen from Figure 8 highest variation in the compressive strength test results are
obtained for C-Mass method. On the other hand, lowest variation in the compressive
strength test results are obtained for C-Flow method.

28
Another way to look at these variabilities is to statistically analyze the data coming
from the experimental study. For this purpose, the compressive strength test results
are assumed to be normally distributed. Then, Probability distribution function(pdf)
of the data were obtained and the variation in the results are visually plotted. This is
plotted in Figure 9.
In Figure 9 where, Xi is Individual compressive strength test results (MPa) and
Xmean is average compressive strength test result for each method (MPa).
Figure 9 (a) shows the probability distribution of 7-day compressive strength results.
As observed from Figure 9 (a) the least deviation in the compressive strength results
were observed for speciments prepared by C-Flow method. Then C-Volume method
has less deviation. However, for the C-Mass method which is prepared by constant
water/cementitious, it was observed the highest deviation in the compressive strength
results.
Similar observations were determined for the 28-day compressive strength results, as
seen from Figure 9 (b).

29
a) 7-day Compressive Strength
b) 28-day Compressive Strength
Figure 9 Probability Distribution Function (pdf) of FA 20-Blended Cements
30
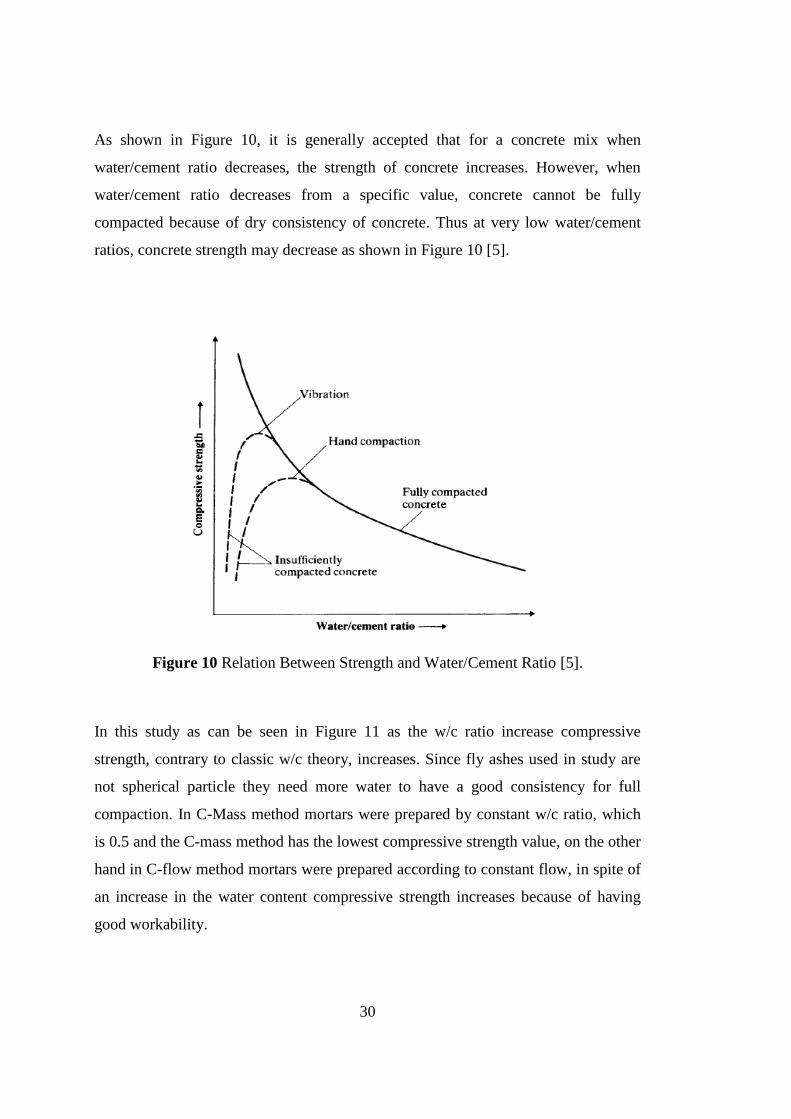
As shown in Figure 10, it is generally accepted that for a concrete mix when
water/cement ratio decreases, the strength of concrete increases. However, when
water/cement ratio decreases from a specific value, concrete cannot be fully
compacted because of dry consistency of concrete. Thus at very low water/cement
ratios, concrete strength may decrease as shown in Figure 10 [5].
Figure 10 Relation Between Strength and Water/Cement Ratio [5].
In this study as can be seen in Figure 11 as the w/c ratio increase compressive
strength, contrary to classic w/c theory, increases. Since fly ashes used in study are
not spherical particle they need more water to have a good consistency for full
compaction. In C-Mass method mortars were prepared by constant w/c ratio, which
is 0.5 and the C-mass method has the lowest compressive strength value, on the other
hand in C-flow method mortars were prepared according to constant flow, in spite of
an increase in the water content compressive strength increases because of having
good workability.

31
Figure 11 Compressive Strength Test Results of FA 20-Blended Cement
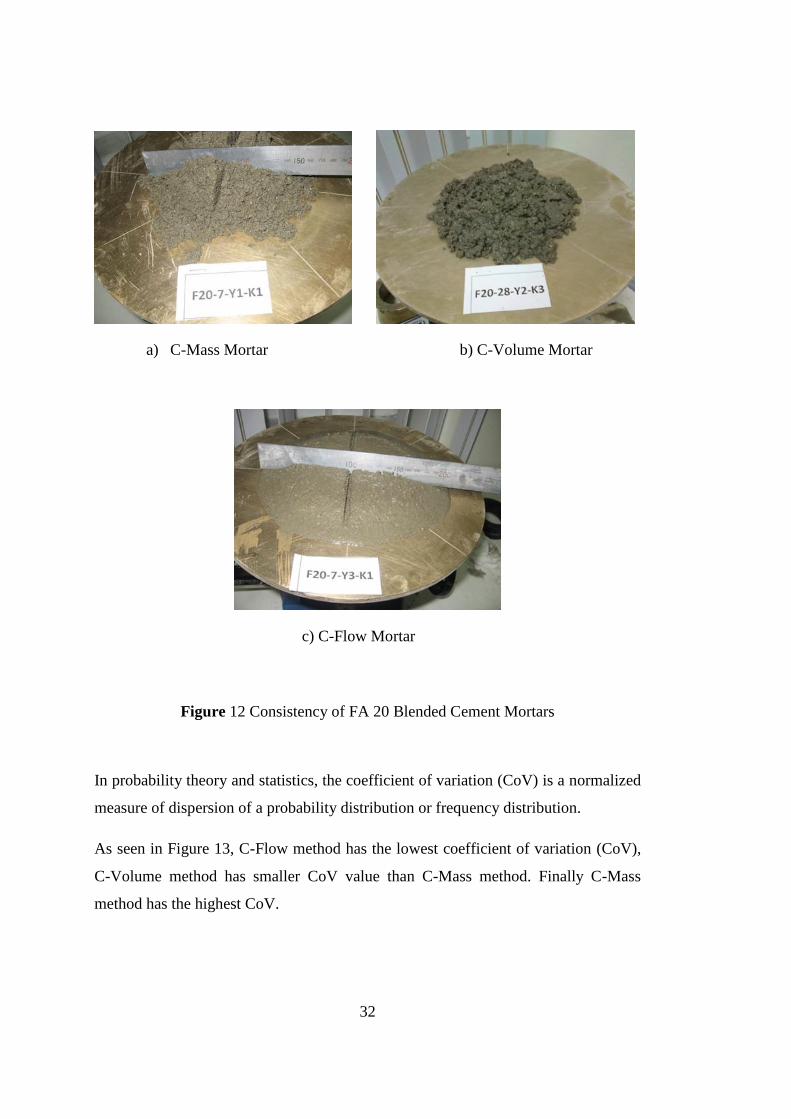
Figure 12 shows the three different pictures of FA 20 mortars. As seen from those
figures, the mortar prepared by C-Flow method has a higher consistency than the
other two.
C-Mass
C-Volume C-Flow
Co
mp
ress
ive
Str
ength
(M
Pa
)
32
a) C-Mass Mortar b) C-Volume Mortar
c) C-Flow Mortar
Figure 12 Consistency of FA 20 Blended Cement Mortars
In probability theory and statistics, the coefficient of variation (CoV) is a normalized
measure of dispersion of a probability distribution or frequency distribution.
As seen in Figure 13, C-Flow method has the lowest coefficient of variation (CoV),
C-Volume method has smaller CoV value than C-Mass method. Finally C-Mass
method has the highest CoV.

33
Figure 13 Coefficient of Variation (CoV) of Compressive Strength Test Results for
FA 20-Blended Cement
4.2.2 35 % Fly ash-Blended Cement (FA35)
The results of 7 and 28 day compressive strength test results of FA 35 mortars were
given in Table 10
According to Table 10 the results of C-Mass mortar for 7 day compressive strength
vary in between 1.5 MPa and 2.9 MPa. The results for C-Volume 7 day compressive
strength vary in between 3.9 MPa and 6.4 MPa and the results of C-Flow mortar for
7 day compressive strength vary in between 7.3 MPa and 9.1 MPa. Difference
between upper and lower compressive strength results of C-Mass method is 0.6 MPa,
C-Volume method is 2.5 MPa and C-Flow method is 1.8 MPa.
C-Mass
C-Volume C-Flow
COV(%)

34
Mol
d-1
Mol
d-2
Mol
d-3
Mol
d-1
Mol
d-2
Mol
d-3
Mol
d-1
Mol
d-2
Mol
d-3
1.7
1.7
2.5
5.7
4.8
4.4
8.2
8.0
7.6
1.5
1.9
2.7
6.4
4.4
4.8
8.4
7.7
7.5
2.9
2.7
2.4
5.4
4.3
4.0
8.5
7.3
8.2
2.3
2.4
2.5
5.0
5.4
4.8
9.1
7.7
7.8
2.2
2.2
2.3
6.1
3.9
4.7
8.7
8.0
8.0
2.2
1.6
2.2
4.7
4.3
4.6
8.4
8.0
7.8
Mea
n2.
12.
12.
45.
64.
54.
68.
67.
87.
8
CV
(%
)23
.120
.57.
211
.711
.56.
83.
73.
63.
3
2.5
2.7
2.8
8.2
8.3
7.1
13.3
13.5
15.7
3.2
2.6
3.2
8.8
8.5
11.3
12.7
13.1
14.4
2.8
2.7
2.4
9.4
8.7
9.8
13.1
15.0
14.4
2.8
3.2
2.7
8.1
9.0
8.2
12.6
13.3
14.1
3.2
2.5
3.0
13.2
11.4
9.5
12.8
14.7
15.4
2.7
2.5
2.8
9.1
9.5
11.7
13.5
12.8
15.6
Mea
n2.
92.
72.
89.
59.
29.
613
.013
.714
.9
CV
(%
)9.
89.
79.
620
.012
.418
.42.
86.
64.
7
Tab
le 1
0 C
ompr
essi
ve S
tren
gth
Tes
t Res
ults
of F
A 3
5
Com
pres
sive
Str
engt
h
(MP
a)
C-M
ass
C-V
olum
eC
-Flo
w
7-D
ay
28-D
ay
35
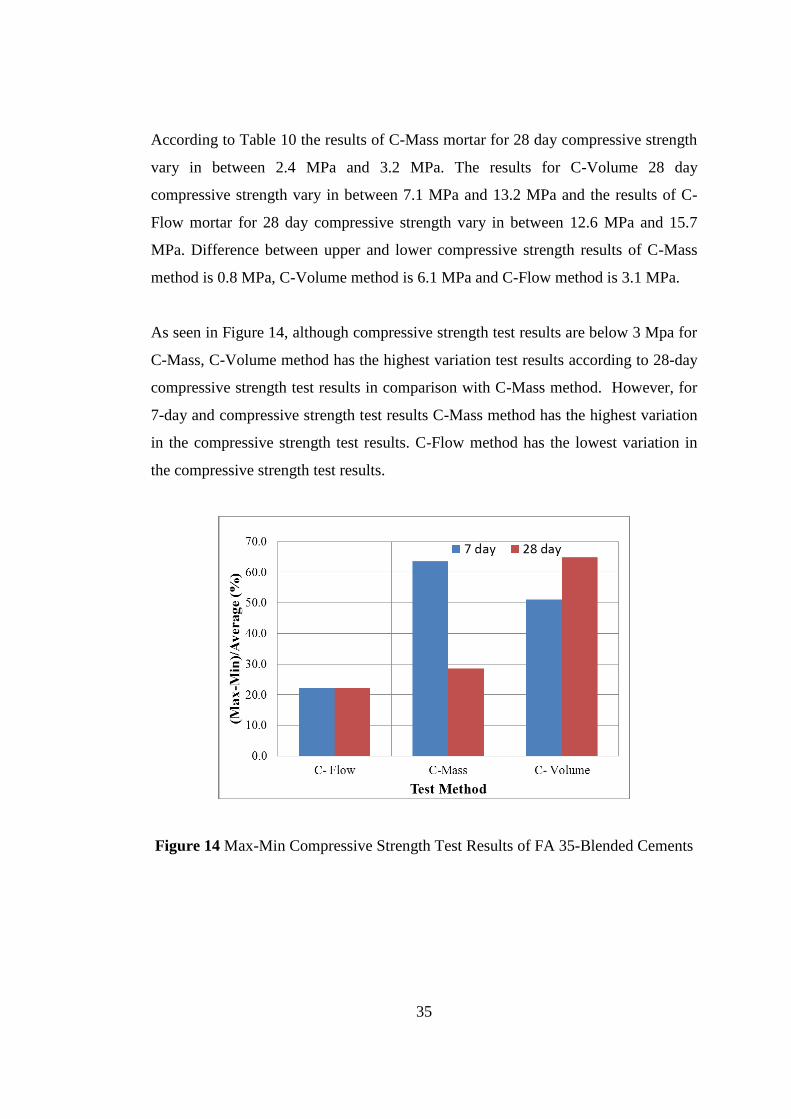
According to Table 10 the results of C-Mass mortar for 28 day compressive strength
vary in between 2.4 MPa and 3.2 MPa. The results for C-Volume 28 day
compressive strength vary in between 7.1 MPa and 13.2 MPa and the results of C-
Flow mortar for 28 day compressive strength vary in between 12.6 MPa and 15.7
MPa. Difference between upper and lower compressive strength results of C-Mass
method is 0.8 MPa, C-Volume method is 6.1 MPa and C-Flow method is 3.1 MPa.
As seen in Figure 14, although compressive strength test results are below 3 Mpa for
C-Mass, C-Volume method has the highest variation test results according to 28-day
compressive strength test results in comparison with C-Mass method. However, for
7-day and compressive strength test results C-Mass method has the highest variation
in the compressive strength test results. C-Flow method has the lowest variation in
the compressive strength test results.
Figure 14 Max-Min Compressive Strength Test Results of FA 35-Blended Cements
36
Figure 15 (a) shows the probability distribution of 7-day compressive strength
results. As can be seen from Figure 15 (a) the least deviation in the compressive
strength results were observed for speciments prepared by C-Flow method. Then C-
Volume method has less deviation. C-Mass method has the highest deviation in the
compressive strength results.
Figure 15 (b) shows the probability distribution of 28-day compressive strength
results. Figure 15 (b) shows that C-Flow method has the least deviation in the
compressive strength results. On the other hand, C-Volume method has the highest
deviance in the compressive strength results.

37
a) 7-day Compressive Strength
b) 28-day Compressive Strength
Figure 15 Probability Distribution Function (pdf) of FA 35-Blended Cements

38
Figure 16 shows that; As w/c ratio the increase compressive strength increases. For
S35 cement C-Flow morters have the biggest compressive strength test results, then
C-Volume morters have higher compressive strength test results than C-Mass
method and C-mass method has the lowest compressive strength test results because
of does not supply enough water to have good workability. Figure 17 shows the three
different pictures of FA 35 mortars.
Figure 16 Compressive Strength Test Results of FA 35-Blended Cement
C-Mass
C-Volume
C-Flow

39
a) C-Mass Mortar b) C-Volume Mortar
c) C-Flow Mortar
Figure 17 The Consistency of FA 35 Blended Cement Mortars
According to the Figure 18, for 7-days compressive ctrength test results C-Flow
method has the lowest CoV, C-Volume method has smaller CoV value than C-Mass
method and C-Mass method has the biggest CoV. For 28-days compressive strength
test results, C-Flow method has the lowest CoV then C-Mass method has smaller
CoV value and C-Volume method has the biggest CoV.

40
Figure 18 Coefficient of variation (CoV) of Compressive Strength Test Results for
FA 35-Blended Cement
4.2.3 55 % Fly ash-Blended Cement (FA55)
The results of 7 and 28 day compressive strength test results of FA 55 mortars were
given in Table 11.
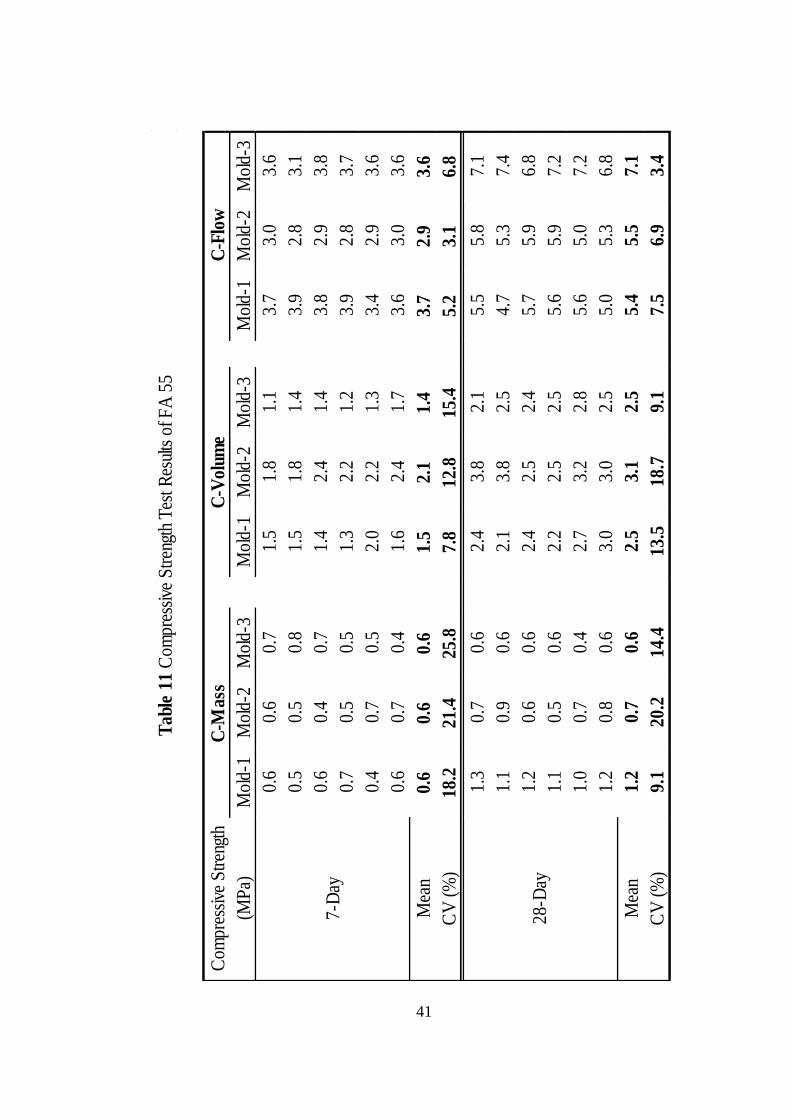
According to Table 11 the results of C-Mass mortar for 7 day compressive strength
vary in between 0.4 MPa and 0.8 MPa. The results for C-Volume 7 day compressive
strength vary in between 1.1 MPa and 2.4 MPa and the results of C-Flow mortar for
7 day compressive strength vary in between 2.8 MPa and 3.9 MPa. Difference
between upper and lower compressive strength results of C-Mass method is 0.4 MPa,
C-Volume method is 1.5 MPa and C-Flow method is 1.1 MPa.
COV(%)
C-Volume
C-Flow C-Mass
41
Mol
d-1
Mol
d-2
Mol
d-3
Mol
d-1
Mol
d-2
Mol
d-3
Mol
d-1
Mol
d-2
Mol
d-3
0.6
0.6
0.7
1.5
1.8
1.1
3.7
3.0
3.6
0.5
0.5
0.8
1.5
1.8
1.4
3.9
2.8
3.1
0.6
0.4
0.7
1.4
2.4
1.4
3.8
2.9
3.8
0.7
0.5
0.5
1.3
2.2
1.2
3.9
2.8
3.7
0.4
0.7
0.5
2.0
2.2
1.3
3.4
2.9
3.6
0.6
0.7
0.4
1.6
2.4
1.7
3.6
3.0
3.6
Mea
n0.
60.
60.
61.
52.
11.
43.
72.
93.
6
CV
(%
)18
.221
.425
.87.
812
.815
.45.
23.
16.
8
1.3
0.7
0.6
2.4
3.8
2.1
5.5
5.8
7.1
1.1
0.9
0.6
2.1
3.8
2.5
4.7
5.3
7.4
1.2
0.6
0.6
2.4
2.5
2.4
5.7
5.9
6.8
1.1
0.5
0.6
2.2
2.5
2.5
5.6
5.9
7.2
1.0
0.7
0.4
2.7
3.2
2.8
5.6
5.0
7.2
1.2
0.8
0.6
3.0
3.0
2.5
5.0
5.3
6.8
Mea
n1.
20.
70.
62.
53.
12.
55.
45.
57.
1
CV
(%
)9.
120
.214
.413
.518
.79.
17.
56.
93.
4
7-D
ay
28-D
ay
Tab
le 1
1 C
ompr
essi
ve S
tren
gth
Tes
t Res
ults
of F
A 5
5
Com
pres
sive
Str
engt
h
(MP
a)
C-M
ass
C-V
olum
eC
-Flo
w

42
According to Table 11 the results of C-Mass mortar for 28 day compressive strength
vary in between 0.4 MPa and 1.3 MPa. The results for C-Volume 28 day
compressive strength vary in between 2.1 MPa and 3.8 MPa and the results of C-
Flow mortar for 28 day compressive strength vary in between 4.7 MPa and 7.4 MPa.
Difference between upper and lower compressive strength results of C-Mass method
is 0.7 MPa, C-Volume method is 1.7 MPa and C-Flow method is 2.7 MPa.
As seen in Figure 19, C-Mass method has the highest variation in the 28-day
compressive strength test results. On the other hand, C-Volume method has the
highest variation in the 7-day compressive strength test results, though compressive
strength test results are below 1 Mpa for C-Mass method. As expected, C-Flow
method has the lowest variation in the compressive strength test results.
Figure 19 Max-Min Compressive Strength Test Results of FA 55-Blended Cements
43
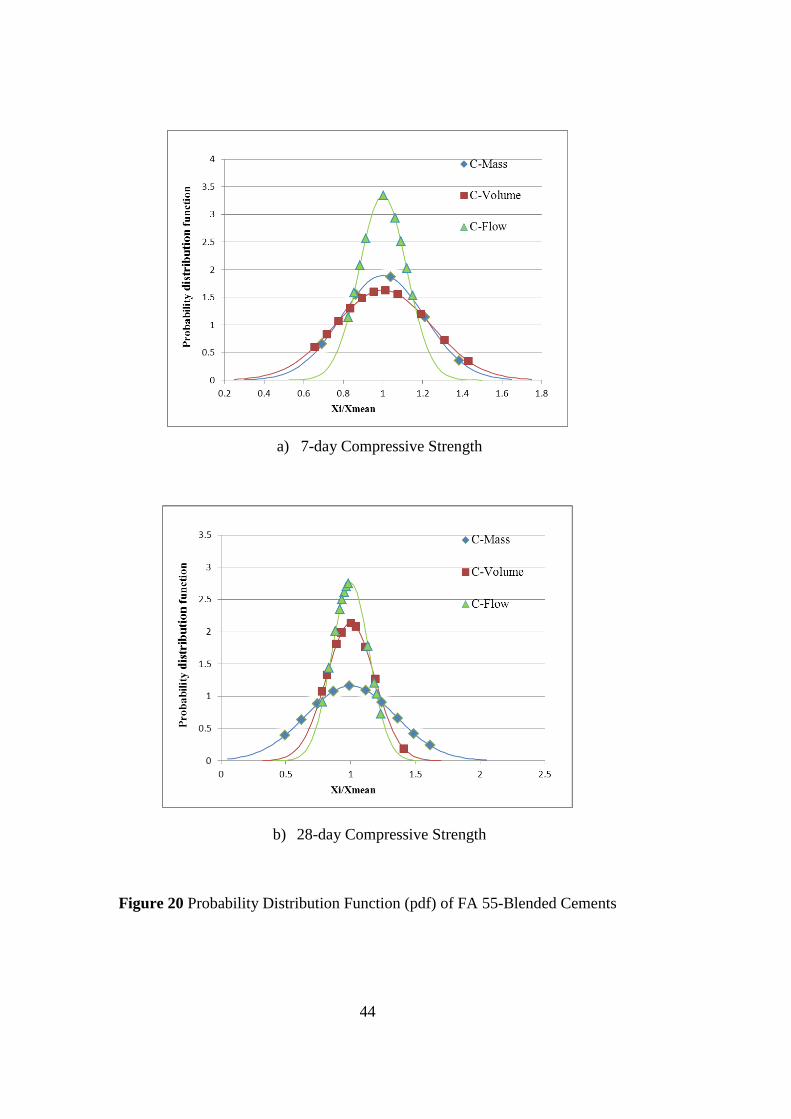
Figure 20 (a) shows the probability distribution of 7-day compressive strength
results. As can be seen from Figure 20 (a) C-Flow method has the least deviation in
the compressive strength results. Then C-Mass method has less deviation. C-Volume
method has the highest deviation in the compressive strength results.
Figure 20 (b) shows the probability distribution of 28-day compressive strength
results. Figure 20 (b) shows that C-Flow method has the least deviation in the
compressive strength results. C-Mass method has the highest deviation in the
compressive strength results.
44
a) 7-day Compressive Strength
b) 28-day Compressive Strength
Figure 20 Probability Distribution Function (pdf) of FA 55-Blended Cements
45
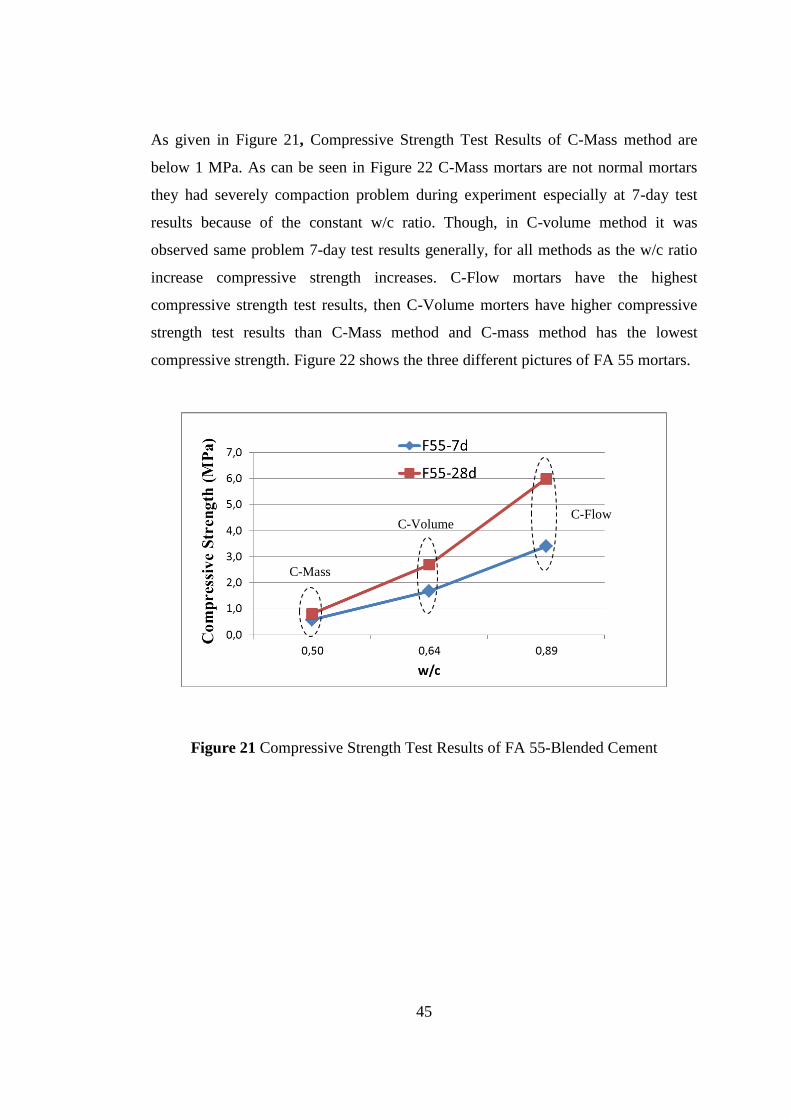
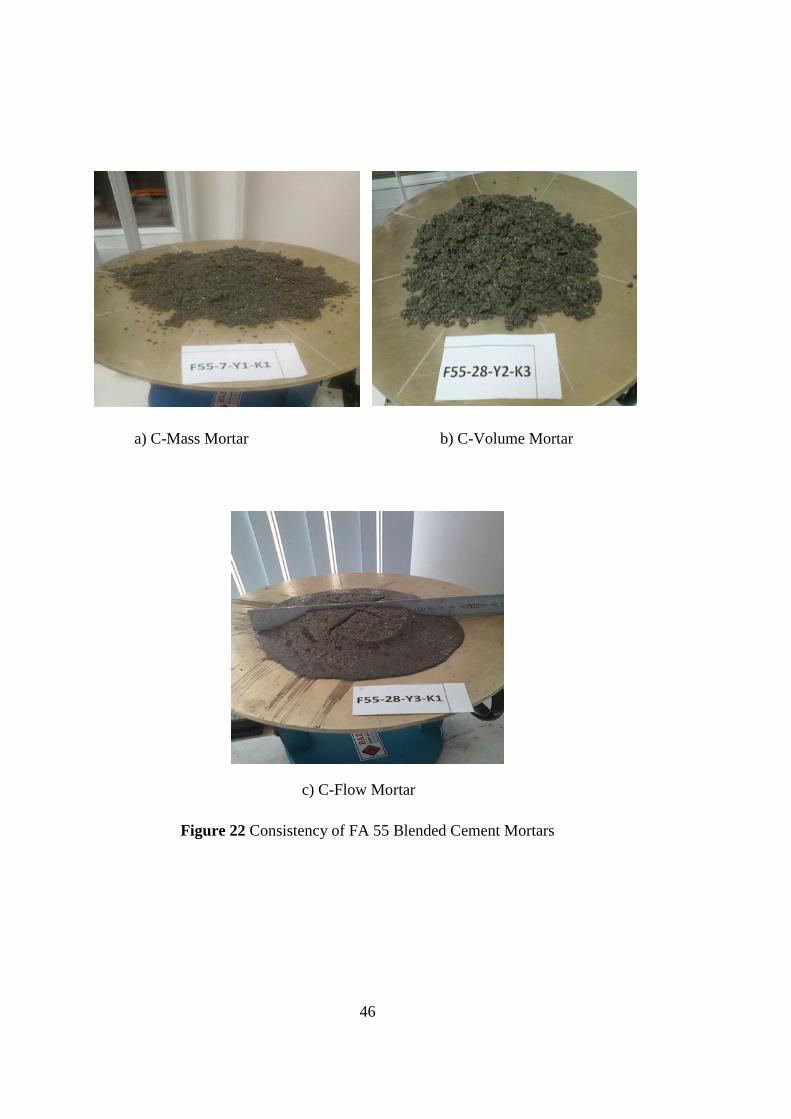
As given in Figure 21, Compressive Strength Test Results of C-Mass method are
below 1 MPa. As can be seen in Figure 22 C-Mass mortars are not normal mortars
they had severely compaction problem during experiment especially at 7-day test
results because of the constant w/c ratio. Though, in C-volume method it was
observed same problem 7-day test results generally, for all methods as the w/c ratio
increase compressive strength increases. C-Flow mortars have the highest
compressive strength test results, then C-Volume morters have higher compressive
strength test results than C-Mass method and C-mass method has the lowest
compressive strength. Figure 22 shows the three different pictures of FA 55 mortars.
Figure 21 Compressive Strength Test Results of FA 55-Blended Cement
C-Mass
C-Volume C-Flow
46
a) C-Mass Mortar b) C-Volume Mortar
c) C-Flow Mortar
Figure 22 Consistency of FA 55 Blended Cement Mortars

47
According to Figure 23, for 7-day compressive strength test results C-Flow method
has the lowest CoV, C-Mas method has smaller CoV value than C-Volume method
and. For 28-days compressive strength test results C-Flow method has the lowest
CoV, then C-Volume method has smaller CoV value and finally C-Mass method has
the biggest CoV.
Figure 23 Coefficient of Variance (CoV) of Compressive Strength Test Results for
FA 55-Blended Cement
4.3 Comparison of the Compressive Strength Test Results for FA20, FA35 and
FA 55 Blended-Cements
As can be seen from Figure 24, for 7-day and 28-day compressive strength test
results, generally as the fly ash content increases compressive strength decreases and
as the w/c ratio increases compressive strength increases. Mortars need more water to
have a good workability, since particle shape of fly ashes used in study are angular,
rugged shapes which was shown in Figure 6.
C-Volume C-Flow C-Mass
COV(%)

48
Figure 24 Compressive Strength Test Results of Fly Ash-Blended Cements
These type of fly ash particles increase the demand of water of mixture. Specifically,
within same cement type the smallest compressive strength value was observed for
C-Mass method prepared by constant w/c ratio because of not having a good
consistency. And as expected, the highest compressive strength value was observed
for C-Flow method prepared by constant flow, because of having good workability
despite of increase in the water content.
4.4 Comparison of Coefficient of Variance for Different Test Methods
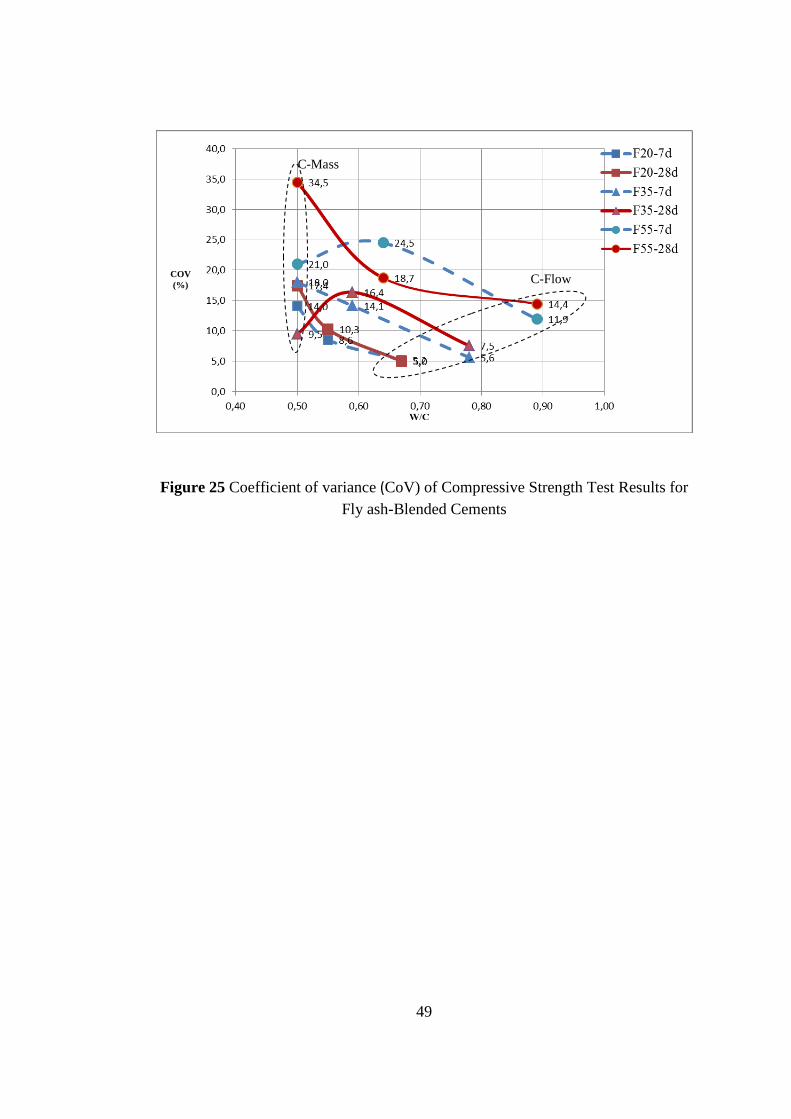
According to Figure 25, for FA20 C-Flow method has the lowest variability, C-Mass
method has the biggest variability. Then for FA35 C-Flow method has the lowest
variability, C-Mass method has the biggest variability. Finally for FA55 C-Flow
method has the lowest variability and as expected, C-Mass method has the biggest
variability
C-Mass
C-Flow
49
Figure 25 Coefficient of variance (CoV) of Compressive Strength Test Results for
Fly ash-Blended Cements
C-Mass
C-Flow COV
(%)

50
51
CHAPTER 5
SUMMARY AND CONCLUSIONS
5.1 General
For the determination of compressive strength of blended cements, three different
methods which are acquired by the constant water/cementitious by mass (EN 196-1),
constant flow (ASTM) and constant water/cementitious by volume methods were
used. For this purpose, fly ash (FA) blended cements were chosen. Then, fly ash-
blended cements were tested at TSE Construction Materials Laboratory and 7-day
and 28-day compressive strength of mortars was obtained. The results obtained from
mortar tests were examined. The outcomes of the analyses are as follows:
1) According to the experimental test results the fly ash used in this study
increased the water demand of the blended cements to bring the mortars to
the same consistency which is needed.
2) For all cement types highest variability was observed for C-Mass method.
This was attributed to the surface morphology of the fly ash.
3) According to results of compressive strength, as the w/c ratio increases
compressive strength increases. This was attributed to the fact that cement
mortars were not fully consolidated. Since fly ashes used in this study are not
spherical particle which have angular, rugged shapes, they need more water
to have a good workability.

52
4) According to results of three different methods, the constant
water/cementitious by mass (TS EN 196-1) method is not an appropriate test
method for fly ash blended cements based on the higher variabilities
encountered in the tests, since constant water to cement ratio is not
appropriate to have a homogenous mix.
5.2 Recommendations for Further Studies
Considering the results obtained from this study, the following recommendations
could be made for researchers for future studies.
1) The fly ash used in this study has a narrow range in the blended cements. As
a result of this study, the studies should be continued with using different
blended cement types.
2) In this study, only a limited number of specimens were tested. Therefore, it is
suggested to increase the number of specimens.
3) Better characterization of the fly ash alone would have been helpful for this
kind of experimental study.
53
REFERENCES
1. Turkish Cement Manufacturers’ Association, İstatistikler,
http://tcma.org.tr/index.php?page=icerikgoster&menuID=39, last accessed date:
07.03.2014.
2. Aitcin P.-C., Cements of yesterday and today concrete of tomorrow, Cement and
Concrete Research Res. 30 pp.1349-1359, 2000
3. Josbi R.C., Lohtia R.P., Fly ash in concrete: production, properties and uses,
advances in concrete technology v.2, Netherlands, 1997
4. Sear, L.K.A., The Properties and Use of Coal Fly Ash, London, 2001
5. Neville A. M., Brooks J.J., Concrete Technology, Second Edition, Pearson
Education Limited, England, 2010.
6. TS EN 197-1, Cement-Part 1: Composition, specifications and conformity criteria
for common cements, Turkish Standards Institution, February, 2012.
7. Goodell, J., Big Coal: The Dirty Secret Behind America’s Energy Future,
Houghton Mifflin Company, New York, 2007
8. ASTM C618, Standart Specification for Coal Fly Ash and Raw or Calcined
Natural Pozzolan for Use as a Mineral Admixture in Concrete, Annual Book of
ASTM Standarts, 1998.
9. Cockrell, C.F., Leonard, J.W., Characterization and Utilization Studies of
Limestone Modified Fly ash, vol. 60., Coal Research Bureau, Morgantown, 1970.

54
10. Türker P., Erdoğan B., Katnaş F., Yeğinobalı A., Türkiye’deki uçucu küllerin
sınıflandırılması ve özellikleri, Türkiye Çimento Müstahsilleri Birliği, 4. Baskı,
Ankara, 2009.
11. McCarthy, G.J., X-ray powder diffraction for studying the mineralogy of fly ash,
Materials Research Society, Pittsburgh, 1988
12. Baker/TSA Inc., Classification of Fly Ash for Use in Cement and Concrete,
April, 1987.
13. Kosmatka S. H., Kerkhoff B., and Panarese W. C., Design and Control of
Concrete Mixtures, Fourteenth Edition, Portland Cement Association, USA, 2003
14. Thomas M., Supplementary Cementing Materials in Concrete, New York, 2013
15. Owens, P.L., Fly Ash and Its Usage in Concrete, Concrete Magazine, July, 1979,
16. The Portland Cement Association (PCA), Optimizing the Use of Fly Ash in
Concrete, http://www.cement.org/docs/default-source/fc_concrete_technology/is548-
optimizing-the-use-of-fly-ash-concrete.pdf?sfvrsn=4, last accessed date: 03.04.2014.
17. Gambhir M.L., Concrete Technology, Fifth Edition, McGraw Hill (India) Private
Limited, New Delhi, 2013.
18. New York City High Performance Infrastructure Guidelines (HPIG), NYC Dept.
of Design & Construction and Design Trust for Public Space, October, 2005
19. www.caer.uky.edu/kyasheducation/flyash.shtml, last accessed date: 20.04.2014.
20. ACI Committee 226: Use of Fly Ash in Concrete, ACI Materials Journal, 1987
21. Helmuth R., Fly Ash in Cement and Concrete, Portland Cement Association, 196
pp, 1987.gredients