comparison of the clearer generations...comparison of the clearer generations textile technology...
TRANSCRIPT
USTER®
QUANTUM 3
Application Report
Comparison of the clearer generations
Textile Technology /September 2010 / Version 2 / SE 655
THE YARN QUALITY ASSURANCE SYSTEM
2 (20) USTER® QUANTUM 3
Editorial Team: S. Dönmez Kretzschmar U. Schneider © Copyright 2013 by Uster Technologies AG. All rights reserved. All and any information contained in this document is non-binding. The supplier reserves the right to modify the products at any time. Any liability of the supplier for damages resulting from possible discrepancies between this document and the characteristics of the products is explicitly excluded. veronesi\TT\Application Handbooks\USTER QUANTUM 3 \ SE-655_Comparison of the clearer generations
THE YARN QUALITY ASSURANCE SYSTEM
USTER® QUANTUM 3 3 (20)
Contents
1 Introduction ............................................................................... 5
2 History ........................................................................................ 5
3 USTER® QUANTUM 3 ................................................................ 6
3.1 Clearing by yarn body .................................................................. 6
3.2 Smart limits as proposed starting point ........................................ 7
3.3 Online calculation of the clearer cuts ........................................... 7
4 Translating the settings from USTER® QUANTUM 2............... 8
4.1 Comparing the way of setting ...................................................... 9
4.2 Basic setting NSL with USTER® QUANTUM 2 .......................... 10
4.3 Basic setting NSL with USTER® QUANTUM 3 .......................... 11
4.4 Using the former setting points .................................................. 11
5 Splice clearing ......................................................................... 13
6 C and CC settings .................................................................... 13
7 FD settings ............................................................................... 14
7.1 FD clearing ................................................................................ 14
7.2 Vegetable matter clearing .......................................................... 15
8 Polypropylene .......................................................................... 16
9 Q data ....................................................................................... 17
THE YARN QUALITY ASSURANCE SYSTEM
4 (20) USTER® QUANTUM 3
THE YARN QUALITY ASSURANCE SYSTEM
USTER® QUANTUM 3 5 (20)
1 Introduction The new clearer generation USTER® QUANTUM 3 is based on a newly developed clearer setting philosophy. This document is handling the basic settings for optical and capacitive sys-tems.
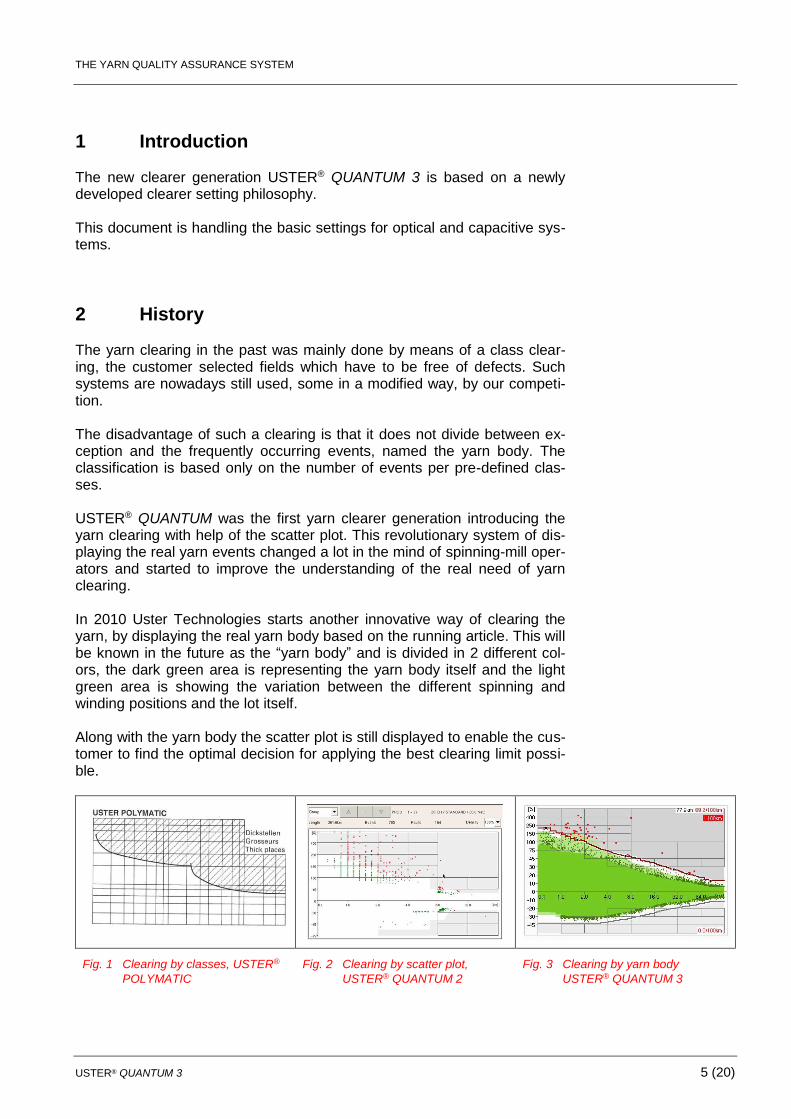
2 History The yarn clearing in the past was mainly done by means of a class clear-ing, the customer selected fields which have to be free of defects. Such systems are nowadays still used, some in a modified way, by our competi-tion. The disadvantage of such a clearing is that it does not divide between ex-ception and the frequently occurring events, named the yarn body. The classification is based only on the number of events per pre-defined clas-ses. USTER® QUANTUM was the first yarn clearer generation introducing the yarn clearing with help of the scatter plot. This revolutionary system of dis-playing the real yarn events changed a lot in the mind of spinning-mill oper-ators and started to improve the understanding of the real need of yarn clearing. In 2010 Uster Technologies starts another innovative way of clearing the yarn, by displaying the real yarn body based on the running article. This will be known in the future as the “yarn body” and is divided in 2 different col-ors, the dark green area is representing the yarn body itself and the light green area is showing the variation between the different spinning and winding positions and the lot itself. Along with the yarn body the scatter plot is still displayed to enable the cus-tomer to find the optimal decision for applying the best clearing limit possi-ble.
Fig. 1 Clearing by classes, USTER®
POLYMATIC
Fig. 2 Clearing by scatter plot,
USTER® QUANTUM 2
Fig. 3 Clearing by yarn body
USTER® QUANTUM 3
THE YARN QUALITY ASSURANCE SYSTEM
6 (20) USTER® QUANTUM 3
3 USTER® QUANTUM 3
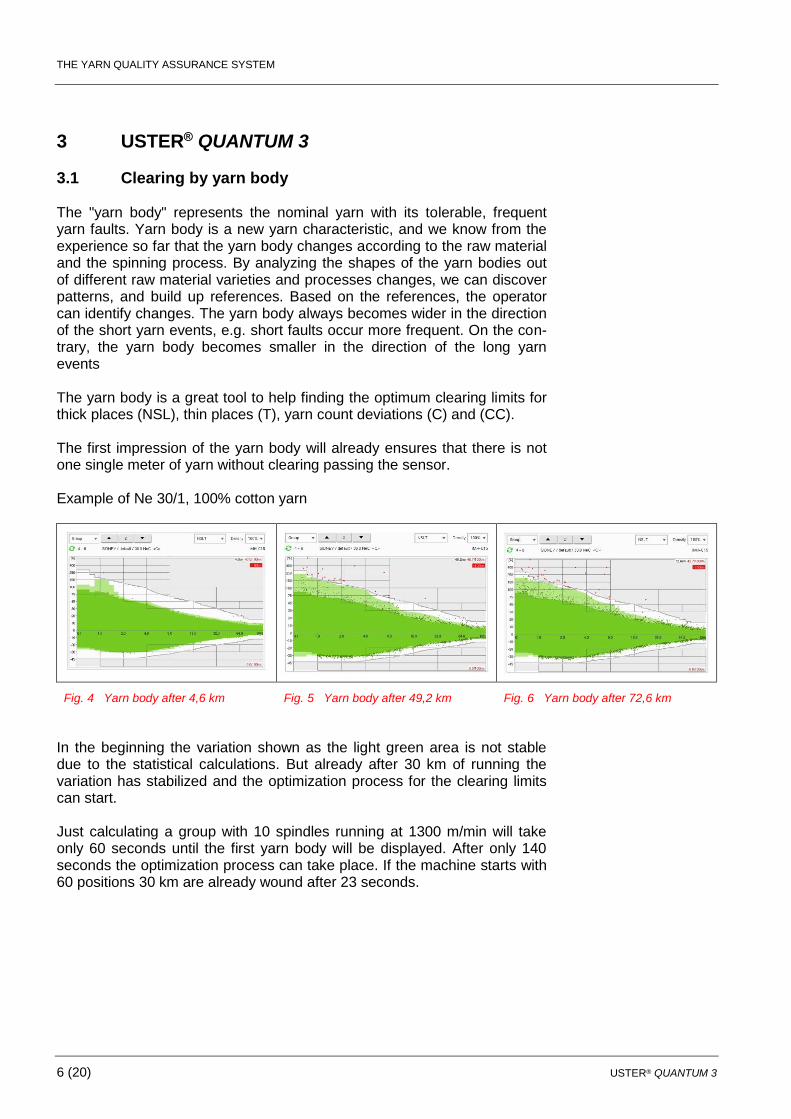
3.1 Clearing by yarn body The "yarn body" represents the nominal yarn with its tolerable, frequent yarn faults. Yarn body is a new yarn characteristic, and we know from the experience so far that the yarn body changes according to the raw material and the spinning process. By analyzing the shapes of the yarn bodies out of different raw material varieties and processes changes, we can discover patterns, and build up references. Based on the references, the operator can identify changes. The yarn body always becomes wider in the direction of the short yarn events, e.g. short faults occur more frequent. On the con-trary, the yarn body becomes smaller in the direction of the long yarn events The yarn body is a great tool to help finding the optimum clearing limits for thick places (NSL), thin places (T), yarn count deviations (C) and (CC). The first impression of the yarn body will already ensures that there is not one single meter of yarn without clearing passing the sensor. Example of Ne 30/1, 100% cotton yarn
Fig. 4 Yarn body after 4,6 km Fig. 5 Yarn body after 49,2 km Fig. 6 Yarn body after 72,6 km
In the beginning the variation shown as the light green area is not stable due to the statistical calculations. But already after 30 km of running the variation has stabilized and the optimization process for the clearing limits can start. Just calculating a group with 10 spindles running at 1300 m/min will take only 60 seconds until the first yarn body will be displayed. After only 140 seconds the optimization process can take place. If the machine starts with 60 positions 30 km are already wound after 23 seconds.
THE YARN QUALITY ASSURANCE SYSTEM
USTER® QUANTUM 3 7 (20)
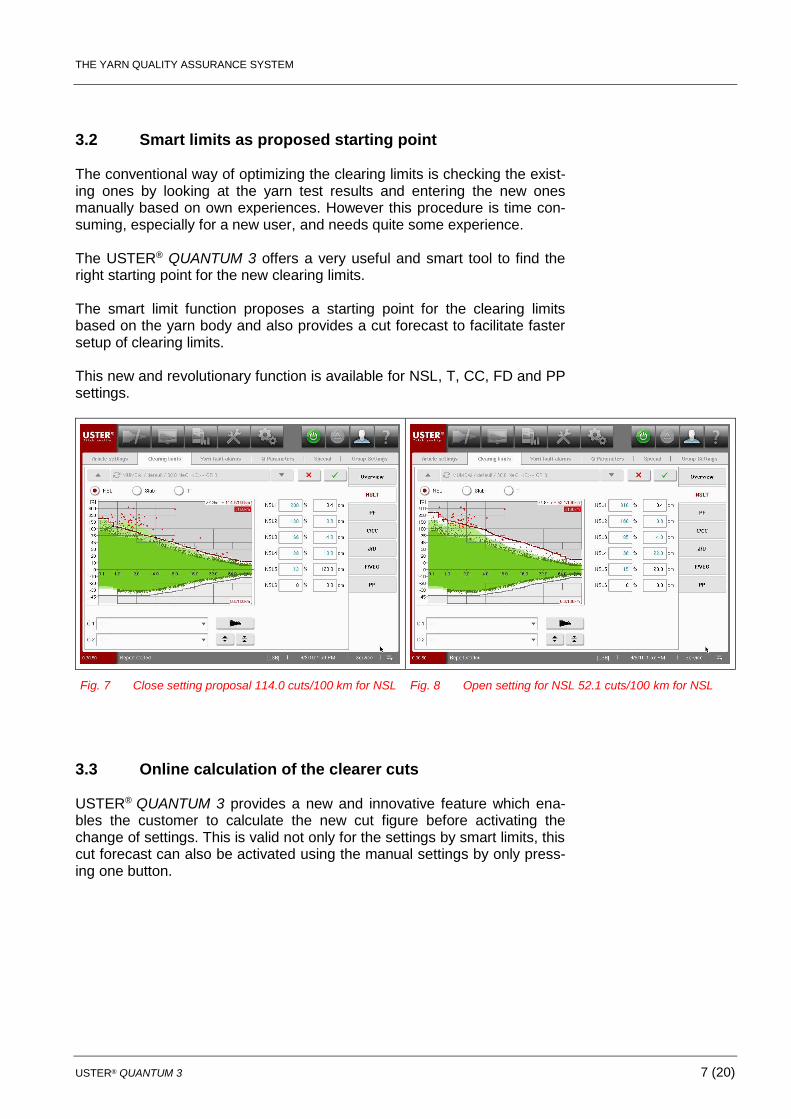
3.2 Smart limits as proposed starting point The conventional way of optimizing the clearing limits is checking the exist-ing ones by looking at the yarn test results and entering the new ones manually based on own experiences. However this procedure is time con-suming, especially for a new user, and needs quite some experience. The USTER® QUANTUM 3 offers a very useful and smart tool to find the right starting point for the new clearing limits. The smart limit function proposes a starting point for the clearing limits based on the yarn body and also provides a cut forecast to facilitate faster setup of clearing limits. This new and revolutionary function is available for NSL, T, CC, FD and PP settings.
Fig. 7 Close setting proposal 114.0 cuts/100 km for NSL Fig. 8 Open setting for NSL 52.1 cuts/100 km for NSL
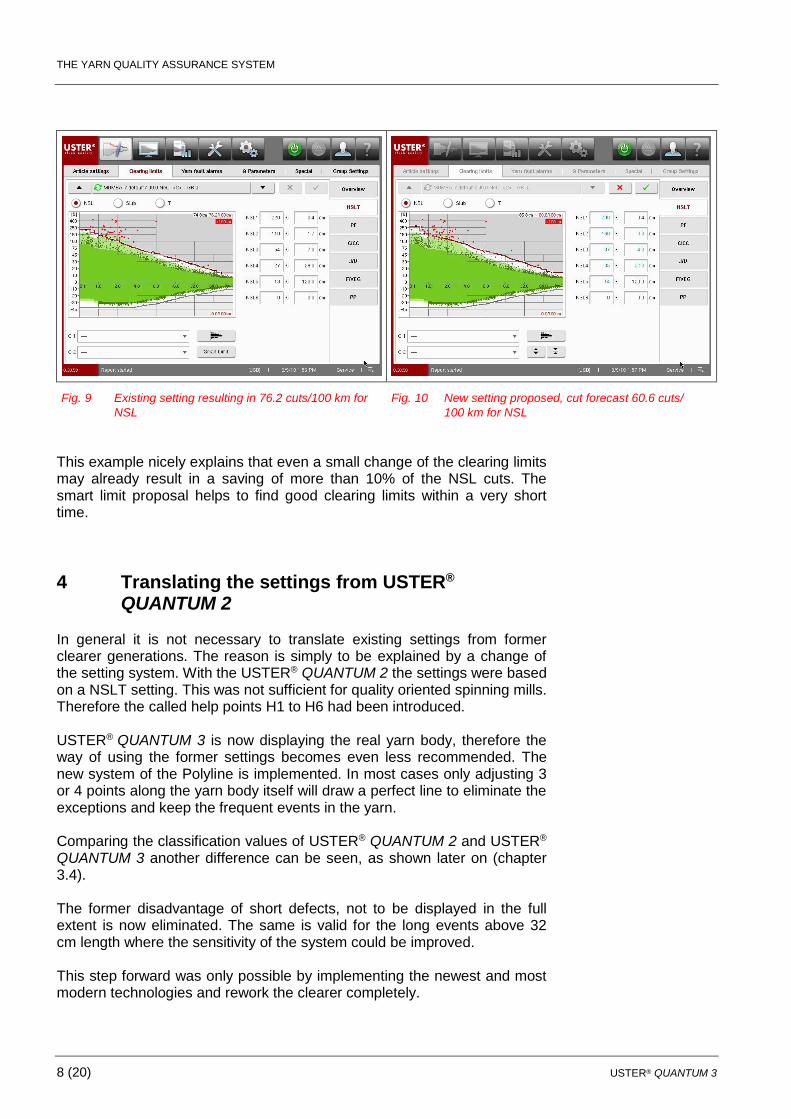
3.3 Online calculation of the clearer cuts USTER® QUANTUM 3 provides a new and innovative feature which ena-bles the customer to calculate the new cut figure before activating the change of settings. This is valid not only for the settings by smart limits, this cut forecast can also be activated using the manual settings by only press-ing one button.
THE YARN QUALITY ASSURANCE SYSTEM
8 (20) USTER® QUANTUM 3
Fig. 9 Existing setting resulting in 76.2 cuts/100 km for
NSL
Fig. 10 New setting proposed, cut forecast 60.6 cuts/
100 km for NSL
This example nicely explains that even a small change of the clearing limits may already result in a saving of more than 10% of the NSL cuts. The smart limit proposal helps to find good clearing limits within a very short time.
4 Translating the settings from USTER®
QUANTUM 2 In general it is not necessary to translate existing settings from former clearer generations. The reason is simply to be explained by a change of the setting system. With the USTER® QUANTUM 2 the settings were based on a NSLT setting. This was not sufficient for quality oriented spinning mills. Therefore the called help points H1 to H6 had been introduced. USTER® QUANTUM 3 is now displaying the real yarn body, therefore the way of using the former settings becomes even less recommended. The new system of the Polyline is implemented. In most cases only adjusting 3 or 4 points along the yarn body itself will draw a perfect line to eliminate the exceptions and keep the frequent events in the yarn. Comparing the classification values of USTER® QUANTUM 2 and USTER® QUANTUM 3 another difference can be seen, as shown later on (chapter 3.4). The former disadvantage of short defects, not to be displayed in the full extent is now eliminated. The same is valid for the long events above 32 cm length where the sensitivity of the system could be improved. This step forward was only possible by implementing the newest and most modern technologies and rework the clearer completely.
THE YARN QUALITY ASSURANCE SYSTEM
USTER® QUANTUM 3 9 (20)
The result is easily visible in an improved fabric appearance, and the bene-fit for the customer results in fewer cuts needed due to the real display of the yarn body.
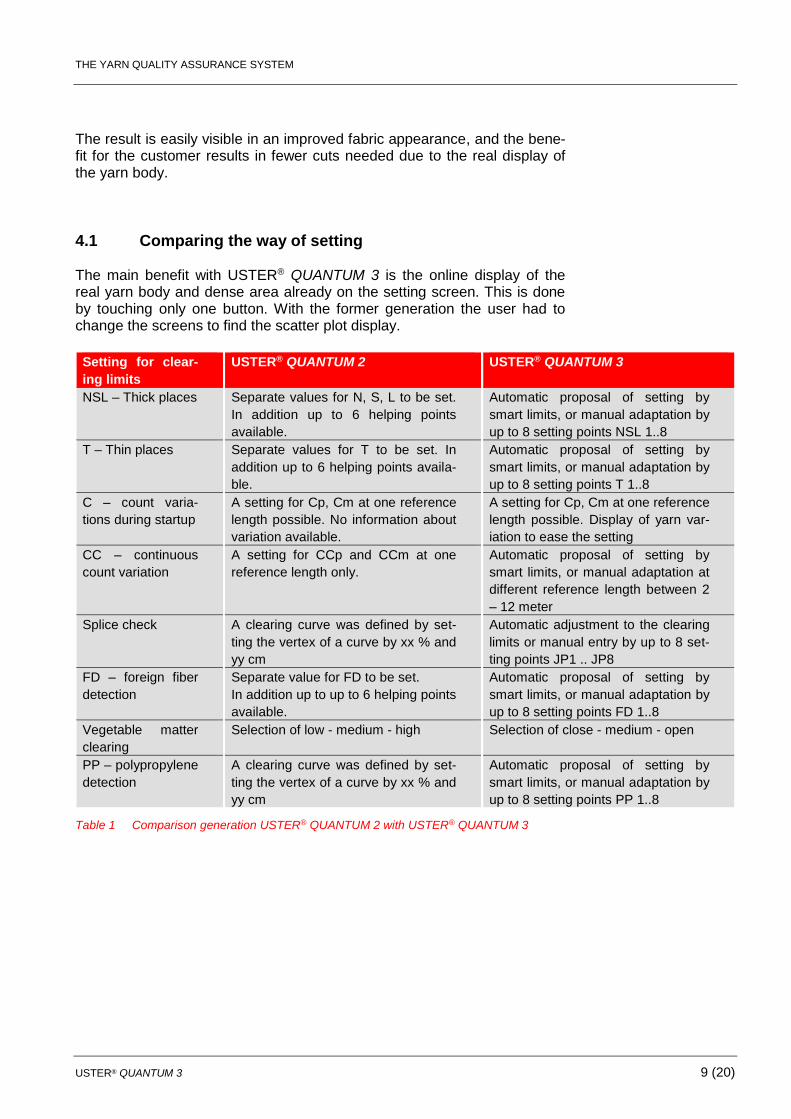
4.1 Comparing the way of setting The main benefit with USTER® QUANTUM 3 is the online display of the real yarn body and dense area already on the setting screen. This is done by touching only one button. With the former generation the user had to change the screens to find the scatter plot display.
Setting for clear-
ing limits
USTER® QUANTUM 2 USTER® QUANTUM 3
NSL – Thick places Separate values for N, S, L to be set.
In addition up to 6 helping points
available.
Automatic proposal of setting by
smart limits, or manual adaptation by
up to 8 setting points NSL 1..8
T – Thin places Separate values for T to be set. In
addition up to 6 helping points availa-
ble.
Automatic proposal of setting by
smart limits, or manual adaptation by
up to 8 setting points T 1..8
C – count varia-
tions during startup
A setting for Cp, Cm at one reference
length possible. No information about
variation available.
A setting for Cp, Cm at one reference
length possible. Display of yarn var-
iation to ease the setting
CC – continuous
count variation
A setting for CCp and CCm at one
reference length only.
Automatic proposal of setting by
smart limits, or manual adaptation at
different reference length between 2
– 12 meter
Splice check A clearing curve was defined by set-
ting the vertex of a curve by xx % and
yy cm
Automatic adjustment to the clearing
limits or manual entry by up to 8 set-
ting points JP1 .. JP8
FD – foreign fiber
detection
Separate value for FD to be set.
In addition up to up to 6 helping points
available.
Automatic proposal of setting by
smart limits, or manual adaptation by
up to 8 setting points FD 1..8
Vegetable matter
clearing
Selection of low - medium - high Selection of close - medium - open
PP – polypropylene
detection
A clearing curve was defined by set-
ting the vertex of a curve by xx % and
yy cm
Automatic proposal of setting by
smart limits, or manual adaptation by
up to 8 setting points PP 1..8
Table 1 Comparison generation USTER® QUANTUM 2 with USTER® QUANTUM 3
THE YARN QUALITY ASSURANCE SYSTEM
10 (20) USTER® QUANTUM 3
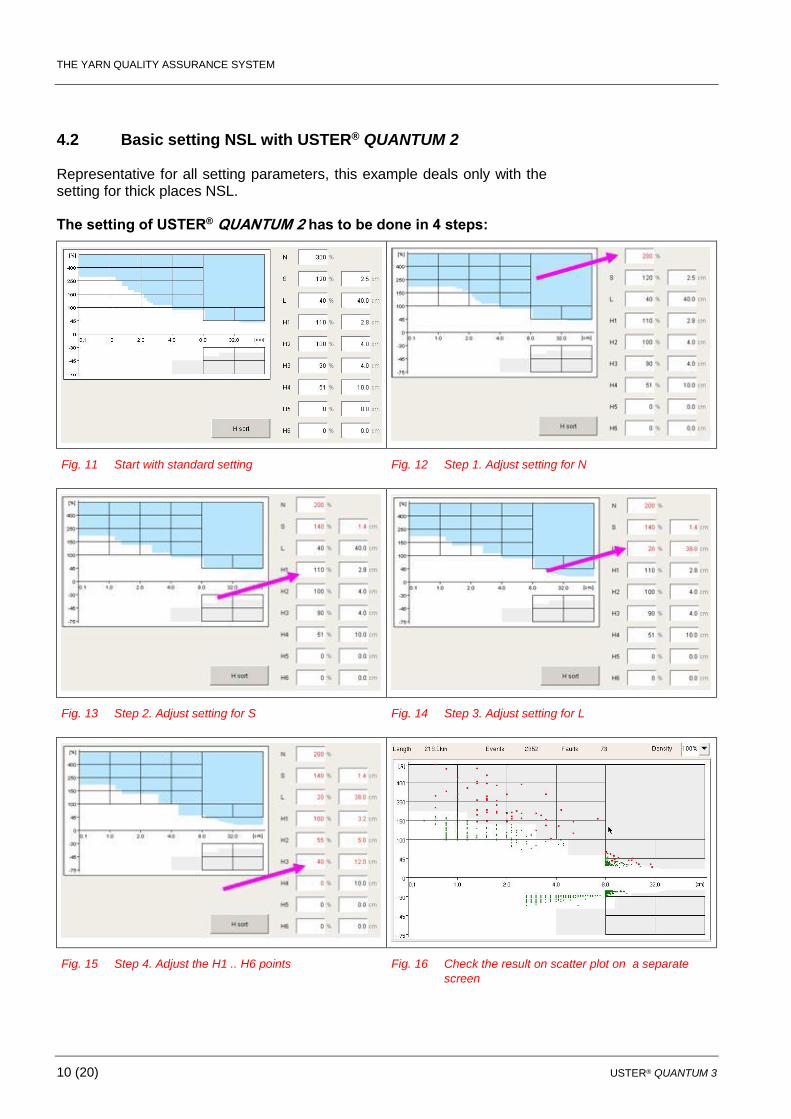
4.2 Basic setting NSL with USTER® QUANTUM 2 Representative for all setting parameters, this example deals only with the setting for thick places NSL. The setting of USTER® QUANTUM 2 has to be done in 4 steps:
Fig. 11 Start with standard setting Fig. 12 Step 1. Adjust setting for N
Fig. 13 Step 2. Adjust setting for S Fig. 14 Step 3. Adjust setting for L
Fig. 15 Step 4. Adjust the H1 .. H6 points Fig. 16 Check the result on scatter plot on a separate
screen
THE YARN QUALITY ASSURANCE SYSTEM
USTER® QUANTUM 3 11 (20)
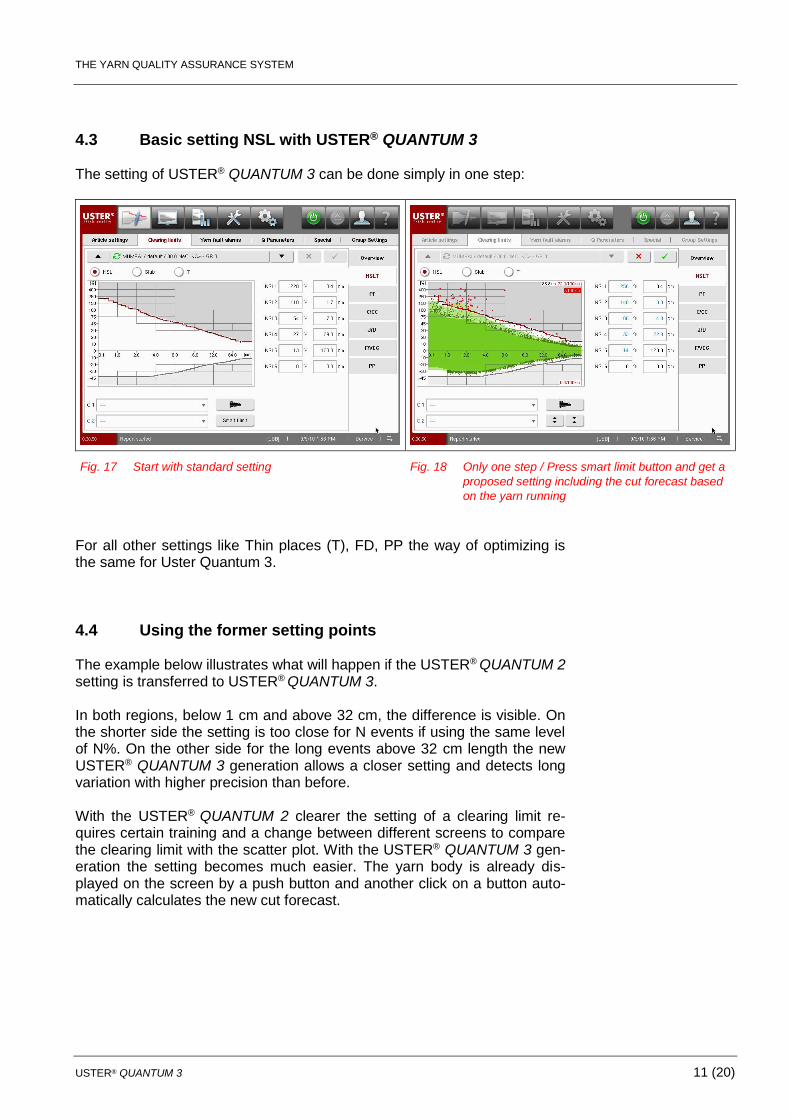
4.3 Basic setting NSL with USTER® QUANTUM 3 The setting of USTER® QUANTUM 3 can be done simply in one step:
Fig. 17 Start with standard setting Fig. 18 Only one step / Press smart limit button and get a
proposed setting including the cut forecast based
on the yarn running
For all other settings like Thin places (T), FD, PP the way of optimizing is the same for Uster Quantum 3.
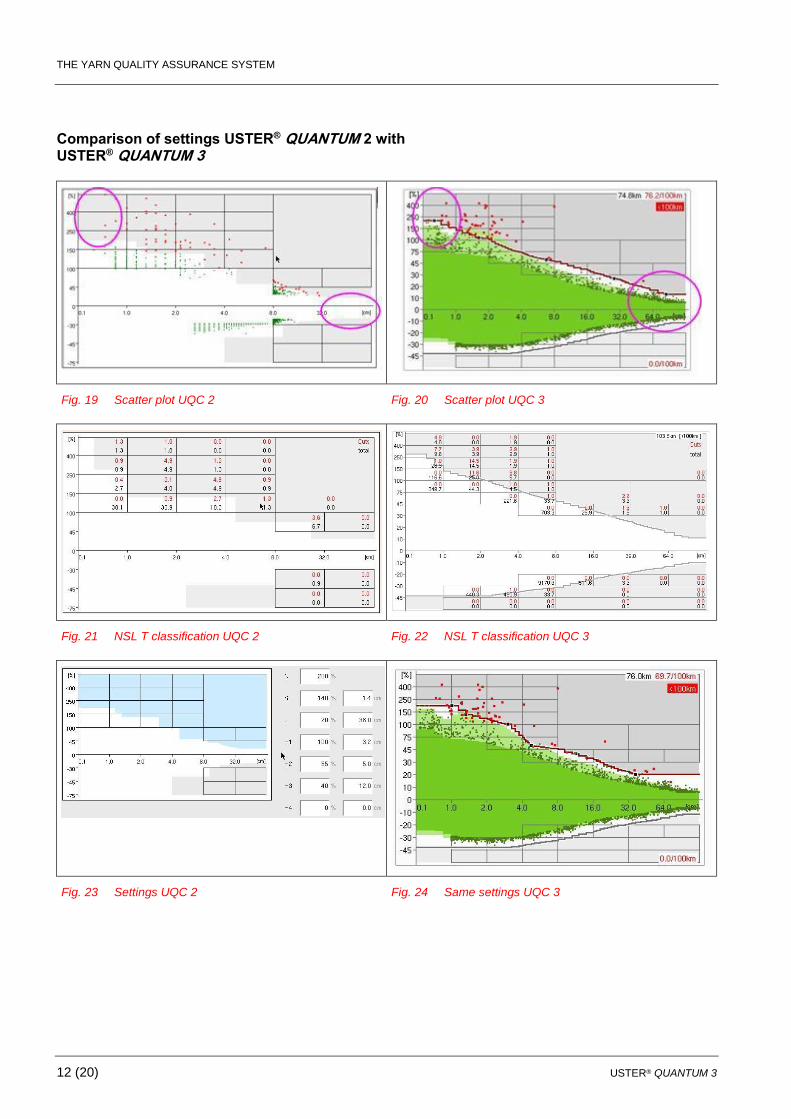
4.4 Using the former setting points The example below illustrates what will happen if the USTER® QUANTUM 2 setting is transferred to USTER® QUANTUM 3. In both regions, below 1 cm and above 32 cm, the difference is visible. On the shorter side the setting is too close for N events if using the same level of N%. On the other side for the long events above 32 cm length the new USTER® QUANTUM 3 generation allows a closer setting and detects long variation with higher precision than before. With the USTER® QUANTUM 2 clearer the setting of a clearing limit re-quires certain training and a change between different screens to compare the clearing limit with the scatter plot. With the USTER® QUANTUM 3 gen-eration the setting becomes much easier. The yarn body is already dis-played on the screen by a push button and another click on a button auto-matically calculates the new cut forecast.
THE YARN QUALITY ASSURANCE SYSTEM
12 (20) USTER® QUANTUM 3
Comparison of settings USTER® QUANTUM 2 with USTER® QUANTUM 3
Fig. 19 Scatter plot UQC 2 Fig. 20 Scatter plot UQC 3
Fig. 21 NSL T classification UQC 2 Fig. 22 NSL T classification UQC 3
Fig. 23 Settings UQC 2 Fig. 24 Same settings UQC 3
THE YARN QUALITY ASSURANCE SYSTEM
USTER® QUANTUM 3 13 (20)
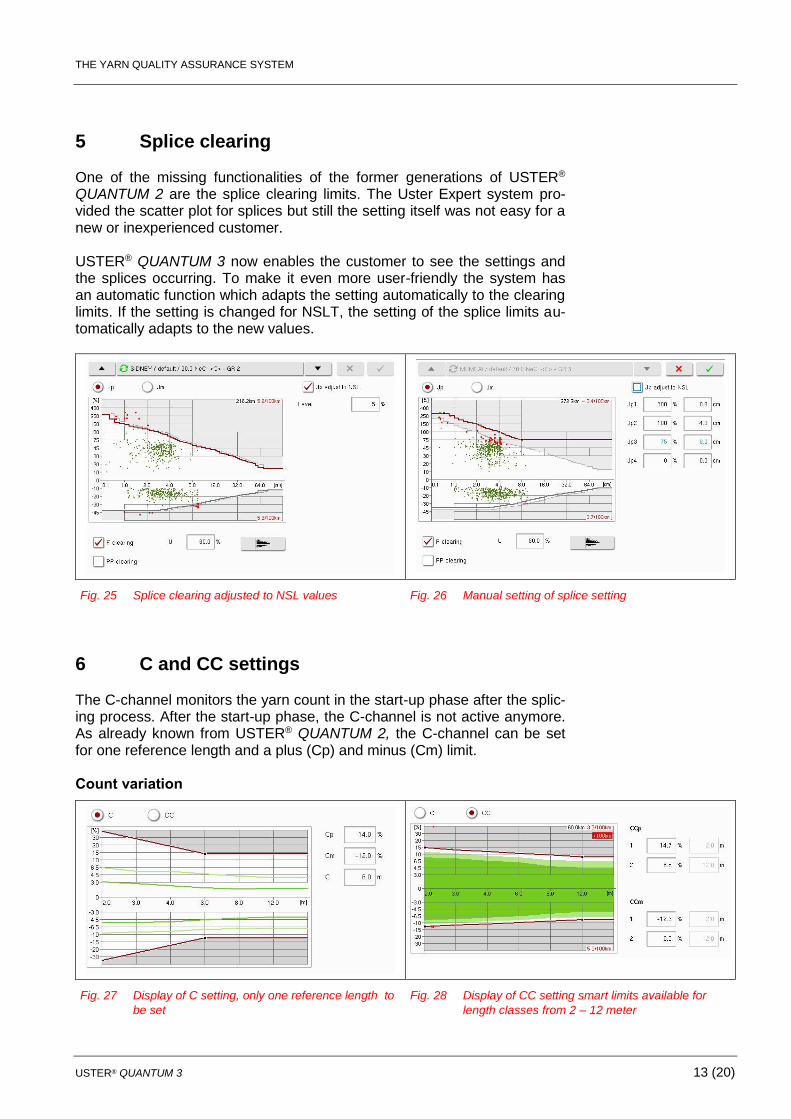
5 Splice clearing One of the missing functionalities of the former generations of USTER®
QUANTUM 2 are the splice clearing limits. The Uster Expert system pro-vided the scatter plot for splices but still the setting itself was not easy for a new or inexperienced customer. USTER® QUANTUM 3 now enables the customer to see the settings and the splices occurring. To make it even more user-friendly the system has an automatic function which adapts the setting automatically to the clearing limits. If the setting is changed for NSLT, the setting of the splice limits au-tomatically adapts to the new values.
Fig. 25 Splice clearing adjusted to NSL values Fig. 26 Manual setting of splice setting
6 C and CC settings The C-channel monitors the yarn count in the start-up phase after the splic-ing process. After the start-up phase, the C-channel is not active anymore. As already known from USTER® QUANTUM 2, the C-channel can be set for one reference length and a plus (Cp) and minus (Cm) limit. Count variation
Fig. 27 Display of C setting, only one reference length to
be set
Fig. 28 Display of CC setting smart limits available for
length classes from 2 – 12 meter
THE YARN QUALITY ASSURANCE SYSTEM
14 (20) USTER® QUANTUM 3
The CC-channel monitors the yarn count during the whole winding process. Depending on the setting long yarn faults with a small mass or diameter increase can be detected. This new CC-channel is able to detect and re-move count variations at different cut length between 2 m and 12 m. For the CC-channel a smart limit proposal is available to find a good setting taking the variation of the current production into consideration.
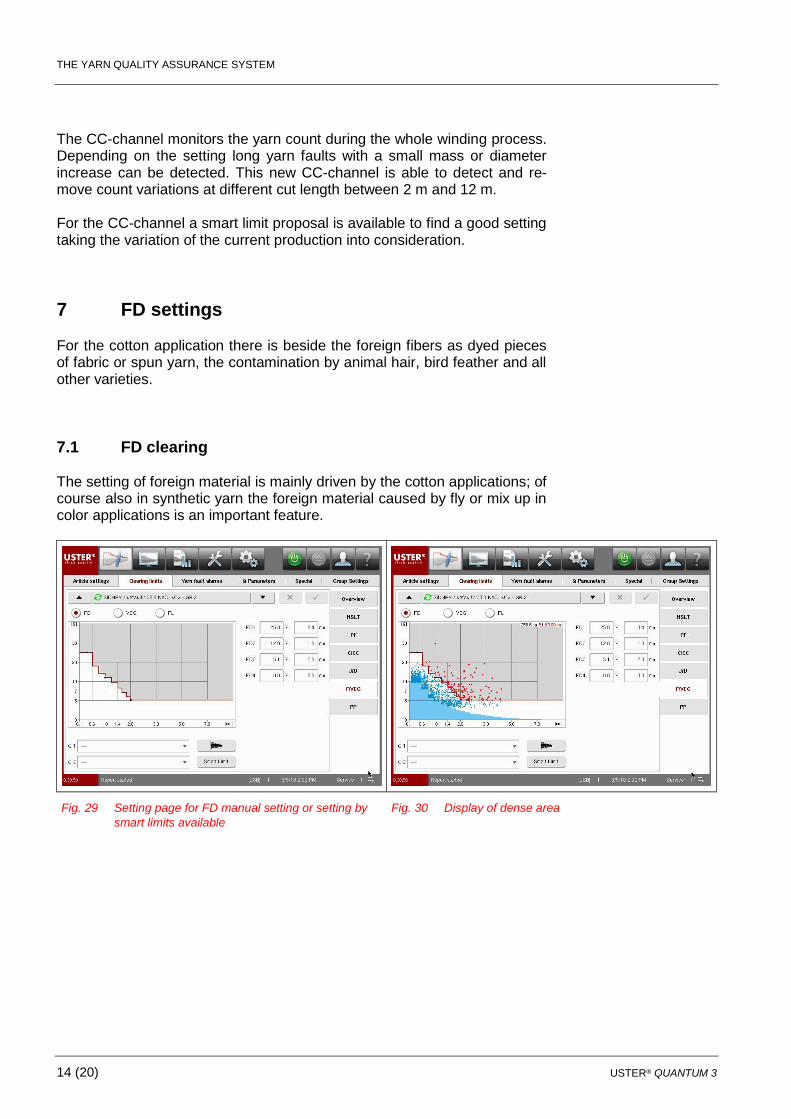
7 FD settings For the cotton application there is beside the foreign fibers as dyed pieces of fabric or spun yarn, the contamination by animal hair, bird feather and all other varieties.
7.1 FD clearing The setting of foreign material is mainly driven by the cotton applications; of course also in synthetic yarn the foreign material caused by fly or mix up in color applications is an important feature.
Fig. 29 Setting page for FD manual setting or setting by
smart limits available
Fig. 30 Display of dense area
THE YARN QUALITY ASSURANCE SYSTEM
USTER® QUANTUM 3 15 (20)
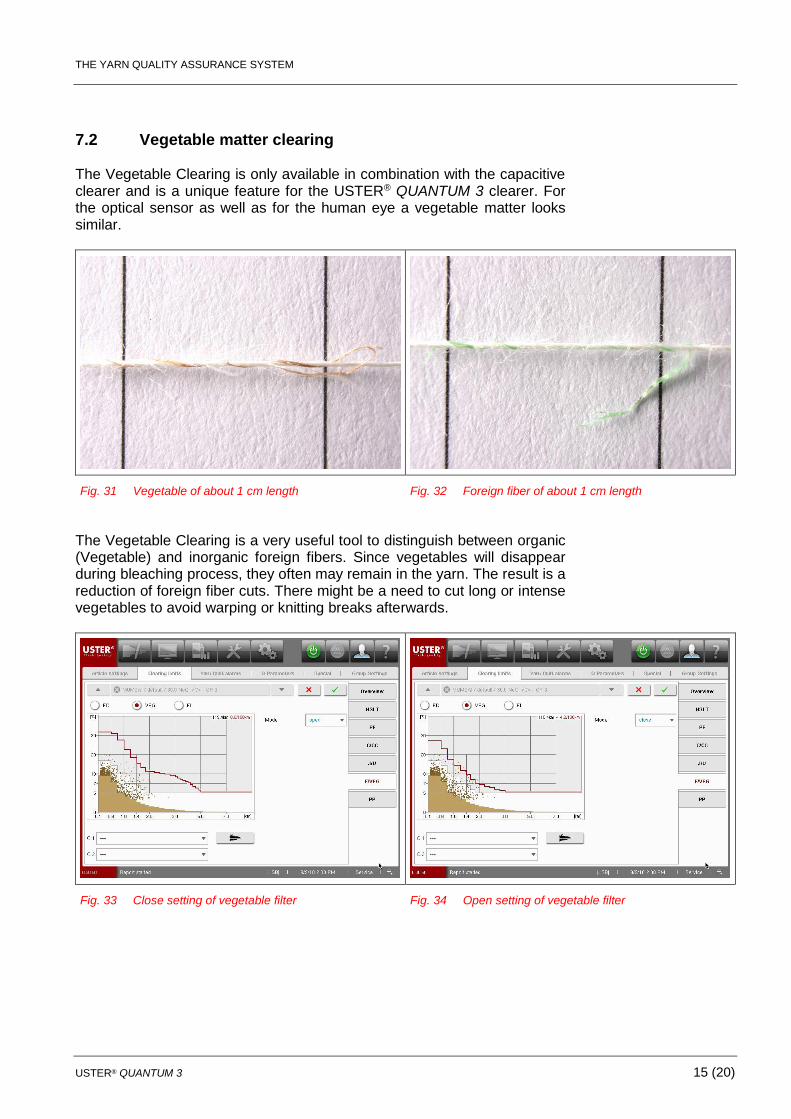
7.2 Vegetable matter clearing The Vegetable Clearing is only available in combination with the capacitive clearer and is a unique feature for the USTER® QUANTUM 3 clearer. For the optical sensor as well as for the human eye a vegetable matter looks similar.
Fig. 31 Vegetable of about 1 cm length Fig. 32 Foreign fiber of about 1 cm length
The Vegetable Clearing is a very useful tool to distinguish between organic (Vegetable) and inorganic foreign fibers. Since vegetables will disappear during bleaching process, they often may remain in the yarn. The result is a reduction of foreign fiber cuts. There might be a need to cut long or intense vegetables to avoid warping or knitting breaks afterwards.
Fig. 33 Close setting of vegetable filter Fig. 34 Open setting of vegetable filter
THE YARN QUALITY ASSURANCE SYSTEM
16 (20) USTER® QUANTUM 3
The USTER® QUANTUM 3 has vegetable clearing with a dense area and three setting possibilities.
Close: Only small vegetables are remains in the yarn, small saving of FD cuts.
Medium: Small to medium vegetables remains in the yarn. Reduction of FD cuts to a good extends.
Open: Most of the vegetables remain in the yarn and the highest saving of cuts will be reached.
Off: The vegetable clearing is switched off.
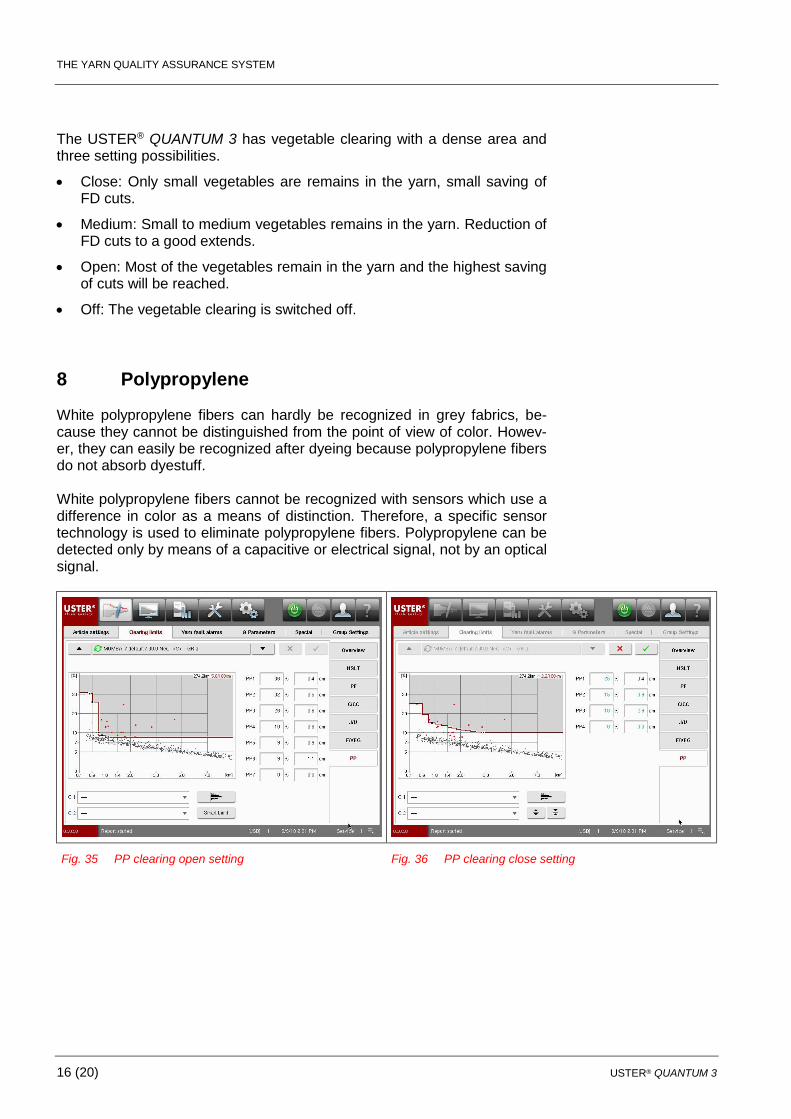
8 Polypropylene White polypropylene fibers can hardly be recognized in grey fabrics, be-cause they cannot be distinguished from the point of view of color. Howev-er, they can easily be recognized after dyeing because polypropylene fibers do not absorb dyestuff. White polypropylene fibers cannot be recognized with sensors which use a difference in color as a means of distinction. Therefore, a specific sensor technology is used to eliminate polypropylene fibers. Polypropylene can be detected only by means of a capacitive or electrical signal, not by an optical signal.
Fig. 35 PP clearing open setting Fig. 36 PP clearing close setting
THE YARN QUALITY ASSURANCE SYSTEM
USTER® QUANTUM 3 17 (20)
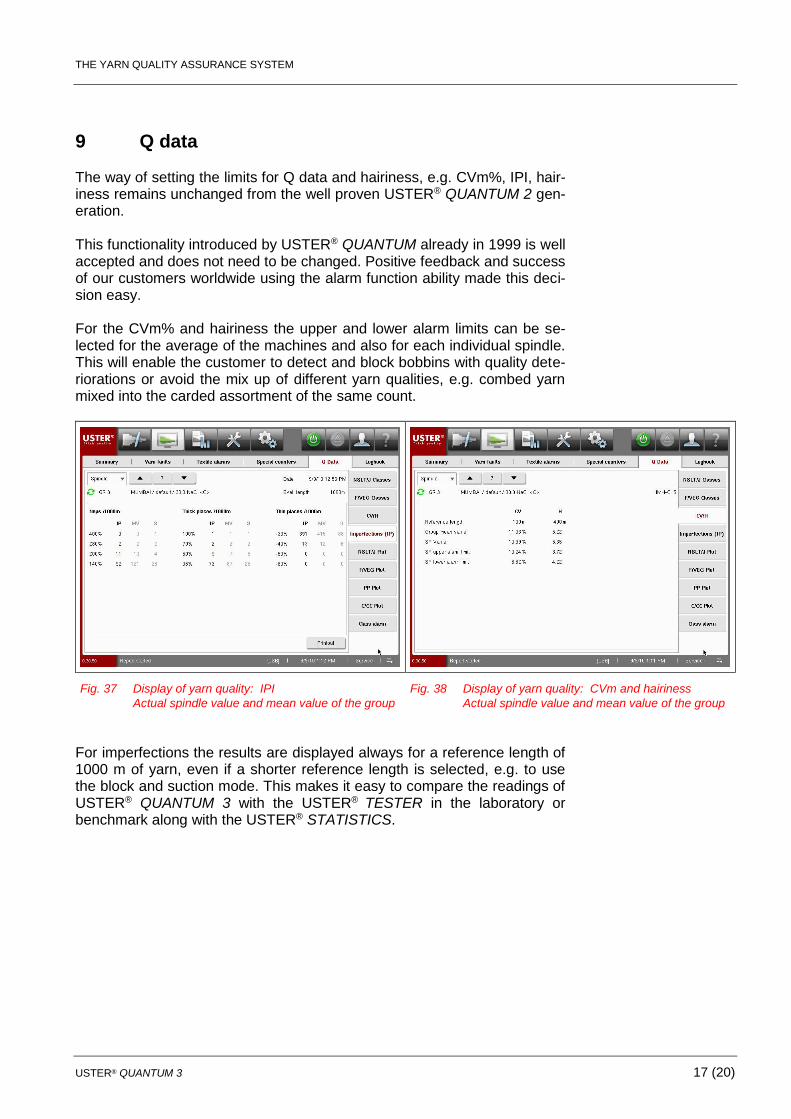
9 Q data The way of setting the limits for Q data and hairiness, e.g. CVm%, IPI, hair-iness remains unchanged from the well proven USTER® QUANTUM 2 gen-eration. This functionality introduced by USTER® QUANTUM already in 1999 is well accepted and does not need to be changed. Positive feedback and success of our customers worldwide using the alarm function ability made this deci-sion easy. For the CVm% and hairiness the upper and lower alarm limits can be se-lected for the average of the machines and also for each individual spindle. This will enable the customer to detect and block bobbins with quality dete-riorations or avoid the mix up of different yarn qualities, e.g. combed yarn mixed into the carded assortment of the same count.
Fig. 37 Display of yarn quality: IPI
Actual spindle value and mean value of the group
Fig. 38 Display of yarn quality: CVm and hairiness
Actual spindle value and mean value of the group
For imperfections the results are displayed always for a reference length of 1000 m of yarn, even if a shorter reference length is selected, e.g. to use the block and suction mode. This makes it easy to compare the readings of USTER® QUANTUM 3 with the USTER® TESTER in the laboratory or benchmark along with the USTER® STATISTICS.
THE YARN QUALITY ASSURANCE SYSTEM
18 (20) USTER® QUANTUM 3
THE YARN QUALITY ASSURANCE SYSTEM
USTER® QUANTUM 3 19 (20)
THE YARN QUALITY ASSURANCE SYSTEM
20 (20) USTER® QUANTUM 3
Uster Technologies AG Sonnenbergstrasse 10 CH-8610 Uster / Switzerland Phone +41 43 366 36 36 Fax +41 43 366 36 37 www.uster.com