comparison of traditional and machine learning base
TRANSCRIPT
COMPARISON OF TRADITIONAL AND MACHINE LEARNING BASE METHODS
FOR GROUND POINT CLOUD LABELING
S. M. Ayazi *, M. SaadatSeresht
School of Surveying and Geospatial Engineering, College of Engineering, University of Tehran, Iran – (smayazi,
msaadat)@gmail.com
Commission III, WG III/2
KEY WORDS: Point Cloud, Filtering, Machine Learning, DTM Extraction,
ABSTRACT:
Today, a variety of methods have been proposed by researchers to distinguish ground and non-ground points in point cloud data.
Most fully automated methods have a common disadvantage which is the lack of proper algorithm response for all areas and levels of
the ground, so most of these algorithms have good outcomes in simple landscapes but encounter problems in complex landscapes.
Point cloud filtering techniques can be divided into two general rule-based and novel methods. Today, the use of machine learning
techniques has improved the results of classification, which has led to significant results, especially when data can be labelled at the
presence of training data. In this paper, firstly, altimeter and radiometric features are extracted from the LiDAR data and the point
cloud derived from digital photogrammetry. Then, these features are participated in a classification process using SVM learning and
random forest methods, and the ground and Non-ground points are classified. The classification results using this method on LiDAR
data show a total error of 6.2%, a type I error of 5.4%, and a type II error of 13.2%. The comparison of the proposed method with the
results of LASTools software shows a reduction in total error and type I error (while increasing the type II error). This method was
also investigated on the dense point cloud obtained from digital photogrammetry and based on this study, the total was 7.2%, the
type I error was 6.8%, and the type II error was 10.9%.
* Corresponding author
1. INTRUDUCTION
1.1 Background
Photogrammetry, with an age of more than a hundred years, has
been used as one of the world's largest spatial data sources due
to the advancements of high resolution digital areal camera, [1].
The preparation of 3D maps, Orthophoto, DTM Generation and
High Resolution Point Cloud Extraction include the digital
photogrammetry achievements, and with advancements in
technology, its automation chain has been completed [2]. In
addition to digital photogrammetric methods, processing and
deploying LiDAR data has been widely studied with its
extensive applications, including DTM extraction.
Three-dimensional point cloud derived from digital
photogrammetry and LiDAR include ground and non-ground
points, and therefore the first step in the production of digital
ground model from point cloud data, includes the identification
of ground points and the removal of non-ground points, which
is called point cloud filtering, which its automation is faced
with challenges due to the diversity of terrain features and
topography [3-5]. Various methods have been suggested by
different researchers to distinguish between ground and non-
ground points in the point cloud data. The disadvantage of most
fully automated methods for identifying ground and non-ground
points is for a particular type of ground. In other words, most of
these algorithms have good outcomes in simple landscapes and
encounter problems in complex landscapes. [6]. Obviously,
region type important for the type of algorithm used, in terms of
feature diversification and density of regions such as urban,
non-urban, forest, sloped, flat, etc., and will affect the amount
of automation of operations. In spite of extensive research on
cloud computing, extraction of a digital ground model from
large data with complex landscape is still a challenge for
researchers [7, 8]. For example, the use of a limited set of
parameters does not yield proper results for ground with
discrete and complex surfaces, as well as different features.
1.2 Related Work
Various methods have been proposed by different researchers to
distinguish non-ground and ground points in the point cloud
data. When using these methods, considerations should be made
such as the details of performed preprocessing, structure of
input data, and other influential parameters [9]. The methods for
filtering point cloud data according to performance are divided
into several categories: rule-base methods, novel learning
methods. [10, 11]
Rule base filtering methods include methods that are mainly
based on the physical behavior of non-ground features. This
group can be categorized to slope-based methods, methods
based on mathematical morphology, baseline methods, (TIN)
triangulated irregular network based methods, segmentation and
clustering methods, and other methods which are mainly
improvements of the above or independently have a special
feature.
In recent years, machine learning algorithms have been widely
used to classify images. In modern methods, geometric and
radiometric features of each point can be used to trained
classification.
The International Archives of the Photogrammetry, Remote Sensing and Spatial Information Sciences, Volume XLII-4/W18, 2019 GeoSpatial Conference 2019 – Joint Conferences of SMPR and GI Research, 12–14 October 2019, Karaj, Iran
This contribution has been peer-reviewed. https://doi.org/10.5194/isprs-archives-XLII-4-W18-141-2019 | © Authors 2019. CC BY 4.0 License.
141
The results of learning methods performance in the filtering
topic show that these methods are more effective than the Rule
Based algorithms and represent the high potential of learning-
based approaches in point cloud filtering. Extracting highly
efficient and effective features for use in machine learning
methods with the objective of classifying ground and non-
ground points seems to have better results. [12-14].
Chehata has used four features of anisotropy, planarity,
sphereocity and Linearity for the implementation of random
forest method. These features are derived based on the Eigen
values of the variance-covariance matrix calculated for a
neighborhood window with a given radius. In addition to these
four features, altitude and recursive pulse characteristics are
also used to train this method. The random forest classification
method in this research has achieved a total accuracy of 94.35%
which is a good result compared to Rule Based methods [15].
Niemeyer has used the Conditional Random Field (CRF)
method to classify point cloud and made a complete study of
classification using classifiers, features, and different
neighborhoods. Most of the investigative methods in this
research are monitored and not only classify clusters into
ground and non-ground classes, but also classify many other
classes. The CRF method provides the ability to combine
textual information and learn specific communications of
ground objects in the training phase. Therefore, this is a
powerful algorithm for obtaining reliable results even in
complex urban landscapes. [16].
The results of the performance of learning methods in the
filtering topic show that these methods are more effective than
the Rule Based algorithms and represent the high potential of
learning-based approaches in point cloud filtering. The
extraction of high-performance effective features for use in
machine learning methods leads to better results in the
classification of ground and non-ground points. [12-14]
2. PROPOSED METHOD
2.1 Machine learning algorithm
The machine learning techniques are a subset of artificial
intelligence and, using these techniques, the computer learns the
patterns available in the features and can use them. Nowadays,
the use of machine learning techniques has been significantly
developed in improving the classification results, which has led
to significant results in the application of these methods,
especially for data which can be labelled as training data.
In this paper, two SVM and random forest methods have been
used for this purpose.
2.1.1 SVM Algorithm
The SVM algorithm has been developed as one of the solutions
to machine learning. SVM performs its predictions using a
linear combination of the kernel function which acts on a set of
training data, namely the support vectors. The method presented
by SVM is different than comparable methods such as neural
networks; SVM training always finds the global minimum. The
features of an SVM are greatly related to its kernel selection.
2.1.2 Random Forest Algorithm
Random forest algorithm is also an ensemble learning algorithm
that uses decision trees for its simple and weak algorithms. In
the random forest algorithm, several decision trees are used. In
fact, a set of decision trees produce a forest together and this
forest can make better decisions. To classify a data based on its
characteristics, the data is given to each tree, and a tree is asked
to "vote" for that class. The forest selects the classification that
has the highest vote for all forest trees.
The decision trees were introduced in 2001 as one of the
machine learning methods that combines the prediction of
multiple single algorithms together using rule based methods.
[18]
Random forest is a very useful and easy to use algorithm,
because its default hyperparameters often produce good
predictive results. Also, the number of its hyperparameters is
not high and is easy to understand. [19]
One of the biggest problems in machine learning is over-
processing, but it often does not happen as easily as it happens
for random forest categorizer. In general, training these
algorithms is quickly achieved.
Another feature of the random forest is that the trees grow
without pruning, and in this way, training does not affect the
accuracy of the model too much and makes it simpler in terms
of computation.
The points of the study area are classified using the extracted
features and the random forest classification method into two
classes of ground and non-ground points.
2.2 Feature extraction
Extraction is the first step in any learning system to create an
input vector to the classification algorithm. To do this, first, the
proper attributes should be extracted from the point cloud, to be
used in the learning algorithm. The type of features has a direct
impact on the classification result. In this research, two types of
features are extracted from point cloud data: point features and
neighborhood features. [20]
Point features are individually derived from information of each
point, such as altitude, density, color information about the
point cloud derived from optical sensors, and IR band values
and other radiometric information in case of available
multispectral and hyperspectral resources.
Neighborhood features include the topographic and radiometric
information of the nearest neighboring points that indicate the
morphology related to the shape of the ground or its features at
that point. It also extracts statistical information about
neighboring points such as minimum and maximum altitudes, as
well as mean and standard deviation of points’ altitude.
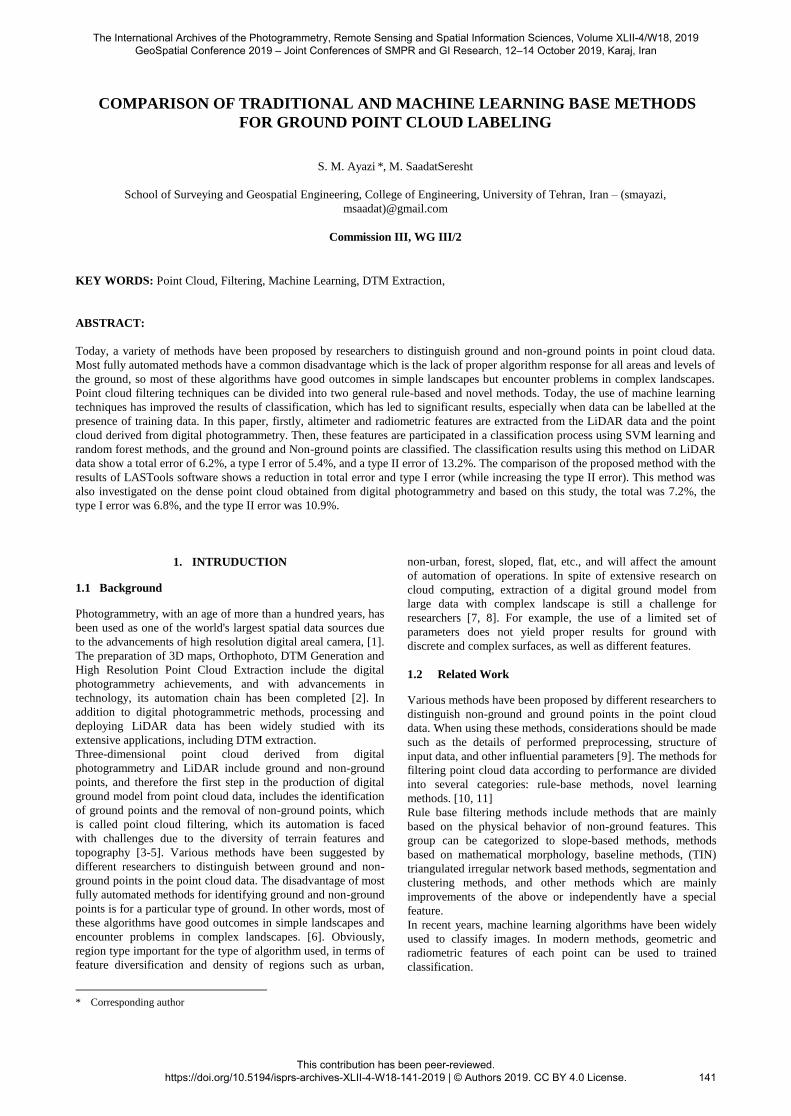
According to the data studied in this research, eight features
including five point features (two elevation features and three
radiometric features) and three neighborhood features related to
points altitude are extracted from the point cloud data. [21, 22]
Table 1 shows the extracted features from the point cloud in this
research. Regarding the investigation of the implementation of the
proposed algorithm on two types of LiDAR data and the point
cloud derived from a digital photogrammetric, in this paper and
in the LiDAR data, only geometric features and in the point
cloud, all eight features are extracted.
2.3 Training & Testing
After extracting the feature, the sample data from each of the
ground and non-ground classes are randomly selected. Here,
40% of the data is considered as training data for designing the
classifier of machine learning and 60% of the data as check data
for investigating the classifier accuracy. Choosing the right
training data is very important in achieving the proper accuracy.
The International Archives of the Photogrammetry, Remote Sensing and Spatial Information Sciences, Volume XLII-4/W18, 2019 GeoSpatial Conference 2019 – Joint Conferences of SMPR and GI Research, 12–14 October 2019, Karaj, Iran
This contribution has been peer-reviewed. https://doi.org/10.5194/isprs-archives-XLII-4-W18-141-2019 | © Authors 2019. CC BY 4.0 License.
142
Function Feature Name Feature Type
Normalized Height 1
Geometry
Point Features
Normalized Height 2
Normalized Intensity 1
Radiometric
Normalized Intensity 2
NDVI
Slop
Geometry Neighborhood
Features
Roughness
Curvature
Table 1. the extracted features from point cloud
3. DATASET
In this paper, the results of the proposed method are examined
on two datasets: ISPRS Filter Test Dataset and Dehbar Dataset
ISPRS Filter Test dataset is a LIDAR data and Dehbar dataset is
a point cloud derived from digital photogrammetry.
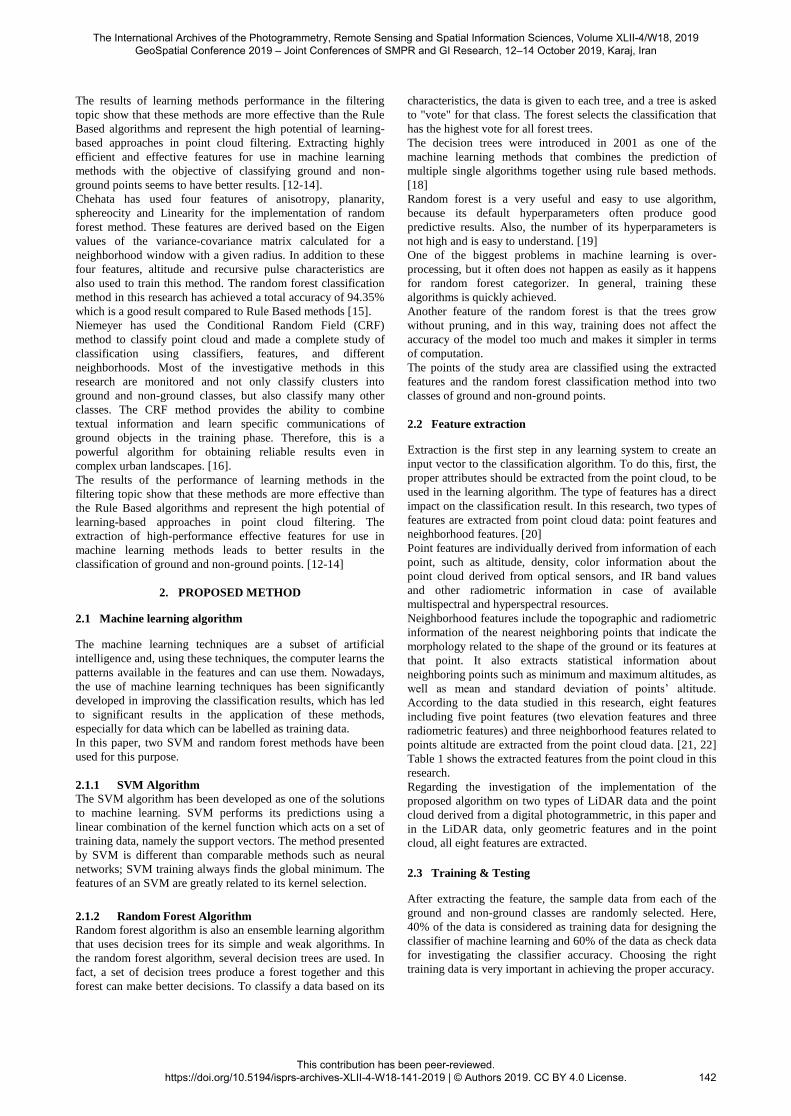
3.1 ISPRS Filter Test dataset
The ISPRS dataset contains 15 LiDAR data sample areas.
The ISPRS dataset has 15 sample areas. From the 15 samples,
ten sample areas were chosen for training and five sample areas
for testing. Figure 6 shows the five testing samples.
The dataset has a low point density. This causes the terrain to be
poorly represented, especially on a combination of steep terrain
and low vegetation. There are only two returns, first and last, in
contrast to five multiple returns on a typical modern LIDAR
point cloud. Fewer returns mean less information is available to
separate vegetation from the ground. This situation makes the
dataset more challenging for ground classification.
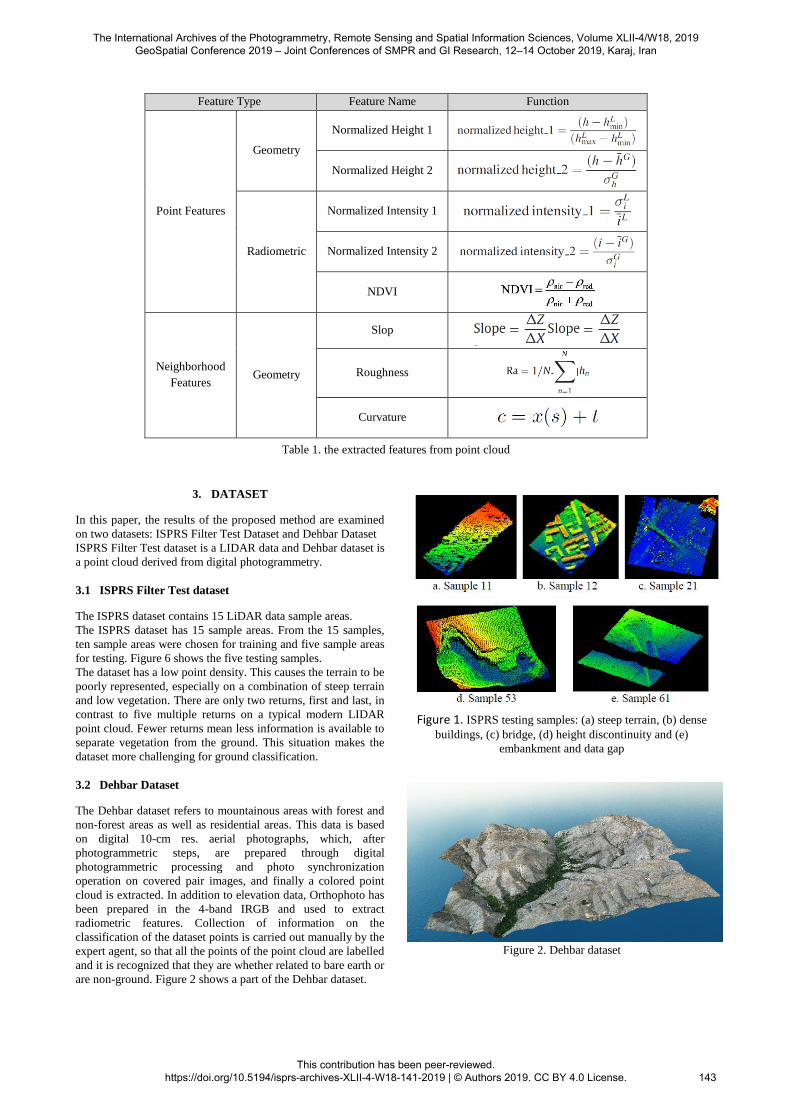
3.2 Dehbar Dataset
The Dehbar dataset refers to mountainous areas with forest and
non-forest areas as well as residential areas. This data is based
on digital 10-cm res. aerial photographs, which, after
photogrammetric steps, are prepared through digital
photogrammetric processing and photo synchronization
operation on covered pair images, and finally a colored point
cloud is extracted. In addition to elevation data, Orthophoto has
been prepared in the 4-band IRGB and used to extract
radiometric features. Collection of information on the
classification of the dataset points is carried out manually by the
expert agent, so that all the points of the point cloud are labelled
and it is recognized that they are whether related to bare earth or
are non-ground. Figure 2 shows a part of the Dehbar dataset.
Figure 1. ISPRS testing samples: (a) steep terrain, (b) dense
buildings, (c) bridge, (d) height discontinuity and (e)
embankment and data gap
Figure 2. Dehbar dataset
The International Archives of the Photogrammetry, Remote Sensing and Spatial Information Sciences, Volume XLII-4/W18, 2019 GeoSpatial Conference 2019 – Joint Conferences of SMPR and GI Research, 12–14 October 2019, Karaj, Iran
This contribution has been peer-reviewed. https://doi.org/10.5194/isprs-archives-XLII-4-W18-141-2019 | © Authors 2019. CC BY 4.0 License.
143
4. RESULT AND DESCUSION
This section explains the results of the implementation of SVM
and RF algorithms, the evaluation of accuracy and comparison
of computational costs. The results are compared with the
classification derived from the LAStools software, which uses
the TIN method for filtering and is considered to be the best
filtering method.
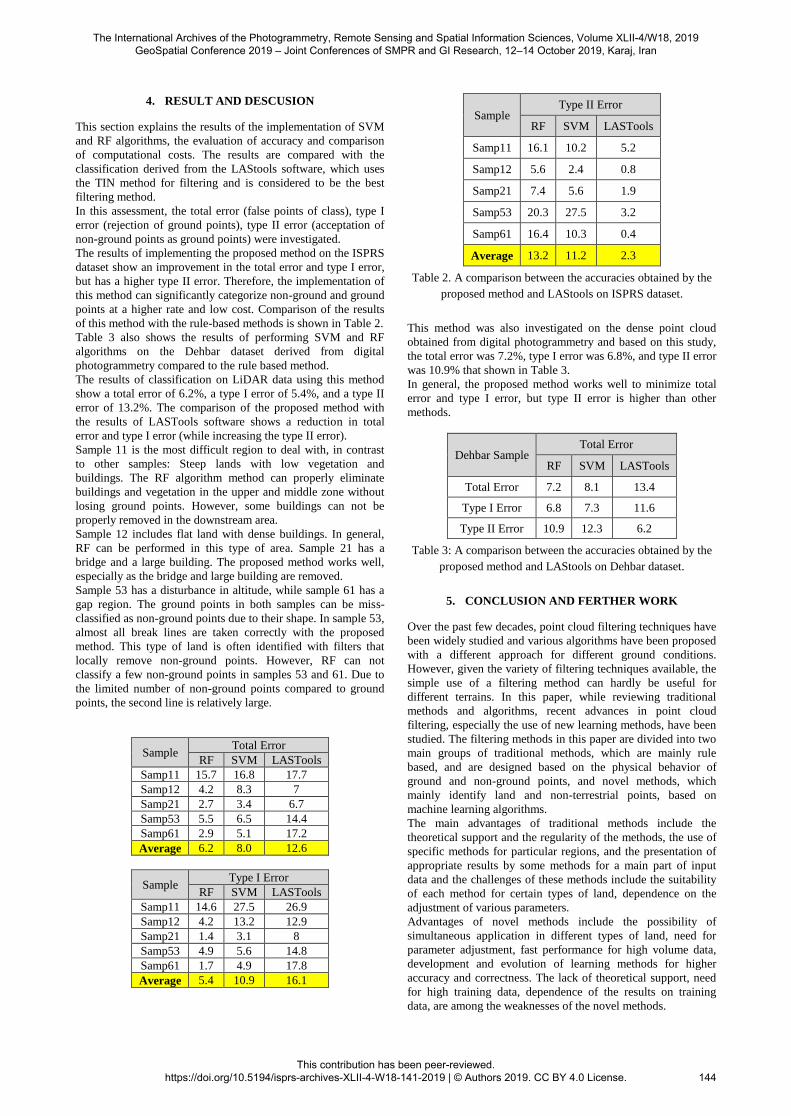
In this assessment, the total error (false points of class), type I
error (rejection of ground points), type II error (acceptation of
non-ground points as ground points) were investigated.
The results of implementing the proposed method on the ISPRS
dataset show an improvement in the total error and type I error,
but has a higher type II error. Therefore, the implementation of
this method can significantly categorize non-ground and ground
points at a higher rate and low cost. Comparison of the results
of this method with the rule-based methods is shown in Table 2.
Table 3 also shows the results of performing SVM and RF
algorithms on the Dehbar dataset derived from digital
photogrammetry compared to the rule based method.
The results of classification on LiDAR data using this method
show a total error of 6.2%, a type I error of 5.4%, and a type II
error of 13.2%. The comparison of the proposed method with
the results of LASTools software shows a reduction in total
error and type I error (while increasing the type II error).
Sample 11 is the most difficult region to deal with, in contrast
to other samples: Steep lands with low vegetation and
buildings. The RF algorithm method can properly eliminate
buildings and vegetation in the upper and middle zone without
losing ground points. However, some buildings can not be
properly removed in the downstream area.
Sample 12 includes flat land with dense buildings. In general,
RF can be performed in this type of area. Sample 21 has a
bridge and a large building. The proposed method works well,
especially as the bridge and large building are removed.
Sample 53 has a disturbance in altitude, while sample 61 has a
gap region. The ground points in both samples can be miss-
classified as non-ground points due to their shape. In sample 53,
almost all break lines are taken correctly with the proposed
method. This type of land is often identified with filters that
locally remove non-ground points. However, RF can not
classify a few non-ground points in samples 53 and 61. Due to
the limited number of non-ground points compared to ground
points, the second line is relatively large.
Total Error Sample
LASTools SVM RF
17.7 16.8 15.7 Samp11
7 8.3 4.2 Samp12
6.7 3.4 2.7 Samp21
14.4 6.5 5.5 Samp53
17.2 5.1 2.9 Samp61
12.6 8.0 6.2 Average
Type I Error Sample
LASTools SVM RF
26.9 27.5 14.6 Samp11
12.9 13.2 4.2 Samp12
8 3.1 1.4 Samp21
14.8 5.6 4.9 Samp53
17.8 4.9 1.7 Samp61
16.1 10.9 5.4 Average
Type II Error Sample
LASTools SVM RF
5.2 10.2 16.1 Samp11
0.8 2.4 5.6 Samp12
1.9 5.6 7.4 Samp21
3.2 27.5 20.3 Samp53
0.4 10.3 16.4 Samp61
2.3 11.2 13.2 Average
Table 2. A comparison between the accuracies obtained by the
proposed method and LAStools on ISPRS dataset.
This method was also investigated on the dense point cloud
obtained from digital photogrammetry and based on this study,
the total error was 7.2%, type I error was 6.8%, and type II error
was 10.9% that shown in Table 3.
In general, the proposed method works well to minimize total
error and type I error, but type II error is higher than other
methods.
Total Error Dehbar Sample
LASTools SVM RF
13.4 8.1 7.2 Total Error
11.6 7.3 6.8 Type I Error
6.2 12.3 10.9 Type II Error
Table 3: A comparison between the accuracies obtained by the
proposed method and LAStools on Dehbar dataset.
5. CONCLUSION AND FERTHER WORK
Over the past few decades, point cloud filtering techniques have
been widely studied and various algorithms have been proposed
with a different approach for different ground conditions.
However, given the variety of filtering techniques available, the
simple use of a filtering method can hardly be useful for
different terrains. In this paper, while reviewing traditional
methods and algorithms, recent advances in point cloud
filtering, especially the use of new learning methods, have been
studied. The filtering methods in this paper are divided into two
main groups of traditional methods, which are mainly rule
based, and are designed based on the physical behavior of
ground and non-ground points, and novel methods, which
mainly identify land and non-terrestrial points, based on
machine learning algorithms.
The main advantages of traditional methods include the
theoretical support and the regularity of the methods, the use of
specific methods for particular regions, and the presentation of
appropriate results by some methods for a main part of input
data and the challenges of these methods include the suitability
of each method for certain types of land, dependence on the
adjustment of various parameters.
Advantages of novel methods include the possibility of
simultaneous application in different types of land, need for
parameter adjustment, fast performance for high volume data,
development and evolution of learning methods for higher
accuracy and correctness. The lack of theoretical support, need
for high training data, dependence of the results on training
data, are among the weaknesses of the novel methods.
The International Archives of the Photogrammetry, Remote Sensing and Spatial Information Sciences, Volume XLII-4/W18, 2019 GeoSpatial Conference 2019 – Joint Conferences of SMPR and GI Research, 12–14 October 2019, Karaj, Iran
This contribution has been peer-reviewed. https://doi.org/10.5194/isprs-archives-XLII-4-W18-141-2019 | © Authors 2019. CC BY 4.0 License.
144
In this paper, we compare the performance of machine learning
methods with rule-based methods and better performance of
these methods is revealed in comparison with traditional
methods. Due to the importance of the features used in learning
algorithms, the use of deep learning methods is recommended
for automatic extraction of the feature.
In the end, the main strategy of this paper, which includes the
previous three strategies, is the use of novel deep learning
methods, in which, besides the possibility of using various
information resources, it is possible to apply preprocessing
methods. For example, performing some traditional methods on
data and focusing on data and points with complexities, and
then using machine learning methods to speed up is suggested.
REFERENCES
[1] K. Nurminen et al., "Automation Aspects for the
Georeferencing of Photogrammetric Aerial Image Archives in
Forested Scenes," Remote Sensing, vol. 7, no. 2, pp. 1565-
1593, 2015/02/02 2015.
[2] C. Heipke, M. Madden, Z. Li, and I. Dowman, "Theme
issue “State-of-the-art in photogrammetry, remote sensing and
spatial information science”," ISPRS Journal of
Photogrammetry and Remote Sensing, vol. 115, pp. 1-2,
2016/05 2016.
[3] G. Sithole and G. Vosselman, "Experimental comparison of
filter algorithms for bare-Earth extraction from airborne laser
scanning point clouds," ISPRS Journal of Photogrammetry and
Remote Sensing, vol. 59, no. 1-2, pp. 85-101, 2004/08 2004.
[4] K. Zhang and D. Whitman, "Comparison of Three
Algorithms for Filtering Airborne Lidar Data,"
Photogrammetric Engineering & Remote Sensing, vol. 71, no.
3, pp. 313-324, 2005/03/01 2005.
[5] M. Bartels and H. Wei, "Threshold-free object and ground
point separation in LIDAR data," Pattern Recognition Letters,
vol. 31, no. 10, pp. 1089-1099, 2010/07 2010.
[6] X. Liu, "Airborne LiDAR for DEM generation: some
critical issues," Progress in Physical Geography, vol. 32, no. 1,
pp. 31-49, 2008/02/01 2008.
[7] Z. Chen, B. Devereux, B. Gao, and G. Amable, "Upward-
fusion urban DTM generating method using airborne Lidar
data," ISPRS journal of photogrammetry and remote sensing,
vol. 72, pp. 121-130, 2012.
[8] L. Wei-Lwun, K. P. Murphy, J. J. Little, A. Sheffer, and F.
Hongbo, "A Hybrid Conditional Random Field for Estimating
the Underlying Ground Surface From Airborne LiDAR Data,"
IEEE Trans. Geosci. Remote Sensing, vol. 47, no. 8, pp. 2913-
2922, 2009/08 2009.
[9] X. Meng, L. Wang, J. L. Silván-Cárdenas, and N. Currit, "A
multi-directional ground filtering algorithm for airborne
LIDAR," ISPRS Journal of Photogrammetry and Remote
Sensing, vol. 64, no. 1, pp. 117-124, 2009.
[10] G. Sithole and G. Vosselman, "Comparison of
filtering algorithms," in Proceedings of the ISPRS working
group III/3 workshop, 2003, pp. 71-78.
[11] X. Meng, N. Currit, and K. Zhao, "Ground Filtering
Algorithms for Airborne LiDAR Data: A Review of Critical
Issues," Remote Sensing, vol. 2, no. 3, pp. 833-860, 2010.
[12] A. Rizaldy, C. Persello, C. Gevaert, and S. Oude
Elberink, "FULLY CONVOLUTIONAL NETWORKS FOR
GROUND CLASSIFICATION FROM LIDAR POINT
CLOUDS," ISPRS Annals of Photogrammetry, Remote Sensing
& Spatial Information Sciences, vol. 4, no. 2, 2018.
[13] C. Gevaert, C. Persello, F. Nex, and G. Vosselman,
"A deep learning approach to DTM extraction from imagery
using rule-based training labels," ISPRS Journal of
Photogrammetry and Remote Sensing, vol. 142, pp. 106-123,
2018.
[14] X. Hu and Y. Yuan, "Deep-learning-based
classification for DTM extraction from ALS point cloud,"
Remote sensing, vol. 8, no. 9, p. 730, 2016.
[15] N. Chehata, L. Guo, and C. Mallet, "Airborne lidar
feature selection for urban classification using random forests,"
International Archives of Photogrammetry, Remote Sensing and
Spatial Information Sciences, vol. 38, no. Part 3, p. W8, 2009.
[16] J. Niemeyer, F. Rottensteiner, and U. Soergel,
"Conditional random fields for lidar point cloud classification in
complex urban areas," ISPRS annals of the photogrammetry,
remote sensing and spatial information sciences, vol. 3, pp. 263-
268, 2012.
[17] J. Zhang, X. Lin, and X. Ning, "SVM-based
classification of segmented airborne LiDAR point clouds in
urban areas," Remote Sensing, vol. 5, no. 8, pp. 3749-3775,
2013.
[18] L. Breiman, "Random forests," Machine learning, vol.
45, no. 1, pp. 5-32, 2001.
[19] S. Kotsiantis and P. Pintelas, "Combining bagging
and boosting," International Journal of Computational
Intelligence, vol. 1, no. 4, pp. 324-333, 2004.
[20] S. H. H. Nourzad and A. Pradhan, "Binary and multi-
class classification of fused LIDAR-imagery data using an
ensemble method," in Construction Research Congress, 2012,
pp. 909-918.
[21] S. H. H. Nourzad and A. Pradhan, "Ensemble
methods for binary classifications of airborne LiDAR data,"
Journal of Computing in Civil Engineering, vol. 28, no. 6, p.
04014021, 2012.
[22] S. K. Lodha, D. M. Fitzpatrick, and D. P. Helmbold,
"Aerial lidar data classification using adaboost," in 3-D Digital
Imaging and Modeling, 2007. 3DIM'07. Sixth International
Conference on, 2007: IEEE, pp. 435-442.
The International Archives of the Photogrammetry, Remote Sensing and Spatial Information Sciences, Volume XLII-4/W18, 2019 GeoSpatial Conference 2019 – Joint Conferences of SMPR and GI Research, 12–14 October 2019, Karaj, Iran
This contribution has been peer-reviewed. https://doi.org/10.5194/isprs-archives-XLII-4-W18-141-2019 | © Authors 2019. CC BY 4.0 License.
145