comparison of various knowledge-driven and logistic-based...
TRANSCRIPT
JME Journal of Mining & Environment, Vol.8, No.4, 2017, 611-629.
DOI: 10.22044/jme.2017.5345.1349
Comparison of various knowledge-driven and logistic-based mineral
prospectivity methods to generate Cu and Au exploration targets
Case study: Feyz-Abad area (North of Lut block, NE Iran)
S. Saadat
Department of Geology, Mashhad Branch, Islamic Azad University, Mashhad, Iran
Received 26 January 2017; received in revised form 5 July 2017; accepted 24 July 2017
Corresponding author: [email protected] (S. Saadat).
Abstract
Motivated by the recent successful results of using GIS modeling in a variety of problems related to the
geosciences, some knowledge-based methods were applied to a regional scale mapping of the mineral
potential, special for Cu-Au mineralization in the Feyz-Abad area located in the NE of Iran. Mineral
Prospectivity Mapping (MPM) is a multi-step process that ranks a promising target area for more
exploration. In this work, five integration methods were compared consisting of fuzzy, continuous fuzzy,
index overlay, AHP, and fuzzy AHP. For this purpose, geological maps, geochemical samples, and
geophysics data were collected, and a spatial database was constructed. ETM + images were used to extract
the hydroxyl and iron-oxide alterations, and to identify the linear and fault structures and prospective zones
in regional scale; ASTER images were used to extract SiO2 index, kaolinite, chlorite, and propylitic
alterations in a district scale. All the geological, geochemical, and geophysical data was integrated for MPM
by different analysis. The values were determined by expert knowledge or logistic functions. Based upon this
analysis, three main exploration targets were recognized in the Feyz-Abad district. Based on field
observation, MPM was proved to be valid. The prediction result is accurate, and can provide directions for
future prospecting. Among all the methods evaluated in this work, which tend to generate relatively similar
results, the continuous fuzzy model seems to be the best fit in the studied area because it is bias-free and can
be used to generate reliable target areas.
Keywords: Mineral Prospectivity Mapping, Fuzzy, AHP, Index Overlay, Feyz-Abad.
1. Introduction Lut block in eastern Iran is located along the
Alpine-Himalayan orogenic and metalogenic belt.
The tectonic setting, type of magmatism, and
history of ancient mining suggest a great potential
for different types of mineral deposits in the Lut
block. Due to the unsystematic mineral
exploration and lack of modern exploration
techniques, there are still several unexplored
outcropping of ore deposits in this area.
The Feyz-Abad area lies in the north of the Lut
block, NE Iran, with an approximate area of about
2500 km2. The sedimentary rocks in this area
belong to Paleozoic. A suite of ophiolitic rocks
(Cretaceous) is exposed in the northern part.
Pyroclastic and volcanic rocks (mainly
intermediate to felsic) are widespread all over in
this area. Volcanic activities occurred during the
Eocene time [1]. Post-Eocene magmatism is
mostly manifested by intrusion of granodiorite,
granite, and diorite into the volcanic rocks (Figure
1). There are three trends of faulting in this area:
east-west, north-east, and north-west.
Mineralization is mainly structurally controlled
and found along the faults and within the fault
zones [2].
Magmatism and metamorphic belt relate to arc
volcanism, with Late Mesozoic to Neogene
volcanic rocks distributed within. Different types

Saadat/ Journal of Mining & Environment, Vol.8, No.4, 2017
612
of porphyry, hydrothermal, and iron oxide
deposits have been identified along the
Khaf-Dorouneh volcanic and plutonic belt in
north-eastern Iran. Kuh-e-Zar is one of these ore
deposits known as an Fe-oxide gold deposit [3].
The gold and copper deposits in this structure
zone are strongly controlled by a large-scale fault
system.
The purpose of this work was to use the GIS
techniques to perform the analysis and to provide
maps for a better understanding of the
geochemical anomalies and mineral potentials
within the Feyz-Abad area, and to indicate the
best target for Mineral Prospectivity Mapping
(MPM) to specify the prospective regions. MPM
was recognized according to the metallogenic
conceptual model for the Au-Cu deposits.
Figure 1. Simplified geological map of Feyz-Abad area (original map from [1]).

Saadat/ Journal of Mining & Environment, Vol.8, No.4, 2017
613
2. Modeling Several approaches are applied for MPM, which
are classified as data-driven and
knowledge-driven methods [4-6].
Knowledge-driven predictive mapping of mineral
prospectivity is suitable in the regions that are
less-explored geologically, where no or very few
known mineral deposits occurred [7]. In
knowledge-driven prediction, the assigned
weights to every spatial evidence layer are based
upon a geoscientist's knowledge. In contrast,
data-driven predictive mapping of mineral
prospectivity is suitable in the regions that are
moderately-to-well explored, where the main
objective is to restrict new targets in order to
explore undiscovered mineral deposits of the type
sought (e.g. [8]). Some examples of these methods
are Boolean logic [9], index overlay [9],
Dempster-Shafer belief theory [10], and fuzzy
logic [11]. In the recent years, fuzzy method has
been applied to MPM in several ways such as
fuzzy logic, fuzzy AHP [12], and fuzzy weights of
evidence [13, 14]. The fuzzy analytic hierarchy
process is useful when the act of decision-making
is faced with several options and decision criteria.
Recent works on fuzzy methods are based upon a
combination of data and knowledge such as
Neuro-fuzzy [15] and Fuzzification of
continuous-value [16].
In the data-driven methods, the assigned weights
to every spatial evidence layers are quantified.
Spatial relationships between the known deposits
and particular datasets were used to represent the
prospectivity recognition criteria [17].
Data-driven contains different methods such as
weight of evidence [9], logistic regression [18],
neural networks [19, 20], evidential belief
functions [21, 22], and Bayesian network
classifiers [23].
3. Methods and result
3.1. Data Geological, geochemical, and geophysical
datasets were available and used as sources of
evidence for MPM. To prospect the metalogenic
zones for the Au-Cu deposits, the important layers
were determined as pyroclastic rocks, intrusive
bodies, alteration zone, volcanic rocks, faults,
high magnetic zone, Fe-Oxide outcrops, ore
occurrences, and Au, As, Ag, Cu, Mo, Pb, and Zn
geochemical anomalies.
The geological maps contained information on
igneous rocks, sedimentary formations, faults, and
dikes, which were mapped at a scale of 1:100,000.
A simplified geological map was constructed
(Figure 1). The lithology layer consisted of 35
units. The selective rocks and ore occurrences
indicate that the northern part is most important
for MPM (Figure 2).
Faults play a role in enabling fluid passage during
mineralization. The objective of fault density
analysis is to determine the distribution of faults
over the entire region, and the degree of fault
convergence. As the gold and copper deposits in
this area are controlled by a large-scale fault
system, the density of faults was determined
(Figure 3). A separate fault layer was also
constructed based on the distance from faults.
Buffer analysis was performed for faults and ore
occurrences in a radius to 1500 m with intervals
of 500 m.
Figure 2. Selective rocks and ore indicators in Feyz-Abad area.

Saadat/ Journal of Mining & Environment, Vol.8, No.4, 2017
614
The geochemical data includes 2066 sample
analysis from 28 major and trace elements. The
geochemical anomaly map of some elements is
shown in Figures 4 and 5. There are still some
challenging aspects in generating stream sediment
geochemical evidential maps. Some researchers
have combined fuzzy with data-driven methods.
For instance, [25] used ilr-transformation and
staged Factor Analysis (FA) of stream sediment
geochemical data for fuzzy membership scores to
prepare a geochemical anomaly map.
The higher efficiency of staged FA over ordinary
FA in extracting significant multi-element
geochemical signature for the mineral deposit has
been demonstrated by [24]. In this work, it was
found that ilr-transformation resulted in
approximately symmetric distributions for the
stream sediment element data.
To examine the ilr-transformed data in factor
analysis, Principal Component Analysis (PCA)
was utilized for the extraction of factors.
Furthermore, varimax rotation of factors was
applied [25]. The findings here indicate that the
ilr-transformed data for Ni, Cr, and Co in factor
analysis can extract components representing
anomalous multi-element geochemical signatures.
However, for Cu and Au mineralization and their
assemblage elements, there are no significant
factors, which may be due to their different
genesis and type of mineralization. As a result,
separate raster images were produced for each
indicator element. Pixel size of 100 m × 100 m
has been used in all maps in this work. Figure 6
shows an example for Cu and Au anomalies.
The geophysical data includes regional air-borne
magnetometry data, and shows a high magnetic
potential in the northern part of the studied area.
Alteration zones are gained by processing satellite
images. A scene of Landsat Enhanced Thematic
Mapper plus (ETM+ data, path 159, row 36, date
2000) and advanced space-borne thermal emission
and reflection radiometer (ASTER, 2001) are used
for an enhancing alteration.
These images are geometrically corrected using
control points from topographic sheets. Data
processing has been done by the ENVI
(Environment for Visualizing Images) software.
Band Ratios, PCA, and Spectral Angel Mapper
(SAM) method were used to delineate the
associated zones of hydrothermal alteration and
iron oxide minerals. SAM is a procedure that
determines the similarity between a pixel and each
one of the reference spectra based on the
calculation of the "spectral angle" between them
[26]. Aster images are used for mapping
hydrothermal alteration minerals such as
Pyrophyllite, Kaolinite, Illite, Muscovite, Sericite,
and carbonate. Enhanced kaolinite and phyllic
zones by SAM methods are shown in Figure 7.
Argillic, Phyllic, and Propylitic alterations were
determined with the aid of SWIR bands in aster
imagery but iron oxide composites such as
magnetite and hematite appeared by Landsat
Imagery.
Figure 3. Density map of faults in Feyz-Abad area.

Saadat/ Journal of Mining & Environment, Vol.8, No.4, 2017
615
Figure 4. Distribution of Au and Cu in Stream sediments in Feyz-Abad area.
Saadat/ Journal of Mining & Environment, Vol.8, No.4, 2017
616
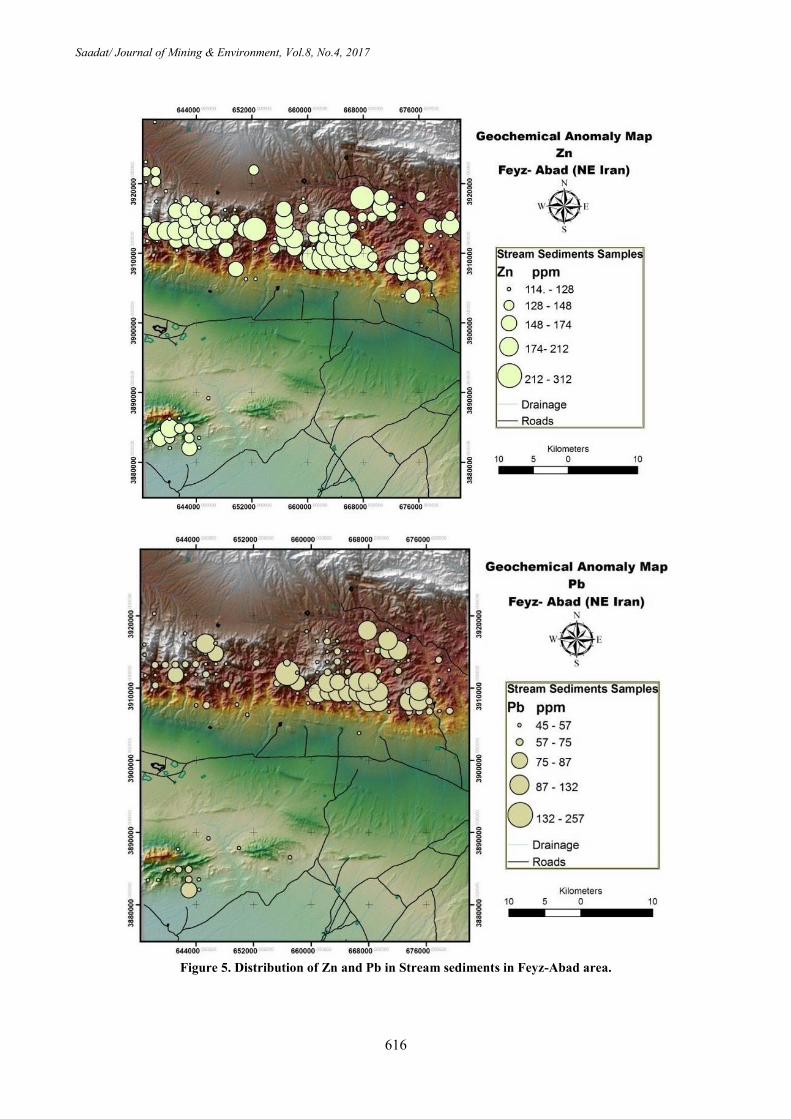
Figure 5. Distribution of Zn and Pb in Stream sediments in Feyz-Abad area.

Saadat/ Journal of Mining & Environment, Vol.8, No.4, 2017
617
Figure 6. Distribution map of Cu and Au anomalies in Feyz-Abad area (based on ilr data).
Figure 7. Results of enhanced Phyllic zone (left) and kaolinite zone (right).
3.2. Methodology of integration
Mineral exploration is a complex process in which
the main purpose is to discover a new mineral
deposit in the region of interest. To achieve this
goal, various thematic (e.g. geological,
geophysical, geochemical) geo-datasets should be
collected, analyzed, and integrated for MPM
(Figure 8). Five different methods have been used
to extract the favorable area for more exploration,
as shown below.
B A

Saadat/ Journal of Mining & Environment, Vol.8, No.4, 2017
618
B A
D C
Figure 8. Some weighted evidential layers: A) geology (for AHP) B) fault intersection (for fuzzy) C) geochemistry
(fuzzy sum operator) D) geology (fuzzy).
Saadat/ Journal of Mining & Environment, Vol.8, No.4, 2017
619
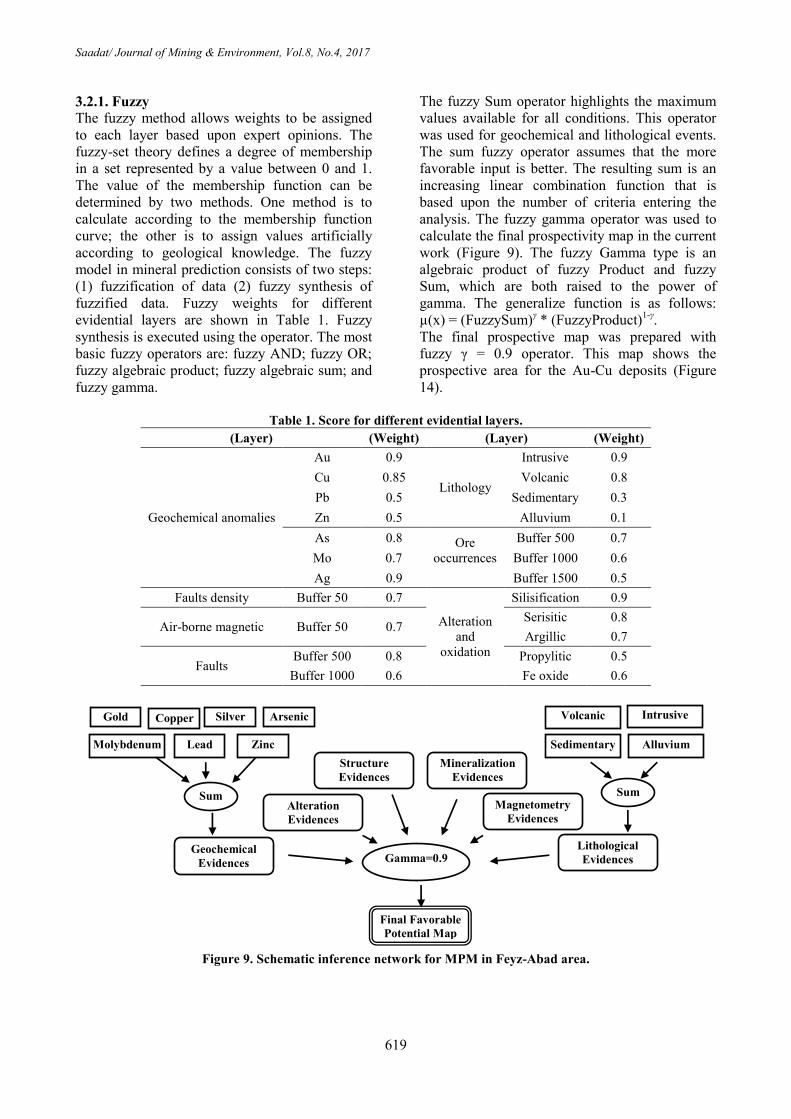
3.2.1. Fuzzy
The fuzzy method allows weights to be assigned
to each layer based upon expert opinions. The
fuzzy-set theory defines a degree of membership
in a set represented by a value between 0 and 1.
The value of the membership function can be
determined by two methods. One method is to
calculate according to the membership function
curve; the other is to assign values artificially
according to geological knowledge. The fuzzy
model in mineral prediction consists of two steps:
(1) fuzzification of data (2) fuzzy synthesis of
fuzzified data. Fuzzy weights for different
evidential layers are shown in Table 1. Fuzzy
synthesis is executed using the operator. The most
basic fuzzy operators are: fuzzy AND; fuzzy OR;
fuzzy algebraic product; fuzzy algebraic sum; and
fuzzy gamma.
The fuzzy Sum operator highlights the maximum
values available for all conditions. This operator
was used for geochemical and lithological events.
The sum fuzzy operator assumes that the more
favorable input is better. The resulting sum is an
increasing linear combination function that is
based upon the number of criteria entering the
analysis. The fuzzy gamma operator was used to
calculate the final prospectivity map in the current
work (Figure 9). The fuzzy Gamma type is an
algebraic product of fuzzy Product and fuzzy
Sum, which are both raised to the power of
gamma. The generalize function is as follows:
µ(x) = (FuzzySum)γ * (FuzzyProduct)
1-γ.
The final prospective map was prepared with
fuzzy γ = 0.9 operator. This map shows the
prospective area for the Au-Cu deposits (Figure
14).
Table 1. Score for different evidential layers.
Weight)) (Layer) Weight)) (Layer)
0.9 Intrusive
Lithology
0.9 Au
Geochemical anomalies
0.8 Volcanic 0.85 Cu
0.3 Sedimentary 0.5 Pb
0.1 Alluvium 0.5 Zn
0.7 Buffer 500 Ore
occurrences
0.8 As
0.6 Buffer 1000 0.7 Mo
0.5 Buffer 1500 0.9 Ag
0.9 Silisification
Alteration
and
oxidation
0.7 Buffer 50 Faults density
0.8 Serisitic 0.7 Buffer 50 Air-borne magnetic
0.7 Argillic
0.5 Propylitic 0.8 Buffer 500 Faults
0.6 Fe oxide 0.6 Buffer 1000
Figure 9. Schematic inference network for MPM in Feyz-Abad area.
Gold Copper Silver Arsenic
Molybdenum Lead Zinc
Sum
Geochemical
Evidences
Alteration
Evidences
Structure
Evidences
Magnetometry
Evidences
Mineralization
Evidences
Lithological
Evidences Gamma=0.9
Final Favorable
Potential Map
Volcanic
Alluvium
Intrusive
Sedimentary
Sum

Saadat/ Journal of Mining & Environment, Vol.8, No.4, 2017
620
3.2.2. Integration of Continuous Fuzzy
Weighted Evidence Layer
To transform data into the [0, 1] range, logistic
functions are used in order to generate fuzzified
evidential maps. Moreover, to transform a dataset
into a logistic space based on the minimum and
maximum data values and slope variations
between them, some logistic functions can be
utilized [15]. Recently, researchers [16] have
applied an equation to assign continuous weights
to individual evidential layers into the same space
for more efficiency. In this research work, the
following equation, as mentioned by [16], was
used to determine suitable values for i and s in the
logistic function for transforming continuous
dataset into fuzzy space:
1
- ( - )1
FEv s Ev i
e
(1)
where FEv is a score in the [0, 1] range, fuzzy
weight in a logistic space, i and s are the inflection
point and slope, respectively, of the logistic
function, and Ev is the evidential value of each
pixel in an input map from which FEv is estimated.
The parameters i and s determine the shape of the
logistic function, and hence, the output fuzzy
weights. The above-mentioned equation is written
two times to make a system of equations, as [15]:
min
max
(min) ( )
(max) ( )
1
1
1
1
Ev s Ev i
Ev s Ev i
Fe
Fe
(2)
where FEv (min) and FEv (max) are the lowest and
highest fuzzy scores of evidential values, and
Evmin and Evmax are their corresponding minimum
and maximum values in the input dataset. The i
and s values are calculated based on the
corresponding minimum, Evmin, and maximum,
Evmax, evidential values in the input dataset as
[16]:
max min
9.2s
Ev Ev
(3)
max min
2
Ev Evi
(4)
Table 2 shows the calculated i and s values
defined using the above equations. Some
continuous weighted maps are shown in Figure
10. Fuzzified layers have integrated with fuzzy
gamma operator with a high value of gamma
(= 0.9).
3.2.3. Index overlay
In the index overlay method, each class of maps is
given a different score, allowing for a flexible
weighting system from 1 to 9. The table of scores
and the map weights can be adjusted to reflect the
judgment of experts in the domain of the
application under consideration [4].
In order to use the index-overlay combination
method, spatial relationships are quantified as
maps that comprise nine distinct levels of
prospectivity (Tables 3 and 4). In this work, each
one of the layers has been integrated based on
their priority. The integration has been done using
the Arc GIS software, and the evaluation of these
layers has been done in the Expert Choice
software (Tables 2 and 3). All the evidential
layers converted to raster and combined by raster
calculation. A mineral prospectivity map based on
this model is illustrated in Figure 14.
Table 2. Calculated i and s values for different datasets of evidential values, defined by solving a system of
equations.
Evidential value s i
Geology geology 11.5000 0.5000
Geochemical anomalies
Au 11.5000 0.5000
As 13.1429 0.4500
Ag 13.1429 0.4500
Pb 14.1538 0.4250
Mo 15.3333 0.4000
Zn 14.1538 0.4250
Cu 11.5000 0.5000
Structures Faults 13.1429 0.4500

Saadat/ Journal of Mining & Environment, Vol.8, No.4, 2017
621
B A
D C
Figure 10. Fuzzy evidence layer of (A) Cu geochemical signature, (B) fault density, (C) Zn geochemical signature
(D) fuzzy prospectivity model generated by integration evidence layers.
Table 3. Score for different evidential layers.
Weight)) (Layer) Weight)) (Layer)
9 Intrusive
Lithology
9 Au
Geochemical anomalies
8 Volcanic 9 Cu
3 Sedimentary 6 Pb
1 Alluvium 6 Zn
7 Buffer 500 Ore
occurrences
8 As
6 Buffer 1000 7 Mo
5 Buffer 1500 9 Ag
9 Silisification
Alteration
and
oxidation
7 Buffer 50 Faults density
8 Serisitic 7 Buffer 50 Air-borne magnetic
7 Argillic
5 Propylitic 8 Buffer 500 Faults
6 Fe Oxide 6 Buffer 1000

Saadat/ Journal of Mining & Environment, Vol.8, No.4, 2017
622
Table 4. Final score for evidential layers.
(Weight) (Layer)
8 Faults
7 Geochemistry
9 Lithology
9 Mineralization
8 Alteration
6 Geophysical Anomaly
3.2.4. AHP
The Analytical Hierarchy Process (AHP) is one of
the best ways for deciding among the complex
criteria structure in different levels. The concept
of AHP was developed for pairwise analysis of
priorities in multi-criteria decision-making [24]. It
aims to derive a hierarchy of criteria based on
their pairwise relative importance with respect to
the objective of a decision-making process. The
method adopts a nine point continuous pairwise
rating scale for judging which criteria is less or
more important than another (Figure 11). The
AHP method is used in this research work to
evaluate the weight of data and compare the
results with fuzzy and fuzzy AHP.
In this work, all data is classified based on their
relative importance. Then pairwise comparison
has been prepared in expert choice software. A
hierarchy has been constructed based on expert
opinions. The hierarchy tree is shown in Figure
12. The consistency ratio was less than 0.1 after
pairwise comparisons, so the result was correct for
MPM. AHP weights Multiple to layers and
integration of the all final layers have been done
in ArcGIS. The final prospectively map shows the
prospective area for Au-Cu deposits (Figure 14).
The mineral potential map was classified into five
major classes including very poor to very good
potentiality. Most favorable potential areas are
shown in Figure 14.
Figure 11. Continuous rating scale for pairwise comparison of relative importance with respect to a proposition
(adapted from [27]).
Figure 12. Parameter weighting of different data and structure layer based on AHP with inconsistency = 0.01.

Saadat/ Journal of Mining & Environment, Vol.8, No.4, 2017
623
3.2.5. Fuzzy AHP
The fuzzy analytic hierarchy process is one of the
most accepted multi-criteria decision-making
techniques. The fuzzy AHP is a synthetic
extension of the classical AHP method when the
fuzziness of the decision-makers is considered.
This technique can be viewed as an advanced
analytical method developed from the traditional
AHP. A number of methods have been developed
to handle the fuzzy AHP. Chang [25] has
introduced a new method for fuzzy AHP using
triangular fuzzy numbers for pairwise comparison
scale of fuzzy AHP and the use of the extent
analysis method for the synthetic extent values of
the pairwise comparisons. The weights of the
nine-level fundamental scales of judgments are
expressed via triangular fuzzy numbers (TFNs) in
order to represent the relative importance among
the hierarchy’s criteria [28].
The MPM steps involve (1) construction of a
hierarchy, (2) preparation of important layers, (3)
creation of pairwise comparison matrix, (4)
calculation of consistency ratio, (5) construction
of fuzzy evaluation matrix, (6) calculation of
normalized weights, and (7) using fuzzy
operators.
Construction of a hierarchy is the first step
involved in doing fuzzy AHP (Figure 13).
Evaluation hierarchy for MPM is divided into
three levels, namely goal (MPM), multiple criteria
(geology, geochemistry, and geophysics), and
alternatives (Figure 13). In this work, pairwise
comparison matrices were done using fuzzy AHP
solver and excel software, utilizing the expert
opinions. Matrix of fuzzy paired comparisons for
goal is shown in Table 5. The CR value for
criteria is 0.01; for geology alternative,
CR=0.02; and for geochemical alternative,
CR=0.03, all less than 0.1, so the pairwise
comparison matrix is consistent. Map layers were
prepared in a GIS environment as raster layers.
Figure13. Hierarchy trees used in this paper.
After the matrix of paired comparisons, the
relative and final weights must be calculated by
the extent analysis method. The value for the
fuzzy synthetic extent with respect to the i-th
object is defined by:
1
1 1 1
M n m
i i
i gi gi
j i j
S M M (5)
In the above equation, Si is a triangular number.
All Mjgi(j = 1, 2,…, m) are triangular fuzzy
numbers. As M1 = (l1, m1, u1) and M2 = (l2, m2, u2)
are two triangular fuzzy numbers, the degree of
possibility of M1 ≥ M2 is defined by:
2 1
2 1 1 2
1 2
2 2 1 1
1 if m m
V(M M ) 0 if l u
l u otherwise
(m u ) (m l )
(6)
To compare M1 and M2, the values for both V(M1
≥ M2) and V (M2≥ M1) are required. The
probability that a convex fuzzy number is greater
than k, convex fuzzy numbers Mi (1,2, …,k) can
be defined by:
V (M ≥ M1; M2…MK) = V (M ≥ M1) and (M ≥
M2) and … (M ≥ Mk)
= Min V (M ≥ Mi) i=1, 2,…,k
Assume that: d (Bi) = min V (Si≥ Sk) for k = 1, 2,
..., m; k ≠ i. Then the weight vector is given by:
W' = (d'(B1), ..., d'(Bm))T, where Bi(i = 1,..., m) are
m elements. Via normalization, the normalized
Goal
Criteria
Alt
ern
ati
ve
MPM
Geology Geophysics Geochemistry
Py
rocl
ast
ic
Vo
lca
nic
Intr
usi
ve
Sed
imen
tary
Alt
era
tio
n
Fa
ult
s
Ma
gn
eto
met
er
Au
Cu
Ag
As
Pb
Zn
Mo

Saadat/ Journal of Mining & Environment, Vol.8, No.4, 2017
624
weight vectors are given by: W = (d'(B1), d'(B2),
..., d'(Bm))T, where W is a non-fuzzy number.
Si for any criteria (Table 5) was calculated: The
results obtained are as follow:
S1 (Geological Criteria) = (0.276, 0.466, 0.727)
S2 (Geochemical Criteria) = (0.158, 0.276, 0.463)
S3 (Geophysics Criteria) = (0.163, 0.259, 0.485)
Si for geological alternative (Table 6) was
calculated: The results obtained are as follow:
S1 (Intrusive Alternative) = (0. 138, 0.249, 0.415)
S2 (Volcanic Alternative) = (0.121, 0.201, 0.331)
S3 (Sedimentary Alternative) = (0.077, 0.118, 0.2)
S4 (Alteration Alternative) = (0.156, 0.266, 0.462)
S5 (Faults Alternative) = (0.105, 0.166, 0.269)
Si for geochemical alternative (Table 7) was
calculated: The results obtained are as follow:
S1 (Au Alternative) = (0.123, 0.217, 0.356)
S2 (Cu Alternative) = 0.1, 0.15, 0.256)
S3 (As Alternative) = (0.083, 0.15, 0.256)
S4 (Ag Alternative) = (0.095, 0.168, 0.31)
S5 (Mo Alternative) = (0.07, 0.121, 0.218)
S6 (Pb Alternative) = (0.049, 0.087, 0.166)
S7 (Zn Alternative) = (0.046, 0.075, 0.141)
Matrix of fuzzy paired comparisons for geological
criteria is shown in Table 6, and fuzzy evaluation
matrix for geochemical alternatives is shown in
Table 6. Additional reclassification of the data
was performed according to the weight assigned.
Weights of criteria and alternatives are shown in
Table 8. The final prospectivity map is created
upon integration of data for all the alternative
layers with weights using gamma fuzzy operators
(Figure 14).
Table 5. Fuzzy evaluation matrix with respect to criteria.
Geophysics Geochemistry Geology
(1.5,2,2.5) (1,1.5,2) (1,1,1) Geology (0.5,1,1.5) (1,1,1) (0.5,0.667,1) Geochemistry
(1,1,1) (0.667,1,2) (0.4,0.5,0.667) Geophysics
Table 6. Matrix of fuzzy paired comparisons for geological criteria. Faults Alteration Sedimentary Volcanic Intrusive
(1,1.5,2) (0.5,1,1.5) (1.5,2,2.5) (1.5,2,2.5) (1,1,1) Intrusive (1.5,2,2.5) (0.5,0.667,1) (1,1.5,2) (1,1,1) (0.4,0.5,0.667) Volcanic
(0.4,0.5, 667) (0.4,0.5,0.667) (1,1,1) (0.5,0.667,1) (0.5,0.667,1) Sedimentary
(1.5,2,2.5) (1,1,1) (1.5,2,2.5) (1,1.5,2) (0.667,1,2) Alteration
(1,1,1) (0.4,0.5, 667) (1.5,2,2.5) (0.4,0.5,0.667) (0.5,0.667,1) Faults
Table 7. Fuzzy evaluation matrix for geochemical alternatives.
Zn Pb Mo Ag As Cu Au
(2.5,3,3.5
)
(2.5,3,3.5) (1.5,2,2.5) (0.5,1,1.5) (1,1.5,2) (0.5,1,1.5) (1,1,1) Au (1.5,2,2.5
)
(1.5,2,2.5) (0.5,1,1.5) (1,1.5,2) (1.5,2,2.5) (1,1,1) (0.667,1,2) Cu
(1.5,2,2.5
)
(1,1.5,2) (1.5,2,2.5) (0.5,1,1.5) (1,1,1) (0.4,0.5,0.667
)
(0.5,0.667,1) As (2.5,3,3.5
)
(0.5,1,1.5) (1.5,2,2.5) (1,1,1) (0.667,1,2) (0.5,0.667,1) (0.667,1,2) Ag
(1,1.5,2) (1.5,2,2.5) (1,1,1) (0.4,0.5,0.667) (0.4,0.5,0.667
)
(0.667,1,2) (0.4,0.5,0.667) M
o (0.5,1,1.5
)
(1,1,1) (0.4,0.5,0.667
)
(0.667,1,2) (0.5,0.667,1) (0.4,0.5,0.667
)
(0.286,0.333,0.4
) Pb
(1,1,1) (0.667,1,2
)
(0.5,0.667,1) (0.286,0.333,0.4
)
(0.4,0.5,0.667
)
(0.4,0.5,0.667
)
(0.286,0.333,0.4
) Zn
Table 8. Weights of criteria and alternatives.
Criterion Weight Alternative Weight Final Weight
Geological data 0.4405
Intrusive 0.2734 0.120 Volcanic 0.2128 0.094
Sedimentary 0.0670 0.029
Alteration 0.2921 0.128 Faults 0.1547 0.068
Geochemical data 0.3926
Au Anomaly 0.2401 0.094 Cu Anomaly 0.2043 0.080
Ag Anomaly 0.1901 0.075
As Anomaly 0.1601 0.063 Pb Anomaly 0.0594 0.023
Zn Anomaly 0.0264 0.010 Mo Anomaly 0.1197 0.047
Geophysical data 0.1668 Aeromagnetic 1 0.167

Saadat/ Journal of Mining & Environment, Vol.8, No.4, 2017
625
A B
C D
Figure14. Promising areas for MPM in Feyz-Abad area based on a) fuzzy method, b) index overlay integration,
C) AHP method, and D) Fuzzy AHP.
Saadat/ Journal of Mining & Environment, Vol.8, No.4, 2017
626
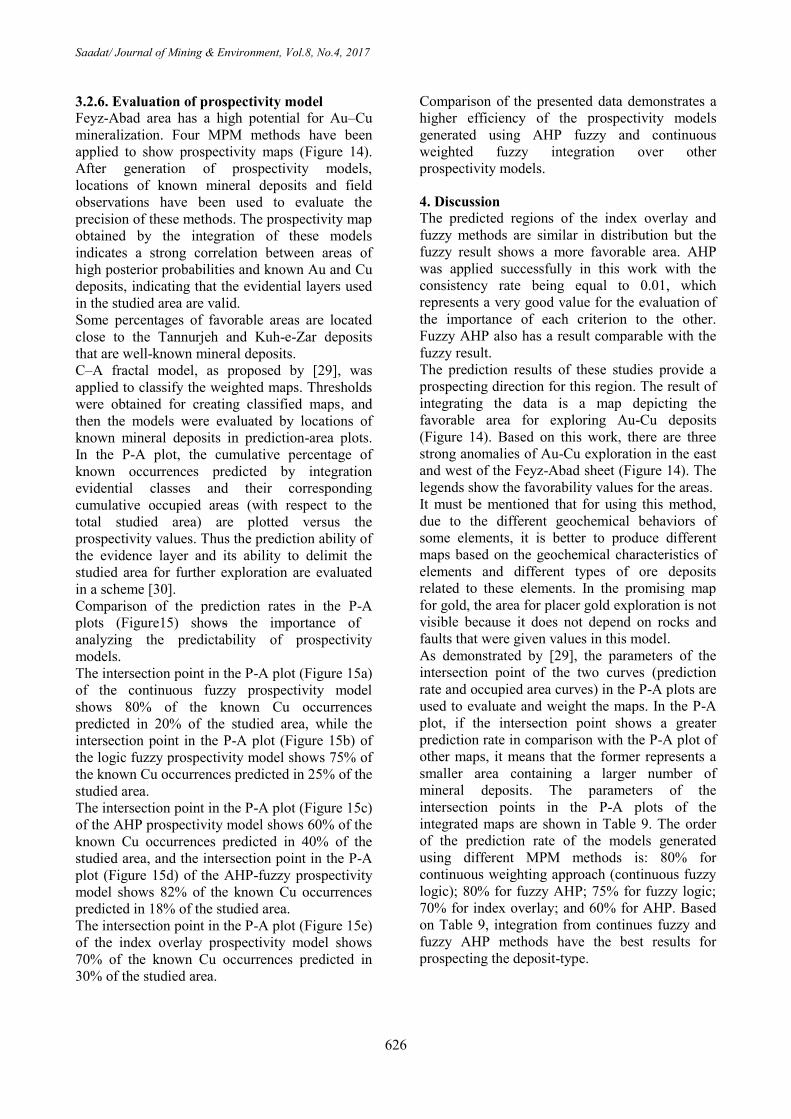
3.2.6. Evaluation of prospectivity model
Feyz-Abad area has a high potential for Au–Cu
mineralization. Four MPM methods have been
applied to show prospectivity maps (Figure 14).
After generation of prospectivity models,
locations of known mineral deposits and field
observations have been used to evaluate the
precision of these methods. The prospectivity map
obtained by the integration of these models
indicates a strong correlation between areas of
high posterior probabilities and known Au and Cu
deposits, indicating that the evidential layers used
in the studied area are valid.
Some percentages of favorable areas are located
close to the Tannurjeh and Kuh-e-Zar deposits
that are well-known mineral deposits.
C–A fractal model, as proposed by [29], was
applied to classify the weighted maps. Thresholds
were obtained for creating classified maps, and
then the models were evaluated by locations of
known mineral deposits in prediction-area plots.
In the P-A plot, the cumulative percentage of
known occurrences predicted by integration
evidential classes and their corresponding
cumulative occupied areas (with respect to the
total studied area) are plotted versus the
prospectivity values. Thus the prediction ability of
the evidence layer and its ability to delimit the
studied area for further exploration are evaluated
in a scheme [30].
Comparison of the prediction rates in the P-A
plots (Figure15) shows the importance of
analyzing the predictability of prospectivity
models.
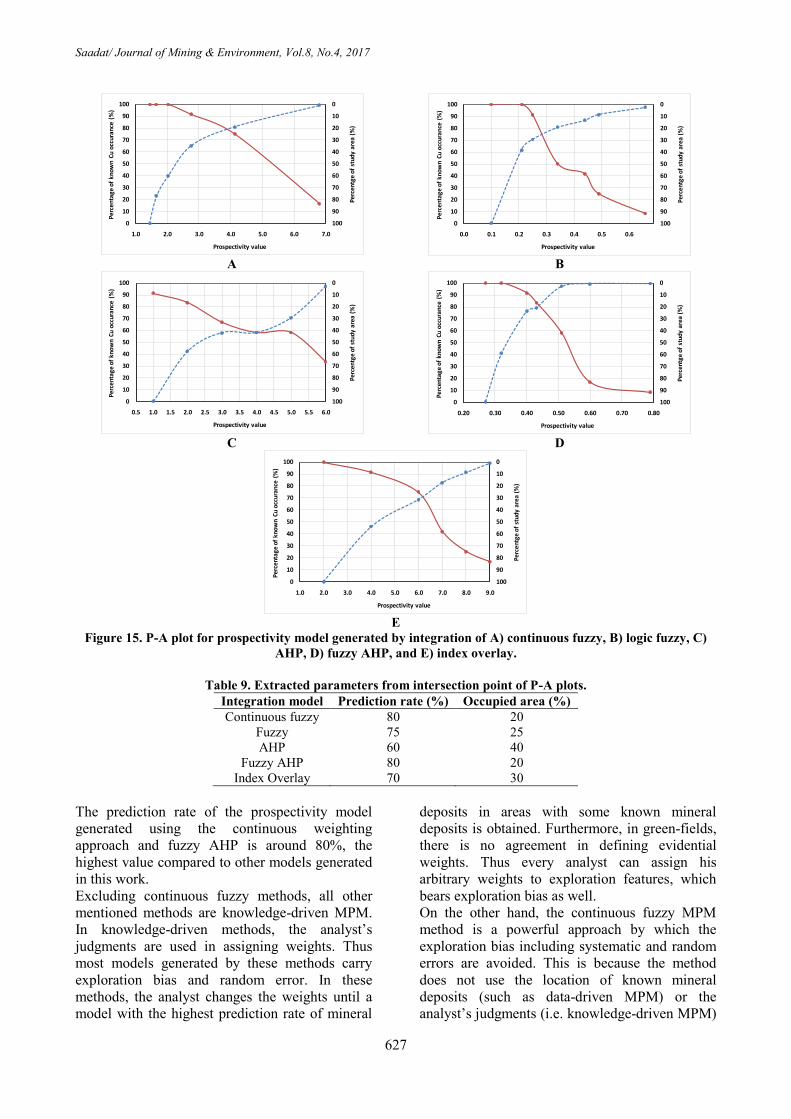
The intersection point in the P-A plot (Figure 15a)
of the continuous fuzzy prospectivity model
shows 80% of the known Cu occurrences
predicted in 20% of the studied area, while the
intersection point in the P-A plot (Figure 15b) of
the logic fuzzy prospectivity model shows 75% of
the known Cu occurrences predicted in 25% of the
studied area.
The intersection point in the P-A plot (Figure 15c)
of the AHP prospectivity model shows 60% of the
known Cu occurrences predicted in 40% of the
studied area, and the intersection point in the P-A
plot (Figure 15d) of the AHP-fuzzy prospectivity
model shows 82% of the known Cu occurrences
predicted in 18% of the studied area.
The intersection point in the P-A plot (Figure 15e)
of the index overlay prospectivity model shows
70% of the known Cu occurrences predicted in
30% of the studied area.
Comparison of the presented data demonstrates a
higher efficiency of the prospectivity models
generated using AHP fuzzy and continuous
weighted fuzzy integration over other
prospectivity models.
4. Discussion The predicted regions of the index overlay and
fuzzy methods are similar in distribution but the
fuzzy result shows a more favorable area. AHP
was applied successfully in this work with the
consistency rate being equal to 0.01, which
represents a very good value for the evaluation of
the importance of each criterion to the other.
Fuzzy AHP also has a result comparable with the
fuzzy result.
The prediction results of these studies provide a
prospecting direction for this region. The result of
integrating the data is a map depicting the
favorable area for exploring Au-Cu deposits
(Figure 14). Based on this work, there are three
strong anomalies of Au-Cu exploration in the east
and west of the Feyz-Abad sheet (Figure 14). The
legends show the favorability values for the areas.
It must be mentioned that for using this method,
due to the different geochemical behaviors of
some elements, it is better to produce different
maps based on the geochemical characteristics of
elements and different types of ore deposits
related to these elements. In the promising map
for gold, the area for placer gold exploration is not
visible because it does not depend on rocks and
faults that were given values in this model.
As demonstrated by [29], the parameters of the
intersection point of the two curves (prediction
rate and occupied area curves) in the P-A plots are
used to evaluate and weight the maps. In the P-A
plot, if the intersection point shows a greater
prediction rate in comparison with the P-A plot of
other maps, it means that the former represents a
smaller area containing a larger number of
mineral deposits. The parameters of the
intersection points in the P-A plots of the
integrated maps are shown in Table 9. The order
of the prediction rate of the models generated
using different MPM methods is: 80% for
continuous weighting approach (continuous fuzzy
logic); 80% for fuzzy AHP; 75% for fuzzy logic;
70% for index overlay; and 60% for AHP. Based
on Table 9, integration from continues fuzzy and
fuzzy AHP methods have the best results for
prospecting the deposit-type.
Saadat/ Journal of Mining & Environment, Vol.8, No.4, 2017
627
0
10
20
30
40
50
60
70
80
90
1000
10
20
30
40
50
60
70
80
90
100
1.0 2.0 3.0 4.0 5.0 6.0 7.0
Perc
entg
e of
stu
dy a
rea
(%)
Pe
rce
nta
ge
of
kn
ow
n C
u o
ccu
ran
ce (
%)
Prospectivity value
0
10
20
30
40
50
60
70
80
90
1000
10
20
30
40
50
60
70
80
90
100
0.0 0.1 0.2 0.3 0.4 0.5 0.6
Pe
rce
ntg
e o
f st
ud
y a
rea
(%)
Pe
rce
nta
ge
of
kn
ow
n C
u o
ccu
ran
ce (
%)
Prospectivity value
A B
0
10
20
30
40
50
60
70
80
90
1000
10
20
30
40
50
60
70
80
90
100
0.5 1.0 1.5 2.0 2.5 3.0 3.5 4.0 4.5 5.0 5.5 6.0
Pe
rce
ntg
e o
f st
ud
y ar
ea
(%
)
Perc
enta
ge o
f kn
own
Cu o
ccur
ance
(%
)
Prospectivity value
0
10
20
30
40
50
60
70
80
90
1000
10
20
30
40
50
60
70
80
90
100
0.20 0.30 0.40 0.50 0.60 0.70 0.80
Pe
rcen
tge
of
stu
dy
are
a (%
)
Perc
enta
ge o
f kn
own
Cu
occu
ranc
e (%
)
Prospectivity value
C D
0
10
20
30
40
50
60
70
80
90
1000
10
20
30
40
50
60
70
80
90
100
1.0 2.0 3.0 4.0 5.0 6.0 7.0 8.0 9.0
Pe
rce
ntg
e o
f st
ud
y a
rea
(%
)
Pe
rcen
tag
e o
f k
no
wn
Cu
occ
ura
nce
(%
)
Prospectivity value
E
Figure 15. P-A plot for prospectivity model generated by integration of A) continuous fuzzy, B) logic fuzzy, C)
AHP, D) fuzzy AHP, and E) index overlay.
Table 9. Extracted parameters from intersection point of P-A plots.
Integration model Prediction rate (%) Occupied area (%)
Continuous fuzzy 80 20
Fuzzy 75 25
AHP 60 40
Fuzzy AHP 80 20
Index Overlay 70 30
The prediction rate of the prospectivity model
generated using the continuous weighting
approach and fuzzy AHP is around 80%, the
highest value compared to other models generated
in this work.
Excluding continuous fuzzy methods, all other
mentioned methods are knowledge-driven MPM.
In knowledge-driven methods, the analyst’s
judgments are used in assigning weights. Thus
most models generated by these methods carry
exploration bias and random error. In these
methods, the analyst changes the weights until a
model with the highest prediction rate of mineral
deposits in areas with some known mineral
deposits is obtained. Furthermore, in green-fields,
there is no agreement in defining evidential
weights. Thus every analyst can assign his
arbitrary weights to exploration features, which
bears exploration bias as well.
On the other hand, the continuous fuzzy MPM
method is a powerful approach by which the
exploration bias including systematic and random
errors are avoided. This is because the method
does not use the location of known mineral
deposits (such as data-driven MPM) or the
analyst’s judgments (i.e. knowledge-driven MPM)
Saadat/ Journal of Mining & Environment, Vol.8, No.4, 2017
628
in assigning weight of evidence data. Thus it can
be used for both green-fields and brown-fields.
The continuous fuzzy model is the best one in the
studied area because it is bias-free and can be
used to generate reliable target areas.
5. Conclusions
In this work, various GIS techniques of generating
maps were evaluated to better understand the
geochemical anomalies and mineral potentials
within Feyz-Abad area of the Lut block, eastern
Iran, in order to indicate the best target for more
mineral exploration activities. For that purpose,
the following layers were used: (1) lithology, (2)
alteration zones, (3) density of fault, (4)
geochemical anomaly of indicator elements, and
(5) air-borne magnetic anomaly.
Five knowledge/data-driven models were
practiced in the current research work. In the
index overlay method, all weights were calculated
within 1-10 ranges, both for layers and data
within. In fuzzy and fuzzy continuous integration,
the features dataset are categorized in fuzzy order
from 0 to 1. Then the relative importance with
AHP was calculated within the [1, 9] range. In
fuzzy AHP, a combination of AHP score and
fuzzy method were used. The classes were
assigned with new weights to evaluate their
importance for prospecting the deposit type.
The index overlay method is very simple and fast
but the result is not very different from the other
methods. Fuzzy and fuzzy AHP both integrate
fuzzy mathematics into weight calculation and
involve three-step data processing, weight
calculation, and layer integration. However,
weight calculation using fuzzy is easier than using
fuzzy AHP based on triangular fuzzy numbers. On
the other hand, in fuzzy AHP, expert scores might
need to be adjusted to the probability of CR ≤ 0.1,
which will evaluate relative scores. Field
investigation showed that the final result could
better match the known deposits in the Feyz-Abad
area.
Based on the basic spatial analysis method,
around 20% of the total studied area was selected
as suitable for more exploration. In general, the
majority of a suitable area was located in the north
and NW of the Feyz-Abad region. According to
the available data and field observation, the results
of the index overlay method are similar to those
for fuzzy, AHP, and fuzzy AHP integration.
While the other methods generate relatively
similar results, the continuous fuzzy model seems
to be the best fit in the studied area because it is
bias-free and can be used to generate reliable
target areas.
Acknowledgments
I would like to thank Dr. B.M. Hynek for
providing the software used, Dr. M.H. Karimpour
for giving me the original data, Dr. Ghoorchi for
her technical support, and Dr. Yousefi for his
valuable comments to improve this paper.
References [1]. Behrouzi, A. (1987). Geological map of Feyz-
Abad 1:100000 series. Sheet 7760. Geological Survey
of Iran (GSI).
[2]. Saadat, S., Karimpour, M.H., Ajayebi, K. and
Stern, C. (2007). Petrology, Fluid Inclusion,
thermometry, and geochemistry of Tannurjeh porphyry
Cu-Au, North Eastern Iran. GSA annual meeting and
exploration. Denver. Colorado.
[3]. Saadat, S. and Ghoorchi, M. (2009). Primary
Analysis for Enhancing the Iron Oxide and Alteration
Minerals, Using ETM+ Data (A case study of Kuh-e-
Zar gold deposit, north east of Iran). Iranian journal of
Earth Science. 1 (1): 73-83.
[4]. Bonham-Carter, G.F. (1994). Geographic
Information Systems for Geoscientists: Modeling with
GIS. Pergamon. Ontario. 398 P.
[5]. Carranza, E.J.M. and Laborte, A.G. (2014). Data-
driven predictive mapping of gold prospectivity,
Baguio district, Philippines: Application of Random
Forests algorithm. Ore Geology Reviews. 71: 777-787.
[6]. Pan, G. and Harris, D.P. (2000). Information
Synthesis for Mineral Exploration. Oxford Univ. Press.
New York. 461 P.
[7]. Lusty, P.A.J., Scheib, C., Gunn, A.G. and Walker,
A.S.D. (2012). Reconnaissance-scale prospectivity
analysis for gold mineralization in the southern
Uplands-Down-Longford Terrane, Northern Ireland.
Nat. Resour. Res. 21: 359-382.
[8]. Mejía-Herrera, P., Royer, J.J., Caumon, G. and
Cheilletz, A. (2014). Curvature attribute from surface
restoration as predictor variable in Kupferschiefer
copper potentials. Natural Resources Research. 24 (3):
275-290.
[9]. Bonham-Carter, G.F., Agterberg, F.P. and Wright,
D.F. (1989). Weights of evidence modelling: a new
approach to mapping mineral potential. In: Agterberg,
F.P. and Bonham-Carter, G.F. (Eds.), Statistical
Applications in the Earth Sciences. Geological Survey
of Canada. 89 (9): 171-183.
[10]. Moon, W.M. (1990). Integration of geophysical
and geological data using evidential belief function.
IEEE Trans. Geosci. Remote Sens. 28 (4): 711-720.

Saadat/ Journal of Mining & Environment, Vol.8, No.4, 2017
629
[11]. Molan, Y.E. and Behnia, P. (2013). Prospectivity
mapping of Pb-Zn SEDEX mineralization using
remote-sensing data in the Behabad area, Central Iran.
Int. J. Remote Sens. 34 (4): 1164-1179.
[12]. Najafi, A., Karimpour, M.H. and Ghaderi, M.
(2014). Application of fuzzy AHP method to IOCG
prospectivity mapping: acase study in Taherabad
prospecting area, eastern Iran. Int. J. Appl. Earth
Observation Geoinformation. 33: 142-154.
[13]. Cheng, Q., Chen, Z. and Khaled, A. (2007).
Application of fuzzy weights of evidence method in
mineral resource assessment for gold in Zhenyuan
District, Yunnan Province, China. Earth Sci. J. China
Univ. Geosci. 32 (2): 175-184 (In Chinese with English
Abstract).
[14]. Pazand, K., Hezarkhani, A. and Ghanbari, Y.
(2014). Fuzzy analytical hierarchy process and GIS for
predictive Cu porphyry potential mapping: a case study
in Ahar-ArasbaranZone (NW, Iran). Arab. J. Geosci. 7:
241-251.
[15]. Lin, C.T. and Lee, C.S.G. (1996). Neural Fuzzy
Systems: A Neuro-Fuzzy Synergism to Intelligent
Systems. Upper Saddle River, NJ: Prentice Hall.
[16]. Yousefi, M. and Carranza, E.J.M. (2015).
Fuzzification of continuous-value spatial evidence for
mineral pro spectivity mapping. Computers and
Geosciences. 74: 97-109.
[17]. Theodoridis, S. and Koutroumbas, K. (2006).
Pattern Recognition. 2nd
Ed. Academic Press. Elsevier.
USA.
[18]. Agterberg, F.P. and Bonham-Carter, G.F. (1999).
Logistic regression and weights of evidence modeling
in mineral exploration. In: Proceedings of the 28th
Inter- national Symposium on Applications of
Computer in the Mineral Industry (APCOM). Golden.
Colorado. pp. 483-490.
[19]. Singer, D.A. and Kouda, R. (1996). Application
of a feedforward neural network in the search for
Kuruko deposits in the Hokuroku district, Japan.
Mathematical Geology. 28: 1017-1023.
[20]. Porwal, A., Carranza, E.J.M. and Hale, M.
(2003). Artificial neural networks for mineral- potential
mapping: a case study from Aravalli Province, Western
India. Natural Resources Research. 12 (3): 156-171.
[21]. Carranza, E.J.M. (2008). Geochemical anomaly
and mineral prospectivity mapping in GIS. In:
Handbook of Exploration and Environmental
Geochemistry. Vol. 11. Elsevier. Amsterdam. 351 P.
[22]. Carranza, E.J.M. and Hale, M. (2002). Wildcat
mapping of gold potential, Baguio district, Philippines.
Transactions of the Institution of Mining and
Metallurgy (Section B-Applied Earth Science). 111 (2):
100-105.
[23]. Porwal, A., Carranza, E.J.M. and Hale, M.
(2006). A hybrid fuzzy weights-of-evidence model for
mineral potential mapping. Natural Resources
Research. 15 (1): 1-14.
[24]. Yousefi, M., Kamkar-Rouhani, A. and Carranza,
E.J.M. (2012). Geochemical mineralization probability
index (GMPI): A new approach to generate enhanced
stream sediment geochemical evidential map for
increasing probability of success in mineral potential
mapping. Journal of Geochemical Exploration. 115:
24-35.
[25]. Kaiser, H.F. (1958). The varimax criteria for
analytical rotation in factor analysis. Psychometrika.
23: 187-200.
[26]. Kruse, F.A., Lefkoff, A.B., Boardman, J.W.,
Heidebrecht, K.B., Shapiro, A.T., Barloon, P.J. and
Goetz, A.F.H. (1993). The Spectral Image Processing
System (SIPS) Interactive Visualization and Analysis
of Imaging Spectrometer Data. Remote Sensing of
Environment. 44: 145-163.
[27]. Saaty, T. L. (1977). A scaling method for
priorities in hierarchical structures. J. Math. Psychol.
15 (3): 234-281.
[28]. Chang, D.Y. (1996). Applications of the extent
analysis method on fuzzy AHP. Eur. J. Oper. Res. 95
(3): 649-655.
[29]. Yousefi, M. and Carranza, E.J.M. (2015).
Prediction-area (P-A) plot and C-A fractal analysis to
classify and evaluate evidential maps for mineral
prospectivity modeling. Computers and Geosciences.
79: 69-81.
[30]. Yousefi, M. and Carranza, E.J.M. (2016). Data-
driven index overlay and Boolean logic mineral
prospectivity modeling in Greenfields exploration.
Natural Resources Research. 25 (1): 3-18.
6931چهارم، سال م، شماره هشتدوره زیست، پژوهشی معدن و محیط -یه علمینشرسعادت/
های پتانسیل سازی مدل در محور دانش -و تلفیق داده محور محور دانشمختلف های روشی ریکارگ به مقايسه
طال و مس و معرفي نواحي امیدبخش کاني سازی معدني
(رانيا شرق شمال لوت، بلوک شمال) آباد فیض منطقه: یمورد مطالعه
سعید سعادت
ايران اسالمي، ، واحد مشهد، دانشگاه آزادشناسي زمینگروه
62/2/6162، پذیرش 61/6/6162ارسال
[email protected]نویسنده مسئول مکاتبات:
چکیده:
محاور دانا هاای روش از برخی ر،یاخ های سال در نیزم علوم به مربوط مسائلسیستم اطالعات جغرافیایی در سازی مدل کارگیری به آمیز موفقیت جینتا اساس بر
.کاار گرفتاه شاد ه با ( در ایان تحقیاق رانیا ا شار شمال) آباد فیض در منطقه یامقیاس ناحیه در مس و طال یسازیانک ویژه بهو امیدبخ ی مناطق معرف یبرا
روش پانج ،تحقیاق نیا ا در. کناد می بندی رده ات بعدیاکتشاف یبرا را نظر مورد دبخ یام طقامن که است یامرحله چند ندیآفر کی پتانسیل معدنی سازی مدل
یهاا نقشاه ، منظاور نیا یبرا. است هگرفت قرار سهیمقا موردنشانگر، تحلیل سلسله مراتبی و تحلیل سلسله مراتبی فازی های وزن ،پیوسته یفاز ،یفاز شامل ادغام
و آهان دیاکسا راتییا تغآلتراسیون، استخراج یبرا لندست ریتصاو. شد ساختهمکانی داده گاهیپا کی و آوری جمع کیزیژئوف و ییایمیژئوش هایداده ،یشناسنیزم
اسیا مق در کیا تیلیپروپآلتراسایون و تیا کلر ت،یا نیکائول، اکساید سیلیسایم یهاا شااخ اساتخراج یبرا استر ریتصاو و ها گسل و یخطهای ساختار ییشناسا
گاذاری ارزش. ندشاد پتانسایل معادنی تلفیاق ساازی مدل مختلف ایه روش با کیزیژئوف و ییایمیژئوش ،یشناسنیزم یهاداده. گرفت قرار استفاده مورد یامنطقه
اسااس بار و مشاخ شاد آبااد ضیفا منطقاه در اصلی یاکتشاف ناحیه سه ل،یتحل نیا اساس بر. مشخ شدند استداللی توابع ای و یتخصص دان توسط ها وزن
هاای روش. مفید واقاع شاود ندهیآ های اکتشافیجستجو یبرا تواندیم گرفت که قرار تائیدپتانسیل معدنی مورد سازی مدل صحت و دقت نتایج ،یدانیم مشاهدات
مطالعاه ماورد منطقاه در روش ترین مناسب پیوسته یفاز سازی مدلروش که رسدیم نظر به دهند ولیرا نشان می یمشابه نسبتاً جینتا پروژه نیا در شده یابیارز
.ردیگ قرار استفاده مورد اتکا قابل امیدبخ مناطق مشخ کردن یبرا خوبی به تواندیم وشود داوری میو یا پی مانع اختالل رایز است
.آباد فیضنشانگر، های وزنپتانسیل معدنی، فازی، تحلیل سلسله مراتبی، سازی مدل کلمات کلیدی: