comparison of water vapor measurements by airborne sun
TRANSCRIPT

Comparison of Water Vapor Measurements by Airborne Sun Photometer and DiodeLaser Hygrometer on the NASA DC-8
J. M. LIVINGSTON,* B. SCHMID,� P. B. RUSSELL,# J. REDEMANN,@ J. R. PODOLSKE,# AND G. S. DISKIN&
*SRI International, Menlo Park, California�Pacific Northwest National Laboratory, Richland, Washington
#NASA Ames Research Center, Moffett Field, California@Bay Area Environmental Research Institute, Sonoma, California
&NASA Langley Research Center, Hampton, Virginia
(Manuscript received 24 July 2007, in final form 4 January 2008)
ABSTRACT
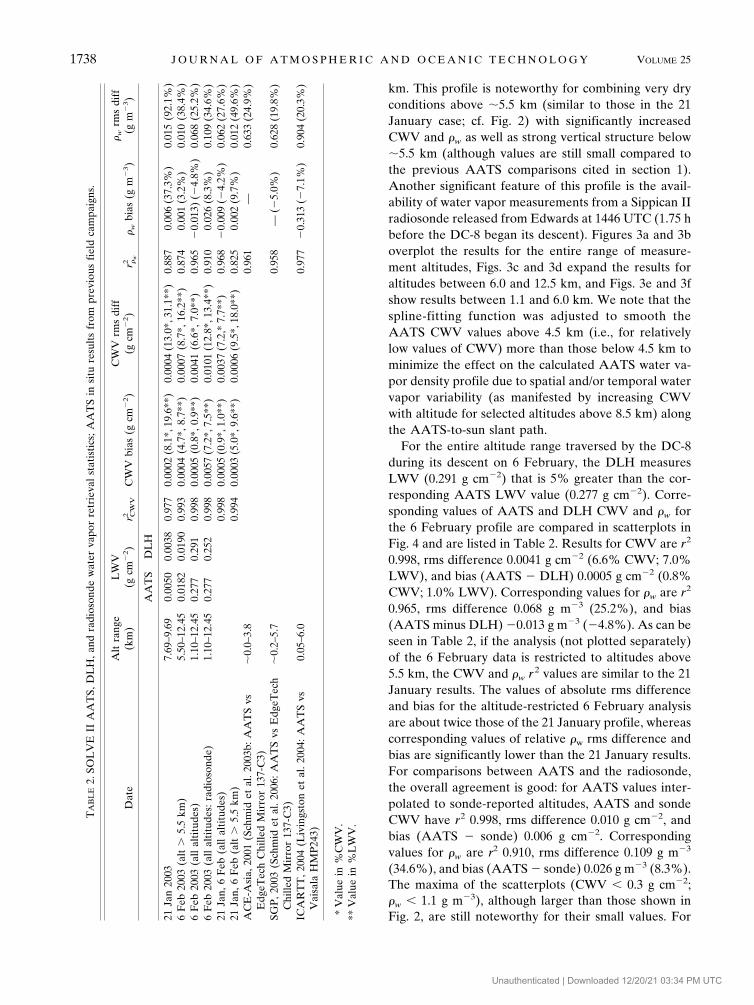
In January–February 2003, the 14-channel NASA Ames airborne tracking sun photometer (AATS) andthe NASA Langley/Ames diode laser hygrometer (DLH) were flown on the NASA DC-8 aircraft. TheAATS measured column water vapor on the aircraft-to-sun path, while the DLH measured local watervapor in the free stream between the aircraft fuselage and an outboard engine cowling. The AATS andDLH measurements have been compared for two DC-8 vertical profiles by differentiating the AATScolumn measurement and/or integrating the DLH local measurement over the altitude range of each profile(7.7–10 km and 1.1–12.5 km). These comparisons extend, for the first time, tests of AATS water vaporretrievals to altitudes ��6 km and column contents �0.1 g cm�2. To the authors’ knowledge, this is the firsttime suborbital spectroscopic water vapor measurements using the 940-nm band have been tested inconditions so high and dry. Values of layer water vapor (LWV) calculated from the AATS and DLHmeasurements are highly correlated for each profile. The composite dataset yields r 2 0.998, rms difference7.7%, and bias (AATS minus DLH) 1.0%. For water vapor densities AATS and DLH had r 2 0.968, rmsdifference 27.6%, and bias (AATS minus DLH) �4.2%. These results for water vapor density comparefavorably with previous comparisons of AATS water vapor to in situ results for altitudes ��6 km, columns�0.1 to 5 g cm�2, and densities �0.1 to 17 g m�3.
1. Introduction
Water vapor measurements by sun photometry usingthe 940-nm water vapor absorption band have beencompared to in situ and other remote (e.g., microwave)measurements in several previous publications (e.g.,Schmid et al. 2000, 2001, 2003a,b, 2006; Redemann etal. 2003; Livingston et al. 2000, 2003, 2007). Those com-parisons were all restricted to sun photometer altitudes��6 km, with water vapor columns �0.1 to 5 g cm�2,and water vapor densities �0.1 to 17 g m�3.
In January–February 2003, the 14-channel NationalAeronautics and Space Administration (NASA) Amesairborne tracking sun photometer (AATS-14; hereaftersimply AATS) flew on the DC-8 along with the NASALangley/Ames Diode Laser Hygrometer (DLH). The
flights were part of the second Stratospheric Aerosoland Gas Experiment (SAGE) III Ozone Loss and Vali-dation Experiment (SOLVE II). They provided an op-portunity to test AATS water vapor measurements inhigher, drier environments, including altitudes up to 12km and water vapor columns �0.002 to 0.1 g cm�2
above 4 km. The availability of DLH measurements onthe same aircraft as AATS provided an especially goodcomparison opportunity because the DLH was de-signed and built to perform well in environments thishigh and dry, and previous DLH measurements hadbeen compared to other state-of-the-art water vapormeasurements in such regions (e.g., Podolske et al.2003). To our knowledge there had not been any pre-vious tests of suborbital spectroscopic water vapor mea-surements using the 940-nm band in conditions so highand dry.
It should be noted, however, that several satelliteinstruments that view the sun through the earth’s at-mospheric limb do use the 940-nm band for water vapor
Corresponding author address: John M. Livingston, SRI Inter-national, 333 Ravenswood Ave., Menlo Park, CA 94025.E-mail: [email protected]
VOLUME 25 J O U R N A L O F A T M O S P H E R I C A N D O C E A N I C T E C H N O L O G Y OCTOBER 2008
DOI: 10.1175/2008JTECHA1047.1
© 2008 American Meteorological Society 1733
JTECHA1047
Unauthenticated | Downloaded 12/20/21 03:34 PM UTC

measurements, and they have been validated. Theseinstruments include the SAGE and Polar Ozone andAerosol Measurement (POAM) families of sensors,validations of which have been published by Nedoluhaet al. (2002), Taha et al. (2004), Thomason et al. (2004),and Lumpe et al. (2006), among others. The SAGE andPOAM measurements benefit from the long viewingpath of their limb-viewing geometry [e.g., �200 km in a1-km-thick atmospheric shell, resulting from a local so-lar zenith angle (SZA) of �90°], which produces mea-surable absorption in the 940-nm band even for strato-spheric concentrations of water vapor (typically 3–8ppmv). The AATS DC-8 measurements reported inthis paper had true solar zenith angles ranging from68.6° to 89.1°, which includes viewing paths (hence air-mass factors) considerably less than those for theSAGE and POAM viewing geometries.
2. Instruments and data analysis techniques
a. Fourteen-channel Ames airborne tracking sunphotometer
The 14-channel NASA Ames airborne tracking sunphotometer has been described previously in the litera-ture (e.g., Russell et al. 2005, 2007), so we give only abrief synopsis here. The AATS measures the directbeam solar transmission in 14 channels with centerwavelengths from 354 to 2138 nm, including a channelcentered at 941 nm. Azimuth and elevation motors ro-tate a tracking head to lock on to the solar beam andmaintain detectors normal to it.
The AATS channel wavelengths are chosen to per-mit separation of aerosol, water vapor, and ozone trans-mission along the measured slant path. Our methodsfor data reduction, calibration, and error analysis havebeen described in detail previously (Russell et al.1993a,b; Schmid and Wehrli 1995; Schmid et al. 1996,2001, 2003b). Water vapor analysis methods are brieflyreviewed below. Results for AATS aerosol opticaldepth and ozone measurements from the DC-8 inSOLVE II are described by Russell et al. (2005) andLivingston et al. (2005).
AATS was calibrated by analysis of sunrise measure-ments acquired at Mauna Loa Observatory (MLO),Hawaii, for six sunrises in November 2002 prior toSOLVE II and for seven sunrises in March 2003 afterSOLVE II. Exoatmospheric detector voltages V0 werederived using the Langley plot technique (e.g., Russellet al. 1993a,b; Schmid and Wehrli 1995) for all channelsexcept 941 nm, for which a modified Langley technique(Reagan et al. 1995; Michalsky et al. 1995; Schmid et al.1996, 2001) was employed to account for water vaporabsorption.
Because absorption by water vapor varies stronglywithin the 5-nm FWHM bandpass of the AATS chan-nel centered at 941 nm, the usual Beer–Lambert–Bouguer expression must be modified to describe cor-rectly the relationship between the output detectorvoltage V(941) and the atmospheric attenuators on thesun-to-instrument path. In particular,
V�941 nm� � V0�941 nm�d�2
exp ��i
mi�i�941 nm��Tw, �1�
where V0(941 nm) is the exoatmospheric calibrationvoltage, d is the earth–sun distance in astronomicalunits at the time of observation, mi is the airmass factor(ratio of slant path optical depth to vertical opticaldepth) for attenuating species i (where i represents gasscattering, nonwater vapor gas absorption, or aerosolextinction), �i is the optical depth for the ith attenuatingspecies other than water vapor, and Tw is the watervapor transmittance (weighted by absorption strength,source intensity, and filter function). Consistent withthe approach followed by Livingston et al. (2007), weused the three-parameter expression of Ingold et al.(2000) to parameterize Tw as a function of the amountof water vapor ws along the slant path:
Tw � c exp��awsb�. �2�
In this expression, the coefficients a, b, and c are leastsquares fitting parameters. In particular, calculationswere performed using the radiative transfer code LBL-RTM V9.2 (Clough et al. 2005) for a variety of modelatmospheres (tropical, midlatitude summer, midlati-tude winter, subarctic summer, subarctic winter, and1976 U.S. Standard Atmosphere) and a range of solarzenith angles to extend Livingston et al.’s (2007) Table2 results to include all altitudes (maximum of �12.5km) flown by the DC-8 during SOLVE II. These resultsare shown in Fig. 1 and the complete set of fitting co-efficients is given in Table 1. We have calculated one setof fitting parameters to LBLRTM results for the com-posite set of model atmospheres rather than calculatingfitting parameters separately for each model atmo-sphere because inclusion of all the model atmosphereresults yields a wide range of water vapor transmit-tances and slant path water vapor amounts. These canthen be applied to a wide range of sun photometertransmittance measurements obtained at any altitudewith no extrapolation to values of water vapor trans-mittance and slant amount outside the range of resultsfrom LBLRTM calculations that use a single model(e.g., the subarctic winter atmosphere).
As noted by Livingston et al. (2007) and illustrated
1734 J O U R N A L O F A T M O S P H E R I C A N D O C E A N I C T E C H N O L O G Y VOLUME 25
Unauthenticated | Downloaded 12/20/21 03:34 PM UTC

here in Fig. 1, a retrieval that ignores the instrumentaltitude can result in an incorrect determination of slantpath (hence, column) water vapor. In particular, if it isassumed that the instrument is located at sea level, thencolumn water vapor (CWV) would be underestimatedfor instrument altitudes above sea level, and the errorswould be greatest for large SZAs (high airmass values),and high CWV (hence, high slant water vapor)amounts.
Column water vapor is calculated from the slantamount by dividing by an appropriate water vapor air-mass factor. These airmass factors were calculated us-ing the methodology reported in Russell et al. (2005)and Livingston et al. (2005) by assuming a water vaporvertical distribution corresponding to the subarctic win-ter atmospheric model for the 21 January 2003 mea-surements and the midlatitude winter atmosphericmodel for the 6 February 2003 data. The uncertainty inCWV is computed following Schmid et al. (1996). Thecalculated CWV values are averaged within 50-m ver-tical bins, and a smoothing spline is then fit to the re-sultant CWV profile. Water vapor density (�w) is ob-tained as the derivative of the spline fit. This procedurehas been described in detail in Schmid et al. (2000) andLivingston et al. (2007).
b. Diode laser hygrometer
The NASA Langley/Ames diode laser hygrometer(DLH) was designed and built to measure gas-phasewater in the free-stream region of the NASA DC-8aircraft, between the fuselage and the cowling of anoutboard engine. The instrument is described in detailelsewhere (Vay et al. 1998; Diskin et al. 2002; Podolskeet al. 2003), so only a brief description is given here.
The DLH instrument is a near-infrared (NIR) spec-trometer operating at wavelengths near 1.4 m to de-tect individual rotation–vibration lines of H2O in eitherthe (101) combination band or the (200) overtone band.Second harmonic detection (Sachse et al. 1977, 1987;
FIG. 1. LBLRTM calculations of water vapor transmittance Tw as a function of slant path water vaporand aircraft (instrument) altitude for the AATS 941-nm channel. Results are shown (a) for altitudes from0 to 13 km and (b) on expanded axes for altitudes of 9–13 km only.
TABLE 1. Coefficients of Ingold et al. (2000) three-parameterfunctional fit (two-parameter at altitudes below 4 km) toLBLRTM v9.2 calculations of water vapor transmittance as afunction of slant path water vapor ws (where ws is in units of cmor g cm�2) for the AATS channel centered at 940.6 nm. Values foraltitudes 0–8 km are the same as those shown in Table 2 of Liv-ingston et al. (2007).
Alt (km) a b c
0 0.516 23 0.6439 1.000 001 0.496 69 0.6331 1.000 002 0.474 92 0.6238 1.000 003 0.451 91 0.6186 1.000 004 0.437 00 0.6053 1.005 405 0.422 17 0.5929 1.009 246 0.404 99 0.5859 1.010 067 0.388 88 0.5892 1.008 558 0.380 05 0.6059 1.006 149 0.386 92 0.6354 1.003 94
10 0.432 34 0.6897 1.001 9511 0.538 60 0.7600 1.000 7712 0.604 97 0.7952 1.000 4013 0.335 51 0.6835 1.000 86
OCTOBER 2008 L I V I N G S T O N E T A L . 1735
Fig 1 live 4/C
Unauthenticated | Downloaded 12/20/21 03:34 PM UTC

Reid and Labrie 1981; Podolske and Loewenstein 1993,and references therein) and long path length are uti-lized to achieve high sensitivity, and two or more linesof different strengths are used to meet the dynamicrange requirements for atmospheric water. The beamof a NIR diode laser is quasicollimated and transmittedthrough a quartz window secured in a DC-8 windowplate, toward the cowling of the right (starboard) sideoutboard engine. There it strikes a sheet of retroreflec-tor material and returns to the fuselage window fromwhich it originally emerged. Inside the window a por-tion of the return beam is passed through a narrowbandinterference filter, collected by a Fresnel lens, and fo-cused onto a detector. The sample volume of the ex-ternal path is completely exchanged every 40–70 ms,depending on aircraft velocity. The laser wavelength ismodulated, and the signal detector output is synchro-nously demodulated to produce the second harmonicsignal. The second harmonic (2F) and DC componentsfrom the signal detector are recorded to allow powernormalizing of the 2F signal.
The laser radiation emitted from the rear facet of thediode laser is sent through a short (50 mm) referencecell containing pure water vapor and onto a seconddetector. The reference detector output is synchronous-ly demodulated at the third harmonic (3F), the centralzero crossing of which is subsequently used to lock thelaser wavelength to the center of the chosen absorptionline.
DLH calibration and data retrieval algorithms aredescribed by Podolske et al. (2003). During SOLVE-IIand subsequently, efforts to quantify DLH accuracyhave yielded a typical uncertainty of �5%, with a pre-cision at 5 ppmv water vapor of approximately 1%. Theminimum water vapor mixing ratios measured by DLHfor the two profiles discussed in this paper were 11ppmv (at 9.7 km) and 4.6 ppmv (at 12.5 km) for the 21January and 6 February profiles, respectively.
3. Results
Results from the first comparison profile, which wasflown 21 January 2003 on a DC-8 ascent out of Kiruna,Sweden, are presented in Fig. 2. The AATS was able toview the sun at DC-8 altitudes between �7.7 and 10km, thus allowing calculation of CWV at each altitudein that range. The AATS and DLH CWV profiles areoverplotted in Fig. 2a, in addition to the atmosphericstatic temperature profile measured by a probemounted on the DC-8. Because DLH measures local(not column) water vapor, the DLH CWV value atprofile top is set equal to the AATS value there, andDLH CWV values below that altitude are obtained by
integrating DLH local values downward. Correspond-ing AATS and DLH water vapor densities are over-plotted in Fig. 2b. As noted in section 2a, AATS �w isobtained as the vertical derivative of a spline fit to theAATS CWV profile that results after averaging theCWV values within 50-m vertical bins.
Scatterplot comparisons of AATS and DLH CWVand �w for the 21 January profile are shown in Figs. 2cand 2d. The statistics shown on each scatterplot quan-tify the correlation and agreement between the AATSand DLH results. For CWV, the data yield r2 0.977, rmsdifference 0.0004 g cm�2 (13.0%), and bias (AATS �DLH) 0.0002 g cm�2 (8.1%). Integration of the DLH�w values over the layer bounded by the minimum (7.69km) and maximum (9.97 km) altitudes for which AATSCWV values were calculated yields layer water vapor(LWV) of 0.0038 g cm�2, which is 24% drier than thecorresponding AATS LWV value, 0.0050 g cm�2. Here,we note that if the absolute rms difference and bias inCWV (or, equivalently, in LWV) are expressed as per-centages of LWV instead of CWV, the relative valuesincrease (rms difference: 31.1%; bias: 19.6%) becauseLWV is less than CWV. Corresponding values for �w
are r2 0.887, rms difference 92.1%, and bias (AATS �DLH) 37.3%. This agreement is noteworthy in light ofthe very dry conditions: maximum AATS CWV of0.007 g cm�2 and maximum �w of 0.1 g m�3. Table 2summarizes the AATS and DLH results for the twoSOLVE II profiles and includes �w results from threeother campaigns in which coincident AATS and in situsensor (not DLH) water vapor measurements were ac-quired from the same aircraft.
Examination of Figs. 2a and 2b reveals that theAATS – DLH LWV difference of 24% (0.0012 g cm�2)is dominated by differences between AATS and DLHwater vapor values in the lowest 0.5 km (7.7–8.2 km) ofthe profile. In an effort to explain these differences, wehave examined the sensitivity of the AATS results tothe water vapor airmass factors—that is, to the watervapor vertical distribution used to calculate these air-mass factors. As noted above in section 2a, the AATSCWV values were derived using water vapor airmassfactors calculated from the water vapor number densityvertical distribution defined by the subarctic winter at-mospheric model. The DC-8 ascent from 7.7 to 10 kmcovered a horizontal distance of �160 km in 0.25 h.During the ascent the true SZA decreased from 89.08°to 88.56°, for which water vapor airmass factors calcu-lated from the subarctic winter atmosphere model de-crease from 35.9 to 25.9, although the airmass factorbetween 7.7 and 8.2 km only decreases from 35.9 to33.5. In fact, DLH measurements are available between2.0 km and 10 km and have been combined with the
1736 J O U R N A L O F A T M O S P H E R I C A N D O C E A N I C T E C H N O L O G Y VOLUME 25
Unauthenticated | Downloaded 12/20/21 03:34 PM UTC

subarctic winter atmospheric model below and abovethe DLH profile to construct a composite water vaporprofile, for which a new set of water vapor airmassfactors has been derived. Application of these airmassfactors to the AATS water vapor transmittances de-creases the AATS LWV from 0.0050 to 0.0043 g cm�2,in much better agreement with the DLH LWV value of0.0038 g cm�2, but the new AATS CWV profile (notshown) still falls within the AATS CWV error bandshown in Fig. 2. Use of these air masses yields corre-sponding decreases in AATS � DLH CWV and �w biasand rms differences. In particular, the AATS � DLHCWV bias decreases from 8.1% to 1.5%, and therms difference decreases from 13.0% to 7.4%. TheAATS � DLH �w bias decreases from 37.3% to 19.1%,and the rms difference decreases from 92.1% to 76.2%.However, the general shape of the AATS �w profile
does not change, and the divergence between theAATS and DLH �w values in the altitude range be-tween 7.7 and 8.2 km is only marginally reduced. Weare left to conclude that these differences are real andare due to water vapor spatiotemporal inhomogeneity.Although this exercise is useful for providing somemeasure of the sensitivity of the 21 January AATSCWV retrieval to air mass (i.e., to the water vapor ver-tical distribution), it is not practical for calculating realtime AATS �w profiles because, typically, no a prioriinformation on the vertical distribution of water vaporis available.
Figure 3 shows results from the second comparisonprofile, which was flown 6 February 2003 as the DC-8descended into Edwards Air Force Base, California, onits return from Sweden. In this case, AATS was able toview the sun at DC-8 altitudes from �12.5 km to 1.1
FIG. 2. For the 21 Jan 2003 DC-8 ascent out of Kiruna, Sweden, (a) profiles of AATS unbinned (blackcrosses) and binned (blue dots) CWV, AATS one-sigma CWV uncertainties (dashed blue lines), DLHCWV (red dots), and static atmospheric temperature (magenta dots); (b) corresponding profiles ofAATS and DLH water vapor density; (c) a scatterplot of AATS vs DLH CWV (blue dots), AATS CWVuncertainties (dashed blue lines), and linear regression fit (red line); and (d) scatterplot of AATS vsDLH water vapor density, and linear regression fit (red line). For CWV, the DLH value at profile tophas been set equal to the AATS value there. Black dashed lines in (c) and (d) represent the one-to-onecorrespondence.
OCTOBER 2008 L I V I N G S T O N E T A L . 1737
Fig 2 live 4/C
Unauthenticated | Downloaded 12/20/21 03:34 PM UTC
km. This profile is noteworthy for combining very dryconditions above �5.5 km (similar to those in the 21January case; cf. Fig. 2) with significantly increasedCWV and �w as well as strong vertical structure below�5.5 km (although values are still small compared tothe previous AATS comparisons cited in section 1).Another significant feature of this profile is the avail-ability of water vapor measurements from a Sippican IIradiosonde released from Edwards at 1446 UTC (1.75 hbefore the DC-8 began its descent). Figures 3a and 3boverplot the results for the entire range of measure-ment altitudes, Figs. 3c and 3d expand the results foraltitudes between 6.0 and 12.5 km, and Figs. 3e and 3fshow results between 1.1 and 6.0 km. We note that thespline-fitting function was adjusted to smooth theAATS CWV values above 4.5 km (i.e., for relativelylow values of CWV) more than those below 4.5 km tominimize the effect on the calculated AATS water va-por density profile due to spatial and/or temporal watervapor variability (as manifested by increasing CWVwith altitude for selected altitudes above 8.5 km) alongthe AATS-to-sun slant path.
For the entire altitude range traversed by the DC-8during its descent on 6 February, the DLH measuresLWV (0.291 g cm�2) that is 5% greater than the cor-responding AATS LWV value (0.277 g cm�2). Corre-sponding values of AATS and DLH CWV and �w forthe 6 February profile are compared in scatterplots inFig. 4 and are listed in Table 2. Results for CWV are r2
0.998, rms difference 0.0041 g cm�2 (6.6% CWV; 7.0%LWV), and bias (AATS � DLH) 0.0005 g cm�2 (0.8%CWV; 1.0% LWV). Corresponding values for �w are r2
0.965, rms difference 0.068 g m�3 (25.2%), and bias(AATS minus DLH) �0.013 g m�3 (�4.8%). As can beseen in Table 2, if the analysis (not plotted separately)of the 6 February data is restricted to altitudes above5.5 km, the CWV and �w r2 values are similar to the 21January results. The values of absolute rms differenceand bias for the altitude-restricted 6 February analysisare about twice those of the 21 January profile, whereascorresponding values of relative �w rms difference andbias are significantly lower than the 21 January results.For comparisons between AATS and the radiosonde,the overall agreement is good: for AATS values inter-polated to sonde-reported altitudes, AATS and sondeCWV have r2 0.998, rms difference 0.010 g cm�2, andbias (AATS � sonde) 0.006 g cm�2. Correspondingvalues for �w are r2 0.910, rms difference 0.109 g m�3
(34.6%), and bias (AATS � sonde) 0.026 g m�3 (8.3%).The maxima of the scatterplots (CWV � 0.3 g cm�2;�w � 1.1 g m�3), although larger than those shown inFig. 2, are still noteworthy for their small values. For
TA
BL
E2.
SOL
VE
IIA
AT
S,D
LH
,and
radi
oson
dew
ater
vapo
rre
trie
val
stat
isti
cs;A
AT
Sin
situ
resu
lts
from
prev
ious
fiel
dca
mpa
igns
.
Dat
eA
ltra
nge
(km
)L
WV
(gcm
�2)
r2 CW
VC
WV
bias
(gcm
�2)
CW
Vrm
sdi
ff(g
cm�
2)
r2 �w
� wbi
as(g
m�
3)
� wrm
sdi
ff(g
m�
3)
AA
TS
DL
H
21Ja
n20
037.
69–9
.69
0.00
500.
0038
0.97
70.
0002
(8.1
*,19
.6**
)0.
0004
(13.
0*,3
1.1*
*)0.
887
0.00
6(3
7.3%
)0.
015
(92.
1%)
6F
eb20
03(a
lt�
5.5
km)
5.50
–12.
450.
0182
0.01
900.
993
0.00
04(4
.7*,
8.7*
*)0.
0007
(8.7
*,16
.2**
)0.
874
0.00
1(3
.2%
)0.
010
(38.
4%)
6F
eb20
03(a
llal
titu
des)
1.10
–12.
450.
277
0.29
10.
998
0.00
05(0
.8*,
0.9*
*)0.
0041
(6.6
*,7.
0**)
0.96
5�
0.01
3)(�
4.8%
)0.
068
(25.
2%)
6F
eb20
03(a
llal
titu
des:
radi
oson
de)
1.10
–12.
450.
277
0.25
20.
998
0.00
57(7
.2*,
7.5*
*)0.
0101
(12.
8*,1
3.4*
*)0.
910
0.02
6(8
.3%
)0.
109
(34.
6%)
21Ja
n,6
Feb
(all
alti
tude
s)0.
998
0.00
05(0
.9*,
1.0*
*)0.
0037
(7.2
,*7.
7**)
0.96
8�
0.00
9(�
4.2%
)0.
062
(27.
6%)
21Ja
n,6
Feb
(alt
�5.
5km
)0.
994
0.00
03(5
.0*,
9.6*
*)0.
0006
(9.5
*,18
.0**
)0.
825
0.00
2(9
.7%
)0.
012
(49.
6%)
AC
E-A
sia,
2001
(Sch
mid
etal
.200
3b:A
AT
Svs
Edg
eTec
hC
hille
dM
irro
r13
7-C
3)�
0.0–
3.8
0.96
1—
0.63
3(2
4.9%
)
SGP
,200
3(S
chm
idet
al.2
006:
AA
TS
vsE
dgeT
ech
Chi
lled
Mir
ror
137-
C3)
�0.
2–5.
70.
958
—(�
5.0%
)0.
628
(19.
8%)
ICA
RT
T,2
004
(Liv
ings
ton
etal
.200
4:A
AT
Svs
Vai
sala
HM
P24
3)0.
05–6
.00.
977
�0.
313
(�7.
1%)
0.90
4(2
0.3%
)
*V
alue
in%
CW
V.
**V
alue
in%
LW
V.
1738 J O U R N A L O F A T M O S P H E R I C A N D O C E A N I C T E C H N O L O G Y VOLUME 25
Unauthenticated | Downloaded 12/20/21 03:34 PM UTC

example, in previous AATS comparisons to in situ andother remote water vapor measurements, CWV hasranged up to �5 g cm�2 and �w up to �17 g m�3.
As can be seen in Figs. 3d and 3f, the radiosondemeasured higher values of �w than did AATS or DLH
between 5.5 and 7 km and in the lower stratosphere(LS) between 11 and 12 km, but lower �w between 7and 9 km and between �3.2 and 4.5 km. Previous stud-ies by Wang et al. (2003), Ferrare et al. (2004), andMiloshevich et al. (2006) have found that the Sippican
FIG. 3. For the 6 Feb 2003 DC-8 descent into Edwards Air Force Base (AFB), (a) profiles of AATSCWV (blue dots), AATS one-sigma CWV uncertainties (dashed blue lines), DLH CWV (red dots),CWV (green squares) calculated from Edwards AFB 1446 UTC radiosonde, and static atmospherictemperature (DC-8: magenta; sonde: green), and (b) corresponding profiles of water vapor density. (c),(d) As in (a), (b), but for altitudes above 6 km only with expanded axes limits; (e), (f) as in (a), (b) butfor altitudes below 6 km only. For CWV, the DLH and sonde values at profile top have been set equalto the AATS value there.
OCTOBER 2008 L I V I N G S T O N E T A L . 1739
Fig 3 live 4/C
Unauthenticated | Downloaded 12/20/21 03:34 PM UTC

carbon hygristor sensor fails to respond to humiditychanges at colder temperatures and thus cannot pro-vide reliable measurements of relative humidity in theupper troposphere (UT). This may explain the higherEdwards sonde �w values measured in the LS and cer-tainly raises doubts about the validity of the data notonly in the LS but throughout the UT (i.e., above �6km). Also, because no radiation correction is applied tothe Sippican temperature data, heating by solar radia-tion could lead to an incorrect temperature measure-ment and thus contribute to an incorrect estimate ofwater vapor density. However, there is no direct evi-dence of this effect; examination of Fig. 3a indicatesthat measurements of static temperature by the DC-8sensor and by the radiosonde are virtually indistin-guishable throughout most of the troposphere, exceptwithin the temperature inversion at 3.2 km, where thesonde is warmer by �2°C, and in the LS, where theDC-8 sensor is actually 1–2°C warmer than the sonde.
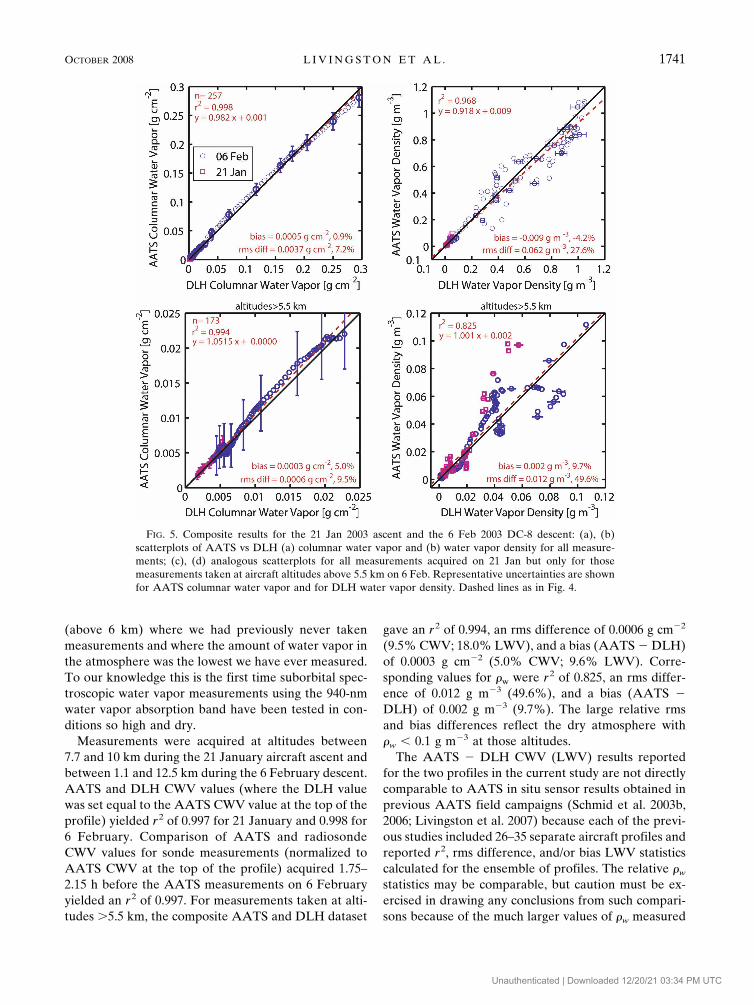
Figure 5 shows scatterplots that combine AATS and
DLH results for the profiles on 21 January and 6 Feb-ruary. AATS and DLH CWV (Fig. 5a) have r2 0.998,rms difference 7.2% (7.7% LWV), and bias (AATS �DLH) 0.9% (1.0% LWV). Corresponding values for �w
(5b) are r2 0.968, rms difference 27.6%, and bias(AATS � DLH) �4.2%. Results for altitudes �5.5 kmonly are shown for CWV and �w in Figs. 5c and 5d,respectively. For CWV, values are r2 0.994, rms dif-ference 9.5% (18.0% LWV), and bias (AATS �DLH) 5.0% (9.5% LWV). For �w, values are r2
0.825, rms difference 49.6%, and bias (AATS � DLH)9.7%.
4. Summary and conclusions
This paper has compared values of CWV and �w cal-culated from simultaneous measurements acquired bythe AATS and DLH sensors on the DC-8 for two ver-tical profiles flown during SOLVE II. This study isunique because it includes data acquired at altitudes
FIG. 4. For the 6 Feb 2003 DC-8 descent into Edwards AFB, scatterplots of (a), (b) AATS vs DLH(a) CWV and (b) water vapor density, and (c), (d) AATS vs Edwards AFB 1446 UTC radiosonde (c)CWV and (d) water vapor density. AATS CWV one-sigma uncertainties are plotted with dashed bluelines in (a) and (c); DLH water vapor density uncertainties are plotted for selected points in (b). Blackdashed lines represent one-to-one correspondence; red dashed lines are the regression fits.
1740 J O U R N A L O F A T M O S P H E R I C A N D O C E A N I C T E C H N O L O G Y VOLUME 25
Fig 4 live 4/C
Unauthenticated | Downloaded 12/20/21 03:34 PM UTC
(above 6 km) where we had previously never takenmeasurements and where the amount of water vapor inthe atmosphere was the lowest we have ever measured.To our knowledge this is the first time suborbital spec-troscopic water vapor measurements using the 940-nmwater vapor absorption band have been tested in con-ditions so high and dry.
Measurements were acquired at altitudes between7.7 and 10 km during the 21 January aircraft ascent andbetween 1.1 and 12.5 km during the 6 February descent.AATS and DLH CWV values (where the DLH valuewas set equal to the AATS CWV value at the top of theprofile) yielded r2 of 0.997 for 21 January and 0.998 for6 February. Comparison of AATS and radiosondeCWV values for sonde measurements (normalized toAATS CWV at the top of the profile) acquired 1.75–2.15 h before the AATS measurements on 6 Februaryyielded an r2 of 0.997. For measurements taken at alti-tudes �5.5 km, the composite AATS and DLH dataset
gave an r2 of 0.994, an rms difference of 0.0006 g cm�2
(9.5% CWV; 18.0% LWV), and a bias (AATS � DLH)of 0.0003 g cm�2 (5.0% CWV; 9.6% LWV). Corre-sponding values for �w were r2 of 0.825, an rms differ-ence of 0.012 g m�3 (49.6%), and a bias (AATS �DLH) of 0.002 g m�3 (9.7%). The large relative rmsand bias differences reflect the dry atmosphere with�w � 0.1 g m�3 at those altitudes.
The AATS � DLH CWV (LWV) results reportedfor the two profiles in the current study are not directlycomparable to AATS in situ sensor results obtained inprevious AATS field campaigns (Schmid et al. 2003b,2006; Livingston et al. 2007) because each of the previ-ous studies included 26–35 separate aircraft profiles andreported r2, rms difference, and/or bias LWV statisticscalculated for the ensemble of profiles. The relative �w
statistics may be comparable, but caution must be ex-ercised in drawing any conclusions from such compari-sons because of the much larger values of �w measured
FIG. 5. Composite results for the 21 Jan 2003 ascent and the 6 Feb 2003 DC-8 descent: (a), (b)scatterplots of AATS vs DLH (a) columnar water vapor and (b) water vapor density for all measure-ments; (c), (d) analogous scatterplots for all measurements acquired on 21 Jan but only for thosemeasurements taken at aircraft altitudes above 5.5 km on 6 Feb. Representative uncertainties are shownfor AATS columnar water vapor and for DLH water vapor density. Dashed lines as in Fig. 4.
OCTOBER 2008 L I V I N G S T O N E T A L . 1741
Fig 5 live 4/C
Unauthenticated | Downloaded 12/20/21 03:34 PM UTC

in the prior studies. Nevertheless, to put the currentresults in the context of the previous measurements, weinclude in Table 2 the comparative AATS in situ sensor�w statistics reported in those studies.
Most recently, Livingston et al. (2007) comparedLWV and �w measured by AATS and by a VaisalaHMP243 humidity sensor mounted on the same aircraftduring 35 vertical profiles acquired over the Gulf ofMaine, with maximum LWV � 3.7 g cm�2 and maxi-mum �w � 16 g m�3. For the ensemble of 35 profiles,they found for �w an r2 of 0.98, an rms difference of20.3% (0.904 g m�3), and bias (AATS � Vaisala)�7.1% (�0.313 g m�3). For coincident measurementsacquired with AATS and with an EdgeTech 137-C3chilled mirror during 35 vertical profiles over the At-mospheric Radiation Measurement (ARM) southernGreat Plains (SGP) site in 2003, Schmid et al. (2006)reported for �w an r2 of 0.958, an rms difference of19.8% (0.628 g m�3), and an AATS � mirror bias of�5%. In each of these studies, AATS was equippedwith the same 941-nm interference filter used duringSOLVE II. Schmid et al. (2003b) compared coincidentmeasurements acquired with AATS (using a different941-nm interference filter from that used in the 2003SGP and 2004 SOLVE II campaigns) and with anEdgeTech Chilled Mirror 137-C3 and a VaisalaHMP243 mounted on the same aircraft during 36 ver-tical profiles during the 2003 ACE–Asia field cam-paign. For the AATS � mirror �w, they calculated an r2
of 0.961 and an rms difference of 24.9% (0.633 g m�3).The AATS � Vaisala results were almost identical.When the data obtained at all altitudes for 6 February2003 are included in the analyses, the AATS � DLH r2
values for SOLVE II equal those reported in the pre-vious AATS studies. For data obtained on 21 Januaryand for the composite dataset restricted to those dataacquired above 5.5 km on 6 February, the AATS �DLH r2 values (0.82–0.89) are less than the earlier re-sults. The AATS � DLH �w relative rms difference andbias for 21 January are significantly higher than theprevious results, as are relative rms differences for thehigh altitude 6 February and high altitude compositedatasets. Again, about all that can be concluded is thatthe large relative rms and bias differences reflect thedry atmosphere at those altitudes.
We are encouraged that useful water vapor retrievalswere derived from the AATS measurements on 21January when data were acquired at high altitude forrelatively high SZAs (89.08° to 88.56°). These resultsare consistent with successful retrievals of aerosol op-tical depth and columnar ozone from AATS measure-ments taken at high altitude and high SZAs duringSOLVE II (Russell et al. 2005; Livingston et al. 2005).
Although horizontal inhomogeneities are more likelyto occur along long slant paths, these same long slantpaths can improve signal-to-noise ratio and reduce sunphotometer calibration uncertainties to allow extensioninto an area of low ambient water vapor density.
The comparisons presented here included a very lim-ited set of measurements at altitudes in the 6–12 kmrange, and additional comparisons between sun pho-tometer and in situ sensors are needed at these altitudeswhere the amount of water vapor in the atmosphere isso low to permit quantification of the uncertainty in thesun photometer-calculated �w values. Nevertheless, theagreement we have found between the AATS andDLH retrievals of CWV (essentially, LWV) gives ushope that airborne sun photometer measurements canprovide useful data for validation of satellite water va-por retrievals not only for the full atmospheric columnand for �w in the lowest few km of the troposphere, ashas been shown in previous studies, but also at altitudesin the upper troposphere where water vapor is limited.
Acknowledgments. We thank James Eilers and Rich-ard Kolyer for supporting AATS measurements andStephanie Ramirez for help with illustrations and for-matting. The SOLVE II measurements were supportedby NASA’s Upper Atmosphere Research Program.AATS analyses were supported by NASA’s Solar Oc-cultation Satellite Science Team.
REFERENCES
Clough, S. A., M. W. Shephard, E. J. Mlawer, J. S. Delamere,M. J. Iacono, K. Cady-Pereira, S. Boukabara, and P. D.Brown, 2005: Atmospheric radiative transfer modeling: Asummary of the AER codes. J. Quant. Spectrosc. Radiat.Transfer, 91, 233–244.
Diskin, G. S., J. R. Podolske, G. W. Sachse, and T. A. Slate, 2002:Open-path airborne tunable diode laser hygrometer. DiodeLasers and Applications in Atmospheric Sensing, A. Fried,Ed., International Society for Optical Engineering (SPIEProceedings, Vol. 4817), 196–204, doi:10.1117/12.453736.
Ferrare, R. A., and Coauthors, 2004: Characterization of upper-troposphere water vapor measurements during AFWEX us-ing LASE. J. Atmos. Oceanic Technol., 21, 1790–1808.
Ingold, T., B. Schmid, C. Mätzler, P. Demoulin, and N. Kämpfer,2000: Modeled and empirical approaches for retrieving co-lumnar water vapor from solar transmittance measurementsin the 0.72, 0.82, and 0.94 m absorption bands. J. Geophys.Res., 105, 24 327–24 343.
Livingston, J. M., V. Kapustin, B. Schmid, P. B. Russell, P. A.Durkee, T. Bates, and P. K. Quinn, 2000: Shipboard sunpho-tometer measurements of aerosol optical depth spectra andcolumnar water vapor during ACE-2 and comparison withselected land, ship, aircraft, and satellite measurements. Tel-lus, 52B, 593–618.
——, and Coauthors, 2003: Airborne sun photometer measure-ments of aerosol optical depth and columnar water vaporduring the Puerto Rico Dust Experiment and comparison
1742 J O U R N A L O F A T M O S P H E R I C A N D O C E A N I C T E C H N O L O G Y VOLUME 25
Unauthenticated | Downloaded 12/20/21 03:34 PM UTC

with land, aircraft, and satellite measurements. J. Geophys.Res., 108, 8588, doi:10.1029/2002JD002520.
——, and Coauthors, 2005: Retrieval of ozone column contentfrom airborne sun photometer measurements during SOLVEII: Comparison with coincident satellite and aircraft measure-ments. Atmos. Chem. Phys., 5, 2035–2054.
——, and Coauthors, 2007: Comparison of water vapor measure-ments by airborne Sun photometer and near-coincident insitu and satellite sensors during INTEX/ITCT 2004. J. Geo-phys. Res., 112, D12S16, doi:10.1029/2006JD007733.
Lumpe, J., and Coauthors, 2006: Validation of Polar Ozone andAerosol Measurement (POAM) III version 4 stratosphericwater vapor. J. Geophys. Res., 111, D11301, doi:10.1029/2005JD006763.
Michalsky, J. J., J. C. Liljegren, and L. C. Harrison, 1995: A com-parison of sun photometer derivations of total column watervapor and ozone to standard measures of same at the south-ern Great Plains atmospheric radiation measurement site. J.Geophys. Res., 100, 25 995–26 003.
Miloshevich, L., H. Vömel, D. Whiteman, B. Lesht, F. Schmidlin,and F. Russo, 2006: Absolute accuracy of water vapor mea-surements from six operational radiosonde types launchedduring AWEX-G and implications for AIRS validation. J.Geophys. Res., 111, D09S10, doi:10.1029/2005JD006083.
Nedoluha, G. E., R. M. Bevilacqua, K. W. Hoppel, J. D. Lumpe,and H. Smit, 2002: Polar Ozone and Aerosol MeasurementIII measurements of water vapor in the upper troposphereand lowermost stratosphere. J. Geophys. Res., 107, 4103,doi:10.1029/2001JD000793.
Podolske, J. R., and M. Loewenstein, 1993: Airborne tunable di-ode laser spectrometer for trace-gas measurement in thelower stratosphere. Appl. Opt., 32, 5324–5333.
——, G. W. Sachse, and G. S. Diskin, 2003: Calibration and dataretrieval algorithms for the NASA Langley/Ames diode laserhygrometer for the NASA Transport and Chemical Evolu-tion Over the Pacific (TRACE-P) mission. J. Geophys. Res.,108, 8792, doi:10.1029/2002JD003156.
Reagan, J., K. Thome, B. Herman, R. Stone, J. Deluisi, and J.Snider, 1995: A comparison of columnar water vapor retriev-als obtained with near-IR solar radiometer and microwaveradiometer measurements. J. Appl. Meteor., 34, 1384–1391.
Redemann, J., S. J. Masonis, B. Schmid, T. L. Anderson, P. B.Russell, J. M. Livingston, O. Dubovik, and A. D. Clarke,2003: Clear-column closure studies of aerosols and water va-por aboard the NCAR C-130 in ACE-Asia, 2001. J. Geophys.Res., 108, 8655, doi:10.1029/2003JD003442.
Reid, J., and D. Labrie, 1981: Second-harmonic detection withtunable diode lasers—Comparison of experiment and theory.Appl. Phys, 26B, 203–210.
Russell, P. B., and Coauthors, 1993a: Pinatubo and pre-Pinatubooptical-depth spectra: Mauna Loa measurements, compari-sons, inferred particle size distributions, radiative effects, andrelationship to lidar data. J. Geophys. Res., 98, 22 969–22 985.
——, and Coauthors, 1993b: Post-Pinatubo optical depth spectravs. latitude and vortex structure: Airborne tracking sunpho-tometer measurements in AASE II. Geophys. Res. Lett., 20,2571–2574.
——, and Coauthors, 2005: Aerosol optical depth measurementsby airborne sun photometer in SOLVE II: Comparisons to
SAGE III, POAM III, and airborne spectrometer measure-ments. Atmos. Chem. Phys., 5, 1311–1339.
——, and Coauthors, 2007: Multi-grid-cell validation of satelliteaerosol property retrievals in INTEX/ITCT/ICARTT 2004. J.Geophys. Res., 112, D12S09, doi:10.1029/2006JD007606.
Sachse, G. W., G. F. Hill, L. O. Wade, and E. P. Condon, 1977:DACOM-A rapid, high sensitivity airborne carbon monoxidemonitor. Proc. Fourth Joint Conf. on Sensing of Environmen-tal Pollutants, Washington, DC, American Chemistry Society,590–593.
——, ——, ——, and M. G. Perry, 1987: Fast-response, high-precision carbon monoxide sensor using a tunable diode laserabsorption technique. J. Geophys. Res., 92, 2071–2081.
Schmid, B., and C. Wehrli, 1995: Comparison of Sun photometercalibration by use of the Langley technique and standardlamp. Appl. Opt., 34, 4500–4512.
——, K. J. Thome, P. Demoulin, R. Peter, C. Mätzler, and J.Sekler, 1996: Comparison of modeled and empirical ap-proaches for retrieving columnar water vapor from solartransmittance measurements in the 0.94- m region. J. Geo-phys. Res., 101, 9345–9358.
——, and Coauthors, 2000: Clear sky closure studies of lowertropospheric aerosol and water vapor during ACE-2 usingairborne sunphotometer, airborne in-situ, space-borne, andground-based measurements. Tellus, 52B, 568–593.
——, and Coauthors, 2001: Comparison of columnar water-vapormeasurements from solar transmittance methods. Appl. Opt.,40, 1886–1896.
——, and Coauthors, 2003a: Coordinated airborne, spaceborne,and ground-based measurements of massive thick aerosollayers during the dry season in southern Africa. J. Geophys.Res., 108, 8496, doi:10.1029/2002JD002297.
——, and Coauthors, 2003b: Column closure studies of lower tro-pospheric aerosol and water vapor during ACE-Asia usingairborne sun photometer and airborne in-situ and ship-basedlidar measurements. J. Geophys. Res., 108, 8656, doi:10.1029/2002JD003361.
——, and Coauthors, 2006: How well do state-of-the-art tech-niques measuring the vertical profile of tropospheric aerosolextinction compare? J. Geophys. Res., 111, D05S07,doi:10.1029/2005JD005837.
Taha, G., L. W. Thomason, and S. P. Burton, 2004: Comparison ofStratospheric Aerosol and Gas Experiment (SAGE) II ver-sion 6.2 water vapor with balloon-borne and space-based in-struments. J. Geophys. Res., 109, D18313, doi:10.1029/2004JD004859.
Thomason, L. W., S. P. Burton, N. Iyer, J. M. Zawodny, and J.Anderson, 2004: A revised water vapor product for theStratospheric Aerosol and Gas Experiment (SAGE) II ver-sion 6.2 data set. J. Geophys. Res., 109, D06312, doi:10.1029/2003JD004465.
Vay, S. A., and Coauthors, 1998: DC-8-based observations of air-craft CO, CH4, N2O, and H2O(g) emission indices duringSUCCESS. Geophys. Res. Lett., 25, 1717–1720.
Wang, J., D. J. Carlson, D. B. Parsons, T. F. Hock, D. Lauritsen,H. L. Cole, K. Beierle, and E. Chamberlain, 2003: Perfor-mance of operational radiosonde humidity sensors in directcomparison with a chilled mirror dew-point hygrometer andits climate implication. Geophys. Res. Lett., 30, 1860,doi:10.1029/2003GL016985.
OCTOBER 2008 L I V I N G S T O N E T A L . 1743
Unauthenticated | Downloaded 12/20/21 03:34 PM UTC