compete annex 03 2006-08-31 - european...
TRANSCRIPT

COMPETE Annex 3 8 Poland - 109 -
8 Poland
8.1 Introduction
Most of us meet the symptoms of congestion in the city traffic on jammed streets, crowded
buses, subway or tramps. However congestion does not only concern roads. In all means of
transport we run the risk of overcrowding, accumulations, overburdens. Apart from social life
congestion applies to business activity. Under financing of transport and differences between
social and private cost of transport are crucial reasons for emerging of the congestion. Mu-
tual relations among users of roads infrastructure and users of vehicles are the essence of
transport congestion. Congestion appears when demand for transport infrastructure exceed
potential of efficient service for users, causing increase of transport cost. Types of the con-
gestion can be divided into two groups: congestion of transport network and congestion of
means of transport. Results of the congestion are decline of quality of transport services and
even impossibility of utilization of them in a given time. Congestion causes increase of cost
of: vehicles exploitation, infrastructure maintenance, losses of time, accidents, pollution, and
loses in the result of unrealized journeys and freights.
Collected questionnaires picture the outline of the congestion situation, overcrowding and
overburden of transport in Poland. Information about road transport in Poland and in War-
saw city, rail, sea and air transport was supplied by the respondents. In addition a review of
literature on the subject was carried out. The results, which are summarised by mode below,
show own peculiarity and possible differences of separated means of transport.
8.2 Inter-urban road transport
8.2.1 Methodology
Country-wide measurements of traffic conditions are carried out manually with the support
of automatic measuring devices every 5 years. Recorded are traffic volumes, vehicle category
and travel purposes, vehicle occupancy rates, time, location and length of traffic jams. Direct
measurements of the congestion are not performed, only statistics of accidents and casualties
are collected.
The national traffic measurement, performed every 5 years, let calculate average daily num-
ber of vehicles on national, international and regional roads, divided by type of the roads,
vehicles category, longitudes of the roads, number of lanes, but measurements of length of
traffic jams are not conducted. Measurements are conducted on request of government de-
partments and other institutions, are utilized by Central Statistical Office and are published
e.g. on the web page of the General Directorate for National Roads and Motorways
(www.gddkia.gov.pl). In addition, traffic volumes are measured continuously by automatic
counting devices all over the national road network. The data is mainly used to determine the
capacity of various types of intersections and road segments.

- 110 - 8 Poland COMPETE Annex 3
Source:
http://www.gddkia.gov.pl/article/generalny_pomiar_ruchu/gpr_2005/article.php/id_item_tree/be14d7067d60cc982836ea7dfbc4cb85/id_art/36649013fb341eb1a946c91da5756e06
Figure 8-1: Traffic growth on international roads (1995 – 2005).
8.2.2 Current situation
Due to the still insufficient number of motorways frequent congestion is visible and is per-
ceived a problem in inter-urban road transport. Locations usually suffering from congestion
are the roads into or out of the cities, level crossings and border checkpoints. The major
problem in the country is the lack of motorways and bypasses of the cities. Actually about
20 bypasses are built. An additional factor is the low safety level typical for Polish roads,
which make drivers often choose longer but safer alternative routes. Other reasons for con-
gestion are weather conditions, especially during cold months.
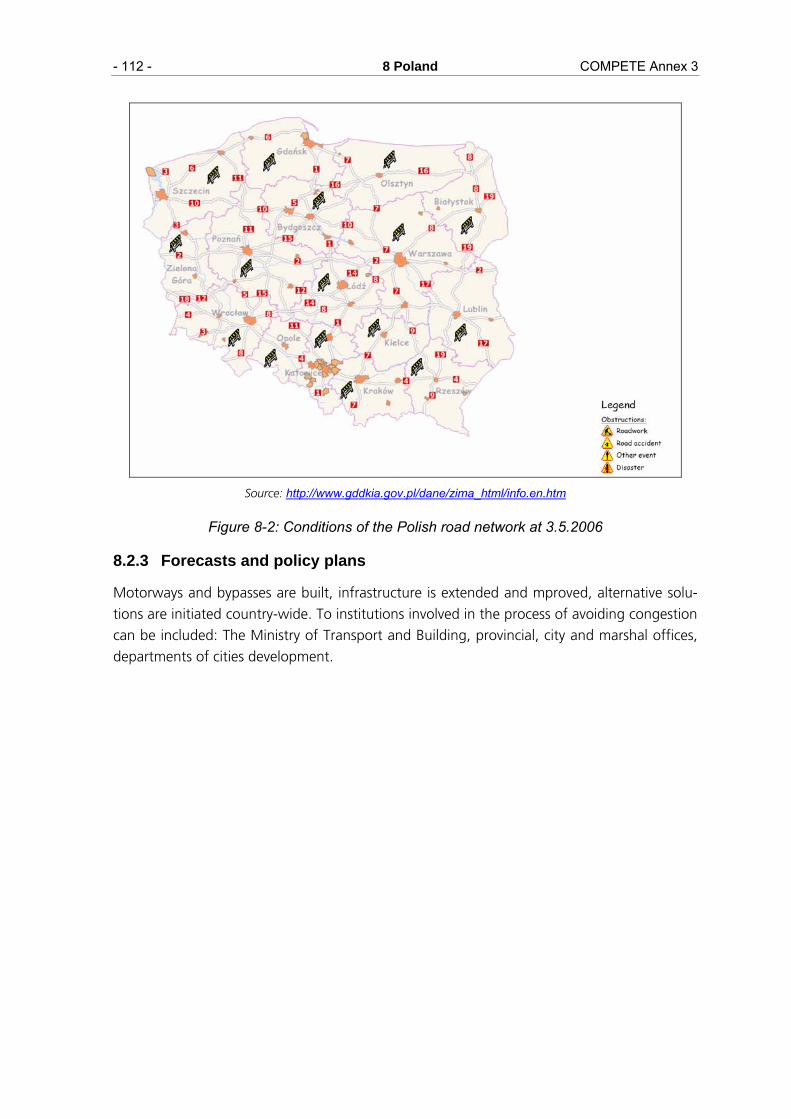
Current road conditions are accessible nation wide on the home page of GDDKiA:
Table 8-1: Growth of traffic load on the network of the roads
Average daily traffic (SDR) [vehicles / 24 hours]
Motor vehicles Bikes Roads
2000 2005 2000 2005
Total national 7009 8244 78 63
including: '
International 11448 13561 52 39
Others national 5109 5990 89 74 Source:
http://www.gddkia.gov.pl/article/generalny_pomiar_ruchu/gpr_2005/article.php/id_item_tree/be14d7067d60cc982836ea7dfbc4cb85/id_art/ab54669261aafc2397ba6fbc71988a25

COMPETE Annex 3 8 Poland - 111 -
Table 8-2: Average daily traffic (SDR) on national and regional networks of the roads in 2005
Roads
International Other national National total No Province
SDR2005 [vehi-cles/24 hours]
Growth ratio 2005/2000
SDR2005 [vehi-cles/24 hours]
Growth ratio 2005/2000
SDR2005 [vehicles/24
hours]
Growth ratio
2005/2000
1 Dolnośląskie 12126 1,31 6094 1,2 8927 1,26
2 Kujawsko-Pomorskie 11780 1,2 6636 1,17 8154 1,18
3 Lubelskie 8342 1,1 4785 1,17 5966 1,14
4 Lubuskie 11448 1,35 4616 1,11 7331 1,26
5 Łódzkie 16823 1,15 6569 1,1 10206 1,13
6 Małopolskie 16280 1,13 7905 1,13 10636 1,13
7 Mazowieckie 18093 1,17 5527 1,13 9235 1,15
8 Opolskie 17752 1,35 5241 1,09 6706 1,17
9 Podkarpackie 10609 1,23 6286 1,24 8077 1,24
10 Podlaskie 9043 1,44 4451 1,25 5492 1,31
11 Pomorskie 15077 1,2 5742 1,2 8927 1,2
12 Śląskie 23697 1,12 9982 1,08 13433 1,11
13 Świętokrzyskie 9386 1,14 5499 1,17 6458 1,16
14 Warmińsko-Mazurskie 11932 1,22 4054 1,26 5016 1,25
15 Wielkopolskie 13737 1,05 8440 1,29 9842 1,17
16 Zachodnio-Pomorskie 9400 1,17 4555 1,15 6104 1,16
KRAJ 13561 1,18 5990 1,17 8244 1,18 Source:
http://www.gddkia.gov.pl/article/generalny_pomiar_ruchu/gpr_2005/article.php/id_item_tree/be14d7067d60cc982836ea7dfbc4cb85/id_art/a88f6cd081045d307b14c5993bb9ce67
- 112 - 8 Poland COMPETE Annex 3
Source: http://www.gddkia.gov.pl/dane/zima_html/info.en.htm
Figure 8-2: Conditions of the Polish road network at 3.5.2006
8.2.3 Forecasts and policy plans
Motorways and bypasses are built, infrastructure is extended and mproved, alternative solu-
tions are initiated country-wide. To institutions involved in the process of avoiding congestion
can be included: The Ministry of Transport and Building, provincial, city and marshal offices,
departments of cities development.

COMPETE Annex 3 8 Poland - 113 -
Table 8-3: Traffic growth ratio and forecasted SDR (average daily traffic) on network of the roads (2000-2020)
Source: http://www.gddkia.gov.pl/article/generalny_pomiar_ruchu/prognoza/article.php/id_item_tree/17e18198e93646
b55d36a799897ed443/id_art/72a2c9e8d735a8399d1761dd330f6f2e-2020
http://www.gddkia.gov.pl/ar_sen.php/ar_sen/asad/ar_sen_url/www.gddkia.gov.pl%252Farticle%252Fgeneralny_pomiar_ruchu%252Fprognoza%252Farticle.php%252Fid_item_tree%252F17e18198e93646b55d36a799897ed443%252Fid_art%252F72a2c9e8d735a8399d1761dd330f6f2e/id_item_tree/17e18198e93646b55d36a799
897ed443
8.3 Inter-urban rail transport
8.3.1 Methodology
Once a year, in the second week of October, the number of trains on every section of all
railway lines is counted by the Polish national rail carrier PKP. This measurement results in the
“annual research of weekly traffic volume on railway lines”, managed by PLK. PLK also con-
ducts the manual accounting and processing of the number of passengers, the SEPE study.
Average delay figures are calculated out of delay records related to the number of trains.
Delay records are permanently taken manually for all railway lines and are accounted on a
monthly basis. This determines the basis of the establishment of real network capacity limits,
and is used for planning and control purposes. However, the data is not published anywhere.
8.3.2 Current situation
Congestion, defined as the standstill of trains, is practically precluded; it can only be caused
by breakdowns or accidents, which block the tracks. Then the system of the diversions or
- 114 - 8 Poland COMPETE Annex 3
turnings back is activated for minimizing of congestion. In the midst of 30’000 train move-
ments per year (60% freight transport, 40% passenger transport) in Poland only about 3%
are “out of norm”, i. e. causing delays and thus are indicating congestion. The definition of
delays and punctuality of trains depends on companies and agreements. For “Intercity” trains
5 minutes late is still on time while “Przewozy regionalne” (“Regional transport” has a 2
minute tolerance margin and “Koleje Mazomieckie” (“Mazovia rail”) trains have to be exactly
on time. The shorter the distances the smaller tolerance margins are defined. Goods trains
have longer tolerance margins. All delays are registered at every point. The observed delays
then are considered when establishing the time table for the next period.
The current capacity usage of main lines amounts to 70-75%, other lines 30-40% and there
are some lines with no traffic (especially by night). The most congested lines are: Warsaw -
Katowice/Krakow, Warsaw - Germany, Warsaw - Ukraine and city agglomerations lines in
rush hours: mornings 6:00-8:00, afternoons 16:00-18:00. The Intensity of traffic increases in
autumn and winter due to the transport of fuels, which takes affect on congestion levels.
Results of congestion are not researched.
8.3.3 Forecasts and policy plans
A growth in congestion is not expected, because traffic is adjusted by timetables. Even after
the admission of foreign carriers on the Polish railroad market according to EC Directives in-
significant transport growth must be suited to the capacity of the railroad infrastructures.
The quality-related capacity of infrastructure has a crucial meaning. Actual policy plans to
fight congestion will be announced by the “Country transport policy for PKP”, which is ex-
pected to be published in June 2006. Policy plans will definitely include the improvement of
infrastructure conditions and defining the ways of its future financing and collecting in-
creased track access charges for the usage of overloaded line sections. The National Devel-
opment Plan 2007-2013 is strongly influenced by the system quality standards demanded by
the EC Directives 91/440, 96/48, 2001/14 and 2001/16.
8.4 Maritime and inland waterway transport
8.4.1 Methodology
Radars and computer system monitor the traffic of ships on-line. Further, daily statistics of
reloading, goods by categories and passenger traffic are collected. The data collected is
highly differentiated by single vessels and is published at harbour web pages..
8.4.2 Current situation
The phenomenon of congestion is not noticed in sea traffic, however growing escalation of
making port is observed. Goods subject to congestion include groceries, especially frozen.
Sea transport policy is under influence of sea office and harbours administrators. Also in
inland navigation the low rate of traffic does not demand the usage of models. Some delays
might occur at locks and opening bridges.

COMPETE Annex 3 8 Poland - 115 -
8.4.3 Forecasts and policy plans
Considerable growth rates are projected for the maritime sector. However, port capacity is
considered sufficient and thus there are no general policy plans. The plans of single ports
focus on investments in port capacities.
8.5 Air traffic
8.5.1 Methodology
In air traffic all activities are continuously registered by radar control system for internal ac-
counting and for international organisations (ICAO, Eurocontrol, EU). Results of measure-
ments let indicate rush hours and peak periods (holiday season), calculate level of air traffic.
The data is used to evaluate efficiency of control system and capacity of airspace.
8.5.2 Current situation
In Poland air traffic grows much quicker than in whole Europe (forecast for 2006: Europe
3,3%, Poland 14%), with incessantly growth tendency from 10 years. Rush hours in air traf-
fic are indicated mornings, afternoons and evenings. Additionally volume of traffic grows
during summer months.
Source: http://www.lotnisko-chopina.pl/katalog/statystyki/pl/statystyki.php
Figure 8-3: Increase of air activities of passenger planes
8.5.3 Forecasts and policy plans
A stable growth of air traffic, considerably above European average, is noticed. The doubling
of the air traffic level till 2020 is forecasted; therefore investments in more efficient control
systems are planned. Policy plans include: Forecasted investments: more efficient air traffic
control systems, reorganization of airspace to allow absorption of growing traffic, coopera-
tion between user of airspace, separation and transformation of institution, supplying air
traffic services, liberalization of the market by creation new offices of air traffic by different
than actual entities (e.g. airport managers).

- 116 - 8 Poland COMPETE Annex 3
The European Union actually introduces the Single European Sky program – Uniform Euro-
pean Airspace. This should cause a reduction of delays in air traffic, availability of wider ser-
vices for growing air traffic with actual or higher safety level of air navigation, increase of
effectiveness of institutions supplying services for air navigation, counter-acting and reversing
process of fragmentation of airspace and air companies. Program is realized within the con-
fines of Directives 549/2004; 550/2004; 551/2004; 552/2004 and 2096/2005.
8.6 Warsaw urban case study
8.6.1 Methodology
In the cities measurement are conducted manually, usually on request of varied institutions,
to localize congestion in most trouble area: roundabouts, intersections, bridges, and obtain
morning and evening rush hours. Data is proceeded for government offices, Central Statisti-
cal Office, and are published at www.zdm.waw.pl site, e.g. in “Report about the state of the
safety on the roads in the capital city of Warsaw in the year 2004” Losses caused by existing
congestion are not calculated. Researches are conducted and data about accidents, places
with the highest accident ratio (intersections, sec-tions of roads) and number of casualties is
collected.
8.6.2 Current situation
In Warsaw the locations most exposed to congestion are intersections, roundabouts, by-
passes and districts close to the city centre. Mainly affected are commuters, who are suffering
from congestion in morning and evening rush hours, goods delivery and supply services.

COMPETE Annex 3 8 Poland - 117 -
Source: http://www.zdm.waw.pl/docs/doc1192.pdf
Figure 8-4: Intensity of traffic on Warsaw roads – morning rush hour (October 2005) num-ber of cars per hour
In the cities systems of traffic management are introduced to fight against congestion.
Decrease of traffic and congestion in the cities is noticed during holidays. At the time repairs
and modernization of the roads are planned.
Some cities (e.g. Poznan) use systems of traffic control, others (e.g. Cracow, Warsaw) are
planning to implement that kind of systems.
Policy plans: The purchase of counting devices, integrated with other functions, e.g. passing
cars speed displays, is planned.

- 118 - 8 Poland COMPETE Annex 3
8.7 Wroclaw city center
8.7.1 Background
Grunwaldzki Square is one of the biggest intersection in Wrocław. In this place the national
road number 8 from and to Warsaw, Germany and the Czech Republic, Curie-Skłodowskiej
Street (provincial road number 455), the Szczytnicka and Piastowska Street are intersecting.
Thus, the square has to accommodate local as well as international transit traffic. Further,
Grunwaldzki Square is a big and important junction of public transport. Its architecture is
similar to that in every bigger city in Poland, e.g. the Rataje Roundabout in Poznan.
8.7.2 Current situation
The main problem of the Grunwaldzki Square junction is first of all its low efficiency. During
the rush hours traffic-jams occur on every inlet streets to intersection and drivers have to wait
several traffic light cycles to cross the intersection. The length of jams reaches several hun-
dred meters. Unfortunately vehicles of public transport, including the part of trams where the
tracks are not separated from roads, get stuck too. Only Grunwaldzka Axis and Curie – Skło-
dowskiej Street have separated tram tracks. It has serious influence on punctuality.
Another trouble of Grunwaldzki Square is its specific layout, which can be compared with a
roundabout. However, the location of the traffic lights rather indicates two separate intersec-
tions, 30 metres away from each other. This condition forces public transport vehicles to wait
twice to cross the junction. It happens that busses or trams block the traffic, what seriously
de-creases the number of vehicles, crossing the junction in one cycle of traffic lights.
8.7.3 Policy plans:
Solutions of complicated situation of Grunwaldzki Square can be different. One of these is
building a Wroclaw bypass, which will direct transit traffic out of the city centre. Another
solution supposes the rebuilding of Grunwaldzki Square. Until now many projects were con-
sidered, including building the roundabout or leading Grunwaldzka Axis in a tunnel. However
close to realization is the over ground concept of changing the whole junction.
The construction of a huge roundabout let vehicles cross the junction as fast as possible. The
majority of lines of trams would be concentrated in form of one change centre inside the
round-about (actually tram stops are distant, even in case of the lines, going in the same di-
rection).
8.7.4 Conclusion
The case of Grunwaldzki square is typical for bigger Polish cities. Current reconstruction plans
indicate, that restructuring the urban road space instead of new capacity provision can con-
tribute significantly to reduce congestion problems.

COMPETE Annex 3 8 Poland - 119 -
8.8 Conduction of Interviews
Table 8-4 includes the list of institution, which answered to the polling invitation and filled in
sent questionnaires concerning conditions and researched of congestion. Filled in question-
naires are enclosed in appendixes.
Table 8-4: Received answers for Poland and Warsaw
No. Institution Appendixes
1 General Directorate for National Road and Motorways
appendix no. 1
2 Zarząd Dróg Miejskich Warszawa (Company managing Warsaw city roads)
appendix no. 2
3 PKP PLK S.A Logistic Office appendix no. 3
4 PKP PLK S.A. Zakład Linii Kolejowych (Polish trains, Department of Railroads Network)
appendix no. 4
5 Maritime University of Szczecin
appendix no. 5
6 Port of Gdynia Authority S.A. appendix no. 6
7 Institute of Logistics and Warehousing
appendix no. 7
8 PKP PLK S.A. Preparation and Sales of Product Department
appendix no. 8
9 Air Traffic Agency Appendix no. 9
Source: Prepared by ILiM
In this task interviews for enumerated transport sectors were conducted separately for War-
saw and Poland. Table 8-5 and Table 8-6 include information about institutions, which were
asked to fill in the questionnaire.

- 120 - 8 Poland COMPETE Annex 3
Table 8-5: Interviews performed for Warsaw
Source: Prepared by ILiM
Kind Name of institution Address Telephone ZTM Warszawa Department of Traffic Control (Warsaw public transport company)
ul. Dzielna 78 01-029 Warszawa
(022) 6363680
Road transport
Zarząd Dróg Miejskich Warszawa (Company managing Warsaw city roads)
ul. Chmielna 120 00 - 801 Warszawa
(022) 6201021
PKP Warszawska Kolej Dojazdowa Sp. z o.o. (Warsaw City Railways)
ul. Batorego 23 05-825 Grodzisk Mazowiecki
(022) 7555564 Railway transport
„Mazowieckie-KM Rail” Sp. z o.o.
ul. Lubelska 1 03-802 Warszawa
(022) 4737765
Air transport Port Lotniczy im. Fryderyka Chopina (Fryderyk Chopin Airport)
ul. Żwirki i Wigury 1 00-906 Warszawa
(022) 6502998
Water transport Urząd Żeglugi Śródlądowej in Warsaw (Office of inland water transport)
ul. Zamoyskiego 2 03-801 Warszawa
(022) 6191970

COMPETE Annex 3 8 Poland - 121 -
Table 8-6: Interviews performed for Poland Kind Name of institution Address Telephone
General Directorate for National Road and Motorways Mr K.Kowalski
ul. Żelazna 59 00-848 Warszawa
(022) 3758616
Poznan University of Technology D.Sc.habil. J.Kwaśnikowski
ul. M.Skłodowskiej-Curie 5 60-965 Poznań
(061) 6652612
The Poznań University of Economics
Al.Niepodległości 10 60-967 Poznań
(061) 8522851
Wroclaw Technical University D.Sc. K.Lewandowski
Wyb. Wyspiańskiego 27 50-370 Wrocław
(071) 3202600
Institute of Road Transport
ul. Jagiellońska 80 03-301 Warszawa
(022) 8113231
Road transport
Polish Road Congress Ul.Jagiellońska 80 03-301 Warszawa
(022) 6750815
Transport -Forwarding Company „Kolchem – Rokita” Sp. z o.o.
ul. Sienkiewicza 4 56-120 Brzeg Dolny
(071) 3192551 Railway transport
PKP Polskie Linie Kolejowe Zakład Linii Kolejowych (Polish trains, Department of Railroads Network)
ul. Joannitów 13 50-525 Wrocław
(071) 7174354
PKP PLK S.A Logistics Department Railway Roads Department Preparation and Sales of Product Deparment
ul. Targowa 74 03-734 Warszawa
(022) 4733326 (022) 4732040 (022) 4733310
Urząd Transportu Kolejowego (Office of Railway Transport)
ul. Chałubińskiego 4 00-928 Warszawa
(022) 6288681
PKP Cargo S.A. (Polish Railways- cargo)
ul. Grójecka 17 02-021 Warszawa
(022) 4744320
LOT Cargo Poznań (Polish Airlines Cargo) Ms Agata Sparty
ul. Bukowska 285 60-189 Poznań
(061) 8472210
Lufthansa Cargo Poznań Mr Michał Baca
ul. Bukowska 285 60-189 Poznań
(061) 8492162
PP „Airports”
ul. 17 Stycznia 49 02-021 Warszawa
(022) 6501111
Air transport
Air Traffic Agency ul. Żwirki i Wigury 1 00-906 Warszawa
(022) 5745000
Maritime University of Szczecin Mr Lucjan Gucma
ul. Wały Chrobrego 1 70-500 Szczecin
(091) 4809403
Port of Gdynia Authority S.A.
ul. Rotterdamska 9 81-337 Gdynia
(058) 6215495
Zarząd Morskiego Portu Police Sp. z o.o. (Sea Port in Police)
ul. Kuźnicka 1 72-010 Police
(091) 3173101
Water transport
Maritime Office in Gdynia
ul. Chrzanowskiego 10 81-338 Gdynia
(058) 6206911
Source: Prepared by ILiM

- 122 - 8 Poland COMPETE Annex 3
Remarks:
a) Polling caused some trouble. The questionnaire is too long, not all questions are
fully understandable, especially question number 12.
b) Longitude and wide range of questionnaire were the main reasons for refusal.
c) Questionnaire was prepared in one form for all means of transport and all groups of
respondents. Such simplification caused misunderstandings and troubles in answers
to not adequate questions.
d) Majority of questionnaires was received via e-mail, one during phone conversation,
one during face-to-face meeting. Last two occupied quite huge amount of time
(about one hour) and was possible to fill in that form because of competency of inter-
locutor. In other cases questionnaire required involvement of many respondent em-
ployees, what was causing organizational and time-connected troubles.
e) Some huge institutions required delivery of questionnaire by standard mail, and then
its parts were distributed inside company, filled in, joined together and sent back,
what lasted sometimes even one month.
f) Some potential respondents do not collect or consider every required data, what
was the reason for refusal in many cases.
8.9 Literature Survey:
The literature survey considers books and articles concerning congestion and similar subjects.
Information about names of authors, titles, publishing offices, website addresses or periodical
names and a short summary of every item can be found below.
Additionally three printouts of articles, concerning congestion, available in Poland are en-
closed (details in Table 8-7).
Table 8-7: List of enclosed literature No. Position Appendix/ file pdf 1 „Congestion and functioning of a city” appendix no. 10 2 „Leave from traffic jam” appendix no. 11 3 “Analysis of building capability of distribution network based
on railroad transport for SME from furniture sector” appendix no. 12
Source: Prepared by ILiM
Remarks
(1) There are not many local studies concerning congestion.
(2) Respondents have not indicated literature concerning congestion, despite of the direct
question.
8.9.1 Books positions
a) M. Ciesielski, J. Długosz, Z. Gługiewicz, O. Wyszomirski: „Administration in city transport” The Poznań University of Economics, 1992, pages: 87-106
In introduction to chapter 5 “Transport congestion” term congestion, conditions of its occur-
rences and its kinds is explained. Transport congestion is indicated as most typical. The con-

COMPETE Annex 3 8 Poland - 123 -
gestions are differed by place of its origin. Phenomenon of bottleneck is quoted and decline
of quality of transport services is indicated. Many calculation formulas and methods of flows,
roads capacity, densities and traffic volume are quoted.
Direct and indirect costs, which generate congestion, and its influence on costs of: transport
infrastructures exploitation, losses of times, road accidents and pollution or losses from unre-
alized haulage is discussed in subchapter “Costs of congestion”.
The level of congestion, which should be optimized, is discussed next. However shipping
prices, road taxes or charges are included to instruments decreasing congestion.
b) M. Ciesielski, A. Szudrowicz: „Transport economics” The Poznań University of Economics,
2001, pages: 43-66
In introduction origin of word “congestion” is explained, then definitions of terms conges-
tion, transport congestion, divided into network of transport and mean of transport conges-
tion, are stated. In further parts terms related to congestion: bottleneck, triggerneck and
gridlock are described.
Transport infrastructure underdevelopment has been indicated as one of the main elements
with influence on congestion. Examples of port congestion are quoted too.
Cost generated by congestion, the indications of its calculation way, including criteria, which
should be taken into consideration, different for direct and indirect cost, are the main subject
of the next chapter.
Congestion in city agglomerations and its higher cost related with time of commuting are
characterized. Congestion cost, connected with accidents and losses, is important factor. In
next subchapter „Optimal level of congestion” authors convict, that congestion cost should
not be minimized but optimized by properly calculated prices, charges, taxes. Wide variety of
congestion decrease approaches beyond price instruments is indicated also.
c) J. Leszczyński: „Modelling of systems and transport processes” Warsaw University of Tech-nology publishing house, 1999, pages 51-58
In this book congestion is explained as a loss of time resulting from roads usage. Concepts of minimal and average time, free and routed traffic are quoted and explained. Formulas for intensity and density of flow, average traffic speed, which have important influence on the network capacity, are presented. Collision situations, which have influence on congestion, are explained also.
d) R. Brol: „Economics and management in cities” Wroclaw University of Economics publish-ing house, Wrocław, 2004, pages 188-190
In subchapter “Tasks of city transport and conditions of their completion (transport conges-tion: the essence, costs and reasons)” tasks and costs of transport are described. Congestion is divided into transport congestion and means of transport congestion. The reasons for con-gestion are enumerated.
e) W. Rydzkowski, K. Wojewódzka-Król: “Modern problems of transport politics” Polish Eco-
nomic Publishing House, Warsaw, 1997, pages: 80-84
Congestion on roads and railroads is presented here with the indication of number
of kilometres, costs and most exposed places of congestion such as border passages etc.

- 124 - 8 Poland COMPETE Annex 3
Maps of congestion on European roads and railroads are enclosed.
f) K. Lewandowski (editor): „Wrocław city – space of communication and transport” Wro-
cław Technical University Publishing House, Wroclaw 2004
www.zlist.ikem.pwr.wroc.pl/publikacje.php?publik=lewandowski2004
A survey of development conditions of different branches of transport in the capitol of Lower
Silesia, Wroclaw city, was presented in the book. Means of passenger and goods transport in
the agglomeration and in the city were described. There were presented new directions of
development of public and goods transport, realized, among other things, to avoid conges-
tion by integration of public transport companies and implementation of new technical solu-
tions.
8.9.2 Articles
a) “Alternative transport policy in Poland according to the principles of eco-development”,
1999, http://republika.pl/katedr/emotsp.htm
The article brings up social and economic problems, the problem of overcrowding, conges-
tion in cities. Growth forecasts of delays and the demand for transport infrastructure in many
countries of Europe are outlined. Another element of congestion is the expansion of cities
and decrease of their attractiveness.
b) J. Szołtysek: „Congestion and functioning of a city”, Materials management and Logistics,
2005, number 2, pages 15-18, table 2,
Characteristics of transport problems connected with spatial development of cities and a
growth of mobility. The sources and impact of congestion on functioning of a city communi-
cation system. Exemplary directions of some solutions to city transport problems concerning
logistics of freight transport, integration and development of public transport offer, traffic
and parking zoning, application of intelligent transport systems.
c) J. Szołtysek: „Management of private cars traffic as approach to congestion limiting in cities”, Forwarding, Transport, Logistics, 2005, number 3, pages 54-57
Transport congestion is perceived as one of main development barriers of the modern city.
That phenomenon is caused by unusual accumulation of transport and communication needs
in the city, as well as by concentration of these haulage needs, their cyclic recurrence and
limited area. Additionally, the problem is increased by unevenness of transport and commu-
nication needs, for every day, week and season.
d) „Bottlenecks elimination, part 2”, http://www.ue.psm.pl/?k=bk&pl= 6
The article describes the phenomenon of bottlenecks in the light of economic and transport
growth, as the basic problem of transport system in Europe. The article presents European
actual situation and forecasts, stating, that the development of trans-European network is
incoherent but advisable.
e) A. Janiszewska: „Leave from traffic jam”, Gazeta Wyborcza, 1999
The author of the article calls the growing number of cars in the cities a natural calamity and
wonders how national and local governments deal with arising city congestion. Public trans-

COMPETE Annex 3 8 Poland - 125 -
port is an alternative to individual transport. The advantages of city railway in the EU coun-
tries and its realities and forecasts in Poland (taking Warsaw and Silesian agglomeration as an
example) are presented next. The author states, that population will resign from private cars,
if offered an attractive public transport.
f) P. Rydzyński: „Report. External cost of transport.” Railway market, February, number
2/2004 pages: 14-22
Report describes external cost of transport, which exits to a large extent in process of trans-
port. According to authors, mentioned cost includes: communication accidents, air pollution,
climatic changes, congestion and noise. In subchapter considering congestion, overcapacity is
ascribed first of all to road transport, but considerable influence on timetables of railway and
airway transport is emphasized too. Then three ways of estimation of external cost of con-
gestion for West European conditions, which results differ to a large extent, were indicated.
8.9.3 Articles (similar subjects)
a) T. Kopta: „Why European day without the car?” 2005,
http://eko.org.pl/edbs2005/include/s.php?site=article&id=12
The author of the article is a member of Polish Ecological Club and quotes ecological aspects
of transport issues. The article presents the situation in Poland, European Union and describes
the advantages of the “day without the car” initiative.
g) M. Hajdul: “Analysis of building capability of distribution network based on railroad trans-
port for SME from furniture sector”, Logistics, 2006, number 1, pages: 51-52
In the article the author presents benefits and capabilities of railroad transport utilization re-
ferring to bad situation on roads, data and forecasts of congestion growth, reasons for con-
gestion and harmfulness of fumes emission; the author presents how other European coun-
tries solve situation of transport.
Additionally three printouts of articles, concerning congestion, available in Poland are en-
closed (details in Tab. 7 1).

- 126 - 9 The Netherlands COMPETE Annex 3
9 The Netherlands
9.1 All modes
9.1.1 National plan
The 2004 Mobility Paper (Nota Mobiliteitsplan) follows up on the Spatial Policy Document.
The Spatial Policy Document sets out the land-use planning strategy needed for an attractive
country with a strong economy, where people are safe and enjoy quality of life. Cohesion
between land-use planning, transport and the economy needs to increase at every level –
local, regional, national and European. The Mobility Paper goes into these issues in more de-
tail.
http://www.vananaarbeter.nl/NotaMobiliteit/
9.2 Road
9.2.1 Programmes
Part of the above-mentioned Mobility Paper includes the construction of rush-hour lanes,
that are opened to traffic only in rush hour. In most cases, this lane is in fact the hard shoul-
der of the motorway, with additional dynamic panels to guide the traffic. The government
website about this is the following:
http://www.rws.nl/rws/hkw/spitsstroken/
Many other measures, such as dynamic traffic flow allowances based on traffic intensities
and many others, are being tested:
http://www.rws-avv.nl/avv/nl/benutten/maatregelenapplicatie/
9.2.2 Definitions
For the purpose of calculating congestion levels (as well as subsequent pollution levels) TNO
(the Dutch organisation for applied research in natural sciences) categorised congestion into
the following levels:

COMPETE Annex 3 9 The Netherlands - 127 -
Table 9-1: Congestion categories in Dutch road planning
Congestion level Definition
1aa Speed lower than <10 km/h
1ab Speed between 10 and 25 km/h
1a 1aa and 1ab, Speed between 0 and 25 km/h
1b Speed between 25 and 40 km/h
1c Speed between 40 and 75 km/h
2a Speed above 75 km/h, intensity above 1000 vehicles per lane per hour, Speed limit = 100 km/h
2b Speed above 75 km/h, intensity above 1000 vehicles per lane per hour, Speed limit = 120 km/h
2c Speed above 75 km/h, intensity under 1000 vehicles per lane per hour, Speed limit = 100 km/h
2d Speed above 75 km/h, intensity under 1000 vehicles per lane per hour, Speed limit = 120 km/h
2e Speed above 120 km/h, regardless of intensity
3 Undesired bypassing traffic (avoiding congested roads) Source: http://www.rws-avv.nl/nvvp/rapporten/pdf/beleidsopties_verkend.pdf
Besides this categorisation, AVV (the Traffic Policy Department of the Ministry of Traffic and
Public Works) defines congestion also as time lost per vehiclekm. However, this definition
was part of an earlier mobility plan (NVVP 2001) that was rejected by Parliament in 2002. It
has been superseded by the above-mentioned Mobility Paper.
http://www.rws-avv.nl/nvvp/rapporten/pdf/beleidsopties_verkend.pdf
9.2.3 Models
The National Model System Traffic and Transport Vervoer (LMS) is an internationally re-
nowned, unique forecasting instrument for predicting effects of transport policy.
Rijkswaterstaat (the department of public works) has been using the model since 1986. The
LMS is property of AVV, a department of Rijkswaterstaat. It can make mobility forecasts and
estimate future traffic flows, both on the road network and in public transport. With the
LMS, the effect of policy measures on mobility and traffic flows can be estimated.
The features of the model are explained on the following site:
http://www.rws-avv.nl/vv2020/brochure/brochure.htm
9.2.4 Studies
The above-mentioned Mobility Paper contains many maps and studies predicting future bot-
tlenecks, and prioritises projects in order to give a satisfactory traffic flow also in the future.
As an example, a map is shown here of main road bottlenecks that are to be solved immedi-
ately (ie before 2010):

- 128 - 9 The Netherlands COMPETE Annex 3
Source: http://www.vananaarbeter.nl/NotaMobiliteit/content/kaarten.html
Figure 9-1: Maps of bottleneck, future plans and predicted bottlenecks in all modes up to 2020:
Furthermore, AVV published a study on policy options until 2020 to tackle congestion on the
main road network
9.2.5 Real time monitoring
Real-time congestion monitoring nationally and regionally:

COMPETE Annex 3 9 The Netherlands - 129 -
Source: http://www.trafficnet.nl/traffic.asp
Figure 9-2: Real-time traffic condition map for the Randstad region, 15.7.06, 19:15
Further information is available at: http://verkeersinformatie.brabant.nl/
9.3 Rail
9.3.1 Programmes:
Prorail, the infrastructure manager, is carrying out the BB21 (Better Usage) program, which
seeks to boost capacity without building new tracks. This involves the first steps towards
switching catenary voltage from 1500V DC to 25 kV AC (which will be used on the Betu-
weroute freight line and the High-speed line from Schiphol airport to Belgium, both to be
opened by the end of 2006), gradual introduction of the ERMTS signalling system (on the
same two lines, to begin with) and the VPT+ train traffic controlling system.
http://www.prorail.nl/ProRail/Overheden/Beter+Benutten+21/Inleiding.htm
9.3.2 Studies:
Prorail has done studies into current and potential bottlenecks. Based on that, it set up a
programme with potential bottlenecks 2006-2012. It discerns two types of bottlenecks:
1. Bottlenecks whose elimination creates so much benefit to society that a substantial
investment seems justified.
2. Bottlenecks for which, given limited benefits to society, a solution must be sought
with limited

- 130 - 9 The Netherlands COMPETE Annex 3
These are shown on the following map by red and orange dots, respectively.
Figure 9-3: Bottlenecks on the Dutch rail network
9.3.3 Position papers
Prorail has published a position paper on the Betuweroute, the dedicated freight line from
the Rotterdam port to the German border. It briefly summarises the benefits of this line,
which is to be opened in 2006 to allow for a relief of the existing railway network.
http://www.prorail.nl/NR/rdonlyres/D87039F4-B5FF-4B2A-949F-2E115914BF8A/0/BetuweroutePositionPaper19sept05.pdf
9.3.4 Models
When train frequencies are very high (which they are in the Netherlands, up to 12 trains per
track per hour), stability and reliability of the timetable is very important. A model, SIMONE,
was developed to test the stability of the system nation-wide. “Strategic timetable studies are
concerned with the required capacity in the future. For the medium term, the available ca-
pacity is assigned to the requests of the train operating companies. All requests are inte-
grated to a national level. Because the timetable in the Netherlands is practically the same for
every hour, so called basic hourly patterns for peak and off-peak periods are developed for
these studies”.
http://incontrol.nl/?to=references_railwaym

COMPETE Annex 3 9 The Netherlands - 131 -
9.4 Aviation
A lot of aviation-related capacity problems are solved at a European level – think for example
of the Single European Sky Initiative or the recent introduction of Reduced Vertical Separa-
tion Minimum
http://www.minvenw.nl/luchtvaartbeleid/dossiers/internationaal/capaciteit/index.aspx
The operational control centre of Eurocontrol is also based in the Netherlands:
http://www.eurocontrol.int/
When looking at those capacity aspects that are national, enlarging airport capacity can in-
volve building new runways, which is a very slow and expensive process. Schiphol added one
runway in 2003, and has plans to add another two, but this could take many years, if ever.
Another capacity constraints is terminal capacity and land-side infrastructure, which is easier
to realise. Schphol regularly increases its terminal capacity (in the early nineties and soon
again), as well as jetway capacity (a new low-cost pier was recently opened). Further plans for
the future may be found at www.schipholgroup.com
Slot allocation, the main capacity regulating instrument at Schiphol airport, is shown at
http://www.slotcoordination.nl/
Rotterdam airport is also slot restricted, and can be found on the same website. The vast ma-
jority of air traffic is handled at Schiphol airport. It has (artificial) capacity problems that are a
result of government-imposed restraints. The main decision on capacity is taken by the na-
tional government. The full details of this decision can be found here:
http://www.minvenw.nl/luchtvaartbeleid/dossiers/archief/dossierschiphol/luchthavenverkeerbesluitschiphol.aspx
A counter-investigation at the request of the major stakeholders can be found here:
www.minvenw.nl/cend/bsg/brieven/data/1061385384.pdf
9.5 Maritime
Rotterdam and Amsterdam are the biggest and 6th biggest ports in Europe, respectively.
Their capacity is being expanded whenever the need arises. In Rotterdam, the Europoort area
was built in the 1960s, with later addition of the Maasvlakte in the 70s/80s. A second
Maasvlakte is about to be constructed. For more details, see http://www.maasvlakte2.com/
9.5.1 Programme
The main government policy on sea ports is defined in the “Nota Zeehavens” document of
2004, which specifies the development path for the Dutch sea ports until 2010, and is an-
other detailed policy paper that came out of the Mobility Paper.
The policy document can be found at
http://www.minvenw.nl/cend/bsg/brieven/data/1099406716.pdf
Besides, the Mobility Paper itself also devotes a chapter to transport by boat:
http://informatie.binnenvaart.nl/document/NotaMob_scheepvaart.pdf

- 132 - 9 The Netherlands COMPETE Annex 3
9.6 Inland Waterways
Waterways are very important in the Netherlands, they have a big market share in the freight
market.
The responsible entity for the physical aspects of the inland waterways is Rijkswaterstaat
www.rijkswaterstaat.nl
The more general policy falls under the the DG Goods
http://www.minvenw.nl/dgg/dgg/Algemeen/
9.6.1 Programme
The Mobility Paper devotes a chapter to inland waterways.
http://informatie.binnenvaart.nl/document/NotaMob_scheepvaart.pdf
The Mobility Paper website contains also maps of bottlenecks that are currently worked on:
Source: http://www.vananaarbeter.nl/NotaMobiliteit/content/kaarten.html
Figure 9-4: Bottlenecks on the Dutch inland navigation network
9.7 Literature Review
9.7.1 General transport ppolicy
9.7.1.1 Nota Mobiliteit (Mobility Paper)
Part 1: The first part of the Mobility Paper sets out the broad policy lines on mobility and is
derived from the “Nota Ruimte”, the spatial planning document. It gives the general vision
on transport and traffic, and ways of how mobility growth can be managed well. One of they
key indicators is the reliability of travel time.

COMPETE Annex 3 9 The Netherlands - 133 -
The part one of the Mobility Paper was the starting point of a legislative process which pro-
duced the subsequent parts – most of it was used integrally in part 3 – see description of that
part.
Part 2: Part 2 sums up the reactions and feedback of stakeholders and citizens to Part 1. 147
reactions were received. The most relevant advice towards the Part 1 is given by the Council
for Traffic and Public Works (Raad Verkeer en Waterstaat), the Social Economic Council (SER)
and the Consultation Bodies for Traffic and Public Works (Overlegorganen Verkeer en Water-
staat).
Most respondents agree with the general idea of the reliability concept of the Mobility Paper.
Some of them found the calculations were too general, and a finer calculation grid would be
desirable. In terms of congestion, the most problematic modes are considered to be road and
rail, and many respondents state that a modal shift towards inland waterways should deserve
more financing – not merely maintenance but also new construction. The capacity restrictions
of the Amsterdam and Rotterdam airports are of a purely regulatory nature (night curfew
and cap on flight movements in Rotterdam, a noise budget in Amsterdam). Others think it is
too focussed on road transport.
The SER notes that too little is done to bring road prising closer; as paying the social and di-
rect costs for infrastructure is one of the components of the Mobility Paper, it is strange that
the obvious consequence of that (road pricing) is not pushed harder. [problem being that
road pricing had been a hot potato politically, MvdH] The SER agrees with the reliability con-
cept but is not too impressed by the chosen reliability indicators, because in the case of cars
they are limited to the main road network and do not consider congestion on urban roads at
all, and in the case of trains, the indicator does not consider the fact that for train users, the
train is only part of the total journey. The main chosen indicator is on-time departures (with a
daily average punctuality of 89%-91% as a requirement), which means that the disruptions
with the highest social cost (in rush hour) are levelled out by off-peak empty trains, and the
SER therefore suggests to have another indicator that does not focus on an operational indi-
cator, but on the effects towards the passengers.
Part 3: This is the main section of the Mobility Paper, and it is available in English. See Mobil-
ity_Paper_UK.pdf. This is the final policy document that incorporates the reactions and feed-
back of Part 2, and combines the original plan and reactions into the final document. A
summary document of Part 3 is also included in English in the COMPETE congestion literature
database.
The main concept of the Mobility Paper, in terms of congestion, is reliability, i.e. the chance
of arriving at destination within the specified amount of time. The target set by the govern-
ment for the year 2020 is 95% in rush hour.
On time means that at longer distances (>50km) one may arrive no more than 20% earlier or
later than the expected travel time, and at shorter distances no more than 10 minutes early
or late relative to the expected travel time at that time of the day, as expected travel time is
different for peak/off-peak hours. More detailed target values have been set for “acceptable”
travel times – distinction was made between intra-urban motorways, urban motorways and
intra-urban main roads (other than motorways). In the first category, the peak-hour travel

- 134 - 9 The Netherlands COMPETE Annex 3
time may be no more than 1,5 times the off-peak hour travel time, whereas on the latter two
categories this factor may be no more than 2.
In comparison to the draft version (part 1), the final document gives more attention to road
pricing. Road pricing packages were considered for road maintenance and renewal (marginal
and average cost pricing), while another package was assessed to toll those areas that need
new infrastructure, and to allocate the revenue to the new construction.
The document also gives forecasts for the various policy scenarios until the year 2020. For
each of the modes, future bottlenecks and expected congestion has been forecast, as well as
pollution levels and the expected damage to the economy as a result of delays. An overview
is given in the following table:
Table 9-2: Forecasts of road congestion in the Netherlands until 2020
Scenarios Road network
performance
(travelled km)
Vehicle loss hours
main road network
Reliability main
road network (%)
Vehicle loss
hours per km
Situation 2000 Index =100 Index = 100 92% Index =100
Reference 2020 148 195 89% 132
“Building and utilising” 152 142 93% 91
“Building, utilising and
charging the final
result”
138 60 96% 43
A vehicle loss hour is defined as the time spent travelling above the expected travel time. Source: http://www.vananaarbeter.nl/NotaMobiliteit/
This table shows that charging is estimated to cause a major reduction of vehicle loss hours
compared to the other two scenarios. The next diagram shows the projected development in
time losses by time of day until 2020.
Source: http://www.vananaarbeter.nl/NotaMobiliteit/
Figure 9-5: Growth in vehicle km according to time of day; index 2000 = 100

COMPETE Annex 3 9 The Netherlands - 135 -
Traffic-jams have a direct financial impact on the corporate sector. However, delays suffered
by civilians can also be expressed in terms of socio-economic costs. The socio-economic costs
of traffic-jams will amount to € 1.7 billion in 2020. These costs (i) include costs related to
direct journey time loss, economically indexed according to the reason for travelling and (ii)
will increase even further due to unreliable journey times and negative driving behaviour mo-
tivated by a desire to avoid traffic-jams. The total socio-economic costs without changes in
policy will therefore rise to approximately € 2.4 billion in 2020.
Part 4: Part 4 contains minutes of the parliamentary sessions dealing with the Mobility Paper
and some minor amendments that were made before its adoption.
Note: the NVVP was the predecessor of the Mobility Paper. It was drafted in 2001 but subse-
quently rejected by parliament in 2002. So any document referring to the NVVP should be
treated with caution as the information contained in it may no longer be valid.
9.7.1.2 2004 Effecten beleidsinstrumenten van de Nota Mobiliteit: bereik-baarheid per auto en openbaar vervoer, verkeersveiligheid en lee-fomgeving (Effects of policy instruments of the Mobility Paper: ac-cessibility by car and public transport, traffic safety and environ-ment)
In the policy document entitled "Nota Mobiliteit" (Mobility Paper), the Dutch Ministry of
Transport has presented the outline of its policy for improving traffic flows and journey time
reliability. The new Dutch transport policy seeks to improve accessibility levels through the
construction of new infrastructure, making better use of existing infrastructure, introducing a
kilometre levy, and public transport improvements. In addition to the measures designed to
achieve better transport connections, measures have been defined that have an impact on
traffic safety and the environment.
In this publication the impact of individual policy measures is described and explained, as well
as the impact of these measures when combined in packages, and how they might contrib-
ute to meeting policy objectives. In this way the publication constitutes the background
document for the Mobility Paper itself.
It also assesses the various scenarios in their effect on congestion. It defines congestion as total time lost as well as time lost per vehicle*km and compares various policy scenarios in terms of time loss. The delays are broken down into various categories such as work/leisure, peak/off-peak, main and secondary roads etc. Some of the policy scenarios include distance-based road pricing (which does not exist in the Netherlands right now). One of the conclu-sions is that distance-based pricing will lead to a serious reduction of congestion. But it says that distance-based pricing combined with the construction of new infrastructure is even better.
Regarding Public Transport, the pricing will lead to shifts from car to PT, but only locally (in the areas with very high road congestion especially). Train use will increase most of all in the urban areas.
Calculations were made using the LMS model (Landelijk Model Systeem Verkeer en Vervoer, National Transport Model System). The reliability data was obtained through the SMARA-model (see below).
The document contains mostly diagrams illustrating the forecasts for the various parameters
for each of the scenarios.

- 136 - 9 The Netherlands COMPETE Annex 3
9.7.2 Road
9.7.2.1 SMARA model/ The Value of Reliability in Transport
RAND Europe carried out the project ‘Uncertainty in traffic forecasts’ for the AVV Transport
Research Centre of the Dutch Ministry of Transport, Public Works and Water Management.
The objectives of that project were:
To develop a methodology to estimate the amount of uncertainty in forecasting for
new infrastructure (especially roads).
To implement and test this methodology in two case-studies (using the Dutch National
Model system LMS and the New Regional Models NRM respectively). This report pre-
sents the outcomes of all phases of this project:
Literature review for public projects;
Literature review for public-private partnership (PPP) projects;
Development of a method to quantify the uncertainty in traffic forecasts for the LMS
and NRM;
Outcomes from a large number (100) of model runs with the LMS to derive uncer-
tainty margins around the mean traffic forecasts;
Outcomes from a large number (100) of model run with the NRM for the Dutch prov-
ince of Noord-Brabant to derive uncertainty margins around the mean traffic fore-
casts.
This report was written for modellers with an interest in the uncertainty margins around the
model forecasts and methods to quantify the uncertainty margins.
Subsequently, RAND Europe published the document “The Value of Reliability in Transport”
(attached in English) which digs deeper into the issue. Reliability of travel times is one of the
core topics of the Mobility Paper. Reliability gains, as well as travel time gains, are important
social benefits of infrastructure projects. For the development and implementation of trans-
port policy, knowledge of the value of reliability gains is indispensable. The AVV Transport
Research Centre ordered this study to have a method and preliminary key figures to measure
the economic value of reliability gains, based on expert opinion. The figures are valid until
2007.
9.7.2.2 Simulation programs
A variety of traffic simulation programs is downloadable from the website of the traffic policy
department of the Ministry (RWS AVV).
http://www.rws-avv.nl/servlet/page?_pageid=159&_dad=portal30&_schema=PORTAL30&p_folder_id=16906,16910,17314&p_skin=projectsite
9.7.2.3 Measuring networks:
There is a site that gives the status of the various traffic intensity measuring networks:

COMPETE Annex 3 9 The Netherlands - 137 -
http://www.rws-avv.nl/meetnet/
The traffic on the main roads in the Netherlands is being measured on various points (see
map above). All those points form a measurement network. The map shows the availability
of the various networks, and offers the option of making queries:
Source: http://www.rws-avv.nl/meetnet/
Figure 9-6: Road condition measurement networks in the Netherlands
Currently Rijkswaterstaat (the department of public works of the Transport Ministry) has two
networks: the BI-network and the Monica-net. The BI-network is sued to map general mobil-
ity trends on the main road network and supplies static data, such as intensities vehicle cate-
gories and speeds. The Monica-network gives an insight in real-time situations on the roads.
These data are used for travel information and traffic management.
To monitor whether the detection loops are operational, the internet application “Availability
Measurement Networks” has been developed so that employees of regional services and
road districts can see at which measuring point they need to take action.
The site also builds up a history of each measuring point. This allows for a long-term over-
view of the status of the measuring point.
It was not possible within the short timeframe of this report to fully assess the availability of
the output data for this report, or of any costs involved with obtaining the data. However,
some of the data can be obtained from

- 138 - 9 The Netherlands COMPETE Annex 3
http://www.dataportal.nl/index2.jsp -> Verkeersgegevens -> Intensiteiten -> Etmaalgemid-
delden -> Kaart
which has a very similar layout to the picture above, and allows to select some output data
regarding daily averages. Various vehicle classes may be selected, days of the week, year.
9.7.2.4 Filemonitor 2003 - 2005
These are the annual road traffic congestion reports that AVV publishes each year. These
make use of the data of the above-mentioned network. This report is used to identify mobil-
ity trends and to see where mobility increases most. It also gives a list of the 10 worst loca-
tions in terms of congestion, as shown in the figure below:
Table 9-3: Top 10 congestion spopts on Dutch inter-urban roads 2005
Source: http://www.dataportal.nl/index2.jsp
It shows ranking, trend (up/down), ranking in previous year, road, description, direction, traf-
fic jam density and changes relative to the last year. Traffic jam density is expressed in
km*min. Figure 9-7 presents the locations of the top 10 congestion spots graphically.

COMPETE Annex 3 9 The Netherlands - 139 -
Source: Filemonitor 2005
Figure 9-7: Map of top 10 congestion spots 2005
It also analyses the trends, break down the traffic jams into causes (accidents/engineering
works/structural lack of capacity) as shown in Table 9-4.

- 140 - 9 The Netherlands COMPETE Annex 3
Table 9-4: Congestion causes on Dutch trunk roads 2004/05
Cause Congestion sever-ity 2005
Congestion sever-ity 2004
Change against 2004
Restricted capacity 8.55 8.78 0.23 (+3%)
Accidents 1.31 1.28 -0.05 (-4%)
Road works 0,52 0,46 -0,06 (-12%)
Total 10,38 10,50 0,12 (+ 1%) Source: Filemonitor 2005
It uses the following definitions:
Traffic jam: A traffic situation on a main road (motorway or dual carriageway) is called
a traffic jam if the speed slows down to less than 50 km/h over a length of more than
2km.
Traffic jam length: The length of the traffic jam is tracked from the first reporting of it
until the reporting of its end. Based on these reports the average traffic jam length is
calculated, called traffic jam length in short, expressed in kilometres.
Traffic jam duration: The duration of the traffic jam, expressed in minutes, is the time
passing between the start of the traffic jam being reported and the end being re-
ported.
Traffic jam intensity: To allow for comparisons of traffic jams of varying length and du-
ration, the term traffic jam intensity was introduced. This the product of the above-
mentioned length and duration. Traffic jam intensity is expressed in km*minutes. The
total traffic intensity is the sum of the intensities of the traffic jams that occurred in
the measuring time-window on that location
Traffic performance: Total of the realised displacement by all vehicles on the main road
network, expressed in vehicle*km.
9.7.2.5 Methodewijziging fileregistratie (change in method of traffic jam reg-istration)
In relation to the above-mention traffic jam reports, a document was published explaining
the new way of measuring traffic jams. This new method resulted from the taking into use of
a new automated system of counting traffic jams, which is considerably more accurate than
the old system, which still involved registering traffic jams manually. As more traffic jams are
now observable than before, this makes it difficult to compare old and new statistics. The
biggest difference is that now, many more short-lasting traffic jams are observed than be-
fore.
Three different correction methods were used to fit the old and the new data together, each
of these methods was analysed in the paper.

COMPETE Annex 3 9 The Netherlands - 141 -
9.7.2.6 Fileverkenning (Congestion forecast)
This document seeks to give an insight into the future development of traffic jams and other
delays on the Dutch motorway network. It considers various aspects of delays in traffic, such
as travel time reliability, total travel time loss, the direct costs of the travel time loss, and the
fact that some road users will chose alternatives to avoid the travel time loss and its costs (the
demand drop or latent demand). The other effects to society, such as economy (attractive-
ness for companies), safety and environment, are not discussed – the document is meant for
policy development.
In order to contribute to national policy development, the document sought to give a total
picture of the development in the Netherlands, and a forecast of the delays of various types
of road users, for different time horizons.
The diagram below gives an example of the sort of information contained in the report. It
shows the yearly total travel loss hours (in mln) for the three types of infrastructure: urban
ring roads (motorway and dual carriageway, in blue), main transport axes (motorways, red)
and other main infrastructure (blue).
Source: http://www.minvnw.nl/cend/oei/Images/1-1105979533_tcm67-54215.pdf
Figure 9-8: Congestion forecasts by network type
It contains the information used in the Mobility Paper (same figures) but is more detailed.
Many of the forecasts were made using the earlier-mentioned RAND model and LMS model.
As another example, it also predicts total vehicle-km and vehicle loss hours until 2030, as
shown in the following graph:

- 142 - 9 The Netherlands COMPETE Annex 3
Source: http://www.minvnw.nl/cend/oei/Images/1-1105979533_tcm67-54215.pdf
Figure 9-9: Vehicle-km and time losses until 2030
9.7.3 Seaports
9.7.3.1 Nota Zeehavens/ Nota zeehavens – reactie
This is the document specifying government policy in Sea Ports. It is more detailed document
than the Mobility Paper. It does not address any congestion issues though. It claims that both
maritime and inland waterways traffic have sufficient infrastructure capacity to accommodate
traffic for the foreseeable future.
Another paper summarises the responses of the industry stakeholder to the document.
9.7.4 Airports
9.7.4.1 Capacity Declaration Schiphol Airport
The document gives the declared capacity for Amsterdam airport for the next season, for slot
allocation purposes. The government put a cap on capacity, meaning that the limits of Schi-
phol’s capacity are regulatory, not technical. Congestion occurs at arrival/departure waves (of
which KLM and partners have about 5 per day).
Further restrictions are posed by the noise quota that the government imposed, that are
spread equally between various calibration points around the airport.
Delays in aviation are not merely due to restricted airport capacity – airspace capacity is
equally important. The Reduced Vertical Separation Minimums initiative already created more
capacity in higher airspace by reducing the minimum vertical separation between aircraft
from 2000 feet to 1000 feet, and the European Single Sky initiative will try to address this
issue further.

COMPETE Annex 3 10 Greece - 143 -
10 Greece
10.1 Introduction
10.1.1 Report Structure
The present report is divided into five sections. The first section presents some basic transport
data monitoring the transportation systems in Greece and in some cases some key figures.
Brief descriptions of the bodies that have been questioned are also provided.
The remaining four sections correspond to the four fields examined by the questionnaire that
has been used to collect information from the competent national stakeholders. Thus, they
include respectively a) the methods for transport condition measurement and presentation of
data, b) congestion and delay current situation, c) projected situation in the future and d)
policy issues for handling congestion.
It should be noted that added to the information gathered by the means of questionnaires,
some information relevant to traffic measurements and traffic management was obtained by
desk research and has been inserted in the present report, in order to monitor the case of
Greece sufficiently.
Each section is composed of five subsections corresponding to each one of the transport
modes discussed in the Greek case, i.e. road (distinguishing urban and inter-urban), rail, avia-
tion, waterborne and urban public transport.
10.1.2 The Transport Modes of the Greek Case Study
The modes covered by COMPETE study are road, rail, public transport, maritime transport
and aviation. The level of disaggregation into types of networks, means of transport and user
groups for the case of Greece is provided in the following table. In Greece, there is no inland
waterways transport, and thus no results are considered.

- 144 - 10 Greece COMPETE Annex 3
Table 10-1: The items considered in the Greek Case Study
Transport modes Network differentiation Modes
Road
Motorways Outside settlement Areas (National – Provincial – Rural Roads) Inside Settlement Areas (Urban Roads)
Motorcycles Passenger cars Light goods vehicles LGV Heavy goods vehicles HGV
Rail Hellenic Railway Organisation (OSE)
Metric Gauge Lines Standard Gauge Lines Passenger & Freight transport
Public transport Urban Interurban
Urban Buses Trolley buses Metro Tram Interurban buses
Aviation Airports Passenger & Freight transportMaritime Transport Ports Passenger & Freight transport
Our team tried to find the appropriate related studies, established contacts with some key
persons from relevant transport bodies and managed to provide some valuable input re-
sponding to the requirements of the project. The major difficulties experienced in data collec-
tion by the means of questionnaire were mainly related to delays in replying and sometimes
to poor data availability. In addition to this, primary data is kept in selected studies of relevant
transport organisations and are rarely published or available to the public; consequently there
was practically no other source to provide input and the information expected via the ques-
tionnaires was needed for the progress of our work and for composing the present report.
However, as mentioned above, our desk research has also contributed to the completion of
the report, since some valuable information has been obtained and supplemented the data
provided from the transport organisations that replied to our questionnaire.
10.1.3 Basic Transport Data and Institutional Basis
10.1.3.1 Road
The following table summarises road infrastructure for the different road networks of
Greece. The figures are differentiated according to the road infrastructure type under the
heading Network Differentiation as presented in Table 1. Figures for 2005 are estimations
based on the development of road infrastructure in Greece and expert opinion about the
length of the Greek motorways, national and regional roads. ERDF support for transport in-
frastructure in Greece comprises the construction of more than 1.000 kilometres of motor-
way in two main corridors the Patras - Athens - Thessaloniki - Euzoni corridor (PATHE Mo-
torway) and the Igoumenitsa - Thessaloniki - Kipi corridor (Egnatia Motorway).

COMPETE Annex 3 10 Greece - 145 -
Table 10-2: Road Infrastructure data for Greece
Unit 2005
Motorways Km 1.500
Outside settlement Areas (National Roads) Km 9.500
Outside settlement Areas (Regional Roads)* Km 30.000 Sources: DG TREN Assembling, 2000 & Statistical Yearbook of Greece, 2000
* No data available for the length of Urban Roads (Inside Settlement Areas)
The number of vehicles has increased remarkably in the last years. Figures for the year 2005
are presented in the following table.
Table 10-3: Number and type of vehicles
Vehicles 2005
Mopeds, motorcycles 1.039.328
Passenger cars 3.852.569
Buses / Coaches 30.604
LGV (up to 3,5 t GVW) 1.092.265
HGV (>3,5 t GVW) 148.947
Agricultural -
Urban Buses 4.400
Interurban Buses 5.590 Source: Statistical Yearbook of Greece, 2003, own calculations
Using the outputs of the above tables, the results of related projects and studies and the
output of national statistics, the study team has calculated the transport volumes for road
transport for every user group and means of road transport. The calculations are based on
the following assumption on usage:
a) Mopeds / Motorcycles: Average km: 20.000 per year
b) Cars: Average km: 20.000 per year
c) Urban Buses: Average km: 160.000 per year
d) Interurban Buses: Average km: 250.000 per year
e) LGV: Average km: 100.000 per year
f) HGV: Average km: 100.000 per year
g) Agricultural vehicles: Average km: 20.000 per year
As there is no information available related to the urban network the calculation of the vkm
for inside settlement areas (urban areas) is based on expert opinion, which estimates that:
a) Mopeds / Motorcycles: 90% of their average km is inside settlement areas whilst only
9,5% is outside and 0,5% is on motorways per year
b) Cars: 70% of their average km is inside, 28,5% is outside and 1,5 is on motorways
per year

- 146 - 10 Greece COMPETE Annex 3
c) LGV: 80% of their average km is inside settlement areas and only 19% is outside and
1% is on motorways per year
d) HGV: 20% of their average km is inside whilst 76 % is outside and 4% is on
motorways per year
Based on the above-mentioned assumptions and expert opinions, the vehicle - kms in the
whole road network (i.e. motorways, outside and inside settlement areas) are estimated as
presented in Table 4.
Table 10-4: Transport volumes of road transport in Greece, in million Vkm
Network type 2005
Mopeds / Motorcycles Motorways
Outside Settlement Areas Inside Settlement Areas
221 1.667
18.708
Passenger cars Motorways
Outside Settlement Areas Inside Settlement Areas
2.419 18.274 53.936
Urban Buses Motorways
Outside Settlement Areas Inside Settlement Areas
- -
704
Interurban Buses Motorways
Outside Settlement Areas Inside Settlement Areas
140 1.057
-
LGV Motorways
Outside Settlement Areas Inside Settlement Areas
2.247 16.975 87.381
HGV Motorways
Outside Settlement Areas Inside Settlement Areas
1.226 9.259 2.979
Agricultural Vehicles Motorways
Outside Settlement Areas Inside Settlement Areas
- 3.795
- Sources: Statistical Yearbook of Greece, 2000 & SYSTEMA estimations, UNITE project
The following subsections analyse separately the urban and interurban road networks and
present briefly the organisations that have been asked to complete the questionnaire for road
network and thus, contributed to the present report by providing valuable input.
10.1.3.2 Urban road network
Relevant bodies in the field of congestion determination and policy-making as regards the
urban road network are the competent department Ministry of Environment, Physical Plan-
ning and Public Works (Direction of Road Construction Studies), the Ministry of Transport
and Communications, which is responsible for public transport authorities operation and the
Traffic Police coming under the Ministry of Public Order, responsible for traffic measures en-
forcement.
ATTIKI ODOS
The Attiki Odos motorway is a modern high-speed toll motorway extending over 60 km and
designed with the highest standards. It offers three traffic lanes in both directions, one emer-
gency lane, 32 multi-level interchanges and hundreds of overpasses and underpasses. It uses
COMPETE Annex 3 10 Greece - 147 -
the most modern equipment for incident detection and emergency response enabling a safe
journey the entire length of the Attica without the need for traffic lights, connecting more
than 30 districts in Attica. The Attiki Odos motorway is incorporated in the Trans-European
Networks (TEN) and assists in easing traffic congestion in the greater area of Athens, since it
forms part of the Athens peripheral ring road creating a bypass of Athens and thus easing
congestion on the main arteries. It also forms a link between the transport infracture such as
airports, ports, intercity railway stations, urban train stations, metro, intercity coach stations
and heavy goods transport stations. “Attikes Diadromes”, is the operator of the Attiki Odos
and constitutes one of the bodies that have been asked to respond to the questionnaire. Ac-
cording to them, the Attiki Odos Motorway is considered to be part of the urban network,
which nevertheless undertakes an important amount of interurban movements.
The Traffic Management Centre of Attiki Odos monitors any possible incidents, and coordi-
nates and activates immediate intervention and assistance 24 hours a day. Emergency road-
side telephones are located every 2 km, connecting motorists with the Traffic Management
Centre. Motorists can also dial 1866 from a mobile telephone to be directly connected with
the Traffic Management Centre.
Ministry of Environment, Planning and Public Works - Traffic Management Centre
The Traffic Management Centre is a new public service coming under the Ministry of Envi-
ronment, Planning and Public Works. It uses modern technical equipment for 24 hour traffic
control in order to support effective traffic conduction and an immediate response to prob-
lems and emergencies.
The Traffic Management Centre is competent for the greater urban area of Attica; therefore
it is examined in the section covering urban road transport, given that, in COMPETE project
inter-urban has the meaning of links between different urban areas. Consequently, the Traf-
fic Management Centre is regarded as more relevant to urban road transport, even if Attica
road network undertakes an important amount of interurban trips.
Moreover, there are some other departments coming under the Ministry of Environment,
Planning and Public Works which elaborates traffic counting, especially within the framework
of more extended planning of transport public works.
Operations Room of Traffic Monitoring and Control” (THEPEK)
Finally, there is a department of the General Police Directorate of Attica called “Operations
Room of Traffic Monitoring and Control” (THEPEK), which aims at managing the circulation
in the Prefecture of Attica. This body uses the same means of traffic measurements with the
Traffic Management Centre; therefore it receives the same monitoring of traffic conditions
and takes similar action in case of incidents (congestion, accidents, etc.).

- 148 - 10 Greece COMPETE Annex 3
10.1.3.3 Inter-urban road network
PATHE
The PATHE Highway is the main road axis of Greece as it provides a link between the North
and South. It has a total length of 730 km with the two edges at the Western coasts of
Greece (Ionian Sea) and the Northern borders with former Yugoslavia. Specifically, it starts
from Patra, i.e. the South-West Gate of Greece, passes through Athens, Thessaloniki and
ends up to borders (Evzoni). This Motorway links the main Greek ports (Patra, Pireaus, Volos
and Thessaloniki) and pertains to Trans-European Networks.
This road axis has been redesigned as closed highway with the highest standards. Its con-
struction has not been completed but after its completion, it will constitute a modern high-
way of 2 or 3 traffic lanes per direction, an emergency lane, a big number of tunnels, inter-
changes, bridges, overpasses, underpasses and an extensive adjacent road network.
EGNATIA ODOS
The Egnatia Motorway and its vertical axes are the backbone of Northern Greece transport
system. It is a modern closed motorway 670 kilometres long and 24.5 metres wide over the
greatest part of its length. It shortens distances and multiplies investment in transport, indus-
try and tourism and links the industrial centres of the West and the East. It is a major collec-
tor road for the Balkans and South-eastern Europe via the Pan-European Corridors, to which
it is linked by nine vertical axes. The Egnatia Motorway is one of the largest road construction
projects in Europe. Nine major vertical axes connect the motorway with Albania, FYROM,
Bulgaria and Turkey. Furthermore, 5 ports and 6 airports service the road. Finally, a raft of
tunnels, bridges and interchanges carry it across the Greek countryside.
EGNATIA ODOS is a company created to undertake the management of design and construc-
tion, the maintenance, and exploitation of the Egnatia Motorway, its Vertical Axes as well as
of other projects within or outside the Greek territory. The company provides traffic data,
traffic forecasts and analyses both for the Egnatia Motorway and its Vertical Axes, as well as
for the wider Egnatia Motorway "corridor". To this purpose, the they have developed the
two following "tools": EGNATIA Motorway Traffic Count System and a Traffic Forecasting
Model, which are detailed in the relevant subsection of the present report.
Traffic Police
There is a department of Traffic Police undertaking the traffic management on the National
Road Network. Traffic Police is responsible for the continuous surveillance of the main roads
of the national network and for imposing measures when needed, especially in occasions of
congestion, e.g. massive movement during holidays etc. A traffic police vehicle is supposed to
be placed every 30 km across the two main roads of national network and intervene when it
is needed (in occasions of accidents or congestion for enforcing appropriate measures.
Regional Departments of Infrastructure Maintenance Control (DESE)
Regional authorities that are competent for tasks involving public works and specifically their
maintenance also carry out traffic measurements across the local interurban road network.

COMPETE Annex 3 10 Greece - 149 -
They are responsible for installing and using traffic counters and providing data to any inter-
ested body, e.g. EGNATIA ODOS, mentioned above, uses data provided by DESE for further
processes through models and relevant analyses. They are also responsible for assistance pro-
vision in case of any incident happening on the interurban network of their region’s compe-
tence.
10.1.3.4 Urban Public Transport
As mentioned before, the urban mode category "Public Transport" covers modes, which
are normally contained in other mode categories. Diesel buses are part of road transport and
urban rail services are included in the mode rail transport. Whereas the first category can be
separated from road transport, this is not possible in the case of urban railway services, which
in any case do not exist in Greece. Therefore, the following table contains figures on road
based urban public transport modes, with companies operating in the Greater Athens area -
Piraeus and their suburbs whilst the figures of the interurban buses cover the whole of
Greece.
The urban public transport in Athens is organised and operates within the framework of
OASA (Athens Area Urban Transport Organisation). Within this framework three companies
control and render transport services. ETHEL S.A. undertakes the operation of urban trans-
port by means of thermal buses, ISAP S.A. operates Metro Line 1 in the area of capital and
ILPAP renders transport services by electric buses with antenna (trolley buses).
Table 10-5: Transport volumes of public transport in Greece, in million vkm
Modes 2005 Trolley Buses 17,5 Metro 27,26 Urban Buses 703,92 Interurban Buses 1.197,4
Source: National Statistical Service, 2000 & EC DG TREN MARETOPE,2001, OASA and own projections
In an effort to solve the traffic problems in Greece the EU structural funds financed the up-
grade of the transport system. Athens Metro is part of country’s urban public transport sys-
tem since 2000. New lines (2 and 3) are constructed; 18.2 km in total were added to the
existing 25.6km of Metro line 1. Extensions of the existing lines will be constructed until
2007 with the aim to reduce traffic congestion and hence pollution. In 2001 a new company
Athens Metro S.A. was formed, which is responsible for the operations of Metro lines 2 and
3.
The Inter-city Road Transport companies in Greece are for the rest of Greece KTELs, which
are based on each of the 52 prefectures. KTELs are privately run companies in the form of co-
operation. Each bus is owned by one or more owners who are responsible for its personnel
(drivers) and maintenance. All buses operate on lines and timetables introduced by the KTEL
co-operation and approved by the Prefect, following the Guidelines established by the Minis-
try of Transport. In 2002 a new Law has passed converting the co-operatives in Societe Ano-
nyme Companies and introducing some form of competition.

- 150 - 10 Greece COMPETE Annex 3
10.1.3.5 Rail
Hellenic Railways Organisation (OSE) is the responsible body for rail transport in Greece oper-
ating 2.548 km of track. EC has funded a rail infrastructure programme for Greek railways
including the completion of modern infrastructure on the main rail line, the supply of rolling
stock and maintenance equipment, improvements in secondary lines, railway links with the
container terminals of Piraeus and Thessaloniki and the new suburban rail line that is con-
necting the South suburbs with the new Athens International Airport to the North.
10.1.3.6 Aviation
The following tables provide an overall picture of Greek civil aviation and air transport per-
formance for the year 2005. The figures in Table 6 present the total air transport, i.e. domes-
tic and international traffic for key airports.
Table 10-6: Number of Greek Airports
Air Transport 2005 Number of Airports International Airports 2 EU Connection Airports 6 Domestic / Regional Airports 35 Number of Runways International Airports 4 EU Connection Airports Domestic / Regional Airports
8 37
Source: National Statistical Service & Civil Aviation Authority
Table 10-7: Transport volumes of aviation in Greece, in thousand aircraft movements
Air Transport 2005 Aircraft Traffic 527 Domestic Scheduled 430 International Scheduled 97 International Airports 291 Athens 235 Thessaloniki 56
Source: National Statistical Service & Civil Aviation Authority
The table above, also shows the number of aircraft movements of commercial and charter
traffic on the two international airports in Greece that are part of TEN: Athens and Thessalo-
niki. Movements by air have increased in Greece and further increase can be expected. This
increase is attributed to the opening in 2001 of the new international airport of Athens at
Spata, which is intended to become a transport hub for Southeast Europe. In the future, the
Athens International Airport is expected to handle 50 m passengers yearly. Transport volume
and performance of aviation are presented in Table 8.

COMPETE Annex 3 10 Greece - 151 -
Table 10-8: Transport volume and performance of aviation in Greece
Air Transport 2005
Number of Passengers -
Domestic flights (Olympic Airways) -
International Flights (Olympic Airways) -
Domestic and International Flights (All Companies) 33.150.500
Passenger Aircraft – Km (Olympic Airways) 73.759.000
Domestic Flights (Olympic Airways) 17.680.000
International Flights (Olympic Airways) 56.080.000
Freight Transport (Olympic Airways)
Freight Total (t) (Olympic Airways) 209.824
Freight –tkm (Olympic Airways) 138.040.000 Source: National Statistical Service & Civil Aviation Authority and own projections
10.1.3.7 Waterborne Transport
Greece has 444 ports of which 112 have passenger and freight traffic. Improvements in the
infrastructure sector and expansions in the main ports of Greece will improve the commercial
value of the Greek ports and will allow the number of transported passengers and cargo car-
ried to increase. Figures for the year 2005 are presented in the tables below (passenger and
freight transport respectively):
Table 10-9: Transport Volume of Maritime Transport in Greece (Passengers)
Transported Passengers 2005 Number of Passengers Domestic 50.172.391 Number of Passengers International 2.800.000 Number of Passengers Total 52.972.391 Passenger – miles 127.677.469
Source: National Statistical Service & Ministry of Mercantile Marine Shipping Statistics, own calculations
Table 10-10: Transport Volume of Maritime Transport in Greece (Transported Cargo in tonnes)
Transported Cargo - Merchant Vessel 2005 Ro-Ro Ships – Container Ships - Cargo Ships 25.136.376 Oil Tankers 110.118 Merchant Vessels Total 25.246.494
Source: National Statistical Service & Ministry of Mercantile Marine Shipping Statistics, own calculations

- 152 - 10 Greece COMPETE Annex 3
10.1.4 Delay Costs due to Congestion
10.1.4.1 Values of Time
The values of time per passenger-hour were estimated within the framework of the UNITE
valuation paper (Nellthorp et al., 2001), PPP-adjusted and converted into factor costs (com-
muting and leisure values only). According to the valuation paper (Nellthorp et al., 2001) it
was assumed that Values of Time grow over time in line with real incomes (elasticity of 1.0 to
the country's real GDP per capita). The values for Greece have been adjusted from the ones
of Nellthorp paper in accordance with Greek actual conditions.
The methodological approach for user costs in road transport followed the methodology,
which was developed in the INFRAS study on congestion costs of road transport, “External
Costs of Transport, Accident, Environmental and Congestion Cost in Western Europe”. Avail-
able new data sources have been used to update the 1998 study. For the estimation of con-
gestion costs relevant Greek Studies and empirical estimations by expert transport engineers
were used, in particular:
Total road network: Overall estimates concerning time delays based on differences be-
tween average travel speeds in peak-hours versus normal traffic conditions.
Motorways: Delay Statistics of relevant Greek studies and expert opinions were used to
complete the calculations of the German model.
Urban roads: Model calculations for towns and cities based on a Study for the Development
of Athens Metro provide the necessary information.
National Roads: Model calculations for outside settlement areas based on Greek case stud-
ies and expert opinions.
The value of time for the average passenger based on Nellthorp (2001) adjusted to Greek conditions according to factor on UNITE VOT is presented in the following table. It must be noted that there is no clear definition of business category in UNITE project. This fact pro-vokes an overlap between business and commuting. Recent studies in Greece27 indicate that the average VOT is 5,3 € per hour.
Table 10-11: VOT-Values for the average passenger (PPP-adjusted values, Nellthorp et al.: 2001), in € per hour
2005
Business Private/ Commuting Leisure
Car 19,4 4,7 3,1 Motorcycle 19,4 4,7 3,1 Bus / Coach 19,4 4,7 2,5 Metro 19,4 4,7 2,5 Rail 19,4 5,0 3,7 Air 26,4 7,8 7,8
27 Study for the development of Athens Metro, 2000

COMPETE Annex 3 10 Greece - 153 -
Source: Nellthorp et al. (2001) “ Valuation Convertions for UNITE”
10.1.4.2 Input Data by Mode
Average values of time, additional time and fuel costs have been estimated by Mode and
Network Type for road traffic. Vehicle occupancy has derived from INFRAS/IWW (2000): “Ex-
ternal Costs of Transport”, whilst the trip purposes by road category, measured per vkms, is
based the “Study for the Development of Athens Metro” and on expert opinions. Estimations
produced the following:
VOT for the average passenger, in € per hour,
Average VOT per passenger hour and additional time and fuel costs in individual road
traffic,
VOT and additional time and fuel costs for road freight transport
VOT for the average rail passenger and additional time costs per delayed trip – rail and
per delayed freight – rail
VOT for the average air passenger and additional time costs per delayed trip – air and
per delayed air freight transport
VOT and additional time costs per delayed Shipment
In conclusion, the following table shows the results for user costs in road, rail and air trans-
port in Greece for the base year of UNITE pilot accounts 1998.

- 154 - 10 Greece COMPETE Annex 3
Table 10-12: Delay costs due to congestion in million €
Modes Total Congestion costs 2005
Road Traffic 7.507,0 Car 2.577,6 Motorways 3,4 National Roads 57,8 Urban roads 2.516,4 Motorcycle 24,9 Motorways 0,02 National Roads 0,17 Urban roads 24,7 Busses 68,5 Heavy good vehicles 283,7 Motorways 6,8 National Roads 106,6 Urban roads 170,3 Light good vehicles 4.552,3 Motorways 8,1 National Roads 120,9 Urban roads 4.423,4 Rail Transport 51,8 Passenger Trains 28,8 Freight trains 23,0 Aviation 68,1 Passenger 1,1 Cargo 67,0 Maritime Transport 0,16 TOTAL 7.627
Source: Valuation Conventions for Unite, Nellthorp et al. – SYSTEMA Estimations

COMPETE Annex 3 10 Greece - 155 -
10.2 Methods for transport condition measurement and presentation
The first part of the questionnaire aims to cover in general the methods that are used for
measuring and presenting traffic congestion conditions. The data that were obtained per
mode are presented in the following respective subsections and paragraphs.
10.2.1 Road
10.2.1.1 Urban road network
ATTIKI ODOS
The COMPETE Questionnaire has been addressed to “Attikes Diadromes”, the company re-
sponsible for the operation and maintenance of Attiki Odos motorway, who responded and,
as regards the methods of measuring traffic conditions, reported the following:
The Traffic Management Centre uses incident detection systems (Vehicle Detection
Stations - VDS) which are placed all along the motorway to measure and record in a
continuous basis -every 20 seconds- the traffic volumes per road lane and per type of
vehicle (light - heavy), while at the same time, they also record the speed of vehicles.
These devices are used for the traffic control and comprise 200 cameras placed along
the highway (total of 65 km) every 1.000 m on open roadway and every 100-125 m
in tunnels, in accordance to the potential of accident. Cameras can rotate and focus
in case of an incident detection.
At the same time, 630 inductive traffic loops have been installed on the road network
every 500 m on the open highway and every 600 m in tunnels. These loops measure
the vehicles’ flows, their speed and the density of traffic and these data are differen-
tiated every 20 seconds. The Traffic Management Centre has 50 monitors with alter-
nating screens providing plans from the cameras that are placed on the network.
There are 40 central screens and every manipulator is in charge of two of them at-
tending specific parts of the network.
Data that are gathered by the traffic loops about the vehicles flow appear on the
staff’s computer screens; therefore, as soon as an unusual decrease of speed is ob-
served, a possibility of incident is reported and the camera which is closest to the spe-
cific spot is rotated appropriately to control. Sometimes, the camera is automatically
rotated appropriately when the problem is located by the measurement of a traffic
loop. In any case of problem or urgent call to the Centre, there is an immediate
mechanism responding to the emergency and a solution is given as faster as possible.
Additionally, there is a system counting the number of vehicles passing the tolls; these
data also provide the traffic volumes per type of vehicle (6 categories).
The data mentioned above are processed:
a) in real time (as described above) by the system ITTMS (Integrated Toll & Traffic Man-
agement System) for detecting incidents and proposing plans of response in case of
emergency, and

- 156 - 10 Greece COMPETE Annex 3
b) when the elaboration of case studies is required for several works, improvements,
planning, etc. in combination with additional information obtained from processing
other databases.
Regarding the frequency of measurements, as mentioned above, the traffic volumes are
measured in real time and the VDS communicate with ITTMS continuously (via a network of
optical fibres) with an update of data being produced every 20 seconds. At the same time, all
data are assembled to produce a database, so that statistical processes are possible to be
elaborated, when needed. Finally, it should be noted that traffic data are assessed regularly
(in weekly, monthly and annual basis), or whenever it is considered to be needed for certain
case studies.
Attiki Odos being a peripheral urban motorway, its traffic characteristics change according to
the time of the day, the day of the week and season of the year. For this reason, traffic vol-
umes are measured within a space of 20 seconds, providing traffic data for time intervals of
20 seconds, 5 minutes, 15 minutes, 1 hour and 1 day, by traffic lane all along the motorway
(main streams, entry or exit branches and connecting roads included).
Furthermore, data records include the number of heavy goods vehicles and the average
speed (in any time interval desired) by traffic lane. Finally, as already mentioned, Attiki Odos
uses a system counting the vehicles crossing the tolls. The data collected by this counter cov-
ers the passage from tolls of each type of vehicle (6 types are distinguished).
Reports monitoring the operation of Attiki Odos are produced weekly, monthly and annually
and are addressed to the competent stakeholder, i.e. the Ministry of Environment, Physical
Planning and Public Works. These reports include all the collected traffic data presented ana-
lytically. According to the convention of concession, the Ministry is responsible for further use
of data concerning the operation of the motorway and for making them available to wide
public.
Ministry of Environment, Planning and Public Works - Traffic Management Centre
According to the response of the Traffic Management Centre to COMPETE questionnaire,
measurements carried out on the urban road network are made with the use of inductive
traffic loops placed on roads’ pavement and traffic cameras (“mechanical vision”).
Results provided by these measures are traffic volumes, average speed of vehicles, rate (per-
centage) of road pavement that is occupied, travel times in segments of vectors and trips and
traffic condition presented in three levels (sparse, dense, saturated). All these data are pro-
vided in electronic format.
These measurements are carried out every 90 seconds in daily basis by approximately 500
spots of measurement (either by loops or cameras) placed on main arteries of the urban road
network of Attica Basin. Data are differentiated by spot of measurement every 90 seconds.
Following, data analysis could be done for any time period required (peak hours, daily vol-
umes etc) or when needed, data could be also classified by type of vehicle.
The process of measurements’ data is done with the use of appropriate algorithms which
results in the provision of travel times (in real time) by part of a vector, by vector or by trip (52
trips have been distinguished) along the main urban road network. Travel times are projected

COMPETE Annex 3 10 Greece - 157 -
in real time on the Video Monitoring Services (VMS) that are placed at specific crucial spots of
the main road network.
Data are made directly available to public when requested (e.g. by companies or individuals
undertaking traffic studies etc) against a forfeit determined by the relevant Greek law. Finally,
such data are often presented to wider public in the occasion of presentations in congresses/
conferences and publications/ references in scientific magazines.
Operations Room of Traffic Monitoring and Control
The Operations Room of Traffic Monitoring and Control, coming under the Police Directorate
of Attica (the greater region of Athens) also uses traffic cameras placed in crucial spots of the
road network recording traffic volumes. These data are used to produce in real time a report
-every 30 minutes- about traffic conditions and the level of congestion (3 levels distinguished)
on the main arteries across Attica region. These reports are available for public via mass me-
dia, e.g. press announcements addressed to news agencies, Internet website, etc.
Intermodal Traffic Information System (e-traffic)
The Intermodal Traffic Information System (e-traffic) is an application which constitutes an
upgrade of the real-time traffic map of Athens and took place in the framework of the pro-
gramme "Information Society for the Quality of Life in the Region of Attica (ARI-ACT) with
the financial contribution of the European Commission (ERDF 2000- 2006).
It has been elaborated by the National Technical University of Athens, Department of Trans-
port Engineering and is available via the link www.transport.ntua.gr/map.
The Multimodal map of Greater Athens presents the average typical traffic conditions. The
congestion observed on the road network is presented by the means of a three levels scale
(light, medium and high congestion) distinguished by different colours. The map -also with
the use of colours- includes the following:
Road network
Metro Lines 1 to 3
Tramway
Suburban Railway.
The active map provides the average typical traffic conditions in:
a General View of Greater Athens (congestion)
a Centre View of Athens (level of congestion presented by respective colours)
a Centre View of Athens (volumes presented by respective colours)
a Centre View of Athens (time), i.e. the driven distance in 15 minutes, which allows to
know how far a driver can go in 15 minutes.

- 158 - 10 Greece COMPETE Annex 3
Source: http://www.transport.ntua.gr/map/en/
Figure 10-1: Traffic condition onine map of Atika region
The Variable Message Signs, installed at six locations, display actual messages of real-time
conditions, according to the data mentioned above.
Furthermore, another service provided is a Traffic Alert Service, which includes sending SMS
messages via e-mail to people registered in the service. These messages contain information
monitoring the real-time situation in the road network of the centre of Athens, at the mo-
ment of sending the message. This application was also developed taking under considera-
tion and in order to respond to the wish of many visitors of the map to obtain information
about current circulatory conditions at any place, regardless of the available means of com-
munication.
The information covers the traffic conditions of Athens’ road network, and particularly the
entry and exit to and from the city centre from the 4 main directions (North, South, East,
West) and the circulatory situation of main road arteries. In order to provide information cor-
responding to the needs of all users, two categories of messages (alerts) were created:
a) Messages where the information is provided in a fixed way based on the time of the day
(time-based alerts), and is mainly addressed to users following a specific trip in a specific
time and in daily basis.
In these messages the monitoring of traffic is provided by the difficulty or facility of
movement in comparison to the usual traffic conditions observed at that time and is given
as percentage divergence from the average situation (positive or negative percentage if
time needed is respectively more or less than usually). For example:
Entry to the centre:

COMPETE Annex 3 10 Greece - 159 -
N = 20%
S = -32%
E = 54%
W =0%
Exit from the centre:
N = -40%
S = 23%
E = 0%
W = -12%
In the first phase of this service, these messages are being sent twice a day; at 8:00 am
and at 16:00 pm.
b) Messages where information is provided in a non-fixed way based on the existence of
traffic congestion incidents (event-based alerts), and is addressed to those who wish to
know if and where traffic problems have occurred. In these messages, traffic conditions
are recorded according to the existence of congestion on at least one direction.
The message apart from recording and imprinting the direction (entry or exit to/from the
centre of city) and orientation (North, South, East, West) where the difficulty was located,
records at the same time the remainder road arteries presenting traffic (the directions
where traffic is smooth are not recorded). For example:
Entry to the centre from:
N = Difficulty
W = High traffic
Exit from the centre to:
E = Difficulty
S = High traffic
* In this example, the remainder directions do not present traffic problems.
These messages are being sent at any case of traffic incident and problem as mentioned
above. However the interval between two consecutive messages cannot be less that 45 min-
utes. Until today, and when conditions are usual, the number of occurring incidents are 3-4.
The traffic alerts service is provided for free by the National Technical University of Athens
without forfeit, but it is possible to be charged by the mobile telephony companies for their
services (sending SMS messages, etc.)

- 160 - 10 Greece COMPETE Annex 3
10.2.1.2 Inter-urban road network
It is obvious that a basic condition for ensuring motorways’ efficient operation is respective
operators to be aware of the real traffic conditions. To achieve this, there is a need for sur-
veys and measurements, which allow necessary traffic characteristics to be calculated (type of
vehicles, peak hours, speeds, level of service etc.). Moreover, inserting these data to the traf-
fic model ensures the model results’ corresponding to reality, which is essential for producing
reliable traffic forecasts.
As regards the availability of such data at national level, the competent Ministry has been
highly concerned in the past. A study elaborated in the period 1979-1981 has led to the in-
stallation/ implementation of a permanent system of traffic measurement in Greece. The data
that had been gathered by 8 permanent stations, 58 control stations and a big number of
cover stations, were dispatched to the Ministry of Environment, Physical Planning and Public
Works, where they were imported in a database, processed and resulted in reports of Annual
Average Daily Traffic (AADT), variances of traffic, etc.
This traffic measurements program and the procedures of traffic volumes’ treatment were
applied up to the year 1989. Since then, it started to fall into disuse and produced data to
remain unused. This disuse of the system and particularly the non-use of gathered data led
rendered impossible the calculation of AADT for the whole of national road network and
practically made the effectiveness of this study useless (it is marked that since 1991, in 22 by
the 58 Control Stations of the measurements system have not realised any measurements). It
is indicative that there are entire regions for which traffic data are completely missing. It was
henceforth very difficult to evaluate the temporal development of traffic volumes (AADT) in
several segments of road network. The last effort of total presentation of circulatory pres-
sures was held in 1990.
The Ministry of Environment, Physical Planning and Public Works recognizing the organisa-
tional insufficiency but also the use of high technology in the system of recording of traffic
characteristics of the main national road network, assigned in 2000 to a consultancy the de-
velopment of a study called "Traffic Management of Greek Motorways - System of Meas-
urements of Road Traffic (SMOK)". The 1st stage of study, who examines all the parameters
composing a completed system of traffic measurements that will cover the needs of Ministry
has been completed but its concretisation (development of system) has not advanced yet.
EGNATIA ODOS
The Egnatia Odos operating company (EOAE) uses the two following ways to measure and
estimate congestion conditions.
1. Egnatia Motorway Traffic Count System: Since 1997, EOAE has launched a traffic count
program along the Egnatia Motorway "corridor" consisting of systematic traffic counts
performed on the Egnatia Motorway and its Vertical Axes, specifically on road sections
ready to be opened to traffic. The traffic count collection and processing system that has
been developed is an integrated system that will ultimately comprise 65 stations in total.
The systems applied at the traffic count stations involve the use of inductive loops and
Remote Traffic Microwave Sensors, while the readings are collected by means of a special
Telemetry software and adequate telematic equipment that allows the transfer of data

COMPETE Annex 3 10 Greece - 161 -
from all remote locations on the road axis to the EOAE headquarters at Thessaloniki. The
systems that are installed collect several kinds of data, such as:
Traffic volumes per lane, i.e. the number of vehicles crossing a traffic count station,
Length of vehicles, counted by the inductive loops system,
Speed of each vehicle at the moment it crosses a traffic sensor, and
Weigh of vehicles (weigh in motion).
The AADT takes under consideration the daily, weekly and seasonal range of traffic during a
year’s period. Vehicles are grouped in two general categories, i.e. light and heavy vehicles.
“Light vehicles” include motorcycles, private cars and light goods vehicles. “Heavy vehicles”
include buses, heavy goods lorries and articulated buses.
2. Traffic Forecasting Model: In 1997, due to the increased demand for reliable traffic fore-
casts that would contribute to the motorway design, EOAE developed a traffic forecasting
model using all available data on the existing transport networks and traffic demand. The
EOAE traffic model has been and is currently being used for the provision of an abun-
dance of traffic data, forecasts and analyses necessary in the decision-making process for
the design of the road, the necessary electromechanical installations and telematic appli-
cations, the toll collection system, the Service Areas, the feasibility studies, the calculation
of environmental parameters, the planning of pavement maintenance works, etc..
The stations are permanent so that they can provide data during the whole year. It is obvious
that installing permanent station is more costly but it was decided that the cost of using ex-
clusively permanent stations compensates for the minimisation of their operation cost. Added
to this, the collection and transfer of data by means of telemetry software and adequate
telematic equipment is less costly and requires less time compared to moving at-place to ob-
tain each station’s collected data. Moreover, collecting data continuously (24 hours) during
the whole year allows any kind of analysis (by hour, day, location, etc.).
Finally, the traffic measurements’ results are presented in reports that are published every 6
months and are made available to public (via Internet and free printed copies). These reports
present the AADT and the traffic composition in sections of the Egnatia motorway (segments
between two consecutive interchanges) in both directions during an average day of the year.
10.2.2 Rail
Traffic measurements (time tables of trips, time of wait) are carried out theoretically for the
needs of examining and implementing traffic regulatory measures. These measurements are
based on the graphic tables of itineraries.
Real data for delays but also for general traffic conditions in the network –regarding both
passenger and freight trains- are provided by the graphic tables of the organisation’s traffic
controller. Furthermore, the services that are responsible for rail traffic keep analytical data-
bases with total delays for every trip and for every single day of the year.
Data about delays are obtained in daily basis according to the time of a train’s arrival at the
destination station. The main information sources for these data are the journey reports of
each train. Data about delays in both passenger and freight rail transport are provided per

- 162 - 10 Greece COMPETE Annex 3
day and per journey; therefore, the total delay of each train’s arrival to final destination is
provided in daily basis and these data are recorded in concentrated weekly tables.
As regards the presentation of data, the national statistical agency does not publish data
about delays or other kinds of data related to traffic congestion. In the proceedings reports
of the Organisation, data that are recorded cover the passenger and freight rail transport
(main indicators used are passengers, passenger-kms, tones and tone-kms respectively). The
same reports also include information about improvements done either in the network infra-
structure or the running stock. Finally, some improvements in travel times are also recorded in
these reports but they are not presented in statistical data format.
The data mentioned above (passenger-kms and tone-kms for passenger and freight rail
transport respectively) are submitted every year to the UIC and the Eurostat. Finally, the de-
partment of Information Technology has prepared a system of electronic recording of delays
that will be able to provide data about delays per day, per itinerary, per cause of delay etc.
for both the train’s departure and its arrival at the destination station.
10.2.3 Aviation
The means by which traffic conditions are measured in the aviation sector are systematically
produced records of arrivals and departures of planes (and respective number of passengers)
at every airport. In order to provide useful results, these data are transmitted to the statistical
agency of civil aviation, where they are subjected to appropriate treatment/ processes and
analysis. Data concerning plane delays in the Greek air space are officially recorded by Euro-
stat.
As regards freight transport, similar data are recorded; however details about commodity
types are not provided (e.g. simple determination of parcels, post correspondence etc.).
Briefings are produced for internal use with which the administration is provided periodically.
For public, an annual Statistical Bulletin is published; however it presents information with
time delay as it includes only data for which the statistical agency has anticipated processes
on a certain time spot.
10.2.4 Waterborne Transport
Within the framework of its modernization, the Ministry of Mercantile Marine, has estab-
lished a completed electronic information system of marine traffic control, called VTMIS (Ves-
sel Traffic Management Information Services). The first phase of this system’s development
covers the wider marine region of Piraeus and partly the Ionian Sea. It is currently composed
of 4 local maritime traffic control and management centres (Vessel Traffic Service -VTS), 11
Remote Sensor Sites, and 2 Regional Traffic Centres (RTS). Every Sensor Site includes radar
monitoring, meteorological sensors, day/night cameras, radio direction finders etc. for the
collection and the local process of traffic data and environmental conditions in its area of
competence.
The four VTS centres that have been installed in the ports of Piraeus, Patras, Igoumenitsa and
Corfu are connected to the National VTMIS centre which is situated in Piraeus and can con-
trol the local centres. The interconnections of remote sensing stations with the local VTS cen-
COMPETE Annex 3 10 Greece - 163 -
tres is achieved via microwaves and the ones of VTS centres with the VTMIS are established
via the National Telecom Organisation’s data network.
The legal frame regulating the shipping services provision with the use of new technologies
was completed during the 90’s. In 1997, the International Maritime Organisation’s (IMO)
Maritime Safety Committee (MSC) adopted new standards for the Vessel Traffic Services
(VTS) that are included in the International Convention on the Safety of Life at Sea (SOLAS).
Afterwards, IMO and the International Association of Lighthouses Authorities (IALA) pub-
lished rules for the concretisation, operation and education of personnel of VTS systems.
Also, the European Union published a Directive for the creation of a Community System for
maritime traffic surveillance.
VTS mainly aim at improving the safety of navigation and the protection of marine environ-
ment. This service has the possibility of communicating immediately and allilepjdra' with the
boats and of giving solutions in the problems of safety that are created in her region of re-
sponsibility. VTS centres are placed in spaces of National Port Authorities and supervise the
application of regulations of maritime traffic management in a way similar to the one applied
in the case of air traffic. VTMIS is the National Central System that receives information from
local VTS, processes it and distributes it to interested bodies. VTMIS constitutes valuable tool
for traffic data analysis and for strategic planning. At the same time it constitutes the main
interlocutor with other centres developed in EU countries or in other national centres of re-
ception/ dispatch of information.
Traffic conditions are measured per port (node) and per route connecting several ports. Daily
traffic data are recorded in each port containing the number of vessels, passengers, vehicles,
goods embarked or disembarked and their timetables.
Statistical data of the categories mentioned above are available in a daily basis. The quantities
of data are differentiated in several seasons, especially during summer period, but the type of
data remain the same.
These data are available in each port and in the Mercantile Marine Ministerial Statistical Ser-
vice in electronic format.
10.3 Current congestion and delay situation
10.3.1 Road
10.3.1.1 Urban road network
ATTIKI ODOS
The traffic congestion is determined by the decrease of average speed, the increase of trip
time (calculations are made by the ITTMS based on the real time measurements) and the
queuing, generated either because of the growth of traffic, or because of an incident. The
queue is measured in two ways: a) by its length and b) by the time it is maintained.
It is obvious that several studies are elaborated at any time, with the use of traffic simulation
models for the assessment of alternative future scenarios covering traffic management issues,
especially in certain segments of the motorway, where, local phenomena of traffic conditions
reaching the level of congestion are currently observed.

- 164 - 10 Greece COMPETE Annex 3
The main result of traffic congestion studies, carried out with the use of traffic models, is the
assessment of the alternative traffic control solutions, which is based on the comparison of
results and mainly of indicators, such as the average and the total delay in the simulated
network, the average speed and the travel times before and after the application of specific
traffic regulation measures proposed by a certain scenario.
The motorway parts or spots that are most congested are the entry and exit braches to and
from the main arteries of the rest urban road network of Attica region during the morning
and/or evening peak hours (mainly to and from the new Athens- Lamia National Highway
and the Kifissias Avenue). The user groups that are mostly affected in these cases of conges-
tion are the commuters using the Attiki Odo motorway for their daily job motivated journeys.
Finally, in cases of mass exit flows from the greater Attica region (on fair days), congestion
conditions are observed at the two ends of the motorway; i.e. entries and exits to and from
the new Athens- Korinthos (towards Southern Greece) National Highway and at the connec-
tion with the new Athens- Lamia (towards Northern Greece) National Highway.
Ministry of Environment, Planning and Public Works - Traffic Management Centre
The traffic conditions and the level of congestion (sparse, dense, saturated) are determined
with the use of flow- speed diagrams. Traffic conditions of consecutive spots of measure-
ments compose the global monitoring of traffic conditions in certain parts of the road net-
work (segments of vectors, vectors or traffic areas).
Specific algorithms produce the travel times corresponding to 52 trips including the main
arteries of the network and these times are presented on VMS only if estimations provided by
the algorithms are lower that a certain value that constitutes the lowest value accepted. This
travel time limit has been determined as the highest value of travel time among the 95% of
times that have been measured for a specific trip. When travel times do not exceed this level,
notification messages for traffic congestion are projected on VMS instead of times.
Results of traffic studies in the greater Athens area concerning trips that are regarded as ur-
ban, are produced every three months. Some interesting outcomes are provided by compar-
ing these data to the respective ones of the precedent year. Such tables present for example
the trends of average speeds of vehicles moving on each direction of the main arteries of the
network. Such comparisons between consecutive years are provided in percentages of in-
crease (positive percentage) or decrease (negative percentage).
The most congested parts of the network are 8 avenues (urban arteries) covering the whole
region of Attica, during the peak hours and all the week days. It is obvious that commuters
are the user group mostly affected by congestion in these arteries.
10.3.1.2 Inter-urban road network
EGNATIA ODOS
According to the forecasts provided by the traffic model that EOAE uses, the Egnatia motor-
way -being a recently constructed corridor- is not predicted to be congested in the following
10-15 years. Traffic will be characterised as “congested” if traffic volumes exceed the num-
ber of vehicles/ hour, which equals to the motorway’s traffic capacity.
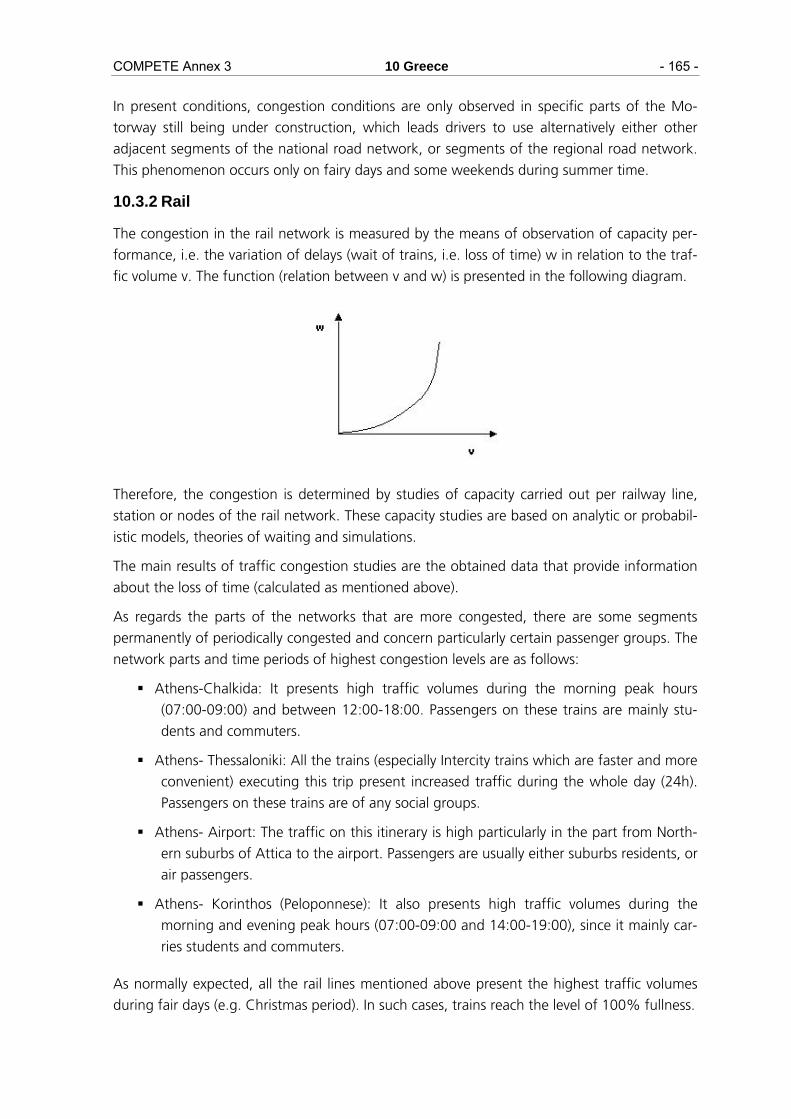
COMPETE Annex 3 10 Greece - 165 -
In present conditions, congestion conditions are only observed in specific parts of the Mo-
torway still being under construction, which leads drivers to use alternatively either other
adjacent segments of the national road network, or segments of the regional road network.
This phenomenon occurs only on fairy days and some weekends during summer time.
10.3.2 Rail
The congestion in the rail network is measured by the means of observation of capacity per-
formance, i.e. the variation of delays (wait of trains, i.e. loss of time) w in relation to the traf-
fic volume v. The function (relation between v and w) is presented in the following diagram.
Therefore, the congestion is determined by studies of capacity carried out per railway line,
station or nodes of the rail network. These capacity studies are based on analytic or probabil-
istic models, theories of waiting and simulations.
The main results of traffic congestion studies are the obtained data that provide information
about the loss of time (calculated as mentioned above).
As regards the parts of the networks that are more congested, there are some segments
permanently of periodically congested and concern particularly certain passenger groups. The
network parts and time periods of highest congestion levels are as follows:
Athens-Chalkida: It presents high traffic volumes during the morning peak hours
(07:00-09:00) and between 12:00-18:00. Passengers on these trains are mainly stu-
dents and commuters.
Athens- Thessaloniki: All the trains (especially Intercity trains which are faster and more
convenient) executing this trip present increased traffic during the whole day (24h).
Passengers on these trains are of any social groups.
Athens- Airport: The traffic on this itinerary is high particularly in the part from North-
ern suburbs of Attica to the airport. Passengers are usually either suburbs residents, or
air passengers.
Athens- Korinthos (Peloponnese): It also presents high traffic volumes during the
morning and evening peak hours (07:00-09:00 and 14:00-19:00), since it mainly car-
ries students and commuters.
As normally expected, all the rail lines mentioned above present the highest traffic volumes
during fair days (e.g. Christmas period). In such cases, trains reach the level of 100% fullness.

- 166 - 10 Greece COMPETE Annex 3
10.3.3 Aviation
Although there is a way of presenting the provided level of service in passenger air terminals
(levels A, B, …, etc according to ICAO – International Civil Aviation Organisation), such kind
of reporting is only applied in the case of the Athens International Airport (AIA) El. Venizelos.
Relevant studies/ measurements are usually included in the airports’ master plans.
Speaking about the AIA El. Venizelos, the key result that mainly occurs is the fact that the air
terminals do not respond sufficiently to the demand, which usually leads to proposing expan-
sions of air terminals.
On the other hand, island airports are under congestion conditions only during the summer
time, especially in August, which is the month that presents the highest rates of tourist traffic
in Greek islands.
10.3.4 Waterborne Transport
Each port has certain infrastructure constraints (e.g. vessel per dock), so the relevant ministe-
rial directorate is responsible for each port capacity compared to the vessel demand per day
and peak hour. After this comparison the timetable per port, vessel and route is elaborated in
order to fulfil the constraints. Observation data stored in each port police department are
handled in an ad hoc basis solving the problem immediately.
Although the port police is responsible for vessel traffic handling in peak hours, there is no a
concrete file for lost hours due to congestion or critical events (e.g. vessels delays). Even a
new EC study for maritime passenger rights is not containing such quantitative data.
There are no such concrete data for each port, although each port police is supposed to keep
records of critical events (e.g. delays).
10.4 Forecasts of congestion level (2020)
10.4.1 Road
10.4.1.1 Urban road network
ATTIKI ODOS
The congestion is projected to grow within the following years and this development is due
to the following factors:
Growth in the rates of ownership and use of private car in the greater Attica region.
Saturation of the urban road network, which leads more users to travel via the Attiki
Odos motorway in the case of journeys for which Attiki Odos is more competitive.
Development of the use of land all along Attiki Odos, which generates and attracts
new journeys by private car via this motorway.
Non-existence of alternatives related to public transport provision for serving the areas
in the environs of the motorway.
Ministry of Environment, Planning and Public Works - Traffic Management Centre

COMPETE Annex 3 10 Greece - 167 -
The main road network of the Attica Basin (the greater urban and sub-urban region of Ath-
ens), reaches during the peak hours the level of its traffic capacity; therefore, it seems to be
unable to serve higher traffic volumes in the future. The phenomenon that is observed in the
present and is expected to be retained in the future is the lengthening of the peak period to
time periods longer than 2 hours in the morning, noon and evening, which constitute the
typical peak hours.
The main factors contributing to the growth of traffic in urban areas, and especially in the
area of Athens are the increase of the private car ownership rate and the extraordinary con-
centration of Greek population in the urban area of the country’s capital city for reasons of
occupation.
10.4.1.2 Inter-urban road network
EGNATIA ODOS
It has been already mentioned that the model that Egnatia Odos use predicts that the mo-
torway will not be congested in the following 15 years. The model is being upgraded and
updated when needed, taking into account the whole national network and a big amount of
traffic, demographic and economic data. Updates also include the new values of users’ time,
the vehicles operational costs, any new infrastructures, and any other parameters having an
impact on traffic.
10.4.2 Rail
The traffic demand in both passenger and freight rail transport is increasing and leads to the
need of employing additional trains. Phenomena of traffic congestion do not really occur
currently but they are forecasted to appear in the future in the wider regions of the two big-
gest Greek cities, Athens and Thessaloniki.
10.4.3 Aviation
Forecasts for traffic volumes and congestion levels are carried out by using a combination of
methods, such as forecast of tendencies with regression, econometric models, researches of
market, etc.
10.4.4 Waterborne Transport
Currently, there is no particular method or means used by maritime transport organisations
or relevant authorities to forecast congestion levels.
There is only a DSS system (Coastal Shipping System) based on a GIS platform allowing to the
ministerial officers to modify the demand if such need occurs - offer data vs. routes, vessels,
sea companies. This is done by interlinking the infrastructure with the demand.

- 168 - 10 Greece COMPETE Annex 3
10.5 Policy measures envisaged to fight congestion
10.5.1 Road
10.5.1.1 Urban road network
ATTIKI ODOS
Given that the company “Attikes Diadromes” (the operator of the Attiki Odos motorway) is
responsible for the operation and the maintenance of the motorway, the possibilities of tak-
ing action and implementing measures in order to fight congestion are mainly restricted to
traffic control measures (providing information to users, alternative journeys etc) and the op-
timisation of responding to incidents, being based on specific procedures that are presented
thoroughly in the operating manuals that Attiki Odos owns.
However, as already mentioned, the operating company elaborates occasionally traffic con-trol studies for crucial segments or spots of the motorway, added to surveys by using ques-tionnaires addressed to the users in order to determine the trends of demand for travelling via Attiki Odos. In any case, the Ministry of Environment, Physical Planning and Public Works is the final receiver of any outcomes resulting from such studies and surveys and has the ex-clusive responsibility for approving any actions that are considered to be needed. Besides, the competent department of the Ministry of Environment, Physical Planning and Public Works constitutes the stakeholder responsible for any decision making related to the operation of the motorway in question.
Ministry of Environment, Planning and Public Works - Traffic Management Centre
The policies and measures that are envisaged to fight congestion conditions in the urban area of Attica include:
the completion – extension of the urban road network by self financing works under
concession conventions (i.e. extension of the existing peripheral motorway, construc-
tion of a tunnel etc.)
improvement of the existing traffic lights regulation, e.g. extension of the “gating”,
i.e. the time that “red” light lasts, in order to restrict the vehicles’ flow towards the
city centre and other congested parts of the road network.
As regards the impact of the European policies, within the framework of the measure “Intel-ligent Transportation Systems” the following Action has been announced: “Financing small to medium-sized enterprises for developing telematics applied to provide information to the network’s users”.
10.5.1.2 Inter-urban road network
EGNATIA ODOS
10.5.2 Rail
The measures that will be used to tackle congestion conditions in the future will be mainly the improvement of signalisation and the increase of trains’ capacity (number of passengers on board).

COMPETE Annex 3 10 Greece - 169 -
10.5.3 Aviation
The main measures that are envisaged to deal with current and future congestion are related to infrastructure provision. Specifically speaking about the Athens International Airport, ex-panding the air terminal’s building and extending the corridor’s length are envisaged for the future in order to provide an airport able to respond to the increase of demand that is al-ready observed and is expected to reach higher rates in the close future.
Currently, attention has been mainly paid in taking measures to ameliorate the quality and
levels of service provided and upgrade the safety conditions of the airport.
10.5.4 Waterborne Transport
As regards the waterborne transport, measures envisaged to fight congestion are relevant to
an integrated approach through the Ministry of Mercantile Marine Directorates for maritime
policy.
10.6 References
DG-TREN (2000), “Assembling A European Network of Monitoring Centres for Transport Infrastructure”
ECMT (2000), Overall Transport Infrastructure Survey
National Statistical Service of Greece (1999), Statistical Yearbook of Greece -2000, Athens
OECD, Environmental Performance Reviews, Greece, (2000) Nellthorp J, Sansom T, Bickel P, Doll C and Lindberg G (2001), “Valuation Conventions for UNITE”. UNITE (UNIfication of accounts and marginal costs for Transport Efficiency) Working Funded by 5th Framework RTD Programme. ITS, University of Leeds, Leeds.
INFRAS/IWW (2000), External Costs of Transport. Accident, Environmental and Congestion Costs in Western Europe, Study for the International Railway Union (UIC), Zurich and Karlsruhe.
Attiko Metro (2000), “Study for the Development of Athens Metro”, Athens
Egnatia Odos, “Measurements and Forecasts of Traffic Characteristics on Egnatia Odos”, Evaggelos Viskos, Simon Guy.
http://www.transport.ntua.gr/map/en/

- 170 - 10 Greece COMPETE Annex 3
10.7 Abbreviations
AADT Annual Average Daily Traffic
AIA Athens International Airport
DESE Regional Departments of Infrastructure Maintenance Control
DSS Coastal Shipping System
EC European Commission
ETHEL S.A. Thermal Buses Operator in Athens
EOAE Egnatia Odos Operating Company
ERDF European Regional Development Fund
EU European Union
GIS Geographical Information Systems
HGV Heavy Goods Vehicles
IALA International Association of Lighthouses Authorities
ICAO International Civil Aviation Organisation
ILPAP Electric Buses Operator in Athens
IMO International Maritime Organisation
ISAP S.A. Operating Company of Athens Metro Line 1
ITTMS Integrated Toll & Traffic Management System
KTEL Inter-city Road Transport Companies
LGV Light Goods Vehicles
MSC Maritime Safety Committee
OASA Organisation of Public Transport
OSE Hellenic Railways Organisation
RTS Regional Traffic Centres
SOLAS Safety of Life at Sea (SOLAS)
SMOK System of Measurements of Road Traffic
TEN Trans-European Networks
THEPEK Operations Room of Traffic Monitoring and Control
VDS Vehicle Detection Stations
VMS Video Monitoring Services
VOT Value of Time
VTMIS Vessel Traffic Management Information Services
VTS Vessel Traffic Service
COMPETE Annex 3 11 Portugal - 171 -
11 Portugal
11.1 Contacted Entities
The information on the situation of congestion in Portugal was requested to key contacts
from the following institutions:
Road: EP, Portuguese Roads Institute (http://www.estradasdeportugal.pt/site/v3/, not in
English);
Railway: REFER, railway infrastructure manager (http://www.refer.pt/en/);
Ports: IPTM, Institute for Ports and Maritime Transport
(http://www.imarpor.pt/main/main.htm);
Airports: INAC, National Civil Aviation Administration (http://www.inac.pt/, not in Eng-
lish).
Only the EP provided answers to the questionnaire for the interurban road sector.
Portugal does not provide, through its multiple public entities, explicit information regarding
traffic congestion nor traffic bottlenecks in any of the transport modes. In general terms,
congestion levels can be classified as low, except for the main cities, Lisbon and Porto.
11.2 Roads
11.2.1 Introduction
For roads, both interurban and urban, congestion is evaluated calculating the road saturation
(ratio of traffic loads by its capacity) with a methodology suggested by the Portuguese Roads
Institute (EP, Estradas de Portugal), according to the Highway Capacity Manual (HCM) of the
Transportation Research Board, National Academy of Sciences, United States of America. The
methodology for the assessment of congestion has the following steps:
1) Classification of the type of road: all roads, from highways to minor roads, are classified
by the EP according to the HCM procedures. The HCM proposes the calculation of the maxi-
mum capacity of the road according to a combination of several characteristics of the
infrastructure, such as:
Type of road;
Number and width of lanes;
Existence and width of hard shoulders, etc.
The combination of these factors, duly applied using to the HCM models, weights and cor-
rection factors, provide the parameters of the capacity for each road stretch.
2) Characterisation of the parameters defining the demand: this is, the traffic density for
each part of the network. Traffic is measured using several methods (mainly fixed automati-
sed counting stations) in order to calculate the number of vehicles using the road in terms of
AADT (average annual daily traffic). This number is calculated taking into account factors like:

- 172 - 11 Portugal COMPETE Annex 3
Total traffic volume in peak hours;
Percentage of heavy goods vehicles over total traffic.
3) Comparison of the AADT with the maximum capacity and calculation of the “service le-
vel”: the comparison of the maximum capacity and actual traffic provides the level of con-
gestion measured as a “service level”. These grades of congestion are classified using a ran-
king from A to F, being level A no congestion (in fact, almost free traffic with very low densi-
ty) and F total congestion. The maximum “level of service” per type of roads are the follo-
wing:
Highway concessionaires: are obliged to upgrade their highways (add one traffic lane)
in those stretches that shift from level B to C, being approximately the upgrades un-
dertaken when AADT reaches 38.000 vehicles for two lane highways and 60.000 ve-
hicles for three lane highways;
Public highways and main roads: the limit is also level B, but the road improvement is
up to the State;
National roads: the limit for upgrading is level C.
The different highway concessionaires control the traffic density in the main stretches of their
networks through CCTV systems. They help to tackle specific congestion problems, such as
those provoked by accidents, but there is no unified or standardized approach for such con-
gestion situations.
The EP provides an online facility in real time where the situation of the Portuguese highway
network is monitored. The situation of the network is presented in colours according to the
level of congestion, from green (no congestion) to red (heavy congestion). The web site also
provides access to traffic cameras in several locations across the country. In Figure 1 we pro-
vide an example of the online congestion facility for several highways in the Porto area. The
information is provided only for those highway stretches with automatised counting devices.
The site is the following (not in English):
http://www.estradasdeportugal.pt/site/v3/?id_pagina=&grupo=4&Ln=1&id_pasta=&id_bloco=BCD4D514-0D36-4627-8EDE-1BF88CD6DAB7&escondepasta=0
BRISA, the biggest Portuguese highway concessionaire also provides an online highway con-
gestion facility with access to traffic cameras all over its network. BRISA provides specific in-
formation in three maps: for its whole own network (Portuguese scale) and for the metropo-
litan areas of Lisbon and Porto. The information provided includes traffic density per stretch,
temporary point problems such as road works and even congestion caused by accidents. All
the traffic cameras of the network can be consulted online, as well as the information panels.
The site is the following (not in English):
http://www.brisa.pt/Brisa/vPT/Viajar+na+Rede/Transito+Online/Portugal/

COMPETE Annex 3 11 Portugal - 173 -
Source: EP web page
Figure 11-1:EP’s congestion on line facility; example for several highways in the Porto area
In Lisbon the GERTRUDE traffic system helps to relieve the traffic congestion problems in the
city through the coordinate use of traffic lights combined to field traffic measures. However,
there is not an official approach to urban congestion, being capacity increase works done on
a case by case basis.
11.2.2 Questionnaire
(01) BY WHICH MEANS ARE TRAFFIC CONDITIONS MEASURED AND WHICH KINDS OF
RESULTS ARE PROVIDED BY THESE MEASURES?
In concession motorways, traffic conditions are measures with automatic counting and its
respective classification. There are presently 35 spots with automatic counting, classification
and speed, being predicted that 30 to 40 new automatic counting posts will be created.

- 174 - 11 Portugal COMPETE Annex 3
Manual traffic counts are made with a periodicity of 1 to 5 years. In 2005 there have been
made manual counts on 558 posts. A National Campaign of Origin/Destination Surveys was
realized in 54 sections of the National Road Network, with the objective to define the natio-
nal origin/destination matrix. The goal was to characterize the demand within the scope of
the models of planning and operational management at the national level traffic.
(02) HOW IS CONGESTION DEFINED AND WHAT IS THE SITUATION OF TRAFFIC CONDITIONS
IN THE SINGLE MODES?
The main congestion problems of the national road network are located in the metropolitan
areas of Lisbon and Porto and mainly in the radial routes.
(03) WHAT IS THE PROJECTED DEVELOPMENT OF TRAFFIC CONGESTION AND WHICH ARE
THE MOST RELEVANT CONGESTION DRIVERS?
With the future conclusion of all the Complementary Itineraries in the two metropolitan a-
reas, the problems will be considerably diminished. The main drivers are the economic
growth and the demographic variation and concentration.
(04) WHICH POLICIES ARE ENVISAGED TO FIGHT CONGESTION IN THE FUTURE?
The National Road Plan establishes minimum service levels per category of road – the Main
Roads (all highways and main roads) must have at least a level of service B (according to the
Highway Capacity Manual), while Complementary Roads (national roads) must guarantee a
level of service C. The Plan dictates that in averaged size cities there must be predicted the
existence of circular a radial ways.
To promote the reduction of congestion, the National Plan stipulates that the entities respon-
sible for the exploitation of the road infrastructure by traffic management and by road securi-
ty shall, together, proceed to the installation of intelligent systems for information and traffic
management in the principal corridors of big capacity and in the metropolitan areas. In sum-
mary, in the case of the national road network, constituted by inter-urban roads, the main
instruments to reduce congestion in the future are the programmed investments for capacity
increase, as well as the installation of intelligent systems of information and traffic manage-
ment (road telematics).
11.3 Rail
Railroad analysis congestion or bottleneck information is even harder to obtain (if available).
Infrastructure manager (REFER), regulator (INTF) and operators (CP and Fertagus) may be col-
lecting some data but it has not been published yet. Nevertheless, a shallow bottlenecks
analysis can be made by analysis speed limit variations throughout a rail journey, which pose
a capacity reduction thus causing or increasing change of congestion levels.
The two operators, CP and Fertagus monitor the delays of their trains in different ways and,
thus, provide different data about them that do not allow comparisons of their perform-
ances.
On one hand, Fertagus operates a single concessioned line, the Tagus crossing, linking north
and south banks of the river (north and south side of Lisbon Metropolitan Area). The data
provided by Fertagus are recorded for the own purposes of the company: the goal is to ac-

COMPETE Annex 3 11 Portugal - 175 -
count the total delay per train and the cause of the delay, internal or due to REFER activities,
mainly management of the infrastructure and management of the operations at the railway
stations of the Lisbon Metropolitan area (where Fertagus and CP trains coincide). This is due
to the contract for the use of the infrastructure between Fertagus and REFER: REFER must
compensate Fertagus for any delay caused in their operations. Fertagus does not provide in-
formation concerning the number or percentage of delayed trains over its total operations.
On the other hand, CP provides figures of the percentage of delayed trains over its total op-
erations disaggregated by the type of service performed. CP classifies the delays according to
the eight classes of trains operated, not to the specific line :
Three suburban groups: Lisbon Metropolitan, Porto Metropolitan and Coimbra Subur-
ban trains;
Three long distance groups: Interurban Alfa, Interurban IC and International trains;
Two regional groups: Interregional and Regional trains;
Table 11-1 provides the percentage of trains delayed for each of the 8 train groups ac-
counted for by CP. Before 2002, delays were accounted taking all trains with delays over 5
minutes. From 2002 on, the threshold for delays was reduced to 3 minutes. Figure 2 Provides
the resume of the evolution between 2002 and 2004 of the percentage of punctual trains,
this is, trains with no delay or delays under 3 minutes.
CP doesn’t publish specific reports with the causes of the train delays. Some comments are
provided in the annual reports and accounts about delays related to railway upgrades un-
derway or specific works undergoing. For instance, the 300 kilometre long Lisbon-Porto line
is being upgraded since 2000, which provokes regular delays in the Alfa and IC long distance
services, even referred to the corrected annual timetables, as there are several unforeseen
problems taking place on that line derived from the rail works underway. Similar upgrade
works were undertaken recently in the Coimbra Suburban network, with the subsequent
delays of those services until 2004.
Table 11-1: Evolution of the percentage of CP’s punctual trains
2000 2001 2002 2003 2004
Lisbon Metropolitan N.A. 91 93 86 92
Porto Metropolitan N.A. 90 89 87 93
Coimbra Suburban N.A. 87 58 61 91
Interurban Alfa N.A. 86 78 65 70
Interurban IC N.A. N.A. 70 52 68
International N.A. N.A. 85 75 79
Interregional N.A. N.A. 75 64 79
Regional N.A. N.A. 85 77 83 Source: own elaboration from CP annual reports and accounts

- 176 - 11 Portugal COMPETE Annex 3
Punctuality levels: evolution of annual average values 2002-2004
0
10
20
30
40
50
60
70
80
90
100
Lisb
onM
etro
polit
an
Por
toM
etro
polit
an
Coi
mbr
aS
ubur
ban
Inte
rurb
an A
lfa
Inte
rurb
an IC
Inte
rnat
iona
l
Inte
rreg
iona
l
Reg
iona
l
2002
20032004
Source: own elaboration from CP annual reports and accounts
Figure 11-2:Evolution of CP’s punctuality levels, in terms of trains with delays under 3 minutes
11.4 Ports
There is no national official approach to port congestion in Portugal. Congested ports are
analysed case by case. In fact, main ports such as Lisbon or Leixões, include in their strategic
development plans references to capacity increases of their port facilities and of the railway
and road accesses. In fact, the main bottlenecks of the port sector, are related to the land
transport network connections with the ports.
11.5 Airports
The airport congestion situation is very similar to port: there is no national plan for conges-
tion issues and situations are treated case by case. Currently it is undergoing a national de-
bate concerning the construction of a new airport for Lisbon. However, this plan is not part
of a national policy, and arises as a specific response to the forecasted growth of the present
Lisbon airport, that is supposed to be congested (reaching maximum operational capacity) by
2015.

COMPETE Annex 3 12 Belgium - 177 -
12 Belgium
12.1 Introduction
For the couontry review on Belgium the following persons and institutions have been con-
tacted:
Eric Bulon Attaché - SPF Mobilité et Transports - DG Transport terrestre - Direction
Transport par Rail - [email protected]
Didier Antoine - Ministère de l'Equipement et des Transports - Direction du Trafic et de
la Sécurité routière - [email protected]
In the following sections the answers to the questionnaire are presented by mode
12.2 Inter-urban road transport
12.2.1 Measurement of traffic conditions
Traffic volumes and traffic conditions are measureed by the following means:
On motorways:
Automatic counting posts (with magnetic loops) on 80% of the network;
Some occasional counts on the other 20% of the network (rubber tubes, ra-dars);
Simple traffic models;
Classical traffic measures such as traffic flow, travel speed, occupation rate…
On classical inter-urban roads operated by the regions (Flanders, Walloon, Brussels):
The Belgian Federal Public Service Mobility and Transport collects traffic data for all the
Belgian motorways. These numbers are collected using single in-ductive loops. On
some locations, cameras are used instead of inductive loops. Globally, measurements
are realised at about 1200 places (1);
Magnetic loops for the permanent posts of measures (50% of the road net-work);
- Rubber tubes for the occasional posts of measures (50% of the road net-work);
Classical traffic measures (traffic flow).
The measures provide the following results:
On motorways:
Capacities used during peak-period (traffic volume/capacity) and distin-guished by traf-
fic lane.
Traffic density, average speed…

- 178 - 12 Belgium COMPETE Annex 3
On classical inter-urban roads:
Data on speed (1),
Volume and traffic density (1),
Capacity is not known, there is no conventional capacity.
For motorways, the measures are annually performed (for permanent counting posts, data are transmitted every minute (1)). Data are transmitted to 2 big regional centres (Perex for the Walloon region and Verkeerscentrum Wilrijk fot the Flemish re-gion). They are also transmit-ted to a federal post: the Start-Sitter-Iris system. Some other occasional counts are realised every 3-4 years.
On classical inter-urban roads operated by the regions (Flanders, Walloon, Brussels) automatic counts with magnetic loops are continuously performed. Counts with temporary tubes are generally realised during two periods of 3-4 weeks per year.
For motorways and ring roads traffic data is provided by the Belgian Federal Public Service Mobility and Transport. It is collected before and after almost every group of on and off ramps. Data is collected for each traffic lane separately and sometimes also on on and off ramps (1). Further data is reporeted separately for regional inter-urban roads;
The measurements are differentiated by time segments as follows:
On motorways, automatic counting data is differentiated per minute and aggregation is real-ised by periods of 6 minutes, quarters of an hour, hours (more particularly peak hours), typical days, average days and annually (vehicles-kilometres per year). For the occasional counts: aggregation is realised by hours (more particu-larly peak hours), typical days and average days.
On regional inter-urban roads automatic counts with magnetic loops, aggregations are
realised by hours, peak hours, typical days and average days. For automatic counts
with temporary tubes: aggregations are realised by hours, peak hours, typical days
and average days.
The data is further differentiated by light and heavy vehicles (1).
12.2.2 Congestion indicators
Definitions and assumptions used to determine or define congestion are very different. So, it is difficult to compare two different regions, for example.
On motorways:
Evaluation of the time losses (Study required by the Federal State, Study re-quired by
TML) and cost: www.start-sitter.be
Evaluation of the effects of the congestion (pollution, costs of time losses…),
On the Belgian motorway network, traffic jams are detected when the normal-ised
speed drops below 50 km/h. A traffic-jam ends when the intensity drops below 25
vehicles per minute and per lane, and the normalised speed ex-ceeds 75 km/h.
Evaluation of the number of kilometres from a certain percentage of the ca-pacity
reached (75%): “Recensement de la circulation”:
www.mobilit.fgov.be/data/mobil/brochf.pdf

COMPETE Annex 3 12 Belgium - 179 -
On regional inter-urban roads: No systematic calculations but realisation of studies.
A number of traffic indices have been developed by Transport & Mobility LEUVEN. These in-
dices have been implemented into the system government. There are some regional traffic
indices and local traffic indices. A regional traffic index provides a gen-eral overview of the
traffic throughput. The regional traffic index is a macroscopic in-dex which is not able to
visualise local bottlenecks. These index regions can be com-pared to each other and time
series can be constructed. Local traffic indices describe for each detector place the evolution
of traffic throughput. They provide a good picture of local bottlenecks. Most of the indices
are calculated twice: once for all traffic and once only taking the trucks into account. This
way, the contribution of the heavy vehi-cles can be estimated (1).
Regional traffic index – vehicle kilometres: this value monitors the total amount of
kilometres that are covered in a certain region;
Regional traffic index – regional volume index: it gives the average traffic vol-ume on a
lane of the motorway network;
Regional traffic index – regional lane index: amount of travel that occurs in congested
conditions;
Regional traffic index – regional inconvenience index: this index estimates congestion
levels as perceived by individuals. It gives the percentage of the vehicle kilometres that
are covered on congested road sections;
Regional traffic index – regional speed index: it gives the average speed on the mo-
torways in the regions considered;
Regional traffic index – the number of hours of travel delay in a region: two types are
seen: recurring delay occurs when travel times are long during peak hours. Accidents,
breakdowns and other events that temporarily de-crease roadway capacity, cause in-
cident delay;
Regional traffic index – congestion costs: it corresponds to the monetary value of
travel delay. It consists of multiplying the number of lost hours with the value of lost
time for each hour of the day. Three types of numbers are calculated: the total con-
gestions costs, the congestion costs during structural traffic-jams and the congestion
costs during incidental traffic-jams;
Regional traffic index – the weight of the traffic-jams: traffic-jam gravity is cal-culated
as the multiplication of duration and length. (kilometre hours);
Local traffic indices – the number of congestion days on a road section;
Local traffic indices – the traffic jam probability on a road section: probability of en-
countering a traffic-jam on the road section considered during a certain hour of the
day;
Local traffic indices – the length of recurring traffic-jams on a road section;
Local traffic indices – mean speed in a traffic-jam;
Local traffic indices – mean volume in a traffic-jam;

- 180 - 12 Belgium COMPETE Annex 3
On motorways, three parameters are used:
Time value: the determination of this parameter is difficult. This parameter is very vari-
able and subjective. The delay evaluation is more stable and so it is preferable.
Capacity per hour based on the number of traffic lanes and an optimum traffic flow (2
000 vehicles per hour per lane),
Speed-flow curves can be used except for low speeds.
On regional inter-urban roads: the main parameter is the capacity per hour.
12.2.3 Current situation
On motorways: Generally, annually averages of working days (in a working year (10 months))
are used:
Hours lost in congestion: in 2000-2003, 8.1 millions hours-vehicles for light vehicles
and 0.9 millions hours-vehicles for heavy vehicles,
Cost of the time lost in congestion depending on the GDP: in 2000-2003, 110 millions
euros, that means about 0.04% of the Belgian GDP,
Evaluation of the number of kilometres with a certain percentage of the ca-pacity
reached in peak-periods: In 2004, 521 kilometres reaching 75% of the capacity that
means about 7.5% of the network,
Evaluation of the effects of the congestion (pollution, costs of time losses…),
On regional inter-urban roads:
Evaluation of the number of kilometres with a certain percentage of the ca-pacity
reached in peak-periods: In 2000-2003, low part of the global network,
Time required reaching a specific point.
The most congsted parts of the road network are:
Ring-roads and inner ringroads of important agglomerations such as Brussels (4):
sometimes congestion of more than 25 kilometres during peak periods.
Ring-roads and inner ringroads of Anvers: sometimes congestion of more than 25
kilometres during peak periods more particularly because of current works.
On regional inter-urban roads: Congestion is less important except on some sections
12.2.4 Forecasts
The global traffic flow increases with the GDP (a little more on motorways and less on other
roads) and the motor vehicle fleet. According to the past evolution, the conges-tion peak
increases until a certain level of the infrastructure capacity (90-95%) and then tends to
spread on all the day time periods (not only peak periods).
The relation between the traffic growth and the GDP growth is less and less realised. The
GDP increases but traffic flow tends to grow more slowly in Walloon area and tends to stag-

COMPETE Annex 3 12 Belgium - 181 -
nate or to decrease in Brussels or the Flemish region. An important fac-tor to take into ac-
count is the demographic growth (and more particularly persons having a driving licence).
The direct cost of road travels is also an essential element. With the increase of fuel price,
road users tend to moderate their mobility. In term, it will have consequences on traffic vol-
umes.
12.2.5 Policy plans
The following policy measures are discussed to attack congestion:
Investment in new capacities is not envisaged except for some segments or “missing
links”;
Road pricing: tolls are envisaged. Modalities of the prices are not yet defined but the
goal of these tolls is the “openness” of costs;
Traffic dynamic management: incident management, information to road-users, etc.
Voluntary measures (free public transports, raise in the fuel price…) which tend to mix
traffic flow have limited effects. A reinforcement of these measures could have more
effects.
Extension of cpacities of rail, waterborne and airport infrastructure to relief the road
networks.
European documents are considered as references on key transport plicy topics: Toll, road
fees: norms, guidelines, etc., big infrastructures and directives on the evaluation of nuisances
(noise annoyances, air pollution, etc.). These measures do not actively combat traffic conges-
tion but they contribute to “discourage” the use of road.
12.2.6 Additional information
Federal State: Service public fédéral Mobilité et Transports Rue du Progrès 56 B – 1210 Bruxelles Internet : http://www.mobilit.fgov.be/ Contact : Mr G. Labeeuw Mél.: [email protected] Tél.: +32.(0)2.277.38.97
Flemish region: Administratie Wegen en Verkeer (AWV) Graaf de Ferrarisgebouw Koning Albert II - laan 20 bus 4 1000 Brussel Internet : http://wegen.vlaanderen.be/ Contact: Mr Stijn GOOSSENS Mél.: [email protected]

- 182 - 12 Belgium COMPETE Annex 3
Region of Brussels :
Ministère de la Région de Bruxelles-Capitale
Administration de l’Equipement et des Déplacements (A.E.D.)
Direction de la Politique des Déplacements
Rue du Progrès 80 bte1
B – 1035 Bruxelles
Internet : http://portail.irisnet.be/fr/region.shtml
Contact:
Mr Broes
Mél.: [email protected]
Tél.: +32.(0)2.204.19.29
TML (Université de Leuven): http://www.tmleuven.be/
Region of Walloon:
M.E.T. - Ministère de l'Equipement et des Transports
D.112 - Direction du Trafic et de la Sécurité routière
D.311 - Direction des Études et de la Programmation
Boulevard du Nord, 8
B - 5000 Namur
Internet : http://met.wallonie.be - http://routes.wallonie.be
Contact :
D.112 – Mr F. Latour, Mr D. Antoine
D.311 – Mr Van Duyse
12.3 Urban road transport
12.3.1 Measurement of traffic conditions
For urban roads operated by the regions (Flanders, Walloon, Brussels): Magnetic loops for the
permanent posts of measures (50% of the road network) and Rubber tubes for the occa-
sional posts of measures (50% of the road network). Sometimes systems can be centralized
(Liège, Gent).
For local urban roads:
manual traffic counts are realised every 5 years (statistical sample) by the Belgian Fed-
eral Public Service Mobility and Transport,
occasional counts are realised by the local municipalities.
For urban roads operated by the regions (Flanders, Walloon, Brussels) the preiodicity of traffic
counts is similar to regional inter-urban roads. For local urban roads manual traffic counts
are realised every 5 years for two days. Further, occasional counts of the local municipalities
are irregularly realised.
The differentiation of the traffic counts on regional urban roads by time of day is similar to
regional inter-urban roads. Local urban roads: for the manual traffic counts, aggregation is
realised by typical days and average days;

COMPETE Annex 3 12 Belgium - 183 -
The data is further differentiated by light and heavy vehicles (1).
Data on motorways and trunk roads is published via maps representing the capacity used
during peak-periods, by performance indicators published in internal services but accessible
to the public, by traffic census (information brochures, maps and arrays downloadable on the
webn). Automatic counts for motorways and other inter-urban roads are accessible online
under www.start-sitter.be. Data on all the Belgian networks: “recensement de la circulation”
is available http://www.mobilit.fgov.be/data/mobil/brochf.pdf.
The statistics of the main regularities on the whole network are public. The publication on
the web of detailed statistics about regularity and annual statistics about journey speeds for
the public is planned in the contract of the rail infrastructure manager (art. 36 of the “contrat
de gestion d’Infrabel”, approved the 5th of July 2005 in the “Moniteur belge” of the 31of
August 2005, see www.ejustice.just.fgov.be/cgi/welcome.pl)
12.3.2 Current situation
On regional urban roads: No systematic calculations but realisation of studies. On local urban
roads: No systematic calculations (few congestion problems because of less important roads).
The following key parameters are used: On regional urban roads: Capacity per hour and
optimum time required to reach a specific point. On local urban roads: Optimum time re-
quired to reach a specific point;
Current traffic congestion studies result in the following: On regional urban roads: Evaluation
of the number of kilometres with a certain per-centage of the capacity reached. On local
urban roads: Optimum time required to reach a specific point;
The following urban networks are most affected by congestion:
Little ringroads of Brussels (R20) and related roads,
Little rignroads of Anvers (Singel R10) and related roads,
Agglomerations of Brussels, Anwerpen, Gent, Liège, Charleroi, in peak peri-ods.
On local urban roads: congestion is less significant except on some sections in peak
hours.
On urban motorways, peak-periods are the most congested time periods. For Brussels and
the Flemish region, there is a staggering of peak-periods: business travels replace commuting
travels. Shopping travels are also a cause of congestion more particularly on evening peak-
periods and also on Fridays and on Saturdays. The most affected user groups are the com-
muting users. Business road users and shopping road users are also affected by congestion.
12.3.3 Forecasts
The increase of traffic flow is more limited, partly because of a certain level of satura-tion. In
some cities, a decrease of traffic is observed because of important local measures (specific
infrastructures for urban public transports and bicycles, limitation of parking area in business
zones) in addition to national measures such as free pub-lic transport, tax deductions…

- 184 - 12 Belgium COMPETE Annex 3
Road users and more particularly users of passenger cars believe that congestion is due to
heavy trucks. But in fact, road network is saturated because of passenger cars volume during
peak-periods.
12.3.4 Policy plans
The concept to address congestion issues in Belgium urban areas is the covering of employ-ees’ expenses for season tickets relating to commuting travels by employers.
12.3.5 Additional information
Actors in urban public transport:: 3 regional companies:
www.delijn.be
www.stib.be
www.infotec.be
12.4 Rail transport
12.4.1 Measurement of traffic conditions
Properly speaking, there is no “congestion” in rail transport as the traffic flow is entirely pro-grammed. The fact that some people have to stand all the way in the train can be considered as a congestion phenomenon (due to train capacity). The consequences of that problem are limited. This “congestion” only causes problems of comfort: there is no time lost
Perturbations of traffic are measured by:
Permanent and exhaustive measurements of delays and perturbations. The system is
largely automated but some data are still manually collected.
Systematic census of overloading trains (standing passengers) in internal transport.
Customers surveys on quality of service (regularity).
The values recieved are:
Measurements of delays and perturbations ;
Overloading trains (standing passengers) in internal transport;
Customers’ opinions on quality of service (regularity).
Delays are recorded continuously. The data is differentiated by market segmentds:
Internal passengers traffic: in Brussels (centre of the rail network) and in rail termi-nals;
International passengers’ traffic (very high speed lines and standard lines): in Brussels,
in rail terminals and in boundary.
Goods traffic: in points of destination or in boundary.
Due to their regular recording data are exhaustive, all type of segmentation can be done (it depends on the utility of the data). The following statistics are used regularly:
Regularity of internal and transborder passengers traffic: Percentage without train neu-
tralisation: on time, with a maximum delay of 5 minutes, with a delay between 6 and

COMPETE Annex 3 12 Belgium - 185 -
30 minutes, with a delay superior to 30 minutes, cancelled. Percentage of trains with
a delay superior to 5 minutes due to emergency situations, realization of big invest-
ment projects or slackening of speed due to security reasons. Regularity of trains on
the arrival in Brussels, differentiated by lines.
Regularity of international passengers traffic with high speed lines: Percentage without
train neutralization: on time, with a maximum delay of 5 minutes, with a delay be-
tween 6 and 30 minutes, with a delay superior to 30 minutes, deleted.
Regularity of international passengers traffic with standard lines: Percentage without
train neutralization: with a maximum delay of 6 minutes, with a delay between 6 and
30 minutes, with a delay superior to 30 minutes, deleted.
Regularity of goods traffic:Percentage without train neutralization: with a maximum
delay of 60 minutes, with a delay superior to 60 minutes.
The document http://www.mobilit.fgov.be/data/mobil/brochf.pdf provides data on regional
urban roads. Data on local urban roads for the manual traffic counts: “Recensement
quiquennal de la circulation” is published on thew web by the document
http://www.mobilit.fgov.be/data/mobil/broch00f.pdf. Aggregation is realised by typical days
and average days;
12.4.2 Current situation
Properly speaking, there is no “congestion” in rail transport as the traffic flow is entirely pro-
grammed. The traffic delays are given as percentages of train delayed in comparison to a
norm. It is difficult to establish the average delay per passenger depending on the trains fre-
quency (which offer other alternatives to passengers) and connections.
The most loaded network parts are: Railway lines reaching Brussels and more particularly
Brussels – Ottignies, Brussels – Nivelles and Brussels – Gent (4).
Currently in Belgium, there is no saturated infrastructure as defined in the directive
2001/14/CE. Though, there are problems of capacity that require an important coordi-nation
and aggravate the impacts of possible perturbations. The network parts concerned by these
problems are:
For passengers transport: Brussels (access and crossing),
For freight transport: rail service of the harbour of Zeebrugge (railway line of Gent-
Zeebrugge and formation yard of Zeebrugge Centraal), rail service of the harbour of
Antwerpen (railway line of Mechelen-Antwerpen, railway line of Aarschot-
Antwerpen, left bank of the harbour), railway line of Namur-Charleroi, formation yard
of Monceau (Charleroi)
Little rignroads of Anvers (Singel R10) and related roads,
Agglomerations of Brussels, Anwerpen, Gent, Liège, Charleroi, in peak peri-ods.
The congestion problems at boundaries (formalities, technical constraints, etc.) are not the
most significant in Belgium.

- 186 - 12 Belgium COMPETE Annex 3
Comments: These problems of capacity mainly result of the rail traffic growth, which is a
positive element in the modal shift policy. Punctual or limited problems of capacity are nor-
mal in the infrastructure man-agement.
12.4.3 Forecasts
It is not pertinent for the rail transport. It is essentially the road congestion which evolves.
12.4.4 Policy plans
To address congestion the following measures are envisaged:
New infrastructures: The modal shift policy of the Government requires investing in
new rail capaci-ties (the Government’s commitments are mentioned in the contracts
of public companies, mainly Infrabel. Modernisation in term of travel speed (very high
speed lines and other railway lines). Realisation of “missing links”.
Covering of employees’ expenses for season tickets relating to commuting travels by
employers.
European documents and policies are considered as references on big infrastructures, the
direct financing of infrastructures or studies by the European Union has an effec-tive impact
but this impact is limited in comparison to the investments of the Govern-ment;
The improvement of the competition conditions between modes (particularly with the inter-
nalisation of external costs), the interoperability or the new technologies of traffic manage-
ment could improve the efficiency of the rail transport but progresses are dif-ficult and posi-
tive impacts could only appear in a long term horizon. Consequently, the UE impact seems
limited.
12.4.5 Additional information
www.sncb.be
The rail transport is exclusively realised by the Federal State. The main actors are:
Mr Renaat Landuyt:Minister of the Mobility (Tel:+32 (0)2-237.67.11 Rue Brederode 9
B-1000 Bruxelles)
Mr Bruno Tuybens:Secretary of State for public companies, assistant to the Minister of
the Budget ([email protected] Tel:+32 (0)2-210.19.11 Fax: +32 (0)2-217.33.28, Rue
Royale 180 B-1000 Bruxelles)
“SPF Mobilité et Transports” - Rue du Progrès 56 à 1210 Bruxelles – Tel :32 2 277 31
11, Fax : +32 (0)2-277.40.05 - www.mobilit.fgov.be)
INFRABEL, manager of the infrastructure (110 Rue Bara - 1070 Bruxelles)
(See www.belgium.be for more detailled information)

COMPETE Annex 3 12 Belgium - 187 -
12.5 Literature review
12.5.1 Inter-urban road transport
12.5.1.1 Evaluation of the congestion
1. “Traffic indices for the use of the Belgian motorway network ” Authors : Transport & Mobility Leuven Publication date : 2003, January Type of document : Working paper Web-site : http://www.tmleuven.be/Verkeer/Paper_200301.pdf Abstract : The Belgian Federal Government developed the STAR/SITTER-system to collect and process the data provided by the single inductive loop detectors on the motorways. Transport & Mobility Leuven developed a number of traffic indices to monitor traffic flow, congestion and emission costs.
12.5.1.2 Traffic model
2. “Traffic congestion problems in Belgium : Mathematical models, Analysis, Control and Actions ” Authors : S. Logghe, L.H Immers Publication date : 2000 Type of document : Project report Web-site : http://bwk.kuleuven.be/sr99/tra.htm Abstract : The primary goal of this project is advice on mathematical models and interactive software tools that should support (local, regional or federal) governments and traffic management organisations in taking appropriate traffic management measures and to help them in their development of short term and long term traffic management policies. This includes the development of tools to generate optimal control policies for the reduction of traffic congestion and the evaluation of analysis and simulation tools. The project is concerned with dynamic traffic control measures in order to re-route and to control actual traffic flows. This type of traffic control policies will be implemented by so-called advanced traffic management and information systems. Traffic micro simulation is used to inspect the current traffic situation and to simulate and visualise the effect of various traffic policy measures. Some examples of policy measures that could be used in the framework of Advanced Traffic Management Strategies (ATMS) are: Using input from the road information system, the control system adapts traffic light se-quences at several connected intersections in such a way as to reduce congestion. The system can advise traffic authorities on the best way to avoid congestion given the current weather conditions, expected traffic loads, the location of roads or highway lanes closed due to accidents, construction and maintenance. In order to stimulate the use of public transportation, buses could be equipped with a transmitter that emits a signal when the bus approaches an intersection. The traffic light controller can then adjust the traffic light sequencing at the intersection such that the bus gets priority or will have guaranteed short waiting times. The ring around Antwerp is used as case-study. By means of the models, the strategy and efficiency of several dynamic traffic management measurements is calculated.

- 188 - 12 Belgium COMPETE Annex 3
12.5.1.3 Policies to fight congestion
3. “Optimal urban transport prices in the presence of congestion, economies of density and costly public funds ” Authors : K. Van Dender Publication date : September 2001, revised November 2003 Type of document : Working paper Web-site : http://www.econ.kuleuven.ac.be/ew/academic/energmil/downloads/ete-wp01-19.pdf Abstract : Using a numerical model of the urban transportation sector, calibrated to data for Brussels and for London, we calculate the optimal transport price structure and its effect on the transport equilibrium and on welfare. Removing existing subsidies to public transport and to car parking, internalising transport externalities (mainly congestion) and optimising the frequency of public transport service increases welfare by approximately 2% of total in-come in both cities. Optimal prices are higher than current prices in most transport mar-kets, so that optimal transport demand is below current demand. There is a strong shift to public transport in the peak period. Finally, calculations for Brussels of optimal public transport prices for unchanged reference car taxes indicate that only limited welfare gains can be obtained by charging near-zero fares in peak hours.
12.5.2 All modes
12.5.2.1 General data
4. “Plan régional de développement de la ville de Bruxelles ” Authors : Government of Brussels Publication date : 2002 Type of document : Regional development plan Web-site : http://www.prd.irisnet.be/Fr/constat/constat00.htm Abstract : This document, and more particularly chapter 9, presents the problems of regional acces-sibility: peri-urban and urban mobility problems due to congestion phenomenon on road network (congestion at the entrances to the city, congestion of the main part of the mo-torways network…) and rail network (on different major railway lines such as Brussels-Ottignies, Nivelles or Gent).

COMPETE Annex 3 13 Czech Republic - 189 -
13 Czech Republic
Responsible: CDV
So far statements of the following institutions have been received:
RSD: Road and Motorway Directorate
UDI Praha: Institute of Transportation Engineering of the City of Prague
CSL: Czech Airport Authority
CD (Czech Railways, Directorate General) Dipl. Ing. Tilser, Dipl. Ing. Vydra
13.1 Inter-Urban Road
13.1.1 Measurement of traffic data
RSD: Traffic conditions are measured by the following means: Automatic traffic counters (inductive loops) on the highways: continuous measuring,
pick-up data monthly, report annually
Manual traffic counts: once every 5 years for the road network of the Czech Republic
(last 2005).
Traffic accident reports from police: monthly
Camera systems – road traffic monitoring: operational level
Output data are used for investment plans, maintenance, bridge, highway, and roads recon-
struction etc.
Automatic traffic counters are differentiated according to:
Traffic intensity daily variation graph (working days, weekend)
Traffic intensity graph for peak hours
Average daily traffic intensity history after hours for each day in week
Average daily traffic intensity history after hours for working days, weekend days
Table and graph for traffic intensity in 250 peak hours (average day, working day,
weekend day)
Classification of traffic flow (car, lorry, bus, truck)
The data is published by the following institutions:
MD CR (Ministry of Transport of the Czech Republic): internet www.mdcr.cz. All
transport modes are covered by the Transport Yearbook (see file Extract from Trans-
port Yearbook 2004.doc)
RSD (Road and Motorway Directorate): Internet: www.rsd.cz. Road & Motorways in
the Czech Republic 2005 (see file RSD2005en.pdf)

- 190 - 13 Czech Republic COMPETE Annex 3
Mapy (Map): www.mapy.cz - Dopravni informace – Doprava v CR (Czech language
only)
- Traffic information table
- Traffic restrictions
Broadcast – Impuls, CR1 – Traffic newscast
GSM operators – Traffic information
Figure 13-1: Traffic intensity map of the Czech Republic 2003<
13.1.2 Results and current network conditions
RSD: Congestion data (delay, number of vehicles, vehicles classification, delay costs etc.) are
not collected. Accordingly, there are no results of traffic congestion studies. Only traffic in-
tensity statistics are base for planning.
The Czech Republic has 546km of motorways and 54,958 km of roads in operation, out of
that 6,156 km of class I roads (out of that 336 km of expressways), 14,669 km of class II
roads and 34,128 km of class IIII roads. Motorways and major roads carry the biggest portion
of traffic volumes and connect the most important administrative, economic and resort cen-
tres. This includes a network of international roads (including motorways) marked with the
letter E, according to the AGR (European Agreement on Main International Traffic Arteries),
in the length of 2,644 km. With the density of 0.70 km of roads and motorways per 1 km2,
the Czech Republic ranks among the leading European countries. (See files Traffic-intensity-
map_2000.jpg, Motorways_Intensity_1994-2003.pdf)

COMPETE Annex 3 13 Czech Republic - 191 -
Overloaded road network part 2003:
Motorway D1 (Praha-Brno-Olomouc) 30-50 000 vehicles per day
Motorway D5 (Rudna-Rokycany) 20-30 000 vehicles per day
Fast road R1 (The Prague ring-road) 35-50 000 vehicles per day
13.1.3 Driving factors and forecasts of congestion
CDV: Trends of changes in the number of vehicles are similar as in road traffic volumes and
transport performances. The numbers of passenger cars, vans and heavy-duty vehicles are
always growing. Unfortunately, this trend will also probably continue in the nearest years,
because after the entrance to the EU the freight transport will grow especially. After remov-
ing business barriers, the freight transport will become the lucrative business.
Regarding the stagnation of the demographic development in the Czech Republic, the num-
ber of passenger cars per 1000 inhabitants has always increasing tendency – in 2003 there
were already 362,9 passenger cars per one 1000 inhabitants. Similarly the number of vehicles
per 1 km of road network is increasing, which results in growing congestions especially in
municipal transport.
Most relevant congestion drivers:
Heavy vehicles transit after the entrance to the EU
Insufficient infrastructure capacity
Increase number of motor vehicles in CR [thousand cars]
Number of vehicles per GDP [number/1 million USD GDP]
Table 13-1 and Table 13-2 present the respective development of the Czech vehicle fleet.
Table 13-1: Development of Czech vehicle stock 1990 to 2003
Year Type of vehicle
1990 1992 1993 1994 1995 1996 1997 1998 1999 2000 2001 2002 2003
Single – track vehicles
1172 1175 1151 912 915 918 930 927 800 749 755 760 752
Passenger cars
2411 2580 2747 2924 3043 3193 3392 3493 3440 3439 3530 3619 3702
Goods vehicles
156 156 148 184 203 225 247 260 268 276 296 324 340
Buses 26 26 25 19 20 20 21 20 19 18 18 21 21
*Total 3765 3937 4071 4039 4181 4356 4590 4700 4527 4482 4599 4724 4815
Source: CDV

- 192 - 13 Czech Republic COMPETE Annex 3
Table 13-2: Number of vehicles per GDP in the Czech Republic 1990 to 2003
Year Type of vehicle
1990 1992 1993 1994 1995 1996 1997 1998 1999 2000 2001 2002 2003
Total 28,1 33,4 34,6 33,5 32,7 32,7 34,7 35,9 34,5 33,0 32,9 33,1 32,9
Motorcycles + scooters
8,7 10,0 9,8 7,6 7,2 6,9 7,0 7,1 6,1 5,5 5,4 5,3 5,1
Passenger cars
18,0 21,9 23,4 24,2 23,8 24,0 25,7 26,7 26,2 25,3 25,2 25,4 25,3
Goods vehicles
1,2 1,3 1,3 1,5 1,6 1,7 1,9 2,0 2,0 2,0 2,1 2,3 2,3
Buses 0,2 0,2 0,2 0,2 0,2 0,2 0,2 0,2 0,1 0,1 0,1 0,1 0,1
Source: CDV
13.1.4 Policy plans
RSD (Road and Motorway Directorate)
Using ITS for traffic flow management – internal policy
Deployment of Unified Traffic Information System (JSDI) – government decision No.
590/2005
Road network development in the Czech Republic till 2010 – government decision No.
741/1999 solve to a certain extent difference between traffic intensity and road net-
work capacity. The program priorities are:
o The Prague ring-road
o Second motorway D8 connection to Germany
o Motorway D5 - Pilsen bypass finishing
o Motorway D47 finishing – Brno – Ostrava – Poland connection
Several new road construction projects are due to start this year. The D1 motorway will be
extended between Morice, Kojetin and Kromeriz, Central Moravia, while a new stretch of the
D47 motorway will be built to connect Belotin, Hladke Zivotice and Bilovec, Northern Mora-
via.
The influence of EC-policy on Czech transport policy of all modes can be described as fol-
lows:
The Czech Republic’s transportation policy for 2005 – 2013 is a complex document, which
sets the strategic and conceptual goals for transportation and transportation networks. The
hitherto applicable Transportation Policy, approved by the Government in 1998, by its Reso-
lution no. 413/1998, defined the strategy for this sphere up to the country’s accession to the
EU. One of the main reasons for the elaboration of a new transportation policy was the pub-
lication of the EU White Paper: “European Transport Policy up to 2010: Time to Decide,” in
2001. That document critically depicts the hitherto development of the inter-disciplinary divi-
sion of transportation-related work, in favour of transportation fields, which have a more
negative impact on their surroundings; and it gives impetus for change. Another impulse

COMPETE Annex 3 13 Czech Republic - 193 -
was the conclusions of the Johannesburg Summit on Sustainable Development, held in 2002.
The concept of sustainable development based on three pillars (economic, environmental,
and social) has led to a re-evaluation of developments in transportation, in favour of that
which has the smallest negative impact on the environment. And, last but not least, the rea-
son for updating the transportation policy was the “Strategy for Sustainable Development,”
approved by the Czech Government’s Resolution no. 1248/2004, which has become the cor-
nerstone for the elaboration of other sector-specific policies.
The document is elaborated on the basis of the latest methodology used for EU conceptual
documents; in particular, it clearly defines its premises, goals, and the tools that are to be
used for achieving its goals, including control mechanisms – monitoring based on pre-
determined indicators.
EC DG TREN Enlargement and European Union Transport Policy:
Priority projects declared to be of European interest:
Motorway route Gdansk-Brno/Bratislava-Wien (between 2009 – 2010)
ISPA
Bypass fast road R48 Belotin (2.1 km, 17 mil EUR)
Fast road R48 renovation Dobra – Tosanovice (6.88 km, 20 mil. EUR)
Fast road R48 renovation Dobra – Frydek-Mistek (5.24 km, 20.5 mil. EUR)
13.1.5 Additional information: Institutions
Ministerstvo dopravy MD CR (Ministry of Transport of the Czech Republic)
nábřeží Ludvíka Svobody 12/1222, P.O. Box 9, 110 15 Praha 1
Státní fond dopravní infrastruktury SFDI (The State Fund for Transport Infrastructure)
Sokolovská 278 ,
190 00 Praha 9
The State Fund for Transport Infrastructure (SFDI) was established by act 104/2000 Sb, on 4th
April 2002, and was enabled from 1st July 2000. The aims of the fund are the development,
construction, maintenance and modernisation of roads, motorways, railways and inland wa-
terways. Apart from self-financing of construction and maintenance, the fund also contrib-
utes to research and project works, education and expert activities connected with transport
infrastructure.
Reditelstvi silnic a dalnic RSD (Road and Motorway Directorate)
Cercanska 12, CZ-14000 PRAHA 4
The Road and Motorway Directorate of the Czech Republic (RSD CR) is a national contribu-
tory organisation, founded by the Ministry of Transport and Communications on January 1,
1997. The organisation fulfils the following main tasks in the framework of its basic subject
of activity:

- 194 - 13 Czech Republic COMPETE Annex 3
Management of motorways and roads of the 1st class (up to present there are 533 km
of motorways and more about 300 km of specified expressways of the 1st class) in-
cluding components and facilities of these communications according to §12 and a
subsequent Act No. 13/1997 Coll., concerning roads, as amended, together with re-
lated rights and obligations and related ground
Guarantees maintenance and repairs of motorways and roads of the 1st Class, includ-
ing components and facilities of these roads and acquisition of further assets neces-
sary for management of these assets
Guarantees groundwork for determination of conceptions in the field of roads and
motorways
Guarantees realisation of approved transportation policy and conception in the field of
roads and motorways, guarantees their development and territorial protection
Co-operates with respective bodies of national authorities and provides groundwork
for their activity
Processes groundwork, proposals and reasoning for acquiring and optimal allocation
of funds for roads and motorways
Guarantees unified technical policy of the branch, participates in the processing of
technical regulations and processes groundwork for them
Guarantees administration of the central documentation and statistics of roads and
motorways and guarantees editions of road maps
Guarantees the information system of the road management including the road data-
base and guarantees winter information service concerning traffic ability of roads and
motorways
Provides counselling, consulting and service activity in the field of road management
and analysis of the development of road accident rate including proposals of meas-
ures
Guarantees overall activities concerning road and motorway management and main-
tenance
Centrum dopravniho vyzkumu CDV (Transport Research Centre)
CDV (Transport Research Centre) has more than forty years long tradition of research and
development. CDV has been appointed since 1 july, 1996 by the decision of the Minister of
Transport of the Czech Republic as the only research institute on transport issues under the
responsibility of the Ministry of Transport.
CDV provides research development, expertise and consulting services to:
Transport policy, prognosis, and modelling
Statistics informatics, GIS
Land use transport planning
Transport safety

COMPETE Annex 3 13 Czech Republic - 195 -
Environment
Road transport
Urban transport
Public transport
Air transport
Combined transport
Transport psychology
Intelligent transport systems
13.2 Inter-urban rail
13.2.1 Measurement of delays and traffic conditions
CD (Czech Railways) Generally about traffic conditions measurement in railway.
Railway transport is organized on the basis of in advance announced timetable and freight
transport diagram that is applicable for given time period. Divergences during the operation
come up because of irregularity and exceptional events. These divergences are divided to:
Planned - train delays caused by the diriment trains drive, traffic closures - moderniza-
tion, reconstruction etc.
Unplanned - unplanned traffic closures created in connection by defects on infrastruc-
ture, thereinafter divergences caused by the fault on railway vehicles and mistakes
during the railway traffic organization.
Planned traffic closures are frequent and inevitable, because the Czech railway net is mod-
ernized gradually. On the main lines ca 587 of permanent speed limitations of track in total
length 830 km; 372 short-term speed limitations of track in total length 359 km. The meas-
urement is pursued in divergences from given timetable and public transport diagram. The
divergences are continuously recorded and further statistically processed. Passenger trans-
port: It is statistically investigated how the diagram was filled in %, with the classification to
months, Q and year. The performance is monitoring at individual train sorts: Super City, Inter
City, Express, Fast train, Quick train, Passenger-train.
Departures from the departure station and arrivals to the arrival station are counted; the de-
lay up to 5 minutes is tolerated.
Passenger and freight transport:
Motion and position monitoring of train on track is ensured within the traffic control, but it is
just about the main lines. Data are continuously recorded into the mutually communicating
information systems. (MIS, ISOR, CDS). Where these information systems aren’t established
(especially regional line) data are re-corded by the �D employees into the documentation.
Consequently there is in process the report of these data to the traffic controller, who does
the operative traffic control on a given track. Data evaluation on the main lines is continuous
and it is used to operating management. Data are statistically evaluated daily, weekly,
monthly, quarterly and yearly. Outputs from �D for public are monthly, quarterly and yearly.

- 196 - 13 Czech Republic COMPETE Annex 3
Costs connected with that are included to the costs for railway traffic road operating and it’s
not possible to specify them like that.
The performance is monitoring at individual train sorts (See file CD trains delay.doc)
The data is published by the Czech Railways (CD)
online under www.cd.cz,
by their Annual Report 2004 (see file CD_Annual_Report_2004.zip)
by the Statistical Yearbook 2004 (see file CD_Statistical_Yearbook_2004.zip)
13.2.2 Evaluation and results
CD: The delays are counted from departures from the departure station and arrivals to the
arrival station. The delay to the 5-minute is tolerated. Thereinafter the delay is divided accord-
ing to the duration:
To 10 min
To 15 min
To 30 min
To 1 hour
To 2 hours
Train cancelled
Next is the monitoring of average delay within 100 km of these trains drive in our
area, etc.
Data from the whole line are methodically investigated and all obtained data have the same
weight, i.e. the train has such weight, as long it goes. The methodology is incorporated to
the information systems, which evaluate these data. The result of statistics is data in % that
express the keeping of timetable, i.e. how many % of ČD trains leaved last year its departure
station and came to the arrival station in time, or with an accuracy of 5 min. The perform-
ance is monitoring at individual train sorts (SC, EC, IC, Ex, R, Sp, Os). Next calculations are for
month, quarter and year.Last year, ČD monitored altogether 4 783 830 departures and arri-
vals (4 326 712 of data were in time or in tolerance up to 5 min).
The results serve for the evaluation of transport quality and technology. On the basis of re-
sults are planned the reparation and the capital actions. Results for 2005Yet, CD published
the results for the 1st half of year 2005, the diagram of public transport was reached on 92,3
% (in 2004 it was 91,7 % and in 2003 just 90,4 %), so the improvement has come - espe-
cially thanks to the track modernization.
The improvement is by 0.5% better than in the same time period of last year. From 2 441
712 of monitored trains was 2 252 859 connections in time in accordance with international
standards.

COMPETE Annex 3 13 Czech Republic - 197 -
Table 13-3: Annual punctuality values of theCzech Railways 2000 to 2005
Year 2000 2001 2002 2003 2004 2005 (first half)
Punctuality (%)
90.7 90,3 89,9 90,4 91.7 92.3
Source: CD
Detailed results are presented by the following tables:
Table 13-4: Delays in 2004 (to 11.12.) by the train categories
SC EC IC Ex R R5,7 Sp Os/h Os/v
from 1.3. from
30.7. from 13.4.
from 15.6.
from 2.11.
to 5' 82,2
% 75,0
% 71,7
% 71,1
% 76,7
% 73,3 % 77,6 % 77,0 % 82,5 %
to 10'
93,1 % 86,2 % 83,4 % 83,9 % 88,5 % 85,9 % 90,6 % 88,7 % 91,9 %
to 15' 96,7 % 91,6 % 89,2 % 91,0 % 94,0 % 92,5 % 95,9 % 94,0 % 95,7 %
to 30' 99,1 % 97,1 % 96,5 % 98,1 % 98,7 % 98,6 % 99,4 % 98,6 % 98,7 %
Table 13-5: Delays in 2005 (12.12.2004-13.9.2005) by the train categories
SC EC IC Ex R R5,7 Sp Os/h Os/v
to 5' 91,5 % 74,6 % 83,5 % 89,5 % 82,1 % 80,5 % 85,3 % 90,8 % 87,5 %
to 10' 96,4 % 87,0 % 91,2 % 94,9 % 91,5 % 91,2 % 94,5 % 96,4 % 95,2 %
to 15' 98,0 % 92,3 % 94,7 % 96,7 % 95,4 % 95,3 % 97,5 % 98,4 % 98,1 %
to 30' 99,1 % 96,9 % 98,3 % 98,7 % 98,6 % 98,9 % 99,5 % 99,7 % 99,7 %
Table 13-6: Express train delays (R to SC) in 2004 (1.3.-11.12.) by months
03 04 05 06 07 08 09 10 11 12
to 5' 78,0 % 74,6 % 72,2 % 72,7 % 74,1 % 75,9 % 75,2 % 76,4 % 79,9 % 89,1 %
to 10' 89,1 % 87,3 % 85,5 % 85,9 % 86,9 % 88,2 % 87,7 % 88,4 % 90,3 % 95,8 %
to 15' 94,2 % 93,2 % 92,4 % 92,3 % 92,9 % 93,7 % 93,3 % 94,0 % 94,8 % 98,0 %

- 198 - 13 Czech Republic COMPETE Annex 3
to 30' 98,4 % 98,5 % 98,6 % 98,2 % 98,3 % 98,6 % 98,5 % 98,8 % 98,5 % 99,4 %
Table 13-7: Express train delays (R to SC) in 2005 (12.12.2004-13.9.2005) by months
12 01 02 03 04 05 06 07 08 09
to 5' 89,6 % 88,7 % 84,9 % 85,6 % 82,3 % 77,2 % 75,2 % 78,2 % 81,4 % 79,1 %
to 10' 95,6 % 95,0 % 93,0 % 93,1 % 92,1 % 89,1 % 88,0 % 89,3 % 91,4 % 90,0 %
to 15' 97,5 % 97,1 % 96,0 % 96,0 % 96,0 % 94,2 % 93,5 % 94,0 % 95,4 % 94,7 %
to 30' 99,2 % 98,9 % 98,5 % 98,5 % 99,0 % 98,4 % 98,4 % 98,1 % 98,7 % 98,6 %
Glossary: Percents indicate, how many connections (gained data) had the delay at given limit, R
5,7 are Friday and Sunday Express trains (1400-1599),
Os/h are passenger trains on the main lines, Os/v are the other passenger trains.
Most loaded part of infrastructure 2004:
Kolin ser.n. -Recany n.L. 29.717 mil gross tons
Kolin ser.n. -Kolin 37.278 mil gross tons
Kolin -Kolin ser.n. 41.466 mil gross tons
Ostrava-Svinov -Ostrava hl.n. 34.095 mil gross tons
Ostrava-Svinov -Vyh.Polanka nad Odrou 40.178 mil gross tons
Vyh.Polanka nad Odrou -Ostrava-Svinov 26.599 mil gross tons
Vyh.Polanka nad Odrou -Studenka 46.362 mil gross tons
Studenka -Vyh.Polanka nad Odrou 31.935 mil gross tons
Studenka -Hranice na Morave 46.336 mil gross tons
Hranice na Morave –Studenka 31.716 mil gross tons
Prosenice -Hranice na Morave 35.954 mil gross tons
Prosenice -Prerov os.n. 30.828 mil gross tons
Overloaded part of infrastructure 2004:
Hranice na Morave – Prosenice (50.726 mil gross tons)
Ostrava hl.n. - Ostrava-Svinov (47.884 mil gross tons)

COMPETE Annex 3 13 Czech Republic - 199 -
13.2.3 Future development and policy plans
Main reasons of the train delay:
Planned traffic closure – infrastructure modernisation, reconstruction, maintenance
Unplanned traffic closure – defects on the railway infrastructure, defects on the rail
vehicles, organisational defects, traffic accidents, etc.
Traffic accident statistic:
2003 88 accidents 224 dead
2004 67 accidents 233 dead
According to SZDC (Railway Infrastructure Administration – state owned organisation) the
future policy priority lies in modernization of four transit corridors.
CD (Czech Railways): Interoperability of the railway shippers in the EU framework (INTERFACE
Project)
EC DG TREN Enlargement and European Union Transport Policy:
Priority projects declared to be of European interest:
Railway line Gdansk-Warszawa-Brno / Bratislava-Wien (2010-2015)
Railway line Athina-Sofia-Budapest-Wien-Praha-Nürnberg/Dresden (between 2010 –
2015)
ISPA
Railway-track renovation Zabori – Prelouc (18.5 km, 31 mil. EUR)
13.2.4 Additional information – institutions
Ceske drahy, a.s. CD (Czech Railways)
Czech Railways, joint stock company was established on 1 January 2003 as one of the suc-
cessive companies following Czech Railways, state organization. Czech Railways, joint stock
company belongs to the largest companies in the Czech Republic and continues a more than
160 years tradition of railway transport on the territory of Bohemia, Moravia and Silesia. It is
a significant company in an international railway transport.
Vyzkumny ustav zeleznicni VUZ (The Railway Research Institute)
The Railway Research Institute (VÚŽ) was founded in 1972, when it took over the already 50
years old tradition of former research, development and testing facilities in the field of rail-
way. Today, VÚŽ is a member of the Czech Railways, stock company.
Activities include research, development and testing in the field of railway technology, as well
as small series manufacture of special devices and equipment, resulting from its own research
and development.
As the part of its research activities, VÚŽ accomplishes technical and economical studies, car-
ries out applied research directly linked to implementation, defines requirements and devel-
ops new apparatuses, produces structural documentation including technical drawings,

- 200 - 13 Czech Republic COMPETE Annex 3
evaluates and approves apparatuses developed elsewhere before their take-over by the
Czech Railways, is active in the field of standardisation, etc. All these activities are focused
especially upon railway vehicles, railway track construction and mechanisation, railway tele-
communication and signalling technology as well as materials and structures.
13.3 Waterborne transport
Not considered so far.
13.4 Aviation
13.4.1 Measurement of delay and traffic condition data
CSL, Airport Prague Input data for congestion modelling and capacity planning (attendance curve):
Check in - number of passengers
Security check - number of passengers
Average number of luggage per passenger
Slot requests, ground time
Modelling output data have been used for investment plan and as base for new terminal
project.
Measuring is not collected for freight – small volume, sufficient capacity
LP (Aiport Prague): Measures evaluation annually for peak month (August).
Airport Prague: Analysis of 15 min. intervals in peak week. Output: peak capacity needs – check in, security check, luggage processing capacity, slot
capacity, runway capacity etc.
Publication: LP (Airport Prague): Publication by Annual Report 2004
(see file LP_Annual_Report_2004.zip).
Slot Coordination Prague: www.slot-czech.cz Runway Movement Statistics (UTC
Time) see file prague_utc_summer.zip and prague_utc_winter.zip
13.4.2 Evaluation and results
Transfer into congestion measures by a Capacity model: Collected data (see 1) are processed in IATA Total Airport SIM, Module Terminal. Delays and traffic problems are collected and processed using IATA Standards.
Key results LP (Airport Prague)
Capacity assessment
Plan / Reality comparing
Projection validation

COMPETE Annex 3 13 Czech Republic - 201 -
Main bottlenecks have been runway capacity and security check-in. The problem was solved
13.4.3 Forecasts and policy measures
LP Praha (Airport Prague): The number of passengers cleared at Prague Airport rose by
29.9%. At European Airports of the same category (5–10 million passengers) it increased by
5.6%. It is the highest increase in performance in the airport’s history and it is expected this
number to exceed 11 million.
Table 13-8:Praha-Ruzyně Airport (number of passengers)
Year 2002 2003 2004 Number of passengers 6 314 653 7 463 120 9 696 413
Gradual opening of the new terminal will be the most important event in the future period.
On 1 August 2005, first part of the new Terminal North 2 was opened: specifically, the Pier C
with ten new jet-ways to the aircraft. The capacity of the runway system will be expanded by
at least two aircraft movements per hour following the construction of two new fast exits
from runway and alteration of taxiways C and G. The hour capacity of the main runway will
also be increased from the current 35 to 37 aircraft movements, especially as a result of fast
taxi outs, complemented taxiway system, and adapted procedures.
The European Commission’s proposal for a single European sky is a reform the outdated ar-
chitecture of European air traffic control.
13.4.4 Additional information – institutions
Letiste Praha LP (Airport Prague) The Czech Republic owns the Airport
Prague - Ruzyne Airport, 160 08 Prague 6
Prague - Ruzyne Airport (Prague International Airport) is the public, civil Airport for domestic
and international air traffic and scheduled and unscheduled air transport. Customs and pass-
ports check in and if necessary the health check in is also provided at the Airport. The air traf-
fic is controlled in accordance with Praha - Ruzyne International Airport (PIA) is a fully co-
ordinated airport. Therefore for all flights of aircraft exceeding maximal take-off weight
(MTOW) 5 700 kg the airport slots for arrival and departure shall be requested from the air-
port coordinator - Slot Coordination Prague
The Central Authority of State Administration In Affairs of Civil Aviation:
Ministry of Transport of the Czech Republic - The Civil Aviation Department
Administrative Authority for Execution of State Administration in Affairs of Civil Aviation:
Civil Aviation Authority
Prague Ruzyne - Airport, 160 08 Prague 6
Slot Coordination Prague
Airport Praha Ruzyne , P.O.Box 67, Aviatická 12, 160 08 Prague 6

- 202 - 13 Czech Republic COMPETE Annex 3
The Slot Coordination Prague is a body responsible for allocation of the airport slots at Air-
port Prague Ruzyne – Level 3 – coordinated airport. Slot Coordination Prague is delegated to
achieve of Coordination function according to decision of the Ministry of Transport of the
Czech Republic, Civil Aviation department, in accordance with the paragraph No.32, part 1
and 2 of Law No. 49/1997, about Civil Aviation and in accordance with Law No. 455/1991.
13.5 Urban transport – the case of Prague
13.5.1 Measurement of traffic conditions
UDI Praha: The basic tool to measure traffic level used by the Institute of Transportation En-
gineering of the City of Prague (UDI Praha) is the Vehicle Kilometres Travelled (VKT) indicator.
The VKT is supervised by an in-house database software IDIS, that is Information Traffic Engi-
neering System. In addition, a cordon survey monitors the traffic trends in the city. There are
two cordons, one around the downtown area and the other for the outer-urban area, which
store the traffic flow of the city.
UDI Praha is tackling congestions both from the points of view of traffic operation manage-
ment and traffic organisation. For speed and travel time measurement in traffic congestion is
used floating car measurement method and for purposes of traffic lights management is pur-
sued traffic research on critical localities, where is detected number of vehicles in individual
stop cycles at traffic lights. For detection of traffic density are used from the traffic research
or pertinently abstracts from light controller register or from traffic central.
There is made use of TV control in Traffic Management Centre (HDRU) for congestion detec-
tion in Prague. Some of traffic lights have got also distant detector equipment for detecting
situation before traffic lights. Lately HDRU receives also telephone calls on traffic problems
from car-clubs dispatching. Generally traffic congestions are daily event in Prague. The reason
is high density of individual transport that demands run over the capacity of today road net-
work.
Measures evaluation annually – see file Prague_2004.doc
The congestion peaks appear between 8 and 9 in the morning and between 4 and 5 in the
afternoon. However, the difference of car traffic between peaks and valleys is less and less
significant because the limit of road capacity has already been reached on peak hours and
traffic flow tends to spread on off-peak periods. Workday volume variations in motor vehicles
traffic show the following characteristics:
The bulk of the daily traffic volume is carried out during daylight, 75 % from 6 a.m. to
6 p.m., or 80 % from 6 a.m. to 7 p.m., while the period from 6 a.m. to 10 p.m. cov-
ers about 91 %.
Following 5 p.m., the traffic volume displays a steep and largely linear drop till mid-
night.
The morning peak hour comes at 7-9 a.m., the afternoon peak hour is between 4-5
p.m. · The peak hour's share is 6.9 % (100 % = 0-24 h).

COMPETE Annex 3 13 Czech Republic - 203 -
The differences between peak hour share and off-peak share are not very sharp.
Daily traffic density variation in lorries and buses (excluding public transportation) dis-
plays a different characteristic from the overall profile. Their peak hour is 10-11 a.m.,
making 8.8 % of the all-day goods vehicle and bus volumes. Following 11 a.m. there
comes a mild and more or less regular decrease without any sag or next peak until
midnight.
Consequently, the share of lorries and buses in the traffic flow changes significantly
during the day: - the all-day average is 9 % - it rises up to 16 % in the morning
- it descends to 7 % in the afternoon
During weekends and on holidays, congestion appears on highways with peaks on Fri-
day between 3 and 7 p.m., Saturday between 8 a.m. and 11 a.m. and on Sundays
between 2 and 10 p.m. But, like for inner cities, the difference between peak and
off-peak turns out to be roughly negligible. This leads to new problems: since there is
no off-peak period available for roadwork, congestion problems become even
stronger.
Daily, weekly, annually variation – see file Prague_2004.doc
Urban traffic data is published by a number of institutions:
DI Praha (Institute of Transportation Engineering of the City of Prague):
www.udipraha.cz.
The yearbook of transportation Prague 2004 (see file PRAQUE_2004.doc)
TSK Praha (Roads Technical Administration): www.doprava-praha.cz
o Traffic level map
o Traffic level table
o Live traffic web-cameras
o Traffic restrictions
o Parking places (P+R)
Mapy (Map): www.mapy.cz - Dopravni informace – Provoz v Praze (Czech language
only)
Prague
o Traffic level map
o Traffic level table
o Traffic restrictions

- 204 - 13 Czech Republic COMPETE Annex 3
13.5.2 Evaluation and Results
There are no direct congestion studies performed for the city of Prague.
HDRU (Traffic Management Centre): Current traffic flow intensity (on-line traffic web-
cameras) is transformed to the current traffic level (1-5) and published via Internet (table and
map), GSM, broadcast.
UDI (Institute of Transportation Engineering of the City of Prague) characterises the traffic situation in Czech urban areas as follows:
In major cities, traffic jams can be found in the inner city, on critical roads, during the daylight. In Prague, 75% of traffic volumes are carried out between 6 a.m. and 6 p.m. This congestion causes delays, which reach 30 to 35 min in every 10 km trav-elled along the city.
Congestion is overall visible in inner cities. However, we can observe the same phe-nomenon: car traffic is stagnating in the centre but always growing in the suburbs as the road capacity has already been exceeded in the centre. In Prague, there has been an increase of 3.5% in car traffic in 2002, mainly due to outer-urban area traffic.
The conducted traffic counts lead to a conclusion that the car traffic in the city centre stagnated in 2004, while continuing to rise over the rest of the city area. The total traffic throughout the capital rose in 2004, in terms of its overall road network vehicle kilometres travelled (VKT), by an average of 4.9 per cent above the previous year. Mo-tor vehicles covered the total of 19.691 million vehicle-kilometres throughout the Prague area around the clock on an average workday (the condition in autumn of 2004). The passenger cars' share was 17.815 million vehicle kilometres, i.e. 91 per cent. Comparing with the previous year, it means that in autumn of 2004, motor cars covered in Prague daily by 920 thousand vehicle-kilometres more than in 2003.
A specific phenomenon of the traffic development in 2004 is a sharp rise in heavy lor-
ries traffic. While from 1990 to 2000 the heavy lorries traffic (over 6 tons in gross
weight) on the territory of the Capital of Prague almost stagnated (it grew by an av-
erage of 0.5 % a year) and during 2001-2003 it rose by an annual average of 5.4 %,
in 2004 it was by 18 % (an annual rise in traffic volumes by 127 thousand vehicle-
kilometres a day). This jump was brought about by the rise in numbers of heavy lor-
ries (international transport) crossing Prague since May 2004 when the Czech Repub-
lic acceded the European Union and customs procedures on the border crossings
were dropped.
In the greater central area of the city (according to counts on the central cordon, cov-
ering the bi-directional traffic over entry points to the greater inner city between
Petřín Hill on the west, Letná Hill on the north, Rieger Park on the east and Vyšehrad
Castle on the South), the car traffic volume was roughly the same as compared to
2003. In 2004, about 294,000 vehicles entered the greater inner city area during an
average workday between 6 a.m. and 10 p.m., including 279,000 passenger cars.
The fact that the traffic volumes in the inner city area in recent 6 years have ceased to
grow seems to be due to traffic demands already reaching its capacity limits on many
key crossroads during peak hours so that the road network overload is no more local,
but rather sweeping in character.

COMPETE Annex 3 13 Czech Republic - 205 -
In the middle zone of the city, the car traffic volume increased by 3 to 10 % over the
previous year. Since 1990, the traffic has been sharply and continually increasing. As
compared to 1990, it intensified three to four times on some city roads.
In the outer zone of the city (according to counts on the outer cordon, covering the bi-
directional car traffic over points where main trunk roads and motorways enter the
densely populated urban area), the volume of car traffic grew by 2.3 % over the pre-
vious year. As compared to 1990, more than 3.2 times as many cars (+ 216 %) en-
tered Prague each day from its environs (the suburban area, the country and other
communities as well as from abroad). The major portion of the increase following
1990 was passenger cars, whose number has now increased almost four times (+ 278
%). The car traffic in the outer zone of the city is rising steadily from 1990. About
221,000 vehicles entered Prague between 6 a.m. and 10 p.m. on an average work-
day of 2004, including 191,000 passenger cars.
Overloaded parts of infrastructure 2004:
South bypass - sector 5. kvetna - Videnska 133 000 vehicles per day (0-24 h)
Barrande Bridge (125 000 vehicles per day)
South bypass - sector Chodovska - V Korytech (107 000 vehicles per day)
South bypass - sector Videnska - Modranska (103 000 vehicles per day)
Motorway D1 - sector Chodovec - Chodov (102 000 vehicles per day)
Strakonicka - sector Zlichov – Barrande Bridge (96 000 vehicles per day)
Overloaded flyovers 2004:
5. kvetna – South bypass (215 000 vehicles per day)
South bypass - Videnska (167 000 vehicles per day)
Strakonická – Barrande Bridge (167 000 vehicles per day)
South bypass - Chodovska (152 000 vehicles per day)
South bypass - Sulicka (133 000 vehicles per day)
Bulhar (122 000 vehicles per day)
Overloaded crossroads 2004:
Zitna - Mezibranska (74 000 vehicles per day)
Anglicka - Legerova (73 000 vehicles per day)
Argentinska - Jatecni (69 000 vehicles per day)
Podebradska - Kbelska (68 000 vehicles per day)
Argentinska - Plynarni (67 000 vehicles per day)
Belohorska - Ankarska (Vypich) (67 000 vehicles per day)

- 206 - 13 Czech Republic COMPETE Annex 3
13.5.3 Forecasts and policy plans
Congestion becomes more frequent and always larger and longer. This phenomenon has
disastrous impacts on environment. In Prague, cars are the first source of pollution.
Future trends in Prague can be defined as of on traffic flow dependent device using on both
crossings and traffic areas levels, providing traffic information (VMS, broadcast, Internet, mo-
bile-phone) and data on travel time and offering alternative transport mode for time saving
(P+R etc.). Using dynamic navigation with support of RDS TMC in near future is expected.
In the Prague vicinity, the construction of another part of the Prague ring-road is about to
start in the southwest of the city, in the direction of Slivenec, Lahovice and Vestec, according
to the Road and Motorway Directorate.
The construction of the Prague ring-road is supported by EC investment programmes.
13.5.4 Additional information – institutions of Prague
Technicka sprava komunikaci hlavniho mesta Prahy TSK (Technical Administration of
Roads of the City of Prague)
Štefánikova 23, 150 00 Praha 5
Infrastructure maintenance operator
Traffic information provider
Ustav dopravniho inzenyrstvi hlavniho mesta Prahy UDI Praha (Institute of Transporta-
tion Engineering of the City of Prague)
Bolzanova 1, 110 00 Praha 1
Institute of Transportation Engineering of the City of Prague (UDI Praha) is the specialized
organisation, the first in Czech Republic of its kind, established in 1966. UDI Praha concerns
with engineering, design and consulting activities in the field of city transportation and traffic
engineering, especially for the City of Prague, but for other Prague and non-Prague custom-
ers too.
There are the main professional activities of UDI Praha:
Processing of all kinds of transportation and traffic engineering documentation
Solution of transport and traffic part of city planning
Setting of transportation engineering conditions and materials for planning and pro-
ject documentation of construction works
Proposals for coordinated development of city transportation system and solution of
integrated public transport system
Processing of traffic surveys, investigation and analyses
Creation, operation and up-to-dating of transportation engineering data bank system
Proposals for improvement of traffic conditions
Design of traffic organisation on street network

COMPETE Annex 3 13 Czech Republic - 207 -
Projection of traffic calming, designing of so called residential street and pedestrian
zones
Regulation and restrictive measures for motor car traffic and proposals for parking pol-
icy
Design of traffic signal devices, coordinated control, centralized control and public
transport priority on traffic signals
Evolution of traffic conditions, transportation constructions and measures from the en-
vironmental point of view
13.5.5 Description of the Current State of Affairs and Outlook in the Area of Transport
The data on transport are annually published in the Transport Yearbook published by the
Transport Research Center in Brno; individual data are contained in the Statistical Yearbook
of the Czech Republic and in regional yearbooks. Monitoring is aimed at performance values
related to the individual types of transport and the state of the transport infrastructure and
the scope of its maintenance, modernization and construction.
The description of the transport sector also contains strategic and program documents cre-
ated for pre-accession procedures. The current trends are described in a SWOT analysis,
which constitutes the basis for determining the goals in the transport sector of the Infrastruc-
ture Operational Program (it was adopted from that Program):
Strengths Weaknesses
Railway transport
Good interconnection of the majority of main routes of the Czech Railways network with the networks of neighboring countries.
Unsuitable technical state of part of the national railways and regional routes.
Ongoing reconstruction of railway corridors. Much lower average track speed of railway vehi-cles compared to the European standard.
A relatively high contribution of freight railway trans-port to the carriage market of CR compared to Western Europe.
A marked decrease in volumes of freight railway transport within the Czech Republic.
Arrangement of railway infrastructure allowing for large transport capacities to the centers of cities. Low quality of suburban railway transport.
Low accident rate in railway transport compared to road transport.
Absence of interconnection of some border rail-way systems with neighboring countries.
Obsolete passenger areas at railway stations.
Technically obsolete railway junctions.
Road transport
The East-West motorway interconnection (Rozva-dov-/Plzeň/-Prague-Brno-Lanžhot).
Missing sections of motorways and high-speed highways; missing high-quality and high-capacity interconnection of certain regions (Zlín, Moravia and Silesia, Southern Bohemia, Karlovy Vary, Pardubice and Hradec Králové) and motorway interconnection of cohesion regions North-East – Central Moravia – Moravia and Silesia.

- 208 - 13 Czech Republic COMPETE Annex 3
Predominantly satisfactory network of 1st class highways.
Frequent transport difficulties on two-lane 1st class highways due to safety defects and their inadequate capacity. Absence of highway by-passes around a number of large cities.
Inadequate capacity of the connection of certain border crossings to highways.
Absence of a comprehensive system for weighing trucks.
Water transport
Existing network of ports for inland water transport. Inadequate navigation depth at the lower Elbe.
Air transport
Prague – Ruzyně international airport. Absence of railway connection to the Prague – Ruzyně airport.
Obsolete passenger areas in airports outside Prague (in particular Pardubice, Brno, Karlovy Vary and Ostrava).
Combined transport
A slight increase in the volumes of long-distance combined transport (combination of railway and road transport).
Inadequate development of combined transport and logistic systems.
Transport in general
High density of railway and highway transport net-work; railway network system.
Passenger and freight transport switching from rail and water transport to roads.
Public transport systems in cities with a large share of transport volumes.
Inadequate development of qualitative parame-ters of the railway infrastructure compared to the road infrastructure on transport routes of interna-tional and national importance.
Ongoing introduction of interval transport within in-tegrated transport systems in large cities.
Low level of development of integrated transport systems.
Excessive emissions and noise from transport in cities and municipalities.
Low volume of investment in view of the bad state of transport networks.
Absence of an accurate methodology for financial valuation of environmental burdens from trans-port.
High demands on non-renewable resources.
Low rate of use of alternative fuels.

COMPETE Annex 3 13 Czech Republic - 209 -
Risks Opportunities / Favorable expectations
Railway transport
. Concept for the development of the railway infra-structure
. Transformation of Czech Railways
. Available capacity of the railway network
Road transport
Excessive growth of inland and transit road transport. Concept of motorways and four-lane highways for motor vehicles, which allows for targeted develop-ment.
Water transport
. Improvement of the Elbe waterway; better use of
the connection to the European network of water-ways.
Air transport
Rapid development of medium-distance air transport at the expense of railway transport at the European level (500-700 km).
Combined transport
Expiry of the Ro – La system after completion of the D8 motorway.
Development of new technologies connected with combined transport and logistic systems.
Utilization of the effect of concentration of trans-port streams between logistic centers to increase the proportion of environmentally sound types of transport.
Transport in general
Inadequate funds for implementation of the relevant concepts in transport network development.
Favorable location of the country on the North – South and East – West axes as an important lo-calizing factor for inflow of foreign investments.
A decrease in railway and water transport, including a decrease in the scope of railway transport.
Passage of trans-European corridors IV. and VI. B through the Czech Republic.
Inadequate capacity of transport routes in the vicinity of large agglomerations.
Harmonization of the conditions for access of indi-vidual types of transport to the transport market.
Effect of the external environment on the implementa-tion of infrastructure plans in the Czech Republic (temporally uncoordinated progress of work within investment activities related to transport infrastructure development in neighboring countries).
Completion of the system of transport routes con-nected to the European transport network.
Inadequate conditions for harmonization of the trans-port market (legislative, economic and technical con-ditions).
Use of superior infrastructure for long-distance transport between cities and important regional centers and for service in regions.
Greater use of information technology in trans-port.
Potential for reduction of unfavorable environ-mental impact of transport
Intelligent transport systems.
Potential for utilization of alternative fuels.
Use of renewable energy sources.

- 210 - 13 Czech Republic COMPETE Annex 3
The main strengths of the transport sector are:
the high density of the rail and road transport networks; the railway network system,
ongoing reconstruction of railway corridors,
existing network of ports for inland water transport,
Prague – Ruzyne international airport,
a slight increase in the volumes of long-distance combined, transport (combination of
rail and road transport).

COMPETE Annex 3 14 Hungary - 211 -
14 Hungary
14.1 Introduction
The country review on traffic congestion in Hungary was prepared by the Institute for Trans-
port Sciences, Budapest, by the following individuals:
Gábor ALBERT (Roads) (+36 1) 371-5801
Dr. János BERÉNYI (Public transport)
Dr. Ernő PÁL (Waterborne, aviation)
14.2 Inter-urban roads
14.2.1 Measurement of traffic conditions
There are more than 4800 automatic traffic counting posts on the national road network,
52% on rural and 48% on built-up sections. There are monitoring posts with every-year
counting. On the remaining ones the counting returns to the same post in every fifth year, in
a rolling system, every year on one fifth of these posts there are periodic traffic counts, in
some cases only 2-3 days per year, on some other ones one week per month. On the other
ones the traffic data are calculated according to the courses on the neighbouring counting
posts.
These data are aggregated in some databases, in the central offices of the different road op-
erators. After processing the data, AADT are provided for the different sections of the na-
tional road network, besides general data for 12 single and aggregated vehicle categories, as
well as average data by road categories for the different counties of Hungary. These data are
pub-lished annually.
The attachment file “Monitoring.zip” contains typical pages about the published results of
the collected and processed data of the monitoring posts. There are sample pages on traffic
count data, seasonal data, peak hour data and diagrams, traffic of foreign vehicles and traffic
volume development. In the “Counting.zip” file there are sample pages on traffic count data
(for short key see key.doc), aggregated data by road and traffic volume categories. These
documents are available: http://web.kozut.hu/index.php?id=135 .
Figure 14-1 gives an expample of the traffic development at M1 near Budapest during the
last decade. The document referred to provides much more detailed data.

- 212 - 14 Hungary COMPETE Annex 3
Source: http://web.kozut.hu/index.php?id=135
Figure 14-1: Example peak hour traffic M1 Budapest 1995 - 2005
14.2.2 Current condition
There is no exact definition on congestion, but there are two traffic volumes per lane defined
for the typical cross-sections of toad categories: suitable and acceptable traffic volumes
(pcu/hour), which are similar to service levels.
The most congested sections are in the agglomerations of the largest cities (e.g. the capital
Budapest) especially the in leading sections, and the ring express-road M0 around Budapest.
There are seasonal congestions in the holiday areas, e.g. on the M7 motorway between Bu-
dapest and the lake of Balaton (the most popular summer holiday resort in Hungary) and also
on the main roads around the lake, as well as in the Danube-bend – certainly in the summer-
time only. There is almost everyday congestion on the M3 motorway, on the ingoing section
to Budapest.
There are also congested periods on the bridges of the Danube and on the connecting roads
too. Some border crossing stations are also congested, the situation is dependent on the sea-
son as well. Since 2004 the North-South main road close to the Austrian border is congested
too, mainly by heavy vehicles, probably partly because of the diverted traffic from the parallel
toll motorway in Austria.
The other parts of the road network are generally congestion-free, especially the second-rank
main roads and the lower-rank roads.
The main reasons for congestion are: the rapidly increasing motorisation-level, the lack of an
efficient suburban railway connection to the cities, the low capacity and the incompletion of
M0 around Budapest, the low number of bridges on the Danube, and sometimes the incom-
plete connecting roads to them.
There are studies on the economic impact of congestion, general and special ones too
14.2.3 Forecasts and drivers of congestion
For the national roads there are forecasts, updated in every five years generally. The last one
has been developed in year 2000, the newest is in progress. This projective traffic forecast is
valid for the average road network (for areas with changing structure other methods are
needed). The figures are given for the whole network (for large-scale network analysis see

COMPETE Annex 3 14 Hungary - 213 -
below) and also to the different regions. The main drivers of the development are the esti-
mated values of GDP growth, decreasing population, employment and unemployment, age-
distribution of population, fuel price.
In the first edition the factors were given by figures (see below and in Fig.zip, attached), later
in the slightly updated second edition the factors were given as functions of the study year
(see attachment Func.zip).
Table 14-1: Projected traffic volumes on high speed roads until 2030 (1997=100)
Year Cars Busses Lories Motorcycles Heavy ve-
hicles 1997 1,00 1,00 1,00 1,00 1,00 2000 1,12 1,02 1,07 1,03 1,06 2005 1,23 1,05 1,16 1,07 1,15 2010 1,41 1,13 1,31 1,10 1,29 2015 1,58 1,20 1,50 1,17 1,48 2020 1,76 1,28 1,70 1,25 1,68 2025 1,97 1,38 1,96 1,30 1,93 2030 2,18 1,50 2,18 1,35 2,11
Looking at the figures it is clear that the congestion situation will not be better in the coming
years, unless significant measurements are taken.
14.2.4 Policy plans
Intensive high-speed road network development (expressways and motorways, Gov. res.:
2044/2003 (III. 14.) and Act CXXVIII./2003 (XII. 22.)), bridge and connecting road network
development. Building of by-pass roads lightening congested settlement-crossing sections,
completing M0 ring motorway.
The national transport policy aims to reduce the pace of the increasing of the split of road
transport
14.3 Urban roads
14.3.1 Measurement of traffic conditions
On urban roads there are no such extended traffic counts as on the national road network.
However in the bigger towns there are some automatic traffic counting port, providing de-
tailed traffic data (e.g. in Budapest, 28 cross sections, see example in Figure 14-2. These are
installed on the most important sections of the network: bridges, main arterials, ring roads,
etc. These basic data, and also the derived ones are available for local network development
plans, strategies, decision preparing purposes,

- 214 - 14 Hungary COMPETE Annex 3
Figure 14-2: Example results of Budapest traffic counts
Collected are also traffic sensors in the main junction areas, mainly for traffic management
pur-poses. These are not able to classify vehicles; therefore these data (generally also col-
lected in the traffic control centre) are not used for planning purposes.
Further available are also accidental traffic measurements, in connection with special projects.
In opti-mum case these are before-after surveys.
14.3.2 Current situation
In the largest cities (especially in Budapest) the whole road network of the downtown is con-
gested from early morning until late afternoon in the September – mid June period. The most
congested sections are the incoming ones, in particular at the first signalised junctions. There
are also regular congestions at junctions of main network elements, and the first junction of
harmonised routes. There are also frequent congestions on the roads leading to attractive
locations: shopping centres, etc.
In other towns only the main roads and the area of some attractive points are congested
peri-odically. Smaller settlements, outskirts, also the larger cities in the summer holiday sea-
son are regu-larly congestion free.
The main reasons of congestion are: the quickly increasing motorisation level, the low com-
petitiveness of public transport, the very few P+R car parks, the low level of the parking sys-

COMPETE Annex 3 14 Hungary - 215 -
tem, the insufficient capacity of the connecting network element to bridges and to the most
attractive points.
14.3.3 Forecasts
On urban road network it is more difficult to give a general forecast for traffic growth. In
most of the cases the forecasts are developed for special projects, for a specified area, with
sophis-ticated, and very detailed methods. These take into consideration the national and
regional courses too, as well as the local structural changes. In these cases it is also possible
to take into account the local congestion management expectations. These are more signifi-
cant in the future congestion situation then the national courses.
14.3.4 Policy plans
There is very limited possibility to reduce congestion by investment of new capacity. The pre-
sent policy is to reduce traffic need by: demand management, improve capacity and service
level of public transport, application of ITS elements e.g. driver information systems. In sev-
eral cases not only traffic safety, but also junction capacity is improved by application of new
roundabouts instead of signalised junctions.
14.4 Urban public transport
14.4.1 Measurement of traffic conditions
Periodic measures on the urban lines, o/d traffic surveys, journey measures of the public
transport vehicles, ticket and season ticket sales statistics.
In consequence of the open system there is no direct journey statistics, it will be changed in
the close future with implementing electronic fare collection by some of the service providers,
including Budapest, in the close future.
The data are very important; not only for market observation, but journey statistics are the
basis of subsidies for the operator. Therefore these data are needed minimum annually. O/D
surveys are made occasionally.
In case of BKV (Budapest Transport Limited):
Scheduled passenger counting
Instrumental measurements
On busses and trolleybuses, one week per year per line in spring or autumn. Pressure
sen-sors give the number of people on the vehicle between stops; the number of
boarding and alighting passengers is estimated, based on the waiting time at stops,
the vehicle load and type.
The resulted tables contain the number of passengers and vehicle capacity utilisation
for dif-ferent day-types (Monday – Thursday, Friday, weekend) for the whole opera-
tion time, divided to quarter-hours.
Passenger counting by observations:
There are scheduled annual manual counting on the relevant cross-section of the HEV (sub-
urban railway), metro and tram lines. In every five years the number of boarding and alight-

- 216 - 14 Hungary COMPETE Annex 3
ing passengers is reported in all the stops of the metro and HEV. These data are also available
for 15 minutes units.
O/D surveys
Carried out for the whole network in every 5..10 years to create travel data between stations
and stops, to learn traveller’s behaviour, satisfaction and opinion, as well as the main drivers
of personal decisions. The last survey has been completed in year 2004.
Accidental surveys
There are accidental counts and surveys in connection with irregular occasions (metro substi-
tution by bus, implementation of new line, etc.), or interviews on the affected lines.
Measurements of other traffic parameters
As by-product of automated measurements travel time, speed, stopping time are also col-
lected, and utilised for timetable-construction. There are periodical travel time measurements
for controlling purposes on rail-operated systems.
14.4.2 Current situation
Urban public transport (Bus, tram, metro, etc.):
In the daytime on the main radial and ringroads and in the downtown of the larger cities
there is frequent congestion on busses, especially in the morning peak hours. The cause is
the law capacity and few bus lanes.
In case of Budapest also the downtown tram lines No. 4 and 6 are congested in the very long
peak period, and some other radial ones in the morning peak. Budapest metro is congested
too, because of the low density of the metro network, and the insufficient layout of the old
stations.
There are estimations only, on the economic impact of congestion, since there are no exact
journey data.
In case of BKV
Congestion or traffic disturbance: when vehicles of one or more lines significantly exceed
travel time given in the timetable. It is typical to surface transport (bus, trolleybus, tram). The
main reason of congestion is traffic jam on the roads, which can affect the traffic of closed-
track vehicles in the junctions, too. By rail bound traffic congestion may occur for technologi-
cal reasons (mainly in termini), which have to be solved by company measures.
Congestion increase travel time, which need more vehicles to keep the scheduled frequency,
causing significant growth of operating costs. Before implementing measures (changing
time-table, bus-lane marking, etc.) examinations are made, including economic points of
view.
14.4.3 Forecasts
The demand is increasing, because the growing mobility cannot be satisfied by the limited capacity of individual transport. On the other hand there is a continuous effort on improving

COMPETE Annex 3 14 Hungary - 217 -
public transport, which is heavily supported by the society. The only problem is the cost, which is very high in case of large-capacity up-to-date systems.
In the last decade the split of public transport in urban passenger traffic was declined. It was resulted by the decreasing quality of the public transport services, and the increasing quality of cars. This latter course is stopped, and in the same time the municipalities recognised that there is no alternative of a high-level public transport in a sustainable transport development of cities.
Summing up the different effects, a stagnation of the congestion situation can be estimated
in the longer run.
In case of BKV, the frequency and the range of congestion are growing today. The main
general reasons are:
Increasing mobility,
increasing motorisation level,
decreasing modal-split of public transport
increasing number of accidents.
14.4.4 Policy plans
Urban public transport (Bus, tram, metro, etc.):
Development of tram lines, new bus lanes, building new metro lines (in Budapest only), the preference of surface public transport vehicles in complex city transport control system, appli-cation of new e-technology, telematics, successful travel demand management.
Transport association for journey and tariff for the transport operators and authorities, new financing scheme for the development of public transport, implementation of electronic fare collection and new tariff system, development of P+R. In these topics the standpoints of the different parties (operators, travellers, authorities, stakeholder groups) are close to each other’s, and to those are written in the accepted national transport policy.
In case of BKV: In the development plans rail bound traffic (metro, tram, HEV) have the prior-
ity. In surface traffic public transport vehicles are separated from traffic disturbances with
bus lane road markings,
special roads for buses only,
opposit direction bus traffic in one-way roads (exception of access control),
priority in intersections,
exempting from turning prohibition,
special bus station design (e.g. positive bay).
The development plans of BKV are heavily dependant on the town development conceptions of the different Districts. At present, among others, the 2nd National Development Plan, the Podmaniczky Program, and the topics supported by the EU, specify these development direc-tions.
Recommendations for public transport priority are continuously carried out and initiated by the municipality and by the responsible authorities.

- 218 - 14 Hungary COMPETE Annex 3
14.5 Waterborne transport
14.5.1 Measurement of traffic conditions
There is inland navigation on river Duna (Danube), Tisza, short sections of some other rivers
(e.g. Bodrog, Körös). Danube is the EU Corr. VII, the data below refer to the Hungarian sec-
tion of it.
Measured values: river ferries: return trip per day, return trip per hour,
on the waterway: ship per year, ship per day,
ports: activity ton per year, ton per day
Purpose: market survey, demand for capacity development
14.5.2 Current situation
The utilisation of capacity is low both in waterways and in ports. The fenny traffic does not
hinder river navigation.
14.5.3 Forecasts and plicy plans
The capacity of inland navigation exceeds the demand, the Danube as the EU Corridor VII.
utilised only 10% in the Hungarian section. Consequently, there is no congestion in the
inland navigation, however (loading) technology development is needed for providing quality
and environment-friendly service.
14.6 Aviation
14.6.1 Measurement of traffic conditions
There is only one international airport in Hungary: Budapest Ferihegy. The data below refer to it. Measured values: passenger/year, passenger per day; landing per day, landing per hour (on the airport)
Capacity survey: in Ferihegy Budapest airport the demand is more then 10 million passenger per year, and increasing intensively.
Planned investment: Improvement of capacity from 12 to 16 million passenger per year,
Cargo basis development: planned investment: thousand tons per year extension.
On the regional airports there are no capacity problems.
14.6.2 Current situation
Budapest Airport works close to the limitation of capacity. The investment of Terminal Feri-hegy II. C. with 4 million passengers per year has to be started.
14.6.3 Forecasts and policy plans
The traffic of the Budapest Airport may increase rapidly by the improving split of the low cost airlines (about 20% per year), therefore improvement of capacity is needed. A new passen-ger terminal (4 million pass. per year) will be built, and the cargo terminal will be extended.

COMPETE Annex 3 15 Sweden - 219 -
15 Sweden
15.1 Contacts
Road Transport
Swedish Road Administration (SRA)
VTI - Swedish National Road and Transport Research Institute
Rail Transport
Bahnverket
Inland waterways, coastal and maritime shipping
Swedish Maritime Administration
15.2 Investments for Swedish transport system in general Investments For many years, annual investments in the infrastructure of the transport sector were rela-
tively even, although from the early 1990s investments began to rise. From 1990 to 1995,
the volume of investments, measured in current prices, doubled. In 2002, accumulated in-
vestments in the transport infrastructure totalled SEK 27.2 billion. The figures shown include
value-added tax, which means that there may be discrepancies with figures published else-
where. In recent years there has been an increase in investments in air traffic infrastructure as
a result of the expansion of Arlanda Airport. Adaptation to the Schengen agreement has also
led to the need for further investments in air traffic.
In 2002, road investments accounted for almost 56 per cent, and railway investments for 27
per cent of total investments. The large increase in road investment in recent years is ex-
plained by investments more than doubling in the local government sector since the mid-
1990s as well as by central government investments.
The category “Roads” in the following table includes central and local government invest-
ments and the investments made by private parties in roads that receive state subsidies.
“Railways” includes investments made primarily by the National Rail Administration. “Public
transport” chiefly comprises the investments made in connection with local and regional
public transport. The figures for “Ports” do not include the investments in fairways, etc.
made by the Swedish Maritime Administration.
The heading of “Support land trp” (land transport) includes the investments made in the
Öresund Link.
These investments are distributed between Sweden and Denmark based on the nationality of
the contractor. Investments for undertakings in the transport sector totalled SEK 25.1 billion
in 2002, which is almost six billion more than in 1996. The largest increase in investments
was by undertakings in the post and telecommunication sectors. In 2000 and 2001, ap-

- 220 - 15 Sweden COMPETE Annex 3
proximately SEK 30 billion was invested annually, which is partly explained by the investments
made for the third generation of mobile telephones (UMTS).28
Source: http://www.sika-institute.se/Doclib/Import/107/ars05en.pdf
Table 15-1: Investment in infrastructure facitities (SEK million, current prices)
Source:SIKA-Institut, Year book 2005, p. 94
(http://www.sika-institute.se/Doclib/Import/107/ars05en.pdf)
Table 15-2 shows a shoft of sectoral investments from road to rail between 1995 to 2002.
This indicates a development of demand towards scheduled services in the Swedish transport
sector.
28 SIKA-Institute, Year book 2005

COMPETE Annex 3 15 Sweden - 221 -
Table 15-2: Investments by sectors in current prices, SEK million
Source:SIKA-Institut, Year book 2005, p. 94
(http://www.sika-institute.se/Doclib/Import/107/ars05en.pdf)
Figure 15-1:
15.3 Motorways and trunk roads
15.3.1 The road network
The Swedish public road network consists of over 138 000 km of road. In addition, there are
75 000 km of private roads with central government grants and an extensive network of pri-
vate roads without government grants. The public road network accounts for the major part
of traffic performance. The state is responsible for the public road network in the countryside
and for the through traffic routes in builtup areas. The municipalities are responsible for local
road maintenance in built-up areas. The system of rules that applies to traffic on the public
road network has been decided upon by the Riksdag (Swedish Parliament) and the govern-
ment. Certain local traffic regulations have been decided upon by the municipalities.
The state road network consists of the following types of road:
National roads including European highways are numbered from 4 to 99. County roads that
cross county borders have unique road numbers from 101 to 499 and county roads are
numbered from 500 upwards within the respective county.
The national trunk road network has been designated by the Riksdag as the road network
that is of strategic importance for the continued prosperity of Sweden. This road network
includes all European highways and some national roads. Regional roads are included in the
road network that the National Road Administration considers as being of strategic impor-

- 222 - 15 Sweden COMPETE Annex 3
tance for the development of the respective region. Local roads are the roads that are neither
part of the national trunk road nor regional road network.29
Source: http://www.sika-institute.se/Doclib/Import/107/ars05en.pdf
Table 15-3: The Swedish public road network by length and traffic performance
Source:SIKA-Institut, Year book 2005, p. 19-20
(http://www.sika-institute.se/Doclib/Import/107/ars05en.pdf)
The international comparison of road lengths per million inhablitants in Table 15-3 30 shows
rather clearly that Sweden ranges at the top end in Europe concerning the availability of
roads. The length of state roads per inhabitant is roughly twice the EU average, while the
ratio is roughy four for provincial roads.
29 SIKA-Institute, Year book 2005
30 European Environment Agency

COMPETE Annex 3 15 Sweden - 223 -
Table 15-4: The length of infrastructure in EU-countries 1998, km per million inhabitants
Source:European Environment Agency
(http://themes.eea.europa.eu/Sectors_and_activities/transport/indicators/supply/TERM18,2001/Capacity_of_infrastr
ucture_networks__)_TERM_2001.pdf#search=%22congestion%20statistics%20Swedish%20motorways%22
15.3.2 National investments in the road network
The activities of the National Road Administration for 2003 accounted for SEK 22.7 billion, an
increase of over four per cent in comparison with 2002. The major part, 76 per cent, of the
activity is for road maintenance. Commissioned activities have accounted for over nine per
cent and have increased by 17 per cent in comparison with previous years.

- 224 - 15 Sweden COMPETE Annex 3
Table 15-5: Activities of the National Road Administration during the past three-year peri-od
Source:SIKA-Institue, Year book, p. 101
(http://www.sika-institute.se/Doclib/Import/107/ars05en.pdf)
15.3.3 Measurement of traffic conditions
Sweden uses a ITS system which helps to make the transport sysem more efficient. Its aim is
to increase accessibility, to improve road safety and to reduce environmental impact. There
are various types of ITS support available along main roads that offer support during a jour-
ney. A large number of sensors along the roads collects traffic data.
ITS uses along the roads Electronic Signs which indicate possible accidents, risk for queuing,
road surface, air temperature, warn motorists if wildlife is approaching (trial) and give variable
speed limits depending on the condition of the road, the number of cars on the road and
visibility. In cities they also help to find parking space by indicating how many parking spaces
are available in a specific part of town. A very efficient method to reduce speed is the auto-
matic speed surveillance. Seven of ten motorists approve of the system.
TMC (Traffic Message Channel)
Motorists can benefit of ITS while driving by receiving information via TMC in their cars.
The Swedish National Road Administration provides on their website current “Road and traf-
fic information” online.

COMPETE Annex 3 15 Sweden - 225 -
Source:Swedish Road Administration (SRA)
(http://trafikinfo2.vv.se/datexmap/map.aspx?Culture=en)
Figure 15-2: Road and Traffic information online
There have been TMC transmissions in Sweden since 1998 via the Swedish Broadcasting
Corporation P3 station’s RDS channel, a Radio Data System with a capacity of about 1200
baud. The signals are transmitted via Teracom’s programme control in the Kaknäs TV and
radio tower, and cover about 98 percent of Sweden by means of 55 radio masts and 260
slave masts. TMC messages are presented either as text, voice messages, or on a map. In
order to be able to receive TMC messages it is necessary to have a special receiver that can be
installed in the car radio or connected to a display presenting maps, text and symbols. In
Sweden the TMC covers the European highways, national highways and trunk roads.
Whether a certain TMC message shall be given precedence over other TMC messages de-
pends on its level of importance and how often it is to be transmitted. Although each indi-
vidual country decides how weather reports are to be transmitted via TMC, there is a com-
mon recommendation for Europe. The TMC service is free of charge and available around the
clock. About 4000 new messages per month is transmitted in Sweden today and it´s increas-
ing.
15.3.4 Current situation
It seams that there are no significant congestions on the national motorway except around
and in the cities like Gothenborg, Malmö and Stockholm.

- 226 - 15 Sweden COMPETE Annex 3
15.3.5 Policy plans and Forecasts
The development of the Trans-European Network (TEN) is one of the EU objectives for the
transport infrastructure. The European Council has prioritised a limited number of TEN trans-
port projects and the Nordic Triangle is one of these. The development of the Nordic Triangle
is in progress and further development is planned.
The Nordic Triangle is a multimodal transport corridor of major importance and an infrastruc-
ture project comprising different transport modes. It links the Nordic countries and their capi-
tal cities to each other and improves connections to central Europe and between the EU and
Russia.
In Sweden, the Nordic Triangle extends in the south from Malmö and the Öresund fixed link
for rail and road transport, which was completed in 2000, to the Swedish/Norwegian border,
and to Stockholm in the east.
The Nordic Triangle contains some of Sweden’s most important ports, such as Malmö, Trelle-
borg, Helsingborg, Gothenburg, Norrköping and Stockholm, and the major important air-
ports of Malmö-Sturup, Gothenburg-Landvetter and Stockholm-Arlanda. It continues from
Stockholm, via the archipelago and the Baltic Sea to Turku and Helsinki and further to the
Russian/Finnish border. The third side of the triangle runs from Stockholm to the Norwe-
gian/Swedish border in the direction of Oslo. The network comprises 1,600 kilometres of
road and 1,700 kilometres of railway line. Moreover, ports and airports and intermodal nodes
form important parts of this transport infrastructure.
The goal of the Nordic Triangle project is the creation of a highclass transport infrastructure
for goods/freight and passengers and for all transport modes in the region. The project shall
contribute to sustainable development through achieving a safer, more efficient and envi-
ronmentally-sound multimodal transport system.
The importance can be illustrated by the fact that nearly 80% of Sweden’s population and industry are located in the area served by the Nordic Triangle. One quarter of the
population of Finland lives in the area directly connected to the Nordic Triangle. Norway’s
capital Oslo, along with its neighbour counties Akershus and Östfold, has 25% of Norway’s
inhabitants.

COMPETE Annex 3 15 Sweden - 227 -
Source:SIKA-Institue, Year book, p. 101
(http://www.sika-institute.se/Doclib/Import/107/ars05en.pdf)
Figure 15-3: Activities of the National Road Administration during the past three-year period
The road infrastructure in the Nordic Triangle in Sweden consists of three parts:
E4, Helsingborg–Jönköping–Stockholm
E6, Trelleborg–Malmö–Gothenburg–Swedish/Norwegian border
E18, Swedish/Norwegian border–Örebro–Stockholm–Kappelskär
In 1995, 68 sub-projects were initially identified for the development of the Nordic Triangle.
A socio-economic calculation was performed for each of the three sides of the triangle and
the results show that the project is socio-economically profitable. Further calculations are
performed for each individual sub-project and they form, in combination with other impact
analyses, the basis for the choice of measure. Road.
The traffic volume varies considerably along the Nordic Triangle, with between 7,000 and
110,000 vehicles per day on the E4, between 6,000 and 110,000 on the E6 and between
3,000 and 50,000 vehicles on the E18. The percentage of trucks for the transport of goods is
normally between 12-15%, and exceeds 20% on certain sections. The annual traffic growth
is 1-2% for passenger cars and 2-3% for trucks.

- 228 - 15 Sweden COMPETE Annex 3
Not surprisingly, the percentage of vehicles for international transport is very high close to
the national borders and it is estimated that more than 80% of goods transport by road be-
tween Sweden and Copenhagen, Helsinki or Oslo uses the Nordic Triangle.
On can find following achievements in road infrastructure: From 1995 to 2003, 40 of the 68
sub-projects were finalised and eight are in progress. In addition, investments in traffic flow
separation were made on existing roads. This entailed installing central safety barriers to pre-
vent vehicles from meeting head-on. The total cost of these projects exceeds € 1,500 million.
Sweden has received TEN-T support for E6 through Mölndal, E6 Lerbo–Rabbalshede– Swed-
ish/Norwegian border and E18 Örebro–Arboga. This amounted to a total of € 18 million up
to 2002. The cost for the project that established a fixed link across the sound between
Denmark and Sweden for rail and road, the Öresund bridge, was € 2,800 million.
The financial support provided by TEN-T was close to € 22 million.
Planned investments in road infrastructure
The intention is to upgrade most of the remaining sections of the Nordic Triangle to motor-
way for similar in order to achieve a road of satisfactory standard from an international and a
national perspective. At present, priority is given to road safety.
E4, Helsingborg–Stockholm (Copenhagen–Stockholm–Helsinki). The entire route is of
motorway standard, except the section Ljungby–Toftanäs (32 km) and the motorway
interchange at Ljungarum in Jönköping. In addition, a feasibility study is being con-
ducted concerning a bypass of Stockholm.
E6, Trelleborg/Malmö–Swedish/Norwegian border (Copenhagen–Oslo). The total
length of the remaining sections Trelleborg–Vellinge and Rabbalshede–Hogdal is 71
km.
E18, Swedish/Norwegian border–Stockholm–Kappelskär (Oslo–Stockholm–Helsinki)
The prioritised road sections are: Hån–Töcksfors, Kronoparken–Skattkärr, Lekhyttan–
Adolfsberg, Sagån–Enköping and Hjulsta–Ulriksdal.
Moreover, investments in road informatics will be made on the Nordic Triangle in order to
make more efficient use of existing roads.31
31 SIKA-Institue, Year book 2005

COMPETE Annex 3 15 Sweden - 229 -
Source: SRA (Swedish Road Administration)
(http://www.vv.se/filer/publikationer/nordiska_triangeln.pdf)
Source: http://www.vv.se/filer/publikationer/nordiska_triangeln.pdf, p. 1- 4
Figure 15-4: Upgrading of the Nordic Triangle in Sweden
15.4 Railways
15.4.1 The railway network
Rail density
The highest level of rail infrastructure per capita in Europe is available in Finland and Sweden
(Table 15-4) where also a high share of freight is transported by rail. On the other end of the
scale, the Netherlands, Italy and Greece have low levels of rail infrastructure per head. Italy
and Greece have low levels of passenger and freight rail transport. In The Netherlands, dis-
tances are small and the population density is high. In only a few cases has railway density
increased more than one percentage point during the 1996-97 period (Eurostat, 2001). In
contrast to the expansion of motorways, we find that railway densities mostly fell between
1990 and 1996: in Belgium by about 3 % and in Greece by nearly 1 %; inthe Netherlands
density increased by a modest 0.5 %.32
32 European Environment Agency

- 230 - 15 Sweden COMPETE Annex 3
In 2003, the Swedish rail network consisted of approximately 15 000 kilometres of track,
over 80 per cent of which belongs to the state rail network. Just under 20 per cent of the
state rail network is permitted for 25 tonnes axle load and approximately 20 per cent is
cleared for the largest loading gauges. Approximately 11 per cent has double track and ap-
proximately 50 per cent of the network is electrified.
The state rail network consists of The trunk railways consist of the track transferred from
Swedish State Railways when the National Rail Administration was created in 1988 including
train tracks, marshalling yards and some sidings, mainly track for passenger train storage. The
lines previously referred to as county railways are also now categorised as trunk lines. Other
railways consist of capillary railways – some small railways such as industrial and harbour
railways. The Inland railway, extending for 1 053 km, is no longer part of the state’s track
facilities. In 1992, the Riksdag decided to transfer to right to run services on this route to an
association of interested parties. It is still owned by the state but Inlandsbanan AB, owned by
the fifteen municipalities the line passes through, has the right to operate services. Other
lines on which services are run and which are not included in the state´s trackfacilities are
Roslagsbanan (Roinfrastructureslag line), Saltsjöbanan (Saltsjö line) and Lidingöbanan (Lid-
ingö line) in the County of Stockholm. These lines are owned by Stockholm County Council.
Their total length is 93 km. The Stockholm metro is also owned by Stockholm County Coun-
cil and consists of a total of 108 km of track. Arlandabanan (The Arlanda line between Ros-
ersberg and Odensala) consists of 22 kilometres, while the whole distance from Stockholm to
Arlanda is 41 kilometres.33
Table 15-6: The Swedish railway system in 2003
Source: SIKA-Institute, Year book 2005, p. 121
(http://www.sika-institute.se/Doclib/Import/107/ars05en.pdf)
33 SIKA-Institue, Year book

COMPETE Annex 3 15 Sweden - 231 -
15.4.2 Investments in the railway network
The business volume of the National Rail Administration for 2003 was SEK 12.7 billion, which
was almost 14 per cent higher than the previous year. Volume has mainly increased in track
maintenance. The major part of the total business volume, 77 per cent, was for track main-
tenance, 11 per cent for production and sale to external clients and 4 per cent sector respon-
sibilities. The activities of the National Rail Administration in the most recent three-year period
are shown in the following table.
Table 15-7: Activities of the National Rail Administration in recent three-year period
Source: SIKA-Institute, Year book 2005, p. 103
(http://www.sika-institute.se/Doclib/Import/107/ars05en.pdf)
15.4.3 The measurement of traffic conditions
Punctuality
Reading studies about Swedish Railway punctuality one understand that it is not easy to have
a clear idea about thecurrent situation. Indeed it is a question of definition what one under-
stand as punctuality. Following the abstract of the study "Maintenance for Improved Punctu-
ality - A Study of Condition Monitoring” Technology for the Swedish Railway Sector by Ri-
kard Granström (Luleå University of Technology, Department of Civil and Environmental En-
gineering, Division of Operation and Maintenance Engineering) shows clearly the problematic
in creating reliable statistics.
“Punctuality is usually calculated by dividing the number of punctual trains by the total num-
ber of trains and presenting the result as the percentage of punctual trains (Olsson & Haug-
land, 2004). Banverket’s definition of punctual is: ‘arrival at the end station plus five minutes’. Swedish punctuality is calculated in the manner explained by Olsson & Haugland
(2004), but it should be noted that cancelled trains are not included. Rudnicki (1997) de-
fines punctuality as ‘a feature consisting in a predefined vehicle arriving, departing or passing
at a predefined point at a predefined time’. This definition comes close to describing how
Swedish train delay statistics work. Train delay statistics are used in order to gain an under-
standing of what causes unpunctuality to the Swedish railway sector. Banverket uses differ-
ent approaches such as database systems and collaborative work, such as PULS (punctuality
through collaboration between operators and Banverket) (Fahlen & Jonsson, 2005), for the

- 232 - 15 Sweden COMPETE Annex 3
follow-up of train delays. The most central database system is TFÖR (train delay system),
which is used for train delay follow-up and encoding of failure causes. TFÖR registers the
train’s correlation to the timetable and retrieves the train delay information from the traffic
control system’s track circuit indications.
The delays are manually encoded by personnel at the train traffic control centre. The traffic
controllers are supposed to register a cause of delay when the extra delay is more than five
minutes. The extra delay is the change in delay between two stations, which means that if a
train is extra delayed for three minutes between two stations and for an additional four min-
utes between the next two stations, the train is in fact seven minutes late in relation to the
timetable, but is not regarded as delayed and is therefore not encoded. The reason for this
somewhat tolerant definition of extra delay is to limit the work of encoding and analyzing
delay data.“34
15.4.4 The current situation
Railway network
Ten years before the Nordic Triangle was chosen as one of the prioritised projects by the
European Council, a decision was taken to upgrade about 1,500 kilometres of the Swedish
main lines from 130 km/h to 200 km/h for tilting trains. The programme also included im-
proved accessibility and comfort at most major stations through platform reconstruction and
the installation of elevators and escalators. Insufficient capacity had to be increased by dou-
ble-tracking or quadrupling. In 1996, when the Swedish network was integrated in TEN,
about 50% of these investments had been carried out. Since then, work has been in progress
continuously. Most sections between Stockholm and Malmö and Stockholm and Karlstad
now have the maximum permitted speed of 200 km/h. From Karlstad to the Swed-
ish/Norwegian border the occurence of many curves limits the speed to 160 km/h. About
80% of the connection between Malmö and Gothenburg now has at least two tracks and a
speed limit of 200 km/h, and is prepared for a future increase to 250 km/h.
The sub-projects in the Nordic Triangle that had been finalised between 1996 and 2003 or
still underway in 2003 amounted to € 1,040 million. The European Union has subsidised
about 4% of this. The investments have reduced travel times between major cities. The trip
Stockholm– Copenhagen, which needed 8 hours in 1990, now takes 5 hours, and Stock-
holm–Oslo has been reduced from 6½ to 5 hours. The connection Gothenburg–Copenhagen
has been reduced from 4½ to 3½ hours and Gothenburg–Oslo from 5 to 4 hours.
Long distance transportation by rail to and from Sweden consists mainly of freight. Most of
this is generated within the metal and forest industries situated in the central and northern
parts of the country. It is sent exclusively by rail to customers in central Europe, and in com-
34 Rikard Granström (Luleå University of Technology, Department of Civil and Environmental
Engineering, Division of Operation and Maintenance Engineering) Maintenance for Im-proved Punctuality - A Study of Condition Monitoring” Technology for the Swedish Railway Sec-tor, Nov. 2005

COMPETE Annex 3 15 Sweden - 233 -
bination with shipping to coastal areas. Cross border freight flows have been relatively stable
during the last ten years, seen as a total of all passage points. The opening of the Öresund
fixed link in 2000 changed the transfer point Sweden– Denmark from Helsingborg to Malmö.
Due to the lack of a fixed link at the Fehmarn Belt and the weak bridges at Rendsburg in
Northern Germany and Lille Belt in Denmark, about half of the southbound heavy freight
flow utilises the train ferries from Trelleborg to Rostock and Sassnitz. The international pas-
senger travel pattern primarily has the capitals of Denmark and Norway as destinations. Dur-
ing the last five years travelling by train has increased by about 28% in Sweden. 35
Source: SRA (Swedish Rad Administration)
(http://www.vv.se/filer/publikationer/nordiska_triangeln.pdf)
Figure 15-5: Railway structure
Punctuality – Train delays
The cumulative number of train delay hours for the Swedish railway sector reaches some-
where around 70,000 hours/year36,
35 SIKA-Institue, Year book 2005
36 Rikard Granström (Luleå University of Technology, Department of Civil and Environmental Engineering, Division of Operation and Maintenance Engineering) Maintenance for Im-

- 234 - 15 Sweden COMPETE Annex 3
According to Jan Sundling (Chief Executive Officer, Green Cargo AB ) punctuality is about
95% in freight transport which referrs to a delivery to the customer within 1 h of sched-
ule.37
The distribution of main delay causes (according to available statistics) in Swedish rail trans-
port is described in Figure 15-6. As can be seen in the left graph, the train delay contribution
per main cause (planned work, traffic control, operators, vehicle, infrastructure and others)
shows relatively small fluctuations over the years.
The rright graph shows a mean value of the respective problem owner’s influence on punc-
tuality for the period 2001-2003. Over all, the main delay causes are due to operators. The
reported causes of delays related to the infrastructure and vehicles are illustrated in Figure
15-7.
Source: http://epubl.ltu.se/1402-1757/2005/88/LTU-LIC-0588-SE.pdf
Figure 15-6: TFÖR distribution of train-delays/problem owner for the period 2001-2003 (whole of Sweden).
Source: http://epubl.ltu.se/1402-1757/2005/88/LTU-LIC-0588-SE.pdf
proved Punctuality - A Study of Condition Monitoring” Technology for the Swedish Railway Sec-tor, Nov. 2005
37 Jan Sundling, Railway Gazette, July 2006

COMPETE Annex 3 15 Sweden - 235 -
Figure 15-7: The distribution of reported causes of infrastructure-related delays (left), and distribution of vehicle-related delays (right).
15.4.5 Policy plans and forecasts
Banverket, the Swedish National Rail Administration is an authority that is primarily funded by
Government grants. Banverket's activities are steered by the Parliamentary transport policy
goals.
The transport policy goals set by the Parliamentary transport policy consist of one overall goal
and five sub-goals. The overall goal is to provide a system of transport for citizens and the
business sector all over the country that is both economically effective and sustainable in the
long term. The six sub-goals are:
1. an accessible transport system 2. a high standard of transport quality 3. safe traffic 4. a good environment 5. positive regional development 6. a transport system offering equal opportunities38
Besides this, the improvement of punctuality.
Planned investments in rail infrastructure Some serious bottlenecks remain and will be removed through investment projects in the
period 2004-2015. The steep gradients over Hallandås, a high ridge situated between Halm-
stad and Ängelholm, limits loading capacity of freight trains, forcing a diversion via Hässle-
holm. The mixture of fast and slow trains in the urban areas of Greater Stockholm and
Malmö has to be solved by the construction of tunnels, making it possible to separate flows.
The mixture of high speed tilting trains and the major flow of slower freight trains south of
Mjölby necessitates more bypass tracks to minimise delays. Double-tracking from Gothen-
burg the first 80 kilometres towards Oslo has just started. Plans to increase axle loads from
22.5 to 25 tonnes, the load per meter to 8 tonnes and widen the loading gauge for wide-
body containers have also been initiated and will improve freight capacity. Further upgrading
of existing tracks towards 250 km/h is planned in some parts of the Triangle.
Visions after 2015 The TEN network of 1996 illustrates a planned high speed link Järna–Nyköping– Norrköping–
Linköping passing outside Mjölby, thus making it possible to completely separate slow and
high speed trains. This link will be implemented step by step. In conjunction with the installa-
tion of the new European signal system, other lines, especially Gothenburg–Malmö, will be
upgraded to speeds over 200 km/h.
38 Swedish National Rail Administration

- 236 - 15 Sweden COMPETE Annex 3
Source: SRA (Swedish Rad Administration)
(http://www.vv.se/filer/publikationer/nordiska_triangeln.pdf)
Figure 15-8: Planned projects for Railways 2004-2015
Source: SRA (Swedosh Rad Administration)
(http://www.vv.se/filer/publikationer/nordiska_triangeln.pdf)
Figure 15-9: Upgrading of the Nordic Triangle in Sweden

COMPETE Annex 3 15 Sweden - 237 -
15.5 Stockholm urban road transport
The city of Stockholm has about 800,000 inhabitants, which is about 8.5 percent of the
population of Sweden. 71 percent (227,000) of people are working in the area travel.
15.5.1 The Stockholm congestion charge
On 2 June 2003, the Stockholm City Council adopted a majority proposal to conduct conges-
tion charges trials. The formal decision on implementation was made through the Riksdag
(Swedish Parliament) passing the Congestion Charges Act on 16 June 2004. The trials started
on 22 August 2005 with extended public transport. On 3 January 2006 the trial implementa-
tion of congestion charging started. The trials will be concluded by 31 July 2006. It will be
evaluated continuously from a number of different perspectives. This evaluation will be sum-
marized in a report in early summer 2006. A referendum on the permanent implementation
of congestion charges will be held in conjunction with the general election on 17 September
2006. Source: http://www.stockholmsforsoket.se/templates/page.aspx?id=183.
The Stockholm congestion charge is similar to the ones installed in London and Singapore.
During January and February 2006, the volume of traffic decreased by about 20 percent in
and around Stockholm. The goal had been between 10 and 15 percent. So far, the experi-
ment has exceeded expectations. Although the variation of traffic throughout the year makes
it too early to draw long term conclusions, travel times are expected to show major reduc-
tions.
Source: City of Stockholm (2005)
Figure 15-10: Map of the Stockholm congestion charging area

- 238 - 15 Sweden COMPETE Annex 3
Since the congestion trial charges were introduced more Stockholmers have chosen to take
public transport. Stockholm Transport has reported a passenger increase of almost 10 per-
cent. All types of transport – underground, trains and buses – are carrying more passengers.
However, the increase is not only because of the congestion charges, but due to an improved
network. A number of bus routes have been introduced recently and a rise in train depar-
tures has taken place. There are, however, also concerns that the tansport capacity can not
meet the additional demand created by the congestion charge.
Source: http://www.sweden.se/templates/cs/Article____14227.aspx#G.
15.5.2 Measurement of traffic conditions
The results of the toll introduction are measured with 50 test drivers, which are tracked over
the network. The results are expressed in a travel time index, indicating the prolongation of
journey times against free flow conditions. The reults for a morning rush hour in January
2006 in comparison to the situation prior to the trial introduction is presented by Figure
15-11.
Source: City of Stockholm (2006)
Figure 15-11: Examples of morning peak congestion before and after the trial introduction
In December 2005 the Royal Institute of Technology in Stockholm (KTH) was commissioned
to measure the length of a limited number of traffic queues on specific routes in order to
provide data for the monthly indicators for the Stockholm Trial. The purpose was to measure
the effect of the Stockholm Trial on the total traffic queue length on selected routes and at
selected peak periods. The queue length measurements were limited to the following seg-
ments of the road network:
Routes outside the congestion-charge zone:
E4 – Essingeleden Bypass between Bredäng and Fredhäll

COMPETE Annex 3 15 Sweden - 239 -
E18 – Roslagsvägen between Danderyd Church and Roslagstull
Routes within the zone: Klara Strandsleden between Solnabron
Bridge and Tegelbacken
Major streets within the zone: Sveavägen
The measurments where made by a specially equipped vehicle by the foating car technique
during January 2006 and April 2005. Due to the high variation in queue lengths the results
where not significant.
15.5.3 Current situation
As there has been a significant reduction in traffic in and out of the Stockholm inner city area
between spring 2005 and spring 2006, the average queuing time has also fallen. Queuing
time is defined as the difference between the actual journey time and the time during the
journey that traffic flows freely. For road-users travelling in towards the inner city area on a
normal weekday queuing time has fallen by approximately one third during the morning and
by more than half during the afternoon/evening. At the same time, uncertainty about the
time required for journeys has also reduced. As journey times have become more predictable,
drivers can now plan their journeys without the need to include generous safety margins (as
was necessary before) in order to ensure that they arrive in time. Figure 15-12 presents the
situation graphically.
15.6 Waterway transport
15.6.1 Measurement of traffic conditions
All vessels lager than 400 BT, calling Swedish ports have to make a declaration as a basis for
the charging of fairway charges. The Swedish Maritime Administration stores the data in a
database available for analysis of traffic and transport.
More or less all vessels larger than 300 BT have to have an automatic identification system
(AIS) on board. The system makes it possible for the marine administration to plot all vessels
in Swedish waters at any time. The Maritime Administration is now developing methods for
using AIS-data a source for traffic statistics.
Both the data sets described above are collected all year around. They are collected for other
purposes (fairway charging and maritime safety (AIS)). There are additional costs for the
analysis of the data but not for the gathering of it. The AIS-data describes the time all day
around.The fairway charging data is based on day.
The data is mainly used for our internal work. The Maritime Administration publishes some of
it in “The Swedish Maritime Sector – progress report”
(http://www.sjofartsverket.se/upload/Listade-dokument/Engelska/Sektorrapport_2004_eng.pdf).

- 240 - 15 Sweden COMPETE Annex 3
Source: City of Stockholm (2006)
Figure 15-12: Change in travel times by the toll trial
15.6.2 Current situation
Congestion is not a problem in Swedish maritime shipping. Basically, we do not have conges-
tion in fairways or in ports. However, in a technical sense there are some elements of conges-
tion, for instance, in parts of the fairway from the open sea to the port of Stockholm the
fairway is not wide enough to allow large ships to meet. Thus, one ship may need to
wait/adjust to let a meeting ship pass a narrow. These meetings are planed (by the VTS) and
allow ships to adjust their speed accordingly.
Delay is one thing that regularly occurs in winter navigation. Ships may have to wait for ice-
breaking assistance.
Congestion studies have not been made. The assumption is that the costs are close to nill. Consequently ther are no particularly congested network parts. In a technical sense we could identify a few spots where it occurs and probably also identify the specific times when the ferries meet at those points.

COMPETE Annex 3 15 Sweden - 241 -
15.6.3 Forecasts and policy plans
The situation is considered not to change. Some “narrow spots” can be eliminated. In 2005 one was done. But often it is far too expensive to make sense. There are no specific plan.
The Swedish Maritime Administration concludes that increased maritime transport in line with the EC’s White Papaer can be catered. Sufficient capacity is available.
15.7 References
City of Stockholm (2005): The Stockholm Trial Start on 22 August and 3 January. Information leaflet. URL: http://www.stockholmsforsoket.se/upload/FaktabladEng050615.pdf
City of Stockholm (2006): Facts and Results from the Stockholm Trials. First version – June 2006. Congestion Charges Secretariat. 28.6.2006. URL: http://www.stockholmsforsoket.se/upload/The%20Stockholm%20Trial,%20facts%20and%20results_Expert%20Group%20Summary%20June%202006.pdf
City of Stockholm (2006b): Expert Group Summary. Congestion Charges Secretariat. 12.6.2006. URL: http://www.stockholmsforsoket.se/upload/Reference%20Group%20Summary_The%20Stockholm%20Trial%20May%202006.pdf
Granström, R (2005): Maintenance for Improved Punctuality – A Study of Condition Monitor-ing Technology for the Swedish Railway Sector. Lulea University of Technology, Depart-ment of Civil and Environmental Engineering, Division of Operation and Maintenance En-gineering. URL: http://epubl.ltu.se/1402-1757/2005/88/LTU-LIC-0588-SE.pdf
SIKA (2005): Transport and Communications Yearbook 2005. Swedish Institute for Transport and Commications Analysis, 2005. URL: http://www.sika-institute.se/Doclib/Import/107/ars05en.pdf
SRA (2006): Vägverket. Web-page of the Swedish Road Administration. URL: http://trafikinfo2.vv.se/datexmap/map.aspx?Culture=en