competencies technical report · pdf filecompetencies technical report tti measures: ......
TRANSCRIPT

©2012 Target Training International, Ltd. 052813 53
IntroductionTarget Training International, Ltd. was founded in 1984 by Bill J. Bonnstetter and his son, Dave Bonnstetter. TTI is the worldwide leader in the assessment industry. With extensive research, the Bonnstetters continue to enhance, develop and validate assessment-based solutions that drive results.
Bill has been doing research on what makes normal people unique since 1979. His brother, Dr. Ron Bonnstetter, professor emeritus University of Nebraska Lincoln, has recently joined TTI to expand its research endeavors. TTI’s research has discovered the importance of identifying the HOW and WHY of people as they relate to performance.
To better understand what people bring to the workplace, take a look at TTI’s Dimensions of Superior Performance™.
Competencies TECHNICAL REPORT
TTI MEASURES:- Behavior- World View- Personal Skills (Competencies)- Motivators- Emotional Intelligence
TTI ACKNOWLEDGES:- Experiences- Education & Training- Intelligence
Acumen
Personal Skills (Competencies)Experiences
Motivators
Emotional
Education & Training
Intelligence
Intelligence
Behavior
TTI MEASURES TTI ACKNOWLEDGES
©2013 Target Training International, Ltd.

©2012 Target Training International, Ltd. 052813 54
Executive SummaryThe following pages will provide detailed information on TTI’s Competencies, assessed from both the DNA Personal Soft Skills Indicator and the Hartman Value Profile, the validity of the competencies and how TTI is free of adverse impact. Below is an executive summary of these findings.
ValidityThe competencies TTI measures come from two instruments, the Personal Soft Skills Indicator and the Hartman Value Profile. The Personal Soft Skills Indicator is a 360-degree feedback type instrument. For validity purposes we evaluate each of the questions on a variance scale. The 2012 data indicates complete variance for this questionnaire. The Hartman Value Profile has an internal reliability measurement. The 2012 date indicates a part one reliability of .897 and a part two reliability of .825.

©2012 Target Training International, Ltd. 052813 55
Adverse ImpactOverall, TTI assessments are not pass/fail assessments. While on the surface some of the assessments appear to have ten as the “best” score, this is not the case. Each factor of measurement can be a strength on either end of the scale (zero all the way to ten). This is because of our job-related process. TTI does not recommend using assessments in hiring unless you have completed our job benchmarking process.
The job benchmarking process is designed to provide clarity to each position’s requirements: key accountabilities, skills, behaviors and motivators. While TTI has over 10,000 job benchmarks available, it is recommended to complete the process within each organization for each position.
Because the TTI assessments are not pass/fail, the “80 percent” rule has to be applied differently. In order to illustrate TTI’s compliance with this standard, we look at the mean of the measured factors for the general population as well as male/female, veteran status, disability status and ethnicity. The Adverse Impact section of this report will demonstrate that the TTI assessments do not have more than 20 percent difference in how protected groups score versus the general population.

©2012 Target Training International, Ltd. 052813 56
HistoryProgressive organizations are preparing for unprecedented change brought about by globalization, competition and technology in the new millennium. Competition for top talent has never been greater. The organizations that will endure have learned that managing performance is the equivalent of managing the bottom line.
The performance bar, however, must continually be raised. Compounding this issue is a dramatic shift from quantitative to qualitative performance measures. There once was a time when the performance of a large portion of the workforce could easily be seen and measured. Now it’s difficult to know what has been accomplished at the end of any given day. The shift from mass production to communications and service has changed work substantially from being tangible and task-oriented to intangible and knowledge-oriented.
The irony is that the more technology impacts how work is performed, the more important competencies become. Competencies are, in fact, the new career currency. They are a golden thread that must be woven through an organization to produce results. They are like the DNA of performance.
Performance is profoundly affected by the relationship between performers and their managers, coaches and mentors. Performance is deeply affected by the relationship between people and the values represented in their work. And, performance is subtly affected by the relationship between people and organizational culture. The TTI competency-based tools and processes are designed to improve organizational performance by strengthening these relationships.
How are competencies developed?This is the right question, however, the answer is not clear. Based on research, we have proven that the TTI competencies are not curriculum-based; that is, for the most part they cannot be taught in the classroom. Can you imagine reading a book or hearing a lecture on team building and mastering being a team player? Competencies are practice-based; most competencies are developed over time by doing, participating in team activities, presenting, persuading, etc.
©2012 Target Training International, Ltd. 052813 57
Let the job talk… The job questionnaire
This extensive questionnaire analyzes the input of one Subject Matter Expert to identify the importance of 25 competency requirements of the job. Respondents should be given careful instructions for completing the questionnaire. They should also be advised to be as objective as possible and to think of the position, not the person doing the job.
Upon completion of the questionnaire, the job report will be generated, which includes detailed descriptions and behavioral interview questions for each of the top seven competencies. If data on the job is desired from more than one subject matter expert, each individual must complete a job questionnaire. The next step is to generate a comparison report to identify areas of agreement and disagreement.
Different perspectives and biases on competencies’ requirements of jobs are fairly common. Significant differences must be explored to obtain a more thorough understanding of the position. In this case, subject matter experts should meet to build consensus and respond as a group to another job questionnaire.

©2012 Target Training International, Ltd. 052813 58
ResearchersDNA Personal Soft Skills Indicator — Bill J. BonnstetterA true thought leader impassioned by human behavior and an improved understanding of how individuals think, behave and work, Bill J. Bonnstetter is the co-founder and Chairman of the Board of Target Training International, Ltd. (TTI) and TTI Performance Systems, Ltd. Established in 1984, TTI develops and markets research-based, validated assessments and products available in more than 90 countries and 40 languages.
Bonnstetter is one of the pioneers in the assessment industry because of his significant contributions to the research and study of human behavior. The first to computerize the DISC (Dominance, Influence, Steadiness, Compliance) assessment, he also made reports available via his patented Internet Delivery Service® (IDS). He was also the first to produce a computerized values assessment based on Eduard Spranger’s personality model. Bonnstetter holds patents for TTI’s job benchmarking process, which matches the right person with the right job, and for developing personalized reports integrating values and behaviors.
An international speaker and author, Bonnstetter’s most recent research has focused on normal behavior of sales people, managers and leaders, college freshmen, superior performers and entrepreneurs. Two of his most fervent research pursuits are education and serial entrepreneurship.
The DNA Personal Soft Skills Indicator was the foundational piece behind the 2012 Edison Award nomination for innovation. The nomination recognized Bonnstetter’s invention of the assessment and also the application of the assessment to the educational realm by Dr. Ron Bonnstetter, who first proved the value of using TTI instruments for soft skill knowledge and additionally developed the KEEN protocol as part of his research as a professor at the University of Nebraska at Lincoln.

©2012 Target Training International, Ltd. 052813 59
The Hartman Value Profile — Robert S. HartmanRobert S. Hartman, Research Professor of Philosophy at the University of Tennessee and the National University of Mexico, died on September 20, 1973 and was buried near his home in Cuernavaca, Mexico.
He was born in Berlin on January 27, 1910. He attended the German College of Political Science, the University of Paris, the London School of Economics, and Berlin University, where he received the LL.B. in 1932. For a brief period, he taught at Berlin University and served as an assistant district court judge.
From 1934 to 1941, still under surveillance by the Nazis, he was Walt Disney’s representative, first in Scandinavia, later in Mexico and Central America. In 1938, using a Swedish alien’s passport, he and his wife, the former Rita Emanuel, and son, Jan, left Europe for Mexico, where they lived until their immigration in 1941 to the United States, where they later became citizens.
Dr. Hartman’s first teaching position in the United States was at Lake Forest Academy in Illinois. While there, he enrolled at Northwestern University (Ph.D., 1946). He later taught at the College of Wooster in Ohio (1945-48), and at the Ohio State University (1948-56). He was a visiting professor at Massachusetts Institute of Technology (1955-56), and at Yale (1966). He was Smith Mundt State Department Research Fellow and Exchange Professor at the National University of Mexico (1956-57). He held more than fifty lectureships in the United States, Canada, Latin America, and Europe. He was a research professor of philosophy at the National University of Mexico from 1957 until his death in 1973, and at the University of Tennessee from 1968 until his death in 1973.
His life-long quest was to answer the question, “What is good?”—And to answer the question in such a way that good could be organized to help preserve and enhance the value of human life. He believed that he had found this answer in the axiom upon which he based his science of Axiology, “A thing is good when it fulfills its concept.” His formal axiology, as the ordering logic for the value sciences, receives its most complete expression in his major work, The Structure of Value: Foundations of Scientific Axiology (1967).
©2012 Target Training International, Ltd. 052813 60
ValidityEvidence-Based CompetenciesReliability and validity are related concepts; however, they are also distinct concepts that differ in important ways. Reliability refers to consistency; in other words, consistency of test scores over time by observers and incumbents. Validity, according to the American Education Research Association, is defined as “the degree to which evidence and theory support the interpretation of the scores”.
In a variance study conducted in May of 2012 with over 7,000 respondents, the Personal Soft Skills Indicator had total variance. Meaning each question had a response range from minimum to maximum choice. Conducting a 360-degree feedback survey to assess perception of others on an individual’s evidence-based competencies is recommended. 360-degree feedback surveys utilize the variance method to determine validity of individual questions. If at any time a specific question does not have total variance, the question is deemed “bad”. Due to the 360-degree feedback nature of the Personal Soft Skills Indicator, TTI utilizes the same method for validating the questions contained in this questionnaire.
The Hartman Value Profile has a RHO score for both part one and part two to indicate reliability. TTI has a history of being closer in this score to the original Hartman Value Profile than even Hartman’s own research version. The reliability for part one of TTI’s parallel form for the Hartman Value Profile is .897 and for part two it is .825.
Means and standard deviations for the competencies are available upon request.

©2012 Target Training International, Ltd. 052813 61
PredictabilityNew research demonstrates the value of using multiple assessments to predict and identify entrepreneurs. TTI’s statistician uses multivariate analysis, which involves observations and analysis of more than one statistical variable at a time. Using this approach, TTI analyzed its database of serial entrepreneurs showing the following results:
1. If we only used DISC to identify serial entrepreneurs, we would be correct 60% of the time.
2. If we only used motivators, we could correctly identify serial entrepreneurs 59% of the time.
3. If we used both DISC and motivators, our accuracy goes up to over 80%.
4. However, if we add soft skills into the equation, our success rate of picking serial entrepreneurs goes up to 92%.
Serial entrepreneurs have five unique soft skills in common: leadership, personal effectiveness, goal orientation, persuasion, and interpersonal skills.
This research proves that TTI’s approach to using multiple assessments to benchmark a job is much more effective than using just one assessment.

©2012 Target Training International, Ltd. 052813 62
Adverse Impact:Competencies Findings as of February 2012Random Sample N=17,801
Measurement Mean Standard DeviationConceptual Thinking 69.47 14.61Conflict Management 52.83 21.97Continuous Learning 66.89 20.77Creativity 49.65 25.44Customer Focus 72.90 19.35Decision Making 72.44 10.92Diplomacy and Tact 60.47 21.47Empathy 41.13 24.64Employee Development and Coaching 66.30 20.52Flexibility 73.19 16.52Futuristic Thinking 23.24 22.34Goal Orientation 71.80 19.87Interpersonal Skills 73.08 27.21Leadership 60.45 26.39Negotiation 44.28 29.09Personal Accountability 70.25 10.79Persuasion 52.18 29.37Planning and Organizing 55.16 20.25Presenting 52.63 31.66Problem Solving Ability 72.11 18.06Resiliency 71.76 11.48Self-Management 71.96 11.97Teamwork 67.79 20.32Understanding and Evaluating Others 78.60 15.43Written Communication 57.98 25.62

©2012 Target Training International, Ltd. 052813 63
Males N=10,667
Measurement Mean Standard Deviation
Difference from Random Sample
Conceptual Thinking 70.07 14.16 0.60Conflict Management 56.26 21.64 3.43Continuous Learning 68.19 19.56 1.30Creativity 50.83 24.67 1.18Customer Focus 72.73 18.06 -0.17Decision Making 72.84 10.73 0.40Diplomacy and Tact 59.58 22.59 -0.89Empathy 36.97 24.25 -4.16Employee Development and Coaching 68.15 19.71 1.85Flexibility 73.77 15.81 0.58Futuristic Thinking 24.89 22.66 1.65Goal Orientation 72.95 20.04 1.15Interpersonal Skills 72.16 27.02 -0.91Leadership 65.10 25.03 4.64Negotiation 51.44 28.41 7.16Personal Accountability 70.28 10.77 0.03Persuasion 58.61 28.37 6.43Planning and Organizing 51.99 19.56 -3.17Presenting 58.73 30.48 6.09Problem Solving Ability 72.43 17.31 0.31Resiliency 71.59 11.54 -0.17Self-Management 72.11 11.95 0.15Teamwork 69.18 19.44 1.39Understanding and Evaluating Others 79.15 14.74 0.55Written Communication 57.24 25.39 -0.74
Competencies Findings as of February 2012

©2012 Target Training International, Ltd. 052813 64
Females N=7,134
Competencies Findings as of February 2012
Measurement Mean Standard Deviation
Difference from Random Sample
Difference fromNon-Protected Group
Conceptual Thinking 68.56 15.23 -0.92 -1.51Conflict Management 49.95 21.84 -2.88 -6.32Continuous Learning 65.81 21.70 -1.08 -2.38Creativity 48.69 26.04 -0.96 -2.14Customer Focus 73.03 20.39 0.14 0.30
Decision Making 71.83 11.15 -0.61 -1.01Diplomacy and Tact 61.26 20.44 0.79 1.68Empathy 44.59 24.46 3.46 7.62Employee Development and Coaching
64.79 21.05 -1.51 -3.36
Flexibility 72.30 17.52 -0.89 -1.47Futuristic Thinking 21.87 22.00 -1.37 -3.02Goal Orientation 70.81 19.69 -0.99 -2.14Interpersonal Skills 73.82 27.36 0.74 1.66Leadership 56.59 26.89 -3.86 -8.51Negotiation 38.33 28.33 -5.95 -13.11Personal Accountability 70.23 10.77 -0.02 -0.05Persuasion 46.79 29.12 -5.39 -11.82Planning and Organizing 57.80 20.46 2.64 5.81Presenting 47.56 31.77 -5.08 -11.17Problem Solving Ability 71.65 19.12 -0.47 -0.78Resiliency 72.05 11.34 0.29 0.46Self-Management 71.74 11.97 -0.22 -0.37Teamwork 66.62 20.97 -1.17 -2.57Understanding and Evaluating Others
77.75 16.39 -0.85 -1.40
Written Communication 58.59 25.83 0.61 1.35

©2012 Target Training International, Ltd. 052813 65
Caucasians N=11,988
Competencies Findings as of February 2012
Measurement Mean Standard Deviation
Difference from Random Sample
Conceptual Thinking 70.91 13.59 1.43Conflict Management 53.12 21.83 0.29Continuous Learning 66.07 21.04 -0.82Creativity 50.78 25.50 1.13Customer Focus 72.43 19.03 -0.46Decision Making 73.40 10.25 0.96Diplomacy and Tact 60.08 21.81 -0.39Empathy 40.67 24.36 -0.46Employee Development and Coaching 65.92 20.25 -0.38Flexibility 74.93 15.03 1.73Futuristic Thinking 23.44 22.38 0.20Goal Orientation 71.88 19.73 0.09Interpersonal Skills 71.85 27.75 -1.22Leadership 60.50 26.23 0.05Negotiation 44.35 29.34 0.06Personal Accountability 70.85 10.29 0.60Persuasion 52.02 29.30 0.02Planning and Organizing 54.70 20.28 -0.46Presenting 51.44 31.93 -1.22Problem Solving Ability 73.86 16.34 1.75Resiliency 72.07 11.10 0.31Self-Management 72.62 11.39 0.67Teamwork 68.00 20.16 0.21Understanding and Evaluating Others 80.33 13.67 1.73Written Communication 57.96 25.44 -0.02
©2012 Target Training International, Ltd. 052813 66
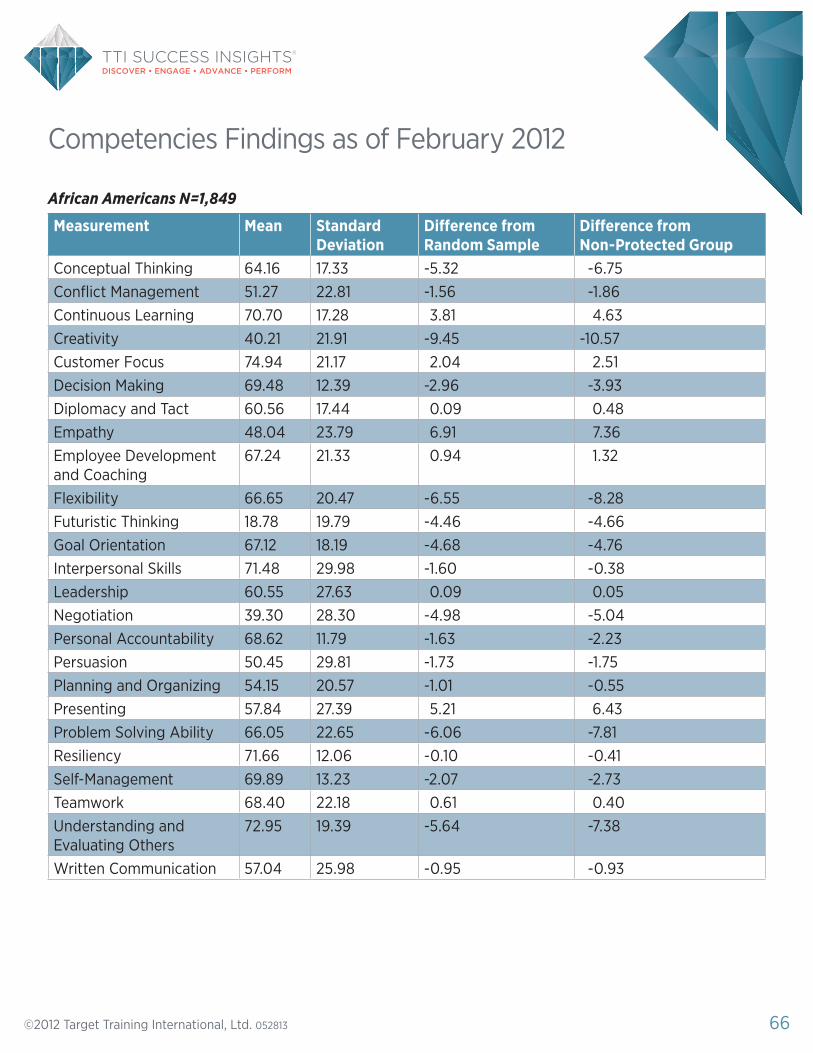
African Americans N=1,849
Competencies Findings as of February 2012
Measurement Mean Standard Deviation
Difference from Random Sample
Difference fromNon-Protected Group
Conceptual Thinking 64.16 17.33 -5.32 -6.75Conflict Management 51.27 22.81 -1.56 -1.86Continuous Learning 70.70 17.28 3.81 4.63Creativity 40.21 21.91 -9.45 -10.57Customer Focus 74.94 21.17 2.04 2.51Decision Making 69.48 12.39 -2.96 -3.93Diplomacy and Tact 60.56 17.44 0.09 0.48Empathy 48.04 23.79 6.91 7.36Employee Development and Coaching
67.24 21.33 0.94 1.32
Flexibility 66.65 20.47 -6.55 -8.28Futuristic Thinking 18.78 19.79 -4.46 -4.66Goal Orientation 67.12 18.19 -4.68 -4.76Interpersonal Skills 71.48 29.98 -1.60 -0.38Leadership 60.55 27.63 0.09 0.05Negotiation 39.30 28.30 -4.98 -5.04Personal Accountability 68.62 11.79 -1.63 -2.23Persuasion 50.45 29.81 -1.73 -1.75Planning and Organizing 54.15 20.57 -1.01 -0.55Presenting 57.84 27.39 5.21 6.43Problem Solving Ability 66.05 22.65 -6.06 -7.81Resiliency 71.66 12.06 -0.10 -0.41Self-Management 69.89 13.23 -2.07 -2.73Teamwork 68.40 22.18 0.61 0.40Understanding and Evaluating Others
72.95 19.39 -5.64 -7.38
Written Communication 57.04 25.98 -0.95 -0.93

©2012 Target Training International, Ltd. 052813 67
American Indian or Alaskan Native N=175
Competencies Findings as of February 2012
Measurement Mean Standard Deviation
Difference from Random Sample
Difference fromNon-Protected Group
Conceptual Thinking 67.32 16.21 -2.15 -3.59Conflict Management 44.50 19.00 -8.33 -8.62Continuous Learning 59.25 21.14 -7.64 -6.82Creativity 55.75 28.49 6.10 4.97Customer Focus 75.92 17.22 3.02 3.48Decision Making 71.05 11.95 -1.39 -2.35Diplomacy and Tact 52.58 18.20 -7.89 -7.50Empathy 28.42 17.61 -12.71 -12.26Employee Development and Coaching
68.00 23.05 1.70 2.08
Flexibility 69.86 19.28 -3.33 -5.07Futuristic Thinking 16.92 23.88 -6.32 -6.53Goal Orientation 68.83 22.06 -2.96 -3.05Interpersonal Skills 81.42 13.88 8.34 9.56Leadership 60.75 34.66 0.30 0.25Negotiation 31.67 22.64 -12.62 -12.68Personal Accountability 69.66 11.51 -0.59 -1.18Persuasion 46.17 25.65 -6.01 -6.04Planning and Organizing 58.92 10.83 3.76 4.22Presenting 51.92 34.38 -0.72 0.50Problem Solving Ability 69.35 20.99 -2.76 -4.51Resiliency 71.81 11.70 0.05 -0.26Self-Management 71.09 12.82 -0.86 -1.53Teamwork 57.08 20.04 -10.71 -10.92Understanding and Evaluating Others
75.72 18.78 -2.88 -4.61
Written Communication 51.42 20.40 -6.57 -6.55

©2012 Target Training International, Ltd. 052813 68
Asian N=1,079
Competencies Findings as of February 2012
Measurement Mean Standard Deviation
Difference from Random Sample
Difference fromNon-Protected Group
Conceptual Thinking 66.12 15.78 -3.35 -4.78Conflict Management 50.94 20.95 -1.89 -2.18Continuous Learning 71.46 18.14 4.57 5.39Creativity 46.53 24.74 -3.13 -4.25Customer Focus 75.87 19.08 2.97 3.44Decision Making 69.67 11.61 -2.78 -3.74Diplomacy and Tact 63.79 20.80 3.31 3.71Empathy 39.73 27.77 -1.40 -0.94Employee Development and Coaching
69.60 19.57 3.30 3.68
Flexibility 69.68 17.63 -3.52 -5.25Futuristic Thinking 24.98 20.76 1.75 1.54Goal Orientation 77.43 17.22 5.63 5.55Interpersonal Skills 80.71 21.75 7.64 8.86Leadership 66.09 24.31 5.63 5.58Negotiation 48.83 29.88 4.54 4.48Personal Accountability 68.44 11.47 -1.81 -2.40Persuasion 57.40 28.90 5.22 5.20Planning and Organizing 60.99 18.19 5.83 6.29Presenting 64.71 30.86 12.08 13.30Problem Solving Ability 67.57 20.03 -4.54 -6.30Resiliency 70.18 12.09 -1.58 -1.89Self-Management 70.77 12.85 -1.19 -1.85Teamwork 72.94 20.38 5.15 4.94Understanding and Evaluating Others
73.03 17.43 -5.56 -7.30
Written Communication 60.61 23.14 2.63 2.65

©2012 Target Training International, Ltd. 052813 69
Hispanic or Latino N=1,078
Competencies Findings as of February 2012
Measurement Mean Standard Deviation
Difference from Random Sample
Difference fromNon-Protected Group
Conceptual Thinking 67.33 15.99 -2.14 -3.58Conflict Management 53.90 23.05 1.07 0.78Continuous Learning 68.82 21.01 1.93 2.75Creativity 45.23 25.05 -4.13 -5.26Customer Focus 76.10 19.69 3.20 3.67Decision Making 71.17 12.18 -1.27 -2.23Diplomacy and Tact 61.40 20.90 0.93 1.32Empathy 41.45 23.82 0.32 0.78Employee Development and Coaching
67.67 20.45 1.36 1.75
Flexibility 70.57 18.33 -2.63 -4.36Futuristic Thinking 23.59 23.21 0.35 0.14Goal Orientation 74.30 21.01 2.50 2.42Interpersonal Skills 79.07 24.18 5.99 7.22Leadership 63.54 24.98 3.08 3.03Negotiation 46.86 28.27 2.57 2.51Personal Accountability 69.15 12.17 -1.10 -1.70Persuasion 53.19 31.96 1.01 0.99Planning and Organizing 57.91 21.36 2.75 3.21Presenting 51.49 32.51 -1.14 0.08Problem Solving Ability 69.61 20.26 -2.50 -4.25Resiliency 71.03 12.50 -0.74 -1.05Self-Management 70.92 13.27 -1.04 -1.71Teamwork 69.44 18.93 1.66 1.44Understanding and Evaluating Others
76.50 17.55 -2.09 -3.83
Written Communication 54.55 26.61 -3.44 -3.42

©2012 Target Training International, Ltd. 052813 70
Two or More Races N=608
Competencies Findings as of February 2012
Measurement Mean Standard Deviation
Difference from Random Sample
Difference fromNon-Protected Group
Conceptual Thinking 70.16 13.80 0.68 -0.75Conflict Management 58.32 23.03 5.49 5.19Continuous Learning 75.98 17.18 9.09 9.91Creativity 50.32 25.00 0.66 -0.46Customer Focus 80.64 14.94 7.74 8.20Decision Making 72.33 10.93 -0.11 -1.08Diplomacy and Tact 65.98 19.33 5.50 5.90Empathy 46.66 26.29 5.53 5.99Employee Development and Coaching
72.05 21.08 5.74 6.12
Flexibility 73.68 15.95 0.49 -1.24Futuristic Thinking 25.05 21.22 1.81 1.60Goal Orientation 73.52 21.50 1.72 1.64Interpersonal Skills 83.80 20.76 10.72 11.94Leadership 67.91 24.74 7.45 7.41Negotiation 52.18 26.08 7.90 7.83Personal Accountability 70.13 10.83 -0.12 -0.71Persuasion 60.00 26.51 7.82 7.80Planning and Organizing 50.16 16.97 -5.00 -4.54Presenting 62.34 29.19 9.71 10.93Problem Solving Ability 72.47 17.03 0.36 -1.39Resiliency 71.34 11.92 -0.42 -0.73Self-Management 71.16 12.36 -0.80 -1.47Teamwork 70.41 18.91 2.62 2.41Understanding and Evaluating Others
78.90 14.43 0.31 -1.43
Written Communication 61.89 26.29 3.90 3.92

©2012 Target Training International, Ltd. 052813 71
Non-Disabled N=16,575
Competencies Findings as of February 2012
Measurement Mean Standard Deviation
Difference from Random Sample
Conceptual Thinking 69.55 14.55 0.07Conflict Management 53.07 21.83 0.24Continuous Learning 67.09 20.85 0.20Creativity 49.62 25.34 -0.03Customer Focus 73.22 19.26 0.32Decision Making 72.53 10.84 0.09Diplomacy and Tact 60.56 21.39 0.09Empathy 41.22 24.69 0.09Employee Development and Coaching 66.44 20.37 0.14Flexibility 73.28 16.45 0.08Futuristic Thinking 23.14 22.15 -0.10Goal Orientation 71.98 19.82 0.18Interpersonal Skills 73.39 27.17 0.31Leadership 61.25 26.23 0.80Negotiation 44.53 29.07 0.25Personal Accountability 70.35 10.69 0.10Persuasion 52.69 29.31 0.51Planning and Organizing 55.13 20.37 -0.03Presenting 52.98 31.74 0.34Problem Solving Ability 72.23 17.97 0.12Resiliency 71.86 11.36 0.10Self-Management 72.07 11.86 0.11Teamwork 68.47 20.13 0.68Understanding and Evaluating Others 78.65 15.39 0.05Written Communication 57.94 25.42 -0.04

©2012 Target Training International, Ltd. 052813 72
Disabled N=228
Competencies Findings as of February 2012
Measurement Mean Standard Deviation
Difference from Random Sample
Difference fromNon-Protected Group
Conceptual Thinking 66.58 17.01 -2.90 -2.97Conflict Management 49.60 24.75 -3.24 -3.48Continuous Learning 68.98 19.52 2.09 1.89Creativity 53.76 27.30 4.11 4.14Customer Focus 70.29 15.58 -2.61 -2.93Decision Making 69.96 12.72 -2.49 -2.58Diplomacy and Tact 62.64 19.74 2.17 2.08Empathy 38.60 24.28 -2.54 -2.63Employee Development and Coaching
69.31 20.63 3.01 2.87
Flexibility 69.94 18.81 -3.26 -3.34Futuristic Thinking 28.88 27.00 5.64 5.74Goal Orientation 74.43 18.07 2.63 2.45Interpersonal Skills 70.17 26.23 -2.91 -3.22Leadership 55.24 28.99 -5.22 -6.01Negotiation 43.83 31.83 -0.45 -0.70Personal Accountability 67.38 12.42 -2.88 -2.97Persuasion 53.14 31.95 0.96 0.45Planning and Organizing 58.29 17.13 3.13 3.16Presenting 54.21 32.33 1.58 1.24Problem Solving Ability 67.67 20.57 -4.45 -4.57Resiliency 69.12 12.88 -2.64 -2.74Self-Management 68.66 13.51 -3.30 -3.41Teamwork 65.90 21.60 -1.88 -2.56Understanding and Evaluating Others
76.25 15.71 -2.35 -2.40
Written Communication 59.26 28.66 1.28 1.32
©2012 Target Training International, Ltd. 052813 73
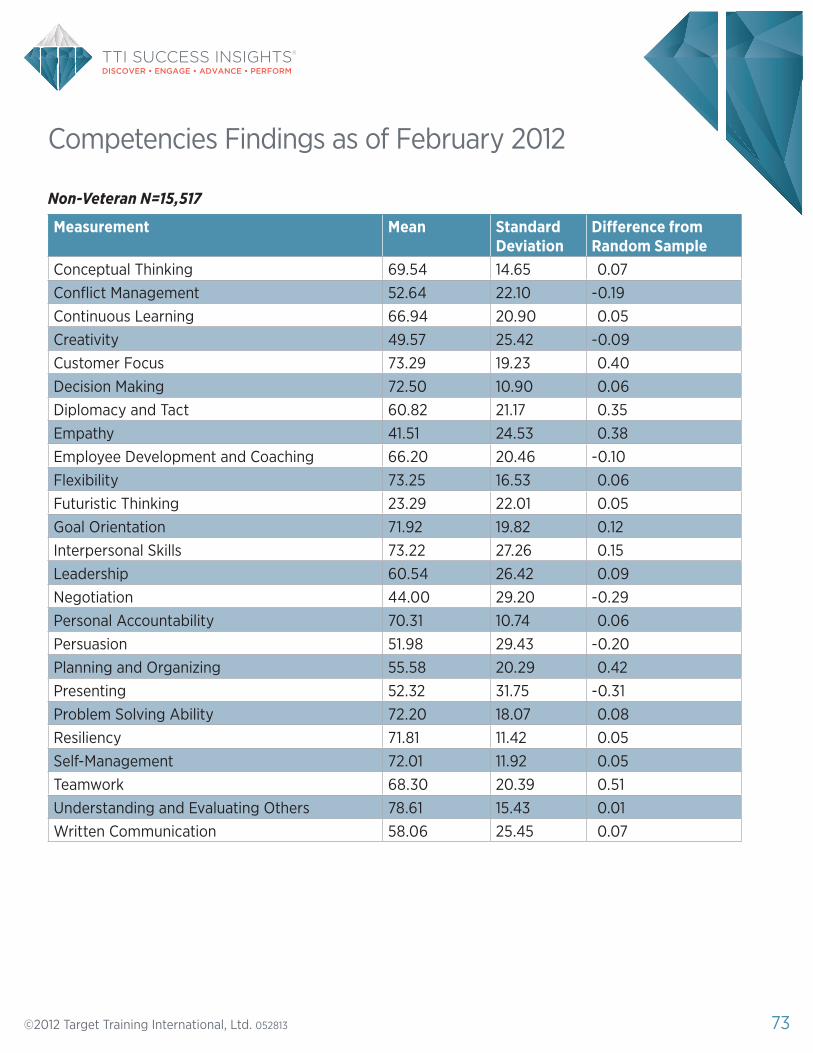
Non-Veteran N=15,517
Competencies Findings as of February 2012
Measurement Mean Standard Deviation
Difference from Random Sample
Conceptual Thinking 69.54 14.65 0.07Conflict Management 52.64 22.10 -0.19Continuous Learning 66.94 20.90 0.05Creativity 49.57 25.42 -0.09Customer Focus 73.29 19.23 0.40Decision Making 72.50 10.90 0.06Diplomacy and Tact 60.82 21.17 0.35Empathy 41.51 24.53 0.38Employee Development and Coaching 66.20 20.46 -0.10Flexibility 73.25 16.53 0.06Futuristic Thinking 23.29 22.01 0.05Goal Orientation 71.92 19.82 0.12Interpersonal Skills 73.22 27.26 0.15Leadership 60.54 26.42 0.09Negotiation 44.00 29.20 -0.29Personal Accountability 70.31 10.74 0.06Persuasion 51.98 29.43 -0.20Planning and Organizing 55.58 20.29 0.42Presenting 52.32 31.75 -0.31Problem Solving Ability 72.20 18.07 0.08Resiliency 71.81 11.42 0.05Self-Management 72.01 11.92 0.05Teamwork 68.30 20.39 0.51Understanding and Evaluating Others 78.61 15.43 0.01Written Communication 58.06 25.45 0.07

©2012 Target Training International, Ltd. 052813 74
Disabled Veteran N=122
Competencies Findings as of February 2012
Measurement Mean Standard Deviation
Difference from Random Sample
Difference fromNon-Protected Group
Conceptual Thinking 69.44 14.41 -0.03 -0.10Conflict Management 52.27 19.46 -0.56 -0.37Continuous Learning 63.27 22.79 -3.61 -3.66Creativity 52.14 23.80 2.48 2.57Customer Focus 70.14 20.42 -2.76 -3.16Decision Making 72.50 11.23 0.05 0.00Diplomacy and Tact 51.73 22.53 -8.75 -9.10Empathy 29.05 27.10 -12.09 -12.46Employee Development and Coaching
66.50 24.63 0.20 0.30
Flexibility 74.01 15.76 0.82 0.76Futuristic Thinking 28.00 24.59 4.76 4.71Goal Orientation 79.82 13.52 8.02 7.90Interpersonal Skills 70.05 33.44 -3.03 -3.18Leadership 68.05 28.93 7.59 7.50Negotiation 50.00 25.45 5.72 6.00Personal Accountability 70.36 10.10 0.11 0.04Persuasion 58.14 32.83 5.96 6.16Planning and Organizing 61.32 16.62 6.16 5.74Presenting 63.00 34.21 10.37 10.68Problem Solving Ability 72.34 17.79 0.23 0.14Resiliency 72.04 10.07 0.28 0.23Self-Management 71.83 11.34 -0.12 -0.17Teamwork 67.45 16.62 -0.33 -0.85Understanding and Evaluating Others
79.13 15.21 0.53 0.52
Written Communication 60.86 23.20 2.88 2.81

©2012 Target Training International, Ltd. 052813 75
Other Veteran N=895
Competencies Findings as of February 2012
Measurement Mean Standard Deviation
Difference from Random Sample
Difference fromNon-Protected Group
Conceptual Thinking 69.31 13.62 -0.16 -0.23Conflict Management 55.86 19.59 3.03 3.22Continuous Learning 67.85 21.32 0.96 0.91Creativity 49.25 25.67 -0.40 -0.32Customer Focus 70.06 19.11 -2.84 -3.23Decision Making 72.57 10.62 0.13 0.07Diplomacy and Tact 57.97 22.99 -2.50 -2.85Empathy 40.75 25.12 -0.38 -0.76Employee Development and Coaching
66.31 18.79 0.01 0.11
Flexibility 73.27 15.95 0.08 0.02Futuristic Thinking 23.01 24.37 -0.23 -0.28Goal Orientation 72.99 20.06 1.19 1.07Interpersonal Skills 73.36 26.98 0.28 0.14Leadership 62.97 26.22 2.52 2.43Negotiation 47.04 28.16 2.76 3.04Personal Accountability 70.26 10.88 0.01 -0.05Persuasion 57.94 26.09 5.76 5.96Planning and Organizing 49.37 19.45 -5.79 -6.21Presenting 52.55 31.54 -0.08 0.23Problem Solving Ability 72.32 17.17 0.21 0.12Resiliency 72.09 11.48 0.32 0.27Self-Management 72.15 12.08 0.19 0.14Teamwork 68.72 19.41 0.93 0.42Understanding and Evaluating Others
79.28 14.84 0.69 0.68
Written Communication 53.44 26.82 -4.54 -4.62

©2012 Target Training International, Ltd. 052813 76
Vietnam Veteran N=216
*The difference from the non-protected group compares the protected subgroup to the non-protected subgroup within the same EEOC category. All data has been rounded to the nearest hundredth.
Competencies Findings as of February 2012
Measurement Mean Standard Deviation
Difference from Random Sample
Difference fromNon-Protected Group
Conceptual Thinking 68.86 12.91 -0.62 -0.68Conflict Management 62.03 22.41 9.20 9.39Continuous Learning 71.61 15.62 4.72 4.67Creativity 53.58 24.21 3.92 4.01Customer Focus 79.61 14.90 6.71 6.31Decision Making 73.12 9.75 0.68 0.63Diplomacy and Tact 67.00 20.70 6.53 6.18Empathy 40.06 25.86 -1.07 -1.45Employee Development and Coaching
75.70 17.72 9.39 9.49
Flexibility 73.42 15.69 0.22 0.17Futuristic Thinking 22.24 23.89 -1.00 -1.05Goal Orientation 73.00 21.00 1.20 1.08Interpersonal Skills 76.91 25.13 3.83 3.69Leadership 70.64 17.95 10.18 10.09Negotiation 53.12 30.80 8.84 9.12Personal Accountability 70.78 9.02 0.53 0.46Persuasion 61.97 30.46 9.79 9.99Planning and Organizing 51.09 22.33 -4.07 4.48Presenting 65.58 27.98 12.94 13.26Problem Solving Ability 72.24 16.05 0.13 0.04Resiliency 72.36 8.61 0.60 0.55Self-Management 73.14 9.77 1.19 1.13Teamwork 70.52 17.71 2.73 2.21Understanding Others 79.47 14.08 0.88 0.86Written Communication 67.94 24.48 9.95 9.88

©2012 Target Training International, Ltd. 052813 77
Adverse Impact:Personal Soft Skills IndicatorFindings as of February 2012Random Sample N = 17,801
Measurement Mean Standard Deviation
AnalyticalProblem Solving
54.79 19.05
Conflict Management 52.83 21.97Continuous Learning 66.89 20.77Creativity and Innovation 49.65 25.44Customer Service 72.90 19.35Decision Making 43.78 24.03Diplomacy 60.47 21.47Empathy 41.13 24.64Employee Development and Coaching
66.30 20.52
Flexibility 48.97 22.78Futuristic Thinking 23.24 22.34Goal Orientation 71.80 19.87Interpersonal Skills 73.08 27.21Leadership 60.45 26.39Management 53.97 17.67Negotiation 44.28 29.09Personal Effectiveness 55.98 21.13Planning and Organizing 55.16 20.25Persuasion 52.18 29.37Presenting 52.63 31.66Self-Management 59.59 27.11Teamwork 67.79 20.32Written Communication 57.98 25.62

©2012 Target Training International, Ltd. 052813 78
Personal Soft Skills Indicator Findings as of February 2012Males N = 10,667
Measurement Mean Standard Deviation
Difference from Random Sample
AnalyticalProblem Solving
57.49 18.26 2.70
Conflict Management 56.26 21.64 3.43Continuous Learning 68.19 19.56 1.30Creativity and Innovation 50.83 24.67 1.18Customer Service 72.73 18.06 -0.17Decision Making 46.22 22.89 2.44Diplomacy 59.58 22.59 -0.89Empathy 36.97 24.25 -4.16Employee Development and Coaching
68.15 19.71 1.85
Flexibility 49.83 22.43 0.86Futuristic Thinking 24.89 22.66 1.65Goal Orientation 72.95 20.04 1.15Interpersonal Skills 72.16 27.02 -0.91Leadership 65.10 25.03 4.64Management 56.88 17.48 2.91Negotiation 51.44 28.41 7.16Personal Effectiveness 60.62 19.95 4.64Planning and Organizing 51.99 19.56 -3.17Persuasion 58.61 28.37 6.43Presenting 58.73 30.48 6.09Self-Management 60.32 26.73 0.73Teamwork 69.18 19.44 1.39Written Communication 57.24 25.39 -0.74

©2012 Target Training International, Ltd. 052813 79
Personal Soft Skills Indicator Findings as of February 2012Females N = 7,134
Measurement Mean Standard Deviation
Difference from Random Sample
Difference from Non-Protected Group
Analytical Problem Solving
52.58 19.39 -2.21 -4.91
Conflict Management 49.95 21.84 -2.88 -6.31Continuous Learning 65.81 21.70 -1.07 -2.38Creativity and Innovation 48.69 26.04 -0.96 -2.14Customer Service 73.03 20.39 0.14 0.30Decision Making 41.73 24.78 -2.05 -4.49Diplomacy 61.23 20.44 0.79 1.65Empathy 44.59 24.46 3.46 7.62Employee Development and Coaching
64.79 21.05 -1.51 -3.36
Flexibility 48.26 23.07 -0.71 -1.57Futuristic Thinking 21.87 22.00 -1.37 -3.02Goal Orientation 70.81 19.69 -0.99 -2.14Interpersonal Skills 73.82 27.36 0.74 1.66Leadership 56.59 26.89 -3.86 -8.51Management 51.55 17.48 -2.42 -5.33Negotiation 38.33 28.32 -5.95 -13.11Personal Effectiveness 52.11 21.33 -3.87 -8.51Planning and Organizing 57.80 20.46 2.64 5.81Persuasion 46.79 29.12 -5.39 -11.82Presenting 47.56 31.77 -5.08 -11.17Self-Management 58.99 27.44 -0.60 -1.33Teamwork 66.62 20.97 -1.17 -2.56Written Communication 58.59 25.83 0.61 1.35

©2012 Target Training International, Ltd. 052813 80
Personal Soft Skills Indicator Findings as of February 2012Caucasians N = 11,988
Measurement Mean Standard Deviation
Difference from Random Sample
AnalyticalProblem Solving
54.12 18.50 -0.67
Conflict Management 53.12 21.83 0.29Continuous Learning 66.07 21.04 -0.81Creativity and Innovation 50.78 25.50 1.13Customer Service 72.43 19.03 -0.46Decision Making 43.63 23.56 -0.16Diplomacy 60.08 21.81 -0.39Empathy 40.67 24.36 -0.46Employee Development and Coaching
65.92 20.25 -0.38
Flexibility 49.16 23.06 0.19Futuristic Thinking 23.44 22.38 0.20Goal Orientation 71.88 19.72 0.09Interpersonal Skills 71.85 27.75 -1.22Leadership 60.50 26.23 0.05Management 53.99 17.23 0.02Negotiation 44.35 29.34 0.06Personal Effectiveness 55.34 21.13 -0.64Planning and Organizing 54.70 20.28 -0.46Persuasion 52.20 29.30 0.02Presenting 51.41 31.93 -1.22Self-Management 59.05 27.35 -0.54Teamwork 68.00 20.16 0.21Written Communication 57.96 25.44 -0.02

©2012 Target Training International, Ltd. 052813 81
Personal Soft Skills Indicator Findings as of February 2012African Americans N = 1,849
Measurement Mean Standard Deviation
Difference from Random Sample
Difference from Non-Protected Group
Analytical Problem Solving
56.13 20.35 1.34 2.01
Conflict Management 51.27 22.81 -1.56 -1.85Continuous Learning 70.70 17.28 3.81 4.63Creativity and Innovation 40.21 21.91 -9.45 -10.57Customer Service 74.94 21.17 2.04 2.51Decision Making 44.16 24.26 0.37 0.53Diplomacy 60.56 17.44 0.09 0.48Empathy 48.04 23.79 6.91 7.37Employee Development and Coaching
67.24 21.32 0.94 1.32
Flexibility 46.05 19.48 -2.92 -3.11Futuristic Thinking 18.78 19.79 -4.46 -4.66Goal Orientation 67.12 18.19 -4.68 -4.76Interpersonal Skills 71.48 29.98 -1.60 -0.37Leadership 60.55 27.63 0.09 0.05Management 50.90 18.57 -3.07 -3.09Negotiation 39.30 28.30 -4.98 -5.05Personal Effectiveness 54.54 21.81 -1.44 -0.80Planning and Organizing 54.15 20.57 -1.01 -0.55Persuasion 50.45 29.81 -1.73 -1.75Presenting 57.84 27.39 5.21 6.43Self-Management 62.54 26.33 2.95 3.49Teamwork 68.40 22.18 0.61 0.40Written Communication 57.04 25.98 -0.95 -0.92
©2012 Target Training International, Ltd. 052813 82
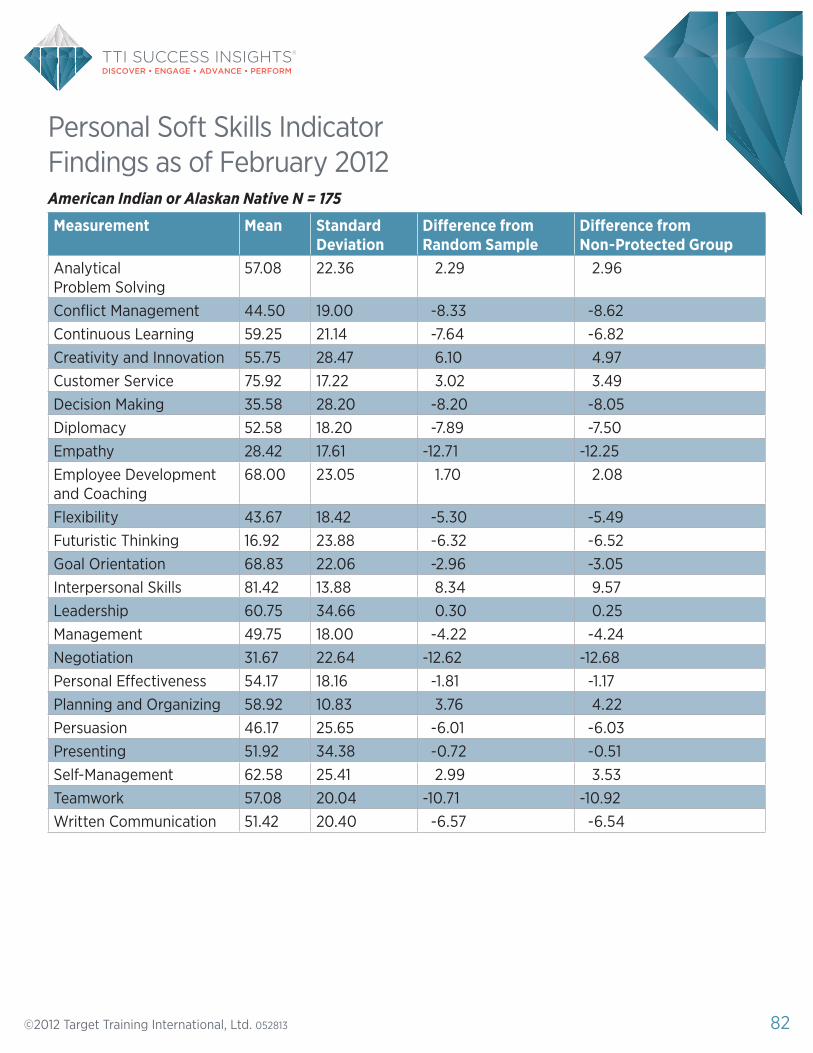
Personal Soft Skills Indicator Findings as of February 2012American Indian or Alaskan Native N = 175
Measurement Mean Standard Deviation
Difference from Random Sample
Difference from Non-Protected Group
Analytical Problem Solving
57.08 22.36 2.29 2.96
Conflict Management 44.50 19.00 -8.33 -8.62Continuous Learning 59.25 21.14 -7.64 -6.82Creativity and Innovation 55.75 28.47 6.10 4.97Customer Service 75.92 17.22 3.02 3.49Decision Making 35.58 28.20 -8.20 -8.05Diplomacy 52.58 18.20 -7.89 -7.50Empathy 28.42 17.61 -12.71 -12.25Employee Development and Coaching
68.00 23.05 1.70 2.08
Flexibility 43.67 18.42 -5.30 -5.49Futuristic Thinking 16.92 23.88 -6.32 -6.52Goal Orientation 68.83 22.06 -2.96 -3.05Interpersonal Skills 81.42 13.88 8.34 9.57Leadership 60.75 34.66 0.30 0.25Management 49.75 18.00 -4.22 -4.24Negotiation 31.67 22.64 -12.62 -12.68Personal Effectiveness 54.17 18.16 -1.81 -1.17Planning and Organizing 58.92 10.83 3.76 4.22Persuasion 46.17 25.65 -6.01 -6.03Presenting 51.92 34.38 -0.72 -0.51Self-Management 62.58 25.41 2.99 3.53Teamwork 57.08 20.04 -10.71 -10.92Written Communication 51.42 20.40 -6.57 -6.54

©2012 Target Training International, Ltd. 052813 83
Personal Soft Skills Indicator Findings as of February 2012Asian N = 1,079
Measurement Mean Standard Deviation
Difference from Random Sample
Difference from Non-Protected Group
Analytical Problem Solving
63.67 19.43 8.88 9.55
Conflict Management 50.94 20.95 -1.89 -2.18Continuous Learning 71.46 18.14 4.57 5.39Creativity and Innovation 46.53 24.74 -3.13 -4.25Customer Service 75.87 19.08 2.97 3.44Decision Making 46.93 25.16 3.14 3.30Diplomacy 63.79 20.80 3.31 3.71Empathy 39.73 27.77 -1.40 -0.94Employee Development and Coaching
69.60 19.57 3.30 3.68
Flexibility 53.99 20.31 5.02 4.85Futuristic Thinking 24.99 20.76 1.75 1.55Goal Orientation 77.43 17.22 5.63 5.55Interpersonal Skills 80.71 21.75 7.64 8.86Leadership 66.09 24.31 5.63 5.59Management 54.34 18.85 0.37 0.35Negotiation 48.83 29.88 4.54 4.48Personal Effectiveness 60.76 18.20 4.78 5.42Planning and Organizing 60.99 18.19 5.83 6.29Persuasion 57.40 28.90 5.22 5.20Presenting 64.71 30.86 12.08 13.30Self-Management 64.94 23.78 5.35 5.89Teamwork 72.94 20.38 5.15 4.94Written Communication 60.61 23.14 2.63 2.65

©2012 Target Training International, Ltd. 052813 84
Personal Soft Skills Indicator Findings as of February 2012Hispanic or Latino N = 1,078
Measurement Mean Standard Deviation
Difference from Random Sample
Difference from Non-Protected Group
Analytical Problem Solving
56.30 21.89 1.51 2.18
Conflict Management 53.90 23.05 1.07 0.78Continuous Learning 68.82 21.01 1.93 2.75Creativity and Innovation 45.53 25.05 -4.12 -5.25Customer Service 76.10 19.69 3.20 3.67Decision Making 49.91 22.64 6.13 6.28Diplomacy 61.40 20.90 0.93 1.32Empathy 41.45 23.82 0.32 0.78Employee Development and Coaching
67.67 20.45 1.36 1.75
Flexibility 50.18 21.86 1.21 1.02Futuristic Thinking 23.59 23.31 0.35 0.15Goal Orientation 74.30 21.01 2.50 2.42Interpersonal Skills 79.07 24.18 5.99 7.22Leadership 63.54 24.98 3.08 3.04Management 55.62 20.07 1.65 1.63Negotiation 46.86 28.27 2.57 2.51Personal Effectiveness 60.43 20.77 4.46 5.09Planning and Organizing 57.91 21.36 2.75 3.21Persuasion 53.19 31.96 1.01 0.99Presenting 51.49 32.51 -1.14 -0.08Self-Management 63.25 26.32 3.66 4.20Teamwork 69.44 18.93 1.66 1.44Written Communication 54.55 26.61 -3.44 -3.41

©2012 Target Training International, Ltd. 052813 85
Personal Soft Skills Indicator Findings as of February 2012Two or More Races N = 608
Measurement Mean Standard Deviation
Difference from Random Sample
Difference from Non-Protected Group
Analytical Problem Solving
53.43 17.98 -1.36 -0.69
Conflict Management 58.32 23.03 5.49 5.20Continuous Learning 75.98 17.18 9.09 9.91Creativity and Innovation 50.32 25.00 0.66 -0.46Customer Service 80.64 14.94 7.74 8.21Decision Making 46.70 23.26 2.92 3.07Diplomacy 65.97 19.33 5.50 5.89Empathy 46.66 26.29 5.53 5.99Employee Development and Coaching
72.05 21.08 5.74 6.13
Flexibility 54.91 19.38 5.94 5.75Futuristic Thinking 25.05 21.22 1.81 1.61Goal Orientation 73.52 21.50 1.72 1.64Interpersonal Skills 83.80 20.76 10.72 11.95Leadership 67.91 24.74 7.45 7.41Management 53.95 19.19 -0.02 -0.04Negotiation 52.18 26.08 7.90 7.83Personal Effectiveness 59.52 17.06 3.54 4.18Planning and Organizing 50.16 16.97 -5.00 -4.54Persuasion 60.00 26.51 7.82 7.80Presenting 62.34 29.19 9.71 10.93Self-Management 56.82 24.92 -2.77 -2.23Teamwork 70.41 18.91 2.62 2.41Written Communication 61.89 26.29 3.90 3.93

©2012 Target Training International, Ltd. 052813 86
Personal Soft Skills Indicator Findings as of February 2012Non-Disabled = 16,575
Measurement Mean Standard Deviation
Difference from Random Sample
AnalyticalProblem Solving
54.87 18.97 0.08
Conflict Management 53.07 21.83 0.24Continuous Learning 67.09 20.85 0.20Creativity and Innovation 49.62 25.34 -0.03Customer Service 73.22 19.26 0.32Decision Making 44.29 23.82 0.50Diplomacy 60.56 21.39 0.09Empathy 41.22 24.69 0.09Employee Development and Coaching
66.44 20.37 0.14
Flexibility 49.39 22.53 0.42Futuristic Thinking 23.14 22.15 -0.10Goal Orientation 71.98 19.82 0.18Interpersonal Skills 73.39 27.17 0.31Leadership 61.25 26.23 0.80Management 53.90 17.68 -0.07Negotiation 44.53 29.07 0.25Personal Effectiveness 56.27 20.84 0.29Planning and Organizing 55.13 20.37 -0.03Persuasion 52.69 29.31 0.51Presenting 52.98 31.74 0.34Self-Management 59.89 26.95 0.30Teamwork 68.47 20.13 0.68Written Communication 57.94 25.42 -0.04

©2012 Target Training International, Ltd. 052813 87
Disabled = 228
Personal Soft Skills Indicator Findings as of February 2012
Measurement Mean Standard Deviation
Difference from Random Sample
Difference from Non-Protected Group
Analytical Problem Solving
57.93 21.07 3.14 3.06
Conflict Management 49.60 24.75 -3.24 -3.48Continuous Learning 68.98 19.52 2.09 1.89Creativity and Innovation 53.76 27.30 4.11 4.14Customer Service 70.29 15.58 -2.61 -2.93Decision Making 42.31 24.30 -1.47 -1.98Diplomacy 62.64 19.74 2.17 2.08Empathy 38.60 24.28 -2.54 -2.63Employee Development and Coaching
69.31 20.63 3.01 2.87
Flexibility 48.12 26.80 -0.85 -1.27Futuristic Thinking 28.88 27.00 5.64 5.74Goal Orientation 74.43 18.07 2.63 2.45Interpersonal Skills 70.17 26.23 -2.91 -3.22Leadership 55.24 28.99 -5.22 -6.01Management 55.10 17.53 1.12 1.19Negotiation 48.83 31.83 -0.45 4.30Personal Effectiveness 53.45 22.94 -2.53 -2.82Planning and Organizing 58.29 17.13 3.13 3.16Persuasion 53.14 31.95 0.96 0.45Presenting 54.21 32.33 1.58 1.23Self-Management 57.33 26.19 -2.26 -2.56Teamwork 65.90 21.60 -1.88 -2.57Written Communication 59.26 28.66 1.28 1.32

©2012 Target Training International, Ltd. 052813 88
Non-Veteran = 15,517
Measurement Mean Standard Deviation
Difference from Random Sample
Analytical Problem Solving
54.39 19.03 0.40
Conflict Management 52.64 22.10 -0.19Continuous Learning 66.94 20.90 0.05Creativity and Innovation 49.57 25.42 -0.09Customer Service 73.29 19.23 0.40Decision Making 43.84 24.05 0.06Diplomacy 60.82 21.17 0.35Empathy 41.51 24.53 0.38Employee Development and Coaching
66.20 20.46 -0.10
Flexibility 49.34 22.65 0.37Futuristic Thinking 23.29 22.01 0.05Goal Orientation 71.92 19.82 0.12Interpersonal Skills 73.22 27.26 0.15Leadership 60.54 26.42 0.09Management 53.71 17.74 -0.26Negotiation 44.00 29.20 -0.29Personal Effectiveness 55.89 20.95 -0.09Planning and Organizing 55.58 20.29 0.42Persuasion 51.98 29.43 -0.20Presenting 52.32 31.75 -0.31Self-Management 59.59 27.00 0.00Teamwork 68.30 20.39 0.51Written Communication 58.06 25.45 0.07
Personal Soft Skills Indicator Findings as of February 2012

©2012 Target Training International, Ltd. 052813 89
Disabled Veteran = 122
Measurement Mean Standard Deviation
Difference from Random Sample
Difference fromNon-Protected Group
Analytical Problem Solving
59.55 13.94 4.75 5.16
Conflict Management 52.27 19.46 -0.56 -0.37Continuous Learning 63.27 22.79 -3.61 -3.67Creativity and Innovation 52.14 23.80 2.48 2.57Customer Service 70.14 20.42 -2.76 -3.15Decision Making 51.32 22.72 7.53 7.48Diplomacy 51.73 22.53 -8.75 -9.09Empathy 29.05 27.10 -12.09 -12.46Employee Development and Coaching
66.50 24.63 0.20 0.30
Flexibility 48.27 26.55 -0.70 -1.07Futuristic Thinking 28.00 24.59 4.76 4.71Goal Orientation 79.82 13.52 8.02 7.90Interpersonal Skills 70.05 33.44 -3.03 -3.17Leadership 68.05 28.93 7.59 7.51Management 56.36 13.15 2.39 2.65Negotiation 50.00 25.45 5.72 6.00Personal Effectiveness 60.59 20.29 4.61 4.70Planning and Organizing 61.32 16.62 6.16 5.74Persuasion 58.14 32.83 5.96 6.16Presenting 63.00 34.21 10.37 10.68Self-Management 68.36 23.37 8.77 8.77Teamwork 67.45 16.62 -0.33 -0.85Written Communication 60.86 23.20 2.88 2.80
Personal Soft Skills Indicator Findings as of February 2012

©2012 Target Training International, Ltd. 052813 90
Other Veteran = 895
Measurement Mean Standard Deviation
Difference from Random Sample
Difference fromNon-Protected Group
Analytical Problem Solving
55.57 17.95 0.78 1.18
Conflict Management 55.86 19.59 3.03 3.22Continuous Learning 67.85 21.32 0.96 0.91Creativity and Innovation 49.25 25.67 -0.40 -0.32Customer Service 70.06 19.11 -2.84 -3.23Decision Making 46.95 22.35 3.17 3.11Diplomacy 57.97 22.98 -2.50 -2.85Empathy 40.75 25.12 -0.38 -0.76Employee Development and Coaching
66.31 18.79 0.01 0.11
Flexibility 50.12 21.01 1.15 0.78Futuristic Thinking 23.01 24.37 -0.23 -0.28Goal Orientation 72.99 20.06 1.19 1.07Interpersonal Skills 73.36 26.98 0.28 0.14Leadership 62.97 26.22 2.52 2.43Management 54.29 18.47 0.32 0.58Negotiation 47.04 28.16 2.76 3.04Personal Effectiveness 56.36 21.45 0.38 0.47Planning and Organizing 49.37 19.45 -5.79 -6.21Persuasion 57.94 26.09 5.76 5.96Presenting 52.55 31.54 -0.08 0.23Self-Management 58.70 28.87 -0.89 0.89Teamwork 68.72 19.41 0.93 0.42Written Communication 53.44 26.82 -4.54 -4.62
Personal Soft Skills Indicator Findings as of February 2012

©2012 Target Training International, Ltd. 052813 91
Vietnam Veteran = 216
Measurement Mean Standard Deviation
Difference from Random Sample
Difference fromNon-Protected Group
Analytical Problem Solving
63.45 20.55 8.66 9.06
Conflict Management 62.03 22.41 9.20 9.39Continuous Learning 71.61 15.62 4.72 4.67Creativity and Innovation 53.58 24.21 3.92 4.01Customer Service 79.61 14.90 6.71 6.32Decision Making 48.79 21.25 5.00 4.95Diplomacy 67.00 20.70 6.53 6.18Empathy 40.06 25.86 -1.07 -1.45Employee Development and Coaching
75.70 17.72 9.39 9.50
Flexibility 52.88 20.43 3.91 3.54Futuristic Thinking 22.24 23.89 -1.00 -1.05Goal Orientation 73.00 20.06 1.20 1.08Interpersonal Skills 76.91 25.13 3.83 3.69Leadership 70.64 17.95 10.18 10.10Management 59.48 15.12 5.51 5.77Negotiation 53.12 30.80 8.84 9.12Personal Effectiveness 63.82 17.49 7.84 7.93Planning and Organizing 51.09 22.33 -4.07 -4.49Persuasion 61.97 30.46 9.79 9.99Presenting 65.58 27.98 12.94 13.26Self-Management 62.67 22.28 3.08 3.08Teamwork 70.52 17.71 2.73 2.22Written Communication 67.94 24.48 9.95 9.88
Personal Soft Skills Indicator Findings as of February 2012

©2012 Target Training International, Ltd. 052813 92
Hartman Value Profile Findingsas of February 2012Random Sample N=17,801
Males N=10,667
Females N=7,134
Measurement Mean Standard DeviationUnderstanding Others 7.47 1.56Practical Thinking 7.24 1.70Systems Judgment 7.02 1.48Sense of Self 6.97 1.43Role Awareness 6.56 1.45Self Direction 6.73 1.25
Measurement Mean Standard Deviation Difference from Random Sample
Understanding Others 7.91 1.47 0.45Practical Thinking 7.74 1.59 0.50Systems Judgment 7.45 1.41 0.43Sense of Self 7.36 1.42 0.38Role Awareness 6.97 1.42 0.41Self Direction 7.06 1.24 0.33
Measurement Mean Standard Deviation
Difference from Random Sample
Difference from Non-Protected Group*
Understanding Others 7.78 1.64 0.31 0.14Practical Thinking 7.48 1.79 0.24 0.26Systems Judgment 7.39 1.52 0.37 0.06Sense of Self 7.41 1.40 0.44 0.05Role Awareness 6.94 1.42 0.38 0.03Self Direction 7.23 1.19 0.50 0.16

©2012 Target Training International, Ltd. 052813 93
Caucasians N=11,988
African Americans N=1,849
American Indian or Alaskan Native N=175
Hartman Value Profile Findings as of February 2012
Measurement Mean Standard Deviation Difference from Random Sample
Understanding Others 8.03 1.37 0.56Practical Thinking 7.80 1.52 0.56Systems Judgment 7.55 1.36 0.52Sense of Self 7.42 1.36 0.44Role Awareness 6.96 1.41 0.41Self Direction 7.15 1.18 0.42
Measurement Mean Standard Deviation
Difference from Random Sample
Difference from Non-Protected Group*
Understanding Others 7.30 1.94 -0.17 -0.74Practical Thinking 6.93 2.12 -0.31 -0.88Systems Judgment 7.00 1.72 -0.02 -0.55Sense of Self 7.48 1.43 0.51 0.06Role Awareness 7.02 1.39 0.46 0.06Self Direction 7.15 1.34 0.42 0.00
Measurement Mean Standard Deviation
Difference from Random Sample
Difference from Protected Group
Understanding Others 7.57 1.88 0.10 0.46Practical Thinking 7.29 2.04 0.05 0.51Systems Judgement 7.23 1.53 0.21 0.32Sense of Self 7.38 1.49 0.40 0.04Role Awareness 7.02 1.43 0.46 0.06Self Direction 7.18 1.22 0.45 0.03

©2012 Target Training International, Ltd. 052813 94
Asian N=1,079
Hispanic or Latino N=1,078
Two or More Races N=608
Measurement Mean Standard Deviation
Difference from Random Sample
Difference from Non-Protected Group*
Understanding Others 7.30 1.74 -0.17 -0.73Practical Thinking 7.41 1.84 0.17 0.40Systems Judgment 7.07 1.59 0.05 0.47Sense of Self 6.89 1.60 -0.08 -0.52Role Awareness 6.87 1.40 0.31 0.10Self Direction 6.97 1.26 0.24 0.18
Measurement Mean Standard Deviation
Difference from Random Sample
Difference from Non-Protected Group*
Understanding Others 7.65 1.76 0.18 0.38Practical Thinking 7.39 1.83 0.15 0.41Systems Judgment 7.24 1.61 0.21 0.31Sense of Self 7.32 1.54 0.34 0.10Role Awareness 6.99 1.47 0.43 0.02Self Direction 7.03 1.36 0.30 0.12
Measurement Mean Standard Deviation
Difference from Random Sample
Difference from Protected Group
Understanding Others 7.89 1.44 0.42 0.14Practical Thinking 7.67 1.64 0.43 0.13Systems Judgement 7.52 1.39 0.50 0.02Sense of Self 7.35 1.53 0.38 0.06Role Awareness 6.80 1.52 0.25 0.16Self Direction 7.09 1.25 0.36 0.06
Hartman Value Profile Findings as of February 2012

©2012 Target Training International, Ltd. 052813 95
Non-Disabled N=16,575
Disabled N=228
Measurement Mean Standard Deviation
Difference from Random Sample
Difference from Non-Protected Group*
Understanding Others 7.63 1.57 0.16 0.24Practical Thinking 7.31 2.07 0.07 0.33Systems Judgment 7.21 1.65 0.18 0.23Sense of Self 7.07 1.72 0.10 0.31Role Awareness 6.61 1.56 0.06 0.35Self Direction 6.81 1.32 0.08 0.32
Measurement Mean Standard Deviation
Difference from Random Sample
Understanding Others 7.86 1.54 0.40Practical Thinking 7.64 1.67 0.40Systems Judgement 7.43 1.45 0.41Sense of Self 7.39 1.40 0.41Role Awareness 6.97 1.41 0.41Self Direction 7.14 1.21 0.41
Hartman Value Profile Findings as of February 2012
©2012 Target Training International, Ltd. 052813 96
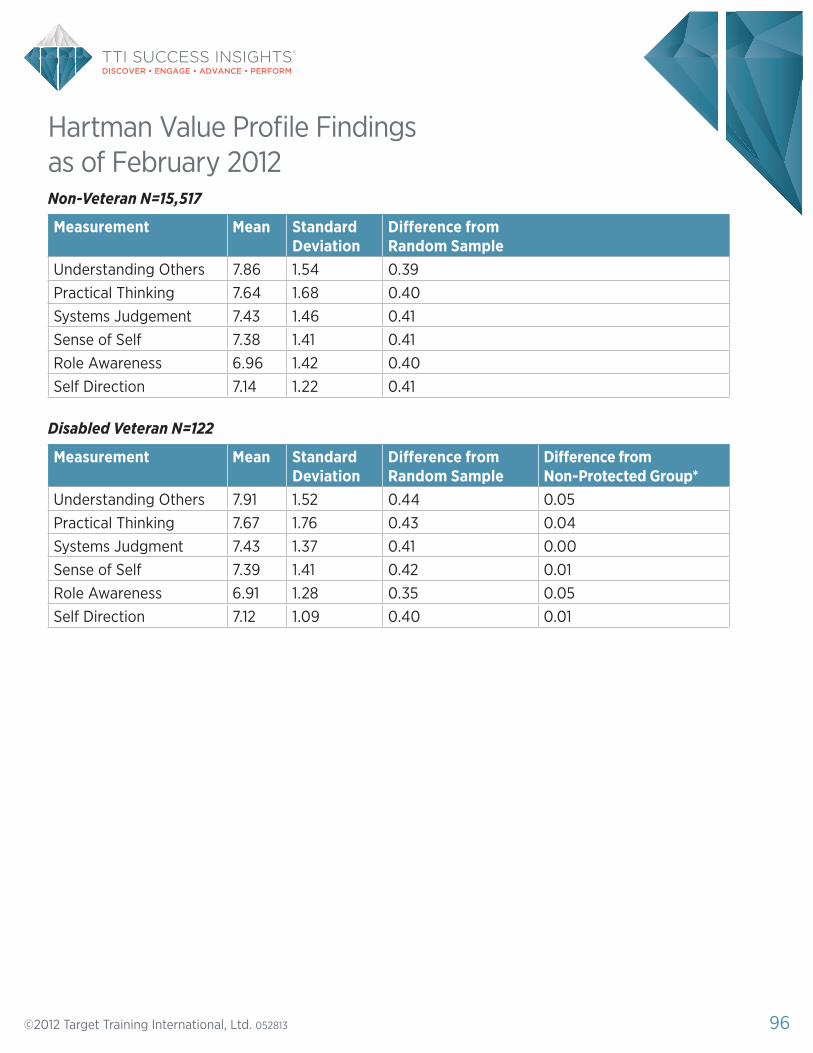
Non-Veteran N=15,517
Disabled Veteran N=122
Measurement Mean Standard Deviation
Difference from Random Sample
Difference from Non-Protected Group*
Understanding Others 7.91 1.52 0.44 0.05Practical Thinking 7.67 1.76 0.43 0.04Systems Judgment 7.43 1.37 0.41 0.00Sense of Self 7.39 1.41 0.42 0.01Role Awareness 6.91 1.28 0.35 0.05Self Direction 7.12 1.09 0.40 0.01
Measurement Mean Standard Deviation
Difference from Random Sample
Understanding Others 7.86 1.54 0.39Practical Thinking 7.64 1.68 0.40Systems Judgement 7.43 1.46 0.41Sense of Self 7.38 1.41 0.41Role Awareness 6.96 1.42 0.40Self Direction 7.14 1.22 0.41
Hartman Value Profile Findings as of February 2012
©2012 Target Training International, Ltd. 052813 97
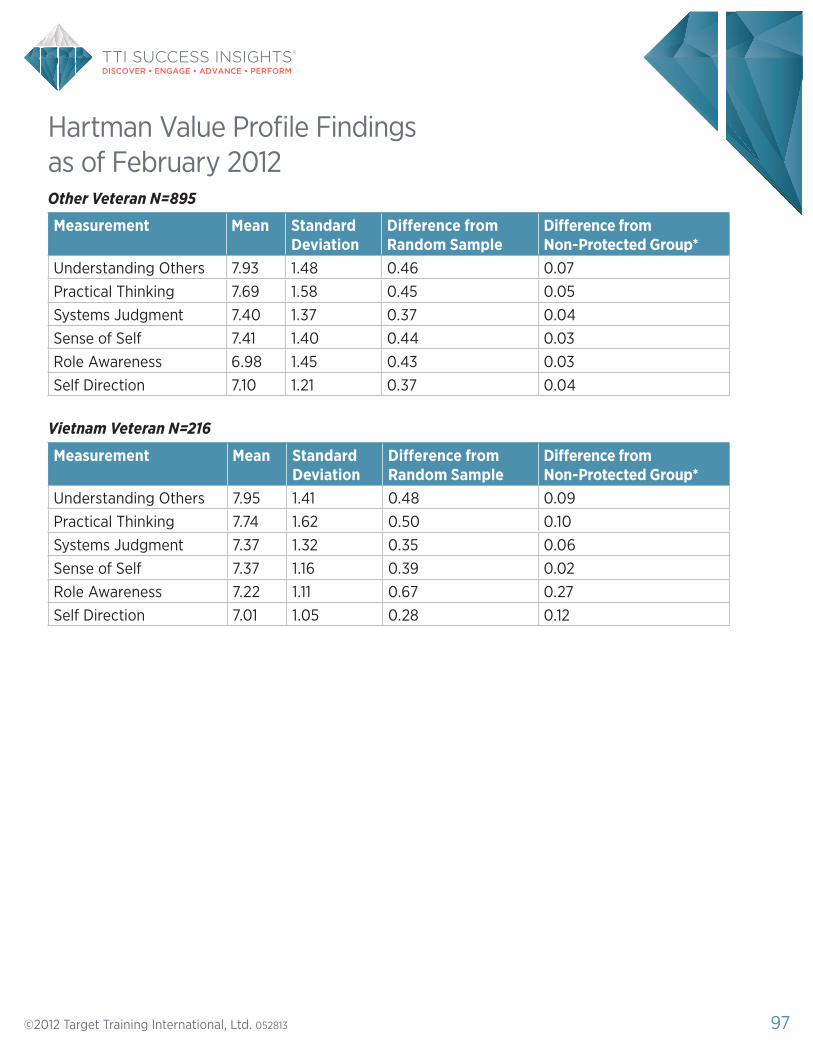
Other Veteran N=895
Vietnam Veteran N=216
Measurement Mean Standard Deviation
Difference from Random Sample
Difference from Non-Protected Group*
Understanding Others 7.95 1.41 0.48 0.09Practical Thinking 7.74 1.62 0.50 0.10Systems Judgment 7.37 1.32 0.35 0.06Sense of Self 7.37 1.16 0.39 0.02Role Awareness 7.22 1.11 0.67 0.27Self Direction 7.01 1.05 0.28 0.12
Measurement Mean Standard Deviation
Difference from Random Sample
Difference from Non-Protected Group*
Understanding Others 7.93 1.48 0.46 0.07Practical Thinking 7.69 1.58 0.45 0.05Systems Judgment 7.40 1.37 0.37 0.04Sense of Self 7.41 1.40 0.44 0.03Role Awareness 6.98 1.45 0.43 0.03Self Direction 7.10 1.21 0.37 0.04
Hartman Value Profile Findings as of February 2012

©2012 Target Training International, Ltd. 052813 98
About Target Training InternationalTarget Training International, Ltd. is the world’s leading developer of research-based, validated assessment and coaching tools that enable organizations to effectively meet their human resources needs. Many Fortune 500 companies are using TTI’s products. Its related companies TTI Performance Systems, Ltd. and Success Insights International have put assessments and reports to work in more than 90 countries and in 40 languages. TTI is also a leader in cutting edge research on human behavior, communication and workplace attitudes and performance. TTI develops thought leadership in the realms of entrepreneurism, education and human interaction. For more information go to www.ttiassessments.com.