competitive intelligence in large companies · gia white paper 4/2005 competitive intelligence in...
TRANSCRIPT
COMPETITIVE INTELLIGENCE IN LARGE COMPANIES
– GLOBAL STUDY
GIA WHITE PAPER 4/2005
GIA White Paper 4/2005 Competitive Intelligence in Large Companies - Global Study 2
Executive Summary
This interview study was conducted in eight countries and in the Asia-Pacific region in the spring of 2005 by seven Global Intelligence Alliance (GIA) members. The survey respondents were responsible for Competitive Intelligence (CI) in their respective companies - one of the top 50 or top 100 firms in the country under study.
One of the most significant results of this global study was that, amongst large scale companies, almost nine in ten use CI and, on average, had practiced the discipline for three to five years. Nearly eight companies in ten had a CI budget and approximately two thirds were planning to increase their investments in the activity. These results offer a solid indication that CI, albeit still a nascent practice relative to more traditional functions (accounting, marketing, operations, etc) in global, large scale companies, it was well on the way to becoming an established functional discipline.
CI seemed to be fulfilling primarily strategic roles, with top management being the most important user of intelligence output and analysis. From a
functional perspective, strategic planning and business development ranks similarly. Continuous monitoring was seen as the most important CI element, with companies mainly focused on gathering information on competitors, customers, and their own industries. These three information needs can be considered as forming the strategic purpose of CI activity.
The activities of CI most in need of further development include utilizing information possessed by personnel, identifying critical information needs, and gathering and managing information effectively. Practicing CI had most often benefited companies in the form of increased quality of information, increased general awareness, and improved threat and opportunity identification.
The research results are important in providing companies with points of comparison regarding their own CI performance. Other stakeholders in the CI community can benefit from the results in the form of increased understanding of the use of CI in a global context.
GIA White Paper 4/2005 Competitive Intelligence in Large Companies - Global Study 3
EXECUTIVE SUMMARY……………………………………………………………………………...……
TABLE OF CONTENTS……………………………………………………………………………....…….
1. INTRODUCTION……………………………………………………………………………………….
2. DESIGN AND IMPLEMENTATION OF THE RESEARCH………………………………………………….
3. KEY FINDINGS ………………………………………………………………………………………..3.1 Definition of the Activity………………………………………………………………………
3.1.1 Systematic Information Collection And Analysis ……………………………………….3.1.2 Terminology Used…………………………………………………………………………3.1.3 Age of CI Activity…………………………………………………………………………3.1.4 Most Important Information Needs ……………………………………………………..3.1.5 Utilization of CI Elements…………………………………………………………..…..3.1.6 Location of Information Processing………………………………………………..…..3.1.7 Utilization of Internal Competitive Intelligence And Tacit Market Knowledge………3.1.8 Existence of CI-Dedicated IT Tools……………………………………………………..3.1.9 Benefits Achieved Through the Use of CI.........................................................
3.2 Organization of the Activity…………………………………………………………………..3.2.1 Personnel Groups Utilizing CI Products…………………………………………………3.2.2 Functions that Utilize CI Products……………………………………………………...3.2.3 CI-Budget………………………………………………………………………………...3.2.4 Person Responsible………………………………………………………………………3.2.5 Employees Allocated to CI………………………………………………………………
3.3 Future Outlook of CI…………………………………………………………………………..3.3.1 Development of CI Investments………………………………………………………...3.3.2 Critical CI Development Issues………………………………………………………….
4. CONCLUSIONS……………………………………………………………………………………….
APPENDIX 1: The Questionnaire………………………………………………...……………….……
Table of Contents
2
3
4
5
666789
1113151618202022242526272728
30
31
GIA White Paper 4/2005 Competitive Intelligence in Large Companies - Global Study 4
In the spring of 2005, seven Global Intelligence Alliance (GIA) members decided to engage in collaborative research in the field of Competitive Intelligence (CI*). The objective of this project was to produce mutually comparable information regarding CI in each of the respective domestic markets. This goal was ‘operationalized’ via the use of a common research framework to deliver both country-specific reports and a comparative multi-country report. Additionally, this research collaboration would showcase the capability of the GIA network to engage in multi-country research.
Interview study was selected as the research method. All seven of the participating GIA partners were involved in the creation of the questionnaire (see Appendix 1), which was used for the interviews in all of the markets under study. The questionnaire consisted of three sections: 1) Definition of the CI Activity, 2) Organization of the CI Activity and 3) Future Outlook of the CI Activity. The target was to interview the highest ranking CI personnel in approximately 30 of the 100 largest companies operating in each market under study. In order to ensure an optimal response rate, the respondents
were guaranteed total anonymity along with an offer to receive the final report.
The primary research question was, “What is the current nature and state of competitive intelligence (CI) activities in major corporations operating in the market in question?” It was further delineated into two sub-questions: 1) “How are the activities organized?” and 2) “How will the scope of current CI activities change in the future and what are the developmental targets for the CI program?” These research questions were answered through quantitative and qualitative analysis of the interview results.
The research proved to be very successful given the participation of a total of 287 companies in eighteen countries - Australia, Brazil, Canada, China, Finland, Germany, Hong Kong, India, Japan, Korea, Malaysia, Mexico, the Netherlands, Norway, Singapore, Taiwan, Thailand, and Switzerland. The scale and scope of the response makes this research one of the largest and most comprehensive studies conducted in the field of CI to date.
1. INTRODUCTION
*CI is defined by the Society of Competitive Intelligence Professionals (SCIP) as “the process of en-hancing marketplace competitiveness through a greater -- yet unequivocally ethical -- understanding of a firm’s competitors and the competitive environment.” CI as a term is used throughout this study although it is considered to mean an activity wider in scope than in the definition by SCIP. Even though there might have been a better term to be used instead, CI was chosen because of its wide acceptance in the business community and also because the terminology is used by a number of GIA members in describing their businesses.
GIA White Paper 4/2005 Competitive Intelligence in Large Companies - Global Study 5
The questionnaire used was designed as a collaborative effort by the participating GIA members and Tampere University of Technology. Most of the questions used were multiple choice and structured questions. There were also some open questions included and, in some of the multiple choice questions, the interviewees were allowed to elaborate. In a number of the survey questions, a modified Likert scale was used, by which the respondents were asked to place issues in the order of importance. In these cases, the results were weighted according to following principles:– Most important issue: 10 importance points– 2nd most important issue: 6 importance points– 3rd most important issue: 4 importance points
In the markets under study, the goal was to interview one individual from each of the top 50 or top 100 companies as measured by sales. This
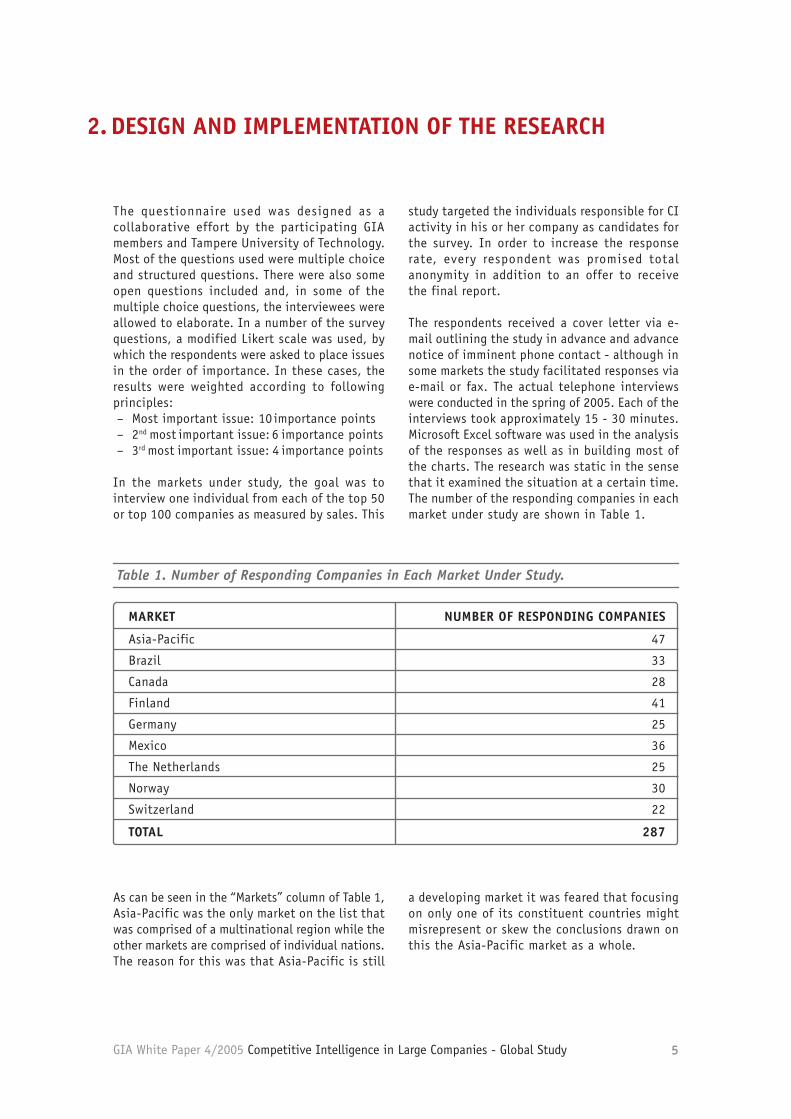
Table 1. Number of Responding Companies in Each Market Under Study.
study targeted the individuals responsible for CI activity in his or her company as candidates for the survey. In order to increase the response rate, every respondent was promised total anonymity in addition to an offer to receive the final report.
The respondents received a cover letter via e-mail outlining the study in advance and advance notice of imminent phone contact - although in some markets the study facilitated responses via e-mail or fax. The actual telephone interviews were conducted in the spring of 2005. Each of the interviews took approximately 15 - 30 minutes. Microsoft Excel software was used in the analysis of the responses as well as in building most of the charts. The research was static in the sense that it examined the situation at a certain time. The number of the responding companies in each market under study are shown in Table 1.
MARKET
Asia-Pacific
Brazil
Canada
Finland
Germany
Mexico
The Netherlands
Norway
Switzerland
TOTAL
NUMBER OF RESPONDING COMPANIES
47
33
28
41
25
36
25
30
22
287
As can be seen in the “Markets” column of Table 1, Asia-Pacific was the only market on the list that was comprised of a multinational region while the other markets are comprised of individual nations. The reason for this was that Asia-Pacific is still
a developing market it was feared that focusing on only one of its constituent countries might misrepresent or skew the conclusions drawn on this the Asia-Pacific market as a whole.
2. DESIGN AND IMPLEMENTATION OF THE RESEARCH
GIA White Paper 4/2005 Competitive Intelligence in Large Companies - Global Study 6
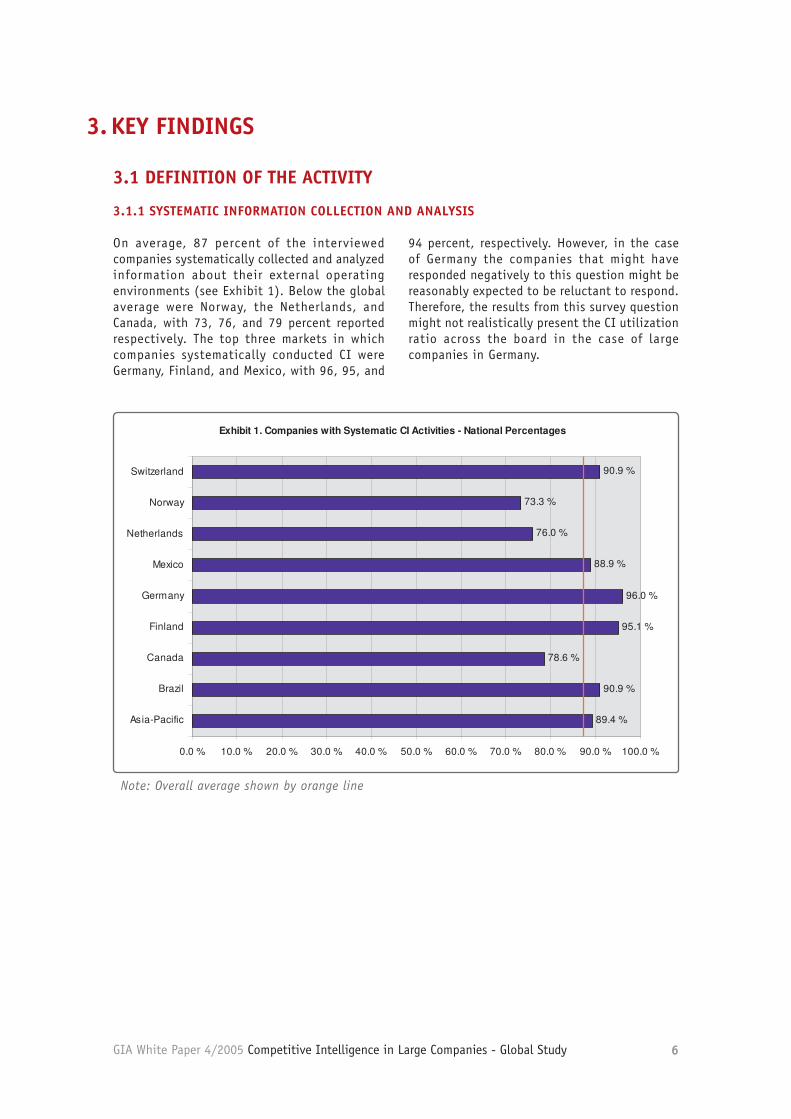
On average, 87 percent of the interviewed companies systematically collected and analyzed information about their external operating environments (see Exhibit 1). Below the global average were Norway, the Netherlands, and Canada, with 73, 76, and 79 percent reported respectively. The top three markets in which companies systematically conducted CI were Germany, Finland, and Mexico, with 96, 95, and
94 percent, respectively. However, in the case of Germany the companies that might have responded negatively to this question might be reasonably expected to be reluctant to respond. Therefore, the results from this survey question might not realistically present the CI utilization ratio across the board in the case of large companies in Germany.
3. KEY FINDINGS
3.1 DEFINITION OF THE ACTIVITY
3.1.1 SYSTEMATIC INFORMATION COLLECTION AND ANALYSIS
3
GIA White Paper 4/2005 Competitive Intelligence in Large Companies – GlobalStudy
3. KEY FINDINGS
3.1 DEFINITION OF THE ACTIVITY
3.1.1 SYSTEMATIC INFORMATION COLLECTION AND ANALYSISOn average, 87 percent of the interviewed companies systematically collected andanalyzed information about their external operating environments (see Exhibit 1).Below the global average were Norway, the Netherlands, and Canada, with 73, 76,and 79 percent reported respectively. The top three markets in which companiessystematically conducted CI were Germany, Finland, and Mexico, with 96, 95, and 94percent, respectively. However, in the case of Germany the companies that mighthave responded negatively to this question might be reasonably expected to bereluctant to respond. Therefore, the results from this survey question might notrealistically present the CI utilization ratio across the board in the case of largecompanies in Germany.
Exhibit 1. Companies with Systematic CI Activities - National Percentages
89.4 %
90.9 %
78.6 %
95.1 %
96.0 %
88.9 %
76.0 %
73.3 %
90.9 %
0.0 % 10.0 % 20.0 % 30.0 % 40.0 % 50.0 % 60.0 % 70.0 % 80.0 % 90.0 % 100.0 %
Asia-Pacific
Brazil
Canada
Finland
Germany
Mexico
Netherlands
Norway
Switzerland
Exhibit 1. Companies with Systematic CI Activities - National Percentages
89.4 %
90.9 %
78.6 %
95.1 %
96.0 %
88.9 %
76.0 %
73.3 %
90.9 %
0.0 % 10.0 % 20.0 % 30.0 % 40.0 % 50.0 % 60.0 % 70.0 % 80.0 % 90.0 % 100.0 %
Asia-Pacific
Brazil
Canada
Finland
Germany
Mexico
Netherlands
Norway
Switzerland
Note: Overall average shown by orange line.
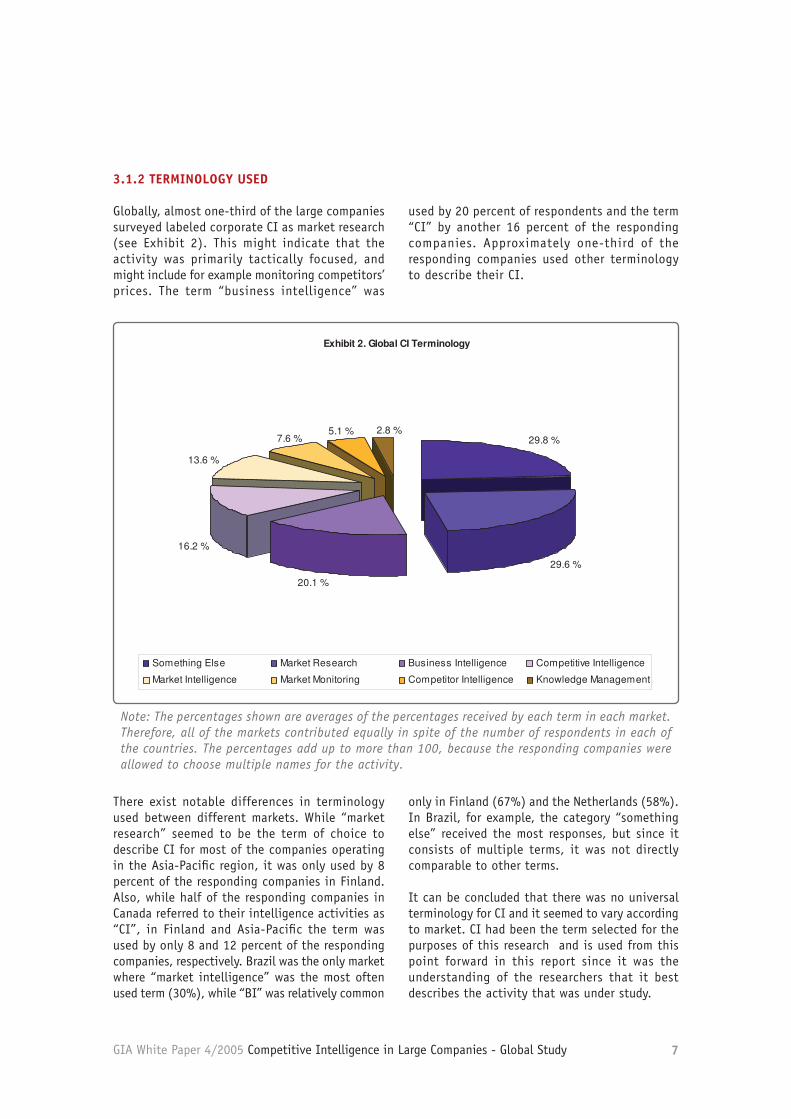
3.1.2 TERMINOLOGY USEDGlobally, almost one-third of the large companies surveyed labeled corporate CI asmarket research (see Exhibit 2). This might indicate that the activity was primarilytactically focused, and might include for example monitoring competitors’ prices. Theterm “business intelligence” was used by 20 percent of respondents and the term “CI”by another 16 percent of the responding companies. Approximately one-third of theresponding companies used other terminology to describe their CI.
Note: Overall average shown by orange line
GIA White Paper 4/2005 Competitive Intelligence in Large Companies - Global Study 7
4
GIA White Paper 4/2005 Competitive Intelligence in Large Companies – GlobalStudy
Exhibit 2. Global CI Terminology
29.8 %
29.6 %
20.1 %
16.2 %
13.6 %
7.6 %5.1 % 2.8 %
Something Else Market Research Business Intelligence Competitive Intelligence
Market Intelligence Market Monitoring Competitor Intelligence Knowledge Management
Note: The percentages shown are averages of the percentages received by each term in eachmarket. Therefore, all of the markets contributed equally in spite of the number ofrespondents in each of the countries. The percentages add up to more than 100, because theresponding companies were allowed to choose multiple names for the activity.
There exist notable differences in terminology used between different markets. While“market research” seemed to be the term of choice to describe CI for most of thecompanies operating in the Asia-Pacific region, it was only used by 8 percent of theresponding companies in Finland. Also, while half of the responding companies inCanada referred to their intelligence activities as “CI”, in Finland and Asia-Pacific theterm was used by only 8 and 12 percent of the responding companies, respectively.Brazil was the only market where “market intelligence” was the most often used term(30%), while “BI” was relatively common only in Finland (67%) and the Netherlands(58%). In Brazil, for example, the category “something else” received the mostresponses, but since it consists of multiple terms, it was not directly comparable toother terms.
It can be concluded that there was no universal terminology for CI and it seemed tovary according to market. CI had been the term selected for the purposes of thisresearch and is used from this point forward in this report since it was theunderstanding of the researchers that it best describes the activity that was understudy.
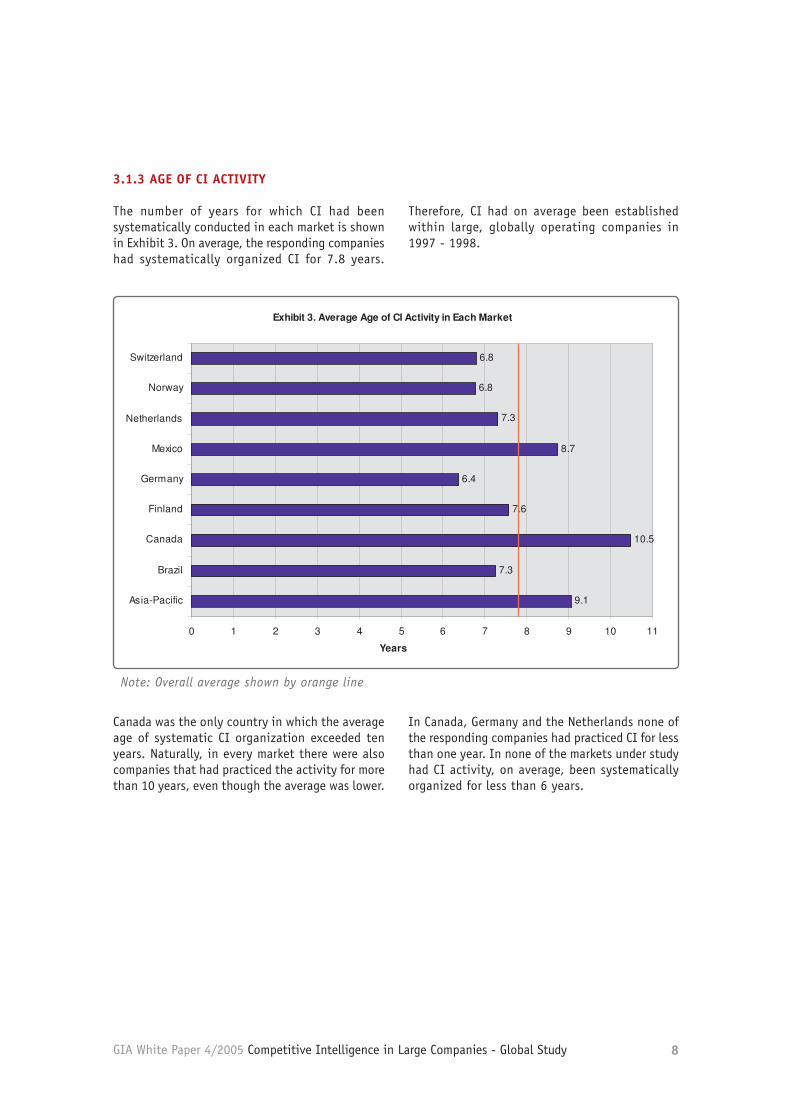
3.1.3 AGE OF CI ACTIVITYThe number of years for which CI had been systematically conducted in each marketis shown in Exhibit 3. On average, the responding companies had systematicallyorganized CI for 3 - 5 years. Therefore, CI had been established within large, globallyoperating companies during the time period of 2000 - 2002.
There exist notable differences in terminology used between different markets. While “market research” seemed to be the term of choice to describe CI for most of the companies operating in the Asia-Pacific region, it was only used by 8 percent of the responding companies in Finland. Also, while half of the responding companies in Canada referred to their intelligence activities as “CI”, in Finland and Asia-Pacific the term was used by only 8 and 12 percent of the responding companies, respectively. Brazil was the only market where “market intelligence” was the most often used term (30%), while “BI” was relatively common
only in Finland (67%) and the Netherlands (58%). In Brazil, for example, the category “something else” received the most responses, but since it consists of multiple terms, it was not directly comparable to other terms.
It can be concluded that there was no universal terminology for CI and it seemed to vary according to market. CI had been the term selected for the purposes of this research and is used from this point forward in this report since it was the understanding of the researchers that it best describes the activity that was under study.
Note: The percentages shown are averages of the percentages received by each term in each market. Therefore, all of the markets contributed equally in spite of the number of respondents in each of the countries. The percentages add up to more than 100, because the responding companies were allowed to choose multiple names for the activity.
3.1.2 TERMINOLOGY USED
Globally, almost one-third of the large companies surveyed labeled corporate CI as market research (see Exhibit 2). This might indicate that the activity was primarily tactically focused, and might include for example monitoring competitors’ prices. The term “business intelligence” was
used by 20 percent of respondents and the term “CI” by another 16 percent of the responding companies. Approximately one-third of the responding companies used other terminology to describe their CI.
GIA White Paper 4/2005 Competitive Intelligence in Large Companies - Global Study 8
Canada was the only country in which the average age of systematic CI organization exceeded ten years. Naturally, in every market there were also companies that had practiced the activity for more than 10 years, even though the average was lower.
In Canada, Germany and the Netherlands none of the responding companies had practiced CI for less than one year. In none of the markets under study had CI activity, on average, been systematically organized for less than 6 years.
Note: Overall average shown by orange line
3.1.3 AGE OF CI ACTIVITY
The number of years for which CI had been systematically conducted in each market is shown in Exhibit 3. On average, the responding companies had systematically organized CI for 7.8 years.
Therefore, CI had on average been established within large, globally operating companies in 1997 - 1998.
5
GIA White Paper 4/2005 Competitive Intelligence in Large Companies – GlobalStudy
Exhibit 3. Average Age of CI Activity in Each Market
9.1
7.3
10.5
7.6
6.4
8.7
7.3
6.8
6.8
0 1 2 3 4 5 6 7 8 9 10 11
Asia-Pacific
Brazil
Canada
Finland
Germany
Mexico
Netherlands
Norway
Switzerland
Years
Exhibit 3. Average Age of CI Activity in Each Market
9.1
7.3
10.5
7.6
6.4
8.7
7.3
6.8
6.8
0 1 2 3 4 5 6 7 8 9 10 11
Asia-Pacific
Brazil
Canada
Finland
Germany
Mexico
Netherlands
Norway
Switzerland
Years
Note: Overall average shown by orange line.
Canada was the only country in which the average age of systematic CI organizationexceeded ten years. Naturally, in every market there were also companies that hadpracticed the activity for more than 10 years, even though the average was lower. InCanada, Germany and the Netherlands none of the responding companies hadpracticed CI for less than one year. In none of the markets under study had CIactivity, on average, been systematically organized for less than 6 years.
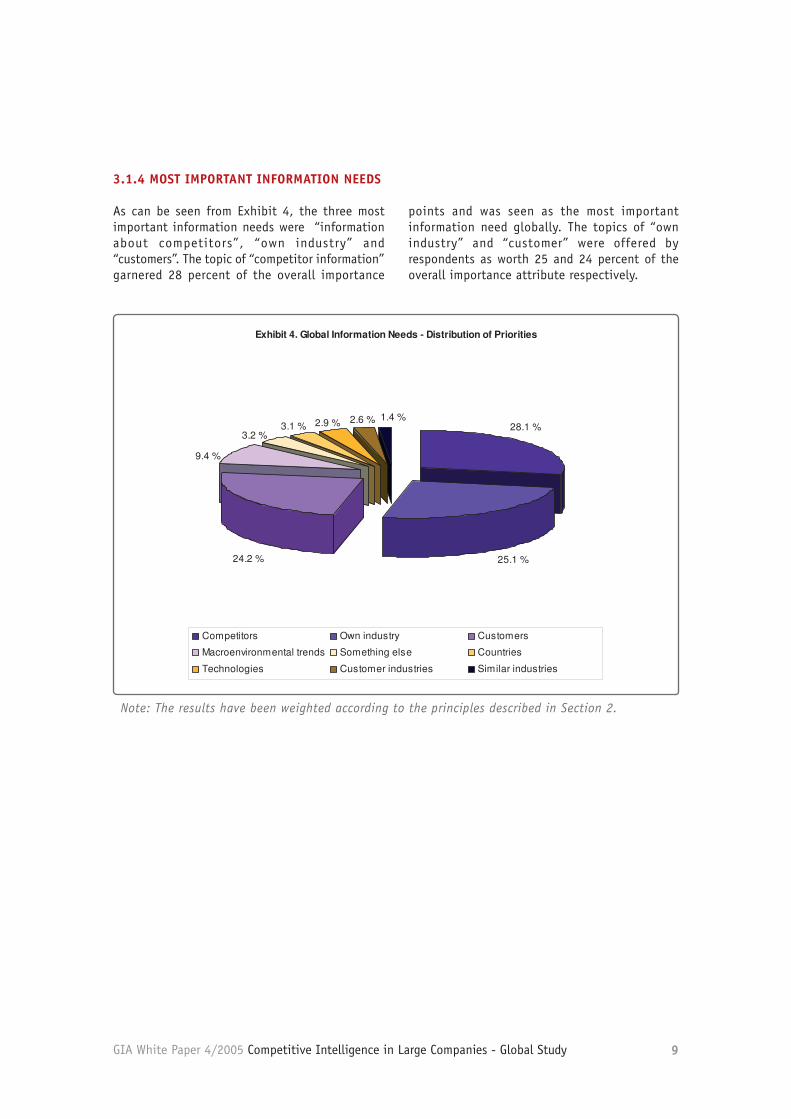
3.1.4 MOST IMPORTANT INFORMATION NEEDSAs can be seen from Exhibit 4, the three most important information needs were“information about competitors”, “own industry” and “customers”. The topic of“competitor information” garnered 28 percent of the overall importance points andwas seen as the most important information need globally. The topics of “ownindustry” and “customer” were offered by respondents as worth 25 and 24 percent ofthe overall importance attribute respectively.
GIA White Paper 4/2005 Competitive Intelligence in Large Companies - Global Study 9
6
GIA White Paper 4/2005 Competitive Intelligence in Large Companies – GlobalStudy
Exhibit 4. Global Information Needs - Distribution of Priorities
25.1 %
28.1 %
24.2 %
9.4 %
3.1 %3.2 %
2.9 % 2.6 % 1.4 %
Competitors Own industry Customers
Macroenvironmental trends Something else Countries
Technologies Customer industries Similar industries
Note: The results have been weighted according to the principles described in Section 2.
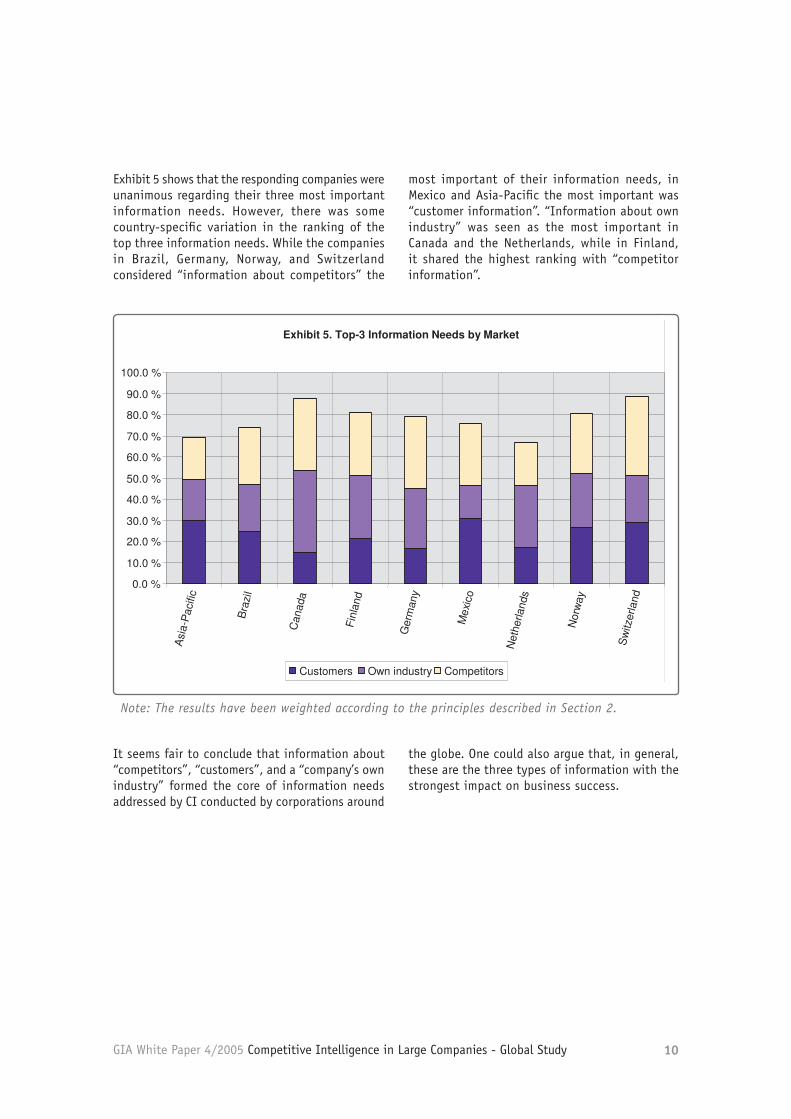
Exhibit 5 shows that the responding companies were unanimous regarding theirthree most important information needs. However, there was some country-specificvariation in the ranking of the top three information needs. While the companies inBrazil, Germany, Norway, and Switzerland considered “information aboutcompetitors” the most important of their information needs, in Mexico and Asia-Pacific the most important was “customer information”. “Information about ownindustry” was seen as the most important in Canada and the Netherlands, while inFinland, it shared the highest ranking with “competitor information”.
Note: The results have been weighted according to the principles described in Section 2.
3.1.4 MOST IMPORTANT INFORMATION NEEDS
As can be seen from Exhibit 4, the three most important information needs were “information about competitors”, “own industry” and “customers”. The topic of “competitor information” garnered 28 percent of the overall importance
points and was seen as the most important information need globally. The topics of “own industry” and “customer” were offered by respondents as worth 25 and 24 percent of the overall importance attribute respectively.
GIA White Paper 4/2005 Competitive Intelligence in Large Companies - Global Study 10
It seems fair to conclude that information about “competitors”, “customers”, and a “company’s own industry” formed the core of information needs addressed by CI conducted by corporations around
the globe. One could also argue that, in general, these are the three types of information with the strongest impact on business success.
Note: The results have been weighted according to the principles described in Section 2.
7
GIA White Paper 4/2005 Competitive Intelligence in Large Companies – GlobalStudy
Exhibit 5. Top-3 Information Needs by Market
0.0 %
10.0 %
20.0 %
30.0 %
40.0 %
50.0 %
60.0 %
70.0 %
80.0 %
90.0 %
100.0 %
Asi
a-P
acifi
c
Bra
zil
Can
ada
Finl
and
Ger
man
y
Mex
ico
Net
herla
nds
Nor
way
Sw
itzer
land
Customers Own industry Competitors
Exhibit 5. Top-3 Information Needs by Market
0.0 %
10.0 %
20.0 %
30.0 %
40.0 %
50.0 %
60.0 %
70.0 %
80.0 %
90.0 %
100.0 %
Asi
a-P
acifi
c
Bra
zil
Can
ada
Finl
and
Ger
man
y
Mex
ico
Net
herla
nds
Nor
way
Sw
itzer
land
Customers Own industry Competitors
Note: The results have been weighted according to the principles described in Section 2.
It seems fair to conclude that information about “competitors”, “customers”, and a“company’s own industry” formed the core of information needs addressed by CIconducted by corporations around the globe. One could also argue that, in general,these are the three types of information with the strongest impact on businesssuccess.
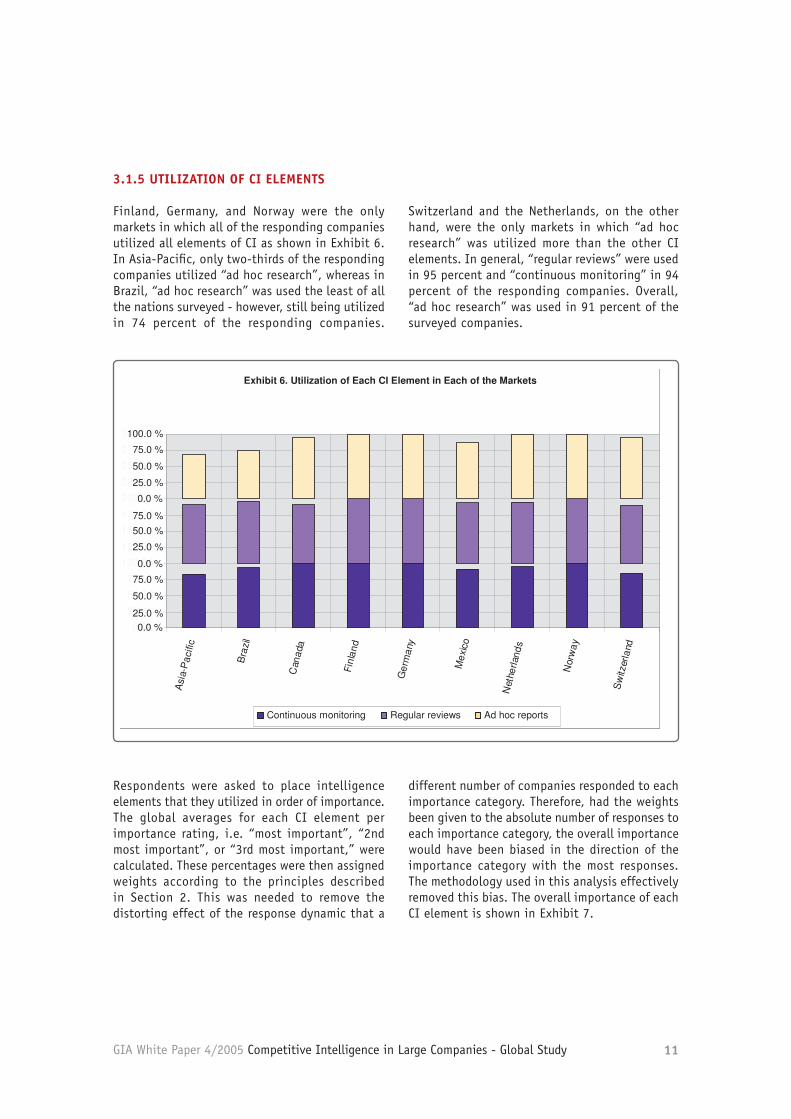
3.1.5 UTILIZATION OF CI ELEMENTSFinland, Germany, and Norway were the only markets in which all of the respondingcompanies utilized all elements of CI as shown in Exhibit 6. In Asia-Pacific, only two-thirds of the responding companies utilized “ad hoc research”, whereas in Brazil, “adhoc research” was used the least of all the nations surveyed - however, still beingutilized in 74 percent of the responding companies. Switzerland and the Netherlands,on the other hand, were the only markets in which “ad hoc research” was utilizedmore than the other CI elements. In general, “regular reviews” were used in 95percent and “continuous monitoring” in 94 percent of the responding companies.Overall, “ad hoc research” was used in 91 percent of the surveyed companies.
Exhibit 5 shows that the responding companies were unanimous regarding their three most important information needs. However, there was some country-specific variation in the ranking of the top three information needs. While the companies in Brazil, Germany, Norway, and Switzerland considered “information about competitors” the
most important of their information needs, in Mexico and Asia-Pacific the most important was “customer information”. “Information about own industry” was seen as the most important in Canada and the Netherlands, while in Finland, it shared the highest ranking with “competitor information”.
GIA White Paper 4/2005 Competitive Intelligence in Large Companies - Global Study 11
Respondents were asked to place intelligence elements that they utilized in order of importance. The global averages for each CI element per importance rating, i.e. “most important”, “2nd most important”, or “3rd most important,” were calculated. These percentages were then assigned weights according to the principles described in Section 2. This was needed to remove the distorting effect of the response dynamic that a
different number of companies responded to each importance category. Therefore, had the weights been given to the absolute number of responses to each importance category, the overall importance would have been biased in the direction of the importance category with the most responses. The methodology used in this analysis effectively removed this bias. The overall importance of each CI element is shown in Exhibit 7.
8
GIA White Paper 4/2005 Competitive Intelligence in Large Companies – GlobalStudy
0.0 %
50.0 %
75.0 %
25.0 %
0.0 %
50.0 %
75.0 %
25.0 %
0.0 %
50.0 %
75.0 %
25.0 %
100.0 %
Utilization of Each CI Element in Each of the Markets
0.0 %
25.0 %
50.0 %
75.0 %
100.0 %
125.0 %
150.0 %
175.0 %
200.0 %
225.0 %
250.0 %
275.0 %
300.0 %
Asi
a-P
acifi
c
Bra
zil
Can
ada
Finl
and
Ger
man
y
Mex
ico
Net
herla
nds
Nor
way
Sw
itzer
land
Series1 Series2 Series3 Series4 Series5Continuous monitoring Regular reviews Ad hoc reports
0.0 %
25.0 %
0.0 %
50.0 %
75.0 %
25.0 %
0.0 %
50.0 %75.0 %
50.0 %
75.0 %
25.0 %
100.0 %
Exhibit 6. Utilization of Each CI Element in Each of the Markets
0.0 %
50.0 %
75.0 %
25.0 %
0.0 %
50.0 %
75.0 %
25.0 %
0.0 %
50.0 %
75.0 %
25.0 %
100.0 %
0.0 %
50.0 %
75.0 %
25.0 %
0.0 %
50.0 %
75.0 %
25.0 %
0.0 %
50.0 %
75.0 %
25.0 %
100.0 %
Utilization of Each CI Element in Each of the Markets
0.0 %
25.0 %
50.0 %
75.0 %
100.0 %
125.0 %
150.0 %
175.0 %
200.0 %
225.0 %
250.0 %
275.0 %
300.0 %
Asi
a-P
acifi
c
Bra
zil
Can
ada
Finl
and
Ger
man
y
Mex
ico
Net
herla
nds
Nor
way
Sw
itzer
land
Series1 Series2 Series3 Series4 Series5Continuous monitoring Regular reviews Ad hoc reports
0.0 %
25.0 %
0.0 %
50.0 %
75.0 %
25.0 %
0.0 %
50.0 %75.0 %
50.0 %
75.0 %
25.0 %
100.0 %
Exhibit 6. Utilization of Each CI Element in Each of the Markets
Respondents were asked to place intelligence elements that they utilized in order ofimportance. The global averages for each CI element per importance rating, i.e.“most important”, “2nd most important”, or “3rd most important,” were calculated.These percentages were then assigned weights according to the principles describedin Section 2. This was needed to remove the distorting effect of the responsedynamic that a different number of companies responded to each importancecategory. Therefore, had the weights been given to the absolute number ofresponses to each importance category, the overall importance would have beenbiased in the direction of the importance category with the most responses. Themethodology used in this analysis effectively removed this bias. The overallimportance of each CI element is shown in Exhibit 7.
3.1.5 UTILIZATION OF CI ELEMENTS
Finland, Germany, and Norway were the only markets in which all of the responding companies utilized all elements of CI as shown in Exhibit 6. In Asia-Pacific, only two-thirds of the responding companies utilized “ad hoc research”, whereas in Brazil, “ad hoc research” was used the least of all the nations surveyed - however, still being utilized in 74 percent of the responding companies.
Switzerland and the Netherlands, on the other hand, were the only markets in which “ad hoc research” was utilized more than the other CI elements. In general, “regular reviews” were used in 95 percent and “continuous monitoring” in 94 percent of the responding companies. Overall, “ad hoc research” was used in 91 percent of the surveyed companies.
GIA White Paper 4/2005 Competitive Intelligence in Large Companies - Global Study 12
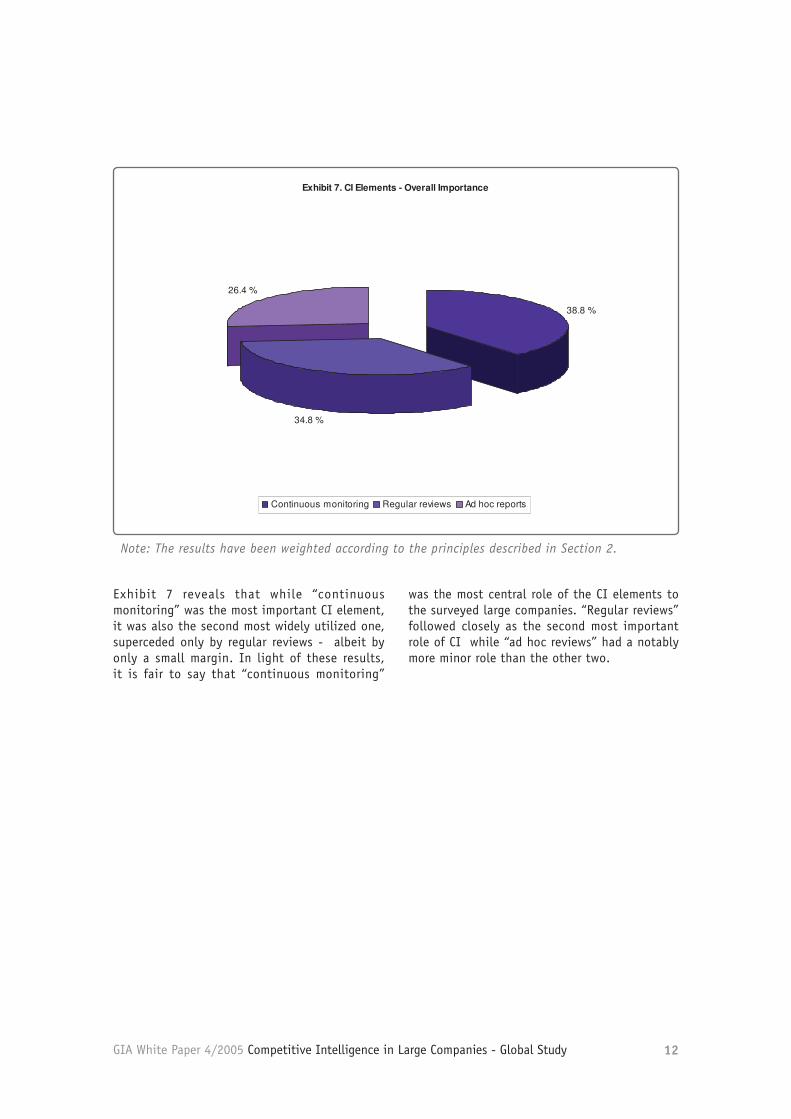
Exhibit 7 reveals that while “continuous monitoring” was the most important CI element, it was also the second most widely utilized one, superceded only by regular reviews - albeit by only a small margin. In light of these results, it is fair to say that “continuous monitoring”
was the most central role of the CI elements to the surveyed large companies. “Regular reviews” followed closely as the second most important role of CI while “ad hoc reviews” had a notably more minor role than the other two.
Note: The results have been weighted according to the principles described in Section 2.
9
GIA White Paper 4/2005 Competitive Intelligence in Large Companies – GlobalStudy
Exhibit 7. CI Elements - Overall Importance
38.8 %
34.8 %
26.4 %
Continuous monitoring Regular reviews Ad hoc reports
Note: The results have been weighted according to the principles described in Section 2.
Exhibit 7 reveals that while “continuous monitoring” was the most important CIelement, it was also the second most widely utilized one, superceded only by regularreviews - albeit by only a small margin. In light of these results, it is fair to say that“continuous monitoring” was the most central role of the CI elements to the surveyedlarge companies. “Regular reviews” followed closely as the second most importantrole of CI while “ad hoc reviews” had a notably more minor role than the other two.
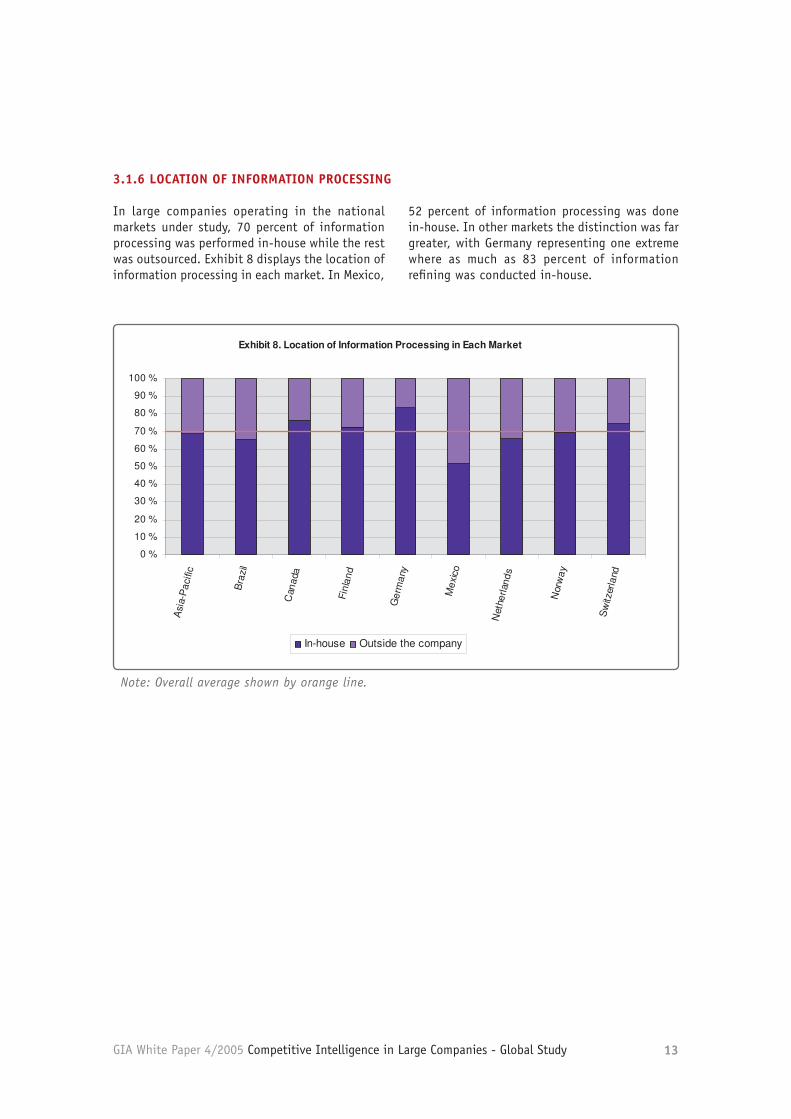
3.1.6LOCATION OF INFORMATION PROCESSINGIn large companies operating in the national markets under study, 70 percent ofinformation processing was performed in-house while the rest was outsourced.Exhibit 8 displays the location of information processing in each market. In Mexico,52 percent of information processing was done in-house. In other markets thedistinction was far greater, with Germany representing one extreme where as muchas 83 percent of information refining was conducted in-house.
GIA White Paper 4/2005 Competitive Intelligence in Large Companies - Global Study 13
Note: Overall average shown by orange line.
10
GIA White Paper 4/2005 Competitive Intelligence in Large Companies – GlobalStudy
Exhibit 8. Location of Information Processing in Each Market
0 %
10 %
20 %
30 %
40 %
50 %
60 %
70 %
80 %
90 %
100 %
Asi
a-P
acifi
c
Bra
zil
Can
ada
Finl
and
Ger
man
y
Mex
ico
Net
herla
nds
Nor
way
Sw
itzer
land
In-house Outside the company
Exhibit 8. Location of Information Processing in Each Market
0 %
10 %
20 %
30 %
40 %
50 %
60 %
70 %
80 %
90 %
100 %
Asi
a-P
acifi
c
Bra
zil
Can
ada
Finl
and
Ger
man
y
Mex
ico
Net
herla
nds
Nor
way
Sw
itzer
land
In-house Outside the company
Note: Overall average shown by orange line.
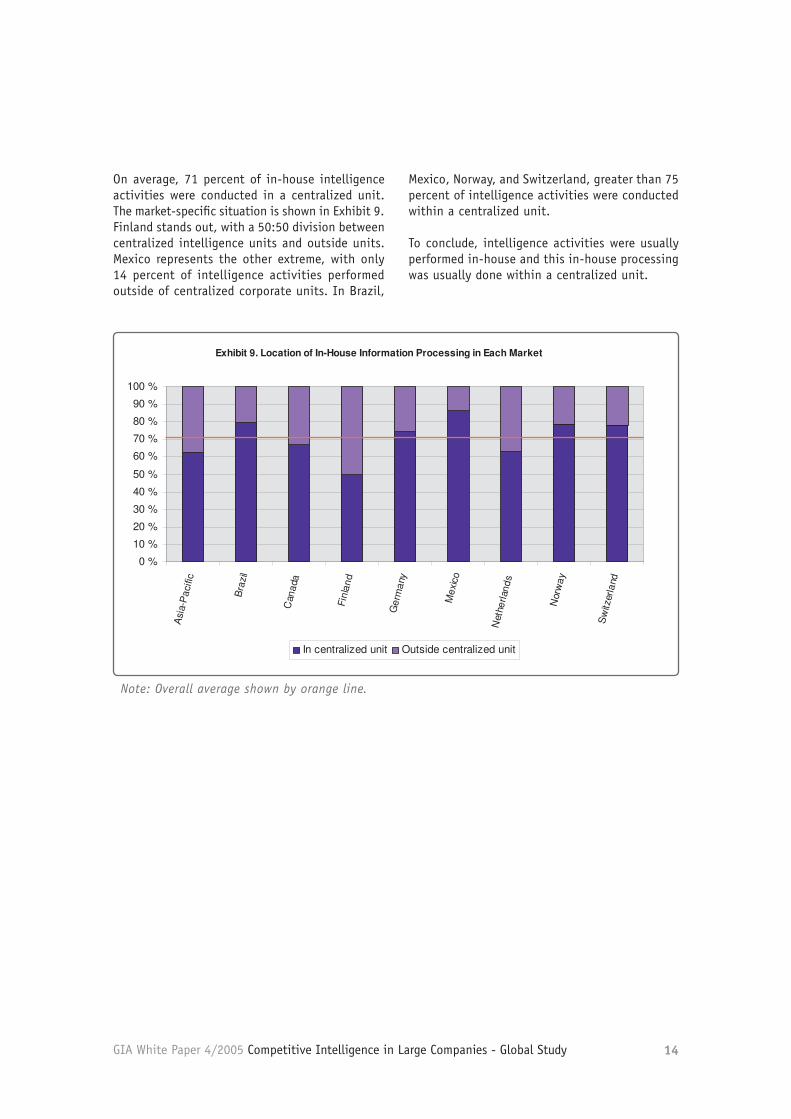
On average, 71 percent of in-house intelligence activities were conducted in acentralized unit. The market-specific situation is shown in Exhibit 9. Finland standsout, with a 50:50 division between centralized intelligence units and outside units.Mexico represents the other extreme, with only 14 percent of intelligence activitiesperformed outside of centralized corporate units. In Brazil, Mexico, Norway, andSwitzerland, greater than 75 percent of intelligence activities were conducted within acentralized unit.
3.1.6 LOCATION OF INFORMATION PROCESSING
In large companies operating in the national markets under study, 70 percent of information processing was performed in-house while the rest was outsourced. Exhibit 8 displays the location of information processing in each market. In Mexico,
52 percent of information processing was done in-house. In other markets the distinction was far greater, with Germany representing one extreme where as much as 83 percent of information refining was conducted in-house.
GIA White Paper 4/2005 Competitive Intelligence in Large Companies - Global Study 14
Note: Overall average shown by orange line.
11
GIA White Paper 4/2005 Competitive Intelligence in Large Companies – GlobalStudy
Exhibit 9. Location of In-House Information Processing in Each Market
0 %
10 %
20 %
30 %
40 %
50 %
60 %
70 %
80 %
90 %
100 %
Asi
a-P
acifi
c
Bra
zil
Can
ada
Finl
and
Ger
man
y
Mex
ico
Net
herla
nds
Nor
way
Sw
itzer
land
In centralized unit Outside centralized unit
Exhibit 9. Location of In-House Information Processing in Each Market
0 %
10 %
20 %
30 %
40 %
50 %
60 %
70 %
80 %
90 %
100 %
Asi
a-P
acifi
c
Bra
zil
Can
ada
Finl
and
Ger
man
y
Mex
ico
Net
herla
nds
Nor
way
Sw
itzer
land
In centralized unit Outside centralized unit
Note: Overall average shown by orange line.
To conclude, intelligence activities were usually performed in-house and this in-house processing was usually done within a centralized unit.
3.1.7 UTILIZATION OF INTERNAL COMPETITIVE INTELLIGENCEAND TACIT MARKET KNOWLEDGE
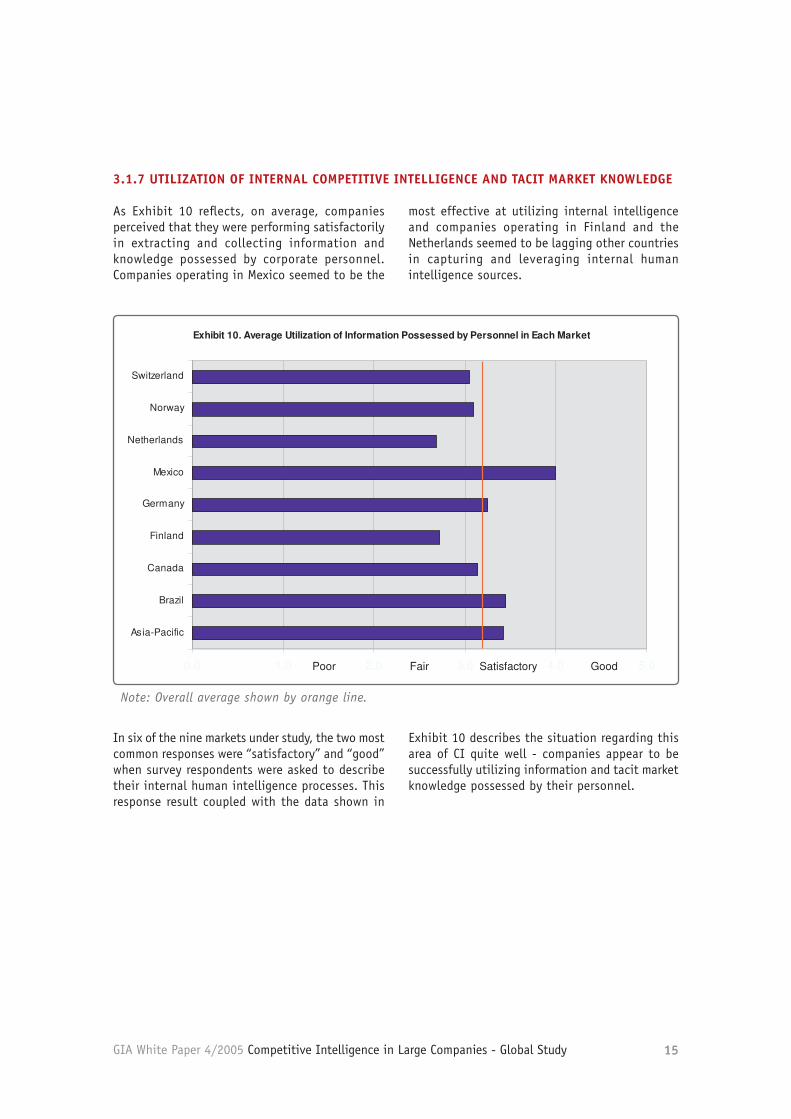
As Exhibit 10 reflects, on average, companies perceived that they were performingsatisfactorily in extracting and collecting information and knowledge possessed bycorporate personnel. Companies operating in Mexico seemed to be the mosteffective at utilizing internal intelligence and companies operating in Finland and theNetherlands seemed to be lagging other countries in capturing and leveraginginternal human intelligence sources.
On average, 71 percent of in-house intelligence activities were conducted in a centralized unit. The market-specific situation is shown in Exhibit 9. Finland stands out, with a 50:50 division between centralized intelligence units and outside units. Mexico represents the other extreme, with only 14 percent of intelligence activities performed outside of centralized corporate units. In Brazil,
Mexico, Norway, and Switzerland, greater than 75 percent of intelligence activities were conducted within a centralized unit.
To conclude, intelligence activities were usually performed in-house and this in-house processing was usually done within a centralized unit.
GIA White Paper 4/2005 Competitive Intelligence in Large Companies - Global Study 15
In six of the nine markets under study, the two most common responses were “satisfactory” and “good” when survey respondents were asked to describe their internal human intelligence processes. This response result coupled with the data shown in
Exhibit 10 describes the situation regarding this area of CI quite well - companies appear to be successfully utilizing information and tacit market knowledge possessed by their personnel.
Note: Overall average shown by orange line.
12
GIA White Paper 4/2005 Competitive Intelligence in Large Companies – GlobalStudy
Exhibit 10. Average Utilization of Information Possessed by Personnel in Each Market
0.0 1.0 2.0 3.0 4.0 5.0
Asia-Pacific
Brazil
Canada
Finland
Germany
Mexico
Netherlands
Norway
Switzerland
Poor Fair Satisfactory Good
Exhibit 10. Average Utilization of Information Possessed by Personnel in Each Market
0.0 1.0 2.0 3.0 4.0 5.0
Asia-Pacific
Brazil
Canada
Finland
Germany
Mexico
Netherlands
Norway
Switzerland
Poor Fair Satisfactory Good
Note: Overall average shown by orange line.
In six of the nine markets under study, the two most common responses were“satisfactory” and “good” when survey respondents were asked to describe theirinternal human intelligence processes. This response result coupled with the datashown in Exhibit 10 describes the situation regarding this area of CI quite well -companies appear to be successfully utilizing information and tacit market knowledgepossessed by their personnel.
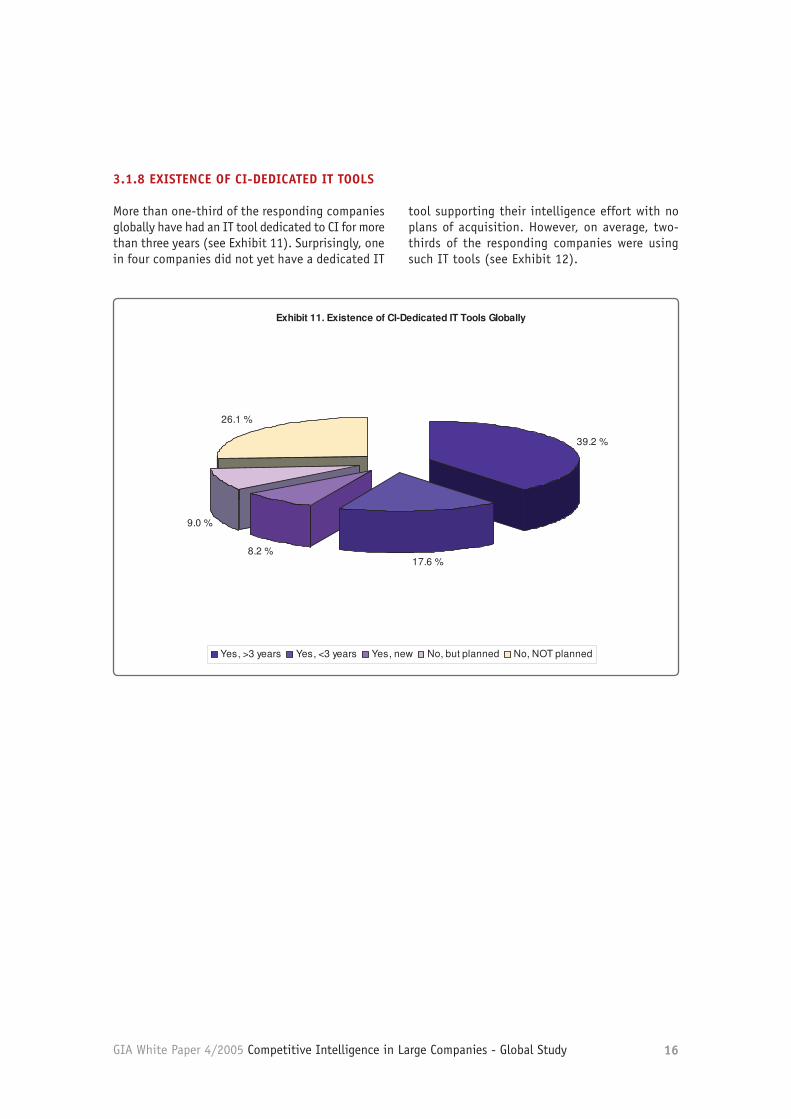
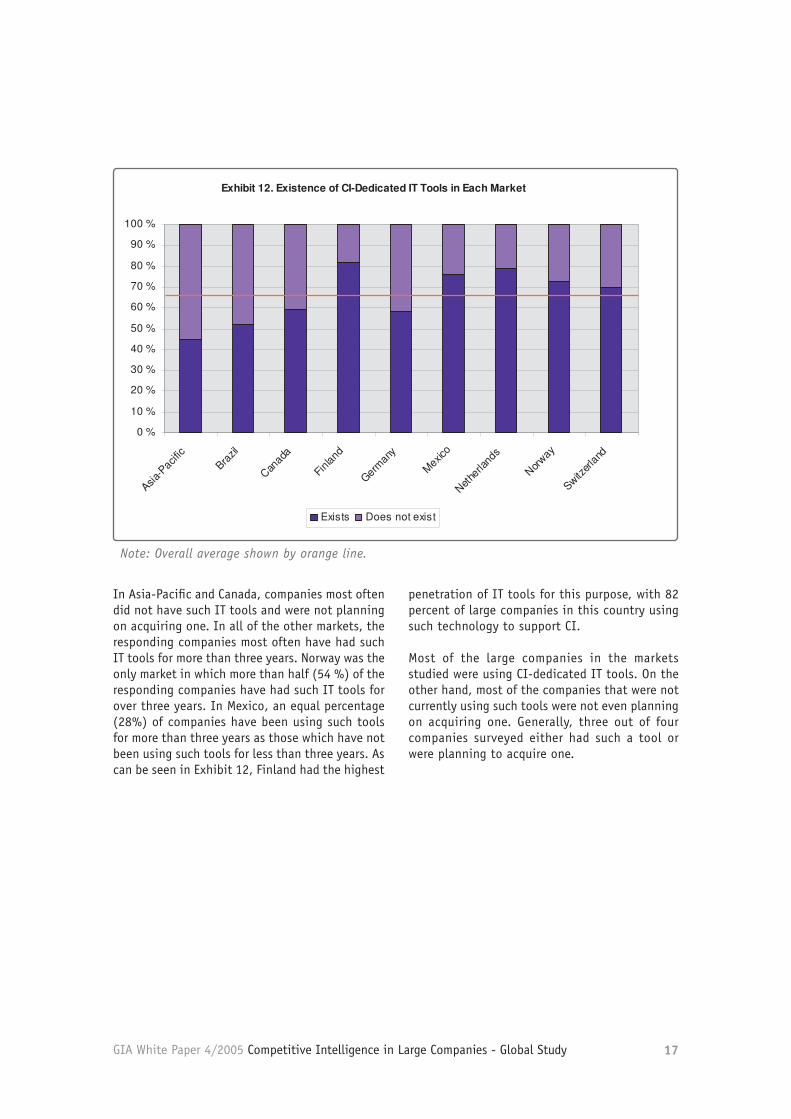
3.1.8 EXISTENCE OF CI-DEDICATED IT TOOLSMore than one-third of the responding companies globally have had an IT tooldedicated to CI for more than three years (see Exhibit 11). Surprisingly, one in fourcompanies did not yet have a dedicated IT tool supporting their intelligence effort withno plans of acquisition. However, on average, two-thirds of the respondingcompanies were using such IT tools (see Exhibit 12).
3.1.7 UTILIZATION OF INTERNAL COMPETITIVE INTELLIGENCE AND TACIT MARKET KNOWLEDGE
As Exhibit 10 reflects, on average, companies perceived that they were performing satisfactorily in extracting and collecting information and knowledge possessed by corporate personnel. Companies operating in Mexico seemed to be the
most effective at utilizing internal intelligence and companies operating in Finland and the Netherlands seemed to be lagging other countries in capturing and leveraging internal human intelligence sources.
GIA White Paper 4/2005 Competitive Intelligence in Large Companies - Global Study 16
13
GIA White Paper 4/2005 Competitive Intelligence in Large Companies – GlobalStudy
Exhibit 11. Existence of CI-Dedicated IT Tools Globally
39.2 %
17.6 %8.2 %
9.0 %
26.1 %
Yes, >3 years Yes, <3 years Yes, new No, but planned No, NOT planned
In Asia-Pacific and Canada, companies most often did not have such IT tools andwere not planning on acquiring one. In all of the other markets, the respondingcompanies most often have had such IT tools for more than three years. Norway wasthe only market in which more than half (54 %) of the responding companies havehad such IT tools for over three years. In Mexico, an equal percentage (28%) ofcompanies have been using such tools for more than three years as those whichhave not been using such tools for less than three years. As can be seen in Exhibit12, Finland had the highest penetration of IT tools for this purpose, with 82 percent oflarge companies in this country using such technology to support CI.
3.1.8 EXISTENCE OF CI-DEDICATED IT TOOLS
More than one-third of the responding companies globally have had an IT tool dedicated to CI for more than three years (see Exhibit 11). Surprisingly, one in four companies did not yet have a dedicated IT
tool supporting their intelligence effort with no plans of acquisition. However, on average, two-thirds of the responding companies were using such IT tools (see Exhibit 12).
GIA White Paper 4/2005 Competitive Intelligence in Large Companies - Global Study 17
Note: Overall average shown by orange line.
14
GIA White Paper 4/2005 Competitive Intelligence in Large Companies – GlobalStudy
Exhibit 12. Existence of CI-Dedicated IT Tools in Each Market
0 %
10 %
20 %
30 %
40 %
50 %
60 %
70 %
80 %
90 %
100 %
Asia-Pacific
Brazil
Canada
Finland
Germany
Mexico
Netherlands
Norway
Switzerla
nd
Exists Does not exist
Exhibit 12. Existence of CI-Dedicated IT Tools in Each Market
0 %
10 %
20 %
30 %
40 %
50 %
60 %
70 %
80 %
90 %
100 %
Asia-Pacific
Brazil
Canada
Finland
Germany
Mexico
Netherlands
Norway
Switzerla
nd
Exists Does not exist
Note: Overall average shown by orange line.
Most of the large companies in the markets studied were using CI-dedicated IT tools.On the other hand, most of the companies that were not currently using such toolswere not even planning on acquiring one. Generally, three out of four companiessurveyed either had such a tool or were planning to acquire one.
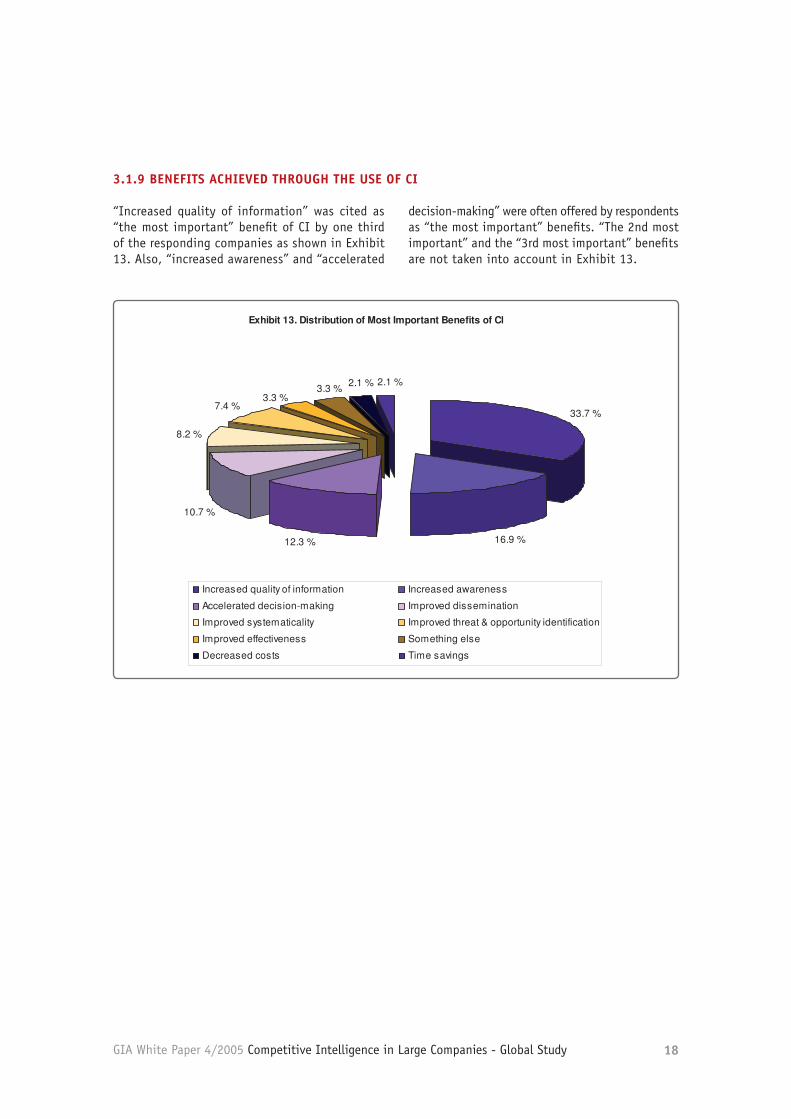
3.1.9 BENEFITS ACHIEVED THROUGH THE USE OF CI“Increased quality of information” was cited as “the most important” benefit of CI byone third of the responding companies as shown in Exhibit 13. Also, “increasedawareness” and “accelerated decision-making” were often offered by respondents as“the most important” benefits. “The 2nd most important” and the “3rd most important”benefits are not taken into account in Exhibit 13.
In Asia-Pacific and Canada, companies most often did not have such IT tools and were not planning on acquiring one. In all of the other markets, the responding companies most often have had such IT tools for more than three years. Norway was the only market in which more than half (54 %) of the responding companies have had such IT tools for over three years. In Mexico, an equal percentage (28%) of companies have been using such tools for more than three years as those which have not been using such tools for less than three years. As can be seen in Exhibit 12, Finland had the highest
penetration of IT tools for this purpose, with 82 percent of large companies in this country using such technology to support CI.
Most of the large companies in the markets studied were using CI-dedicated IT tools. On the other hand, most of the companies that were not currently using such tools were not even planning on acquiring one. Generally, three out of four companies surveyed either had such a tool or were planning to acquire one.
GIA White Paper 4/2005 Competitive Intelligence in Large Companies - Global Study 18
15
GIA White Paper 4/2005 Competitive Intelligence in Large Companies – GlobalStudy
Exhibit 13. Distribution of Most Important Benefits of CI Globally
33.7 %
16.9 %12.3 %
10.7 %
8.2 %
7.4 %
2.1 %2.1 %3.3 %3.3 %
Increased quality of information Increased awareness
Accelerated decision-making Improved dissemination
Improved systematicality Improved threat & opportunity identification
Improved effectiveness Something else
Decreased costs Time savings
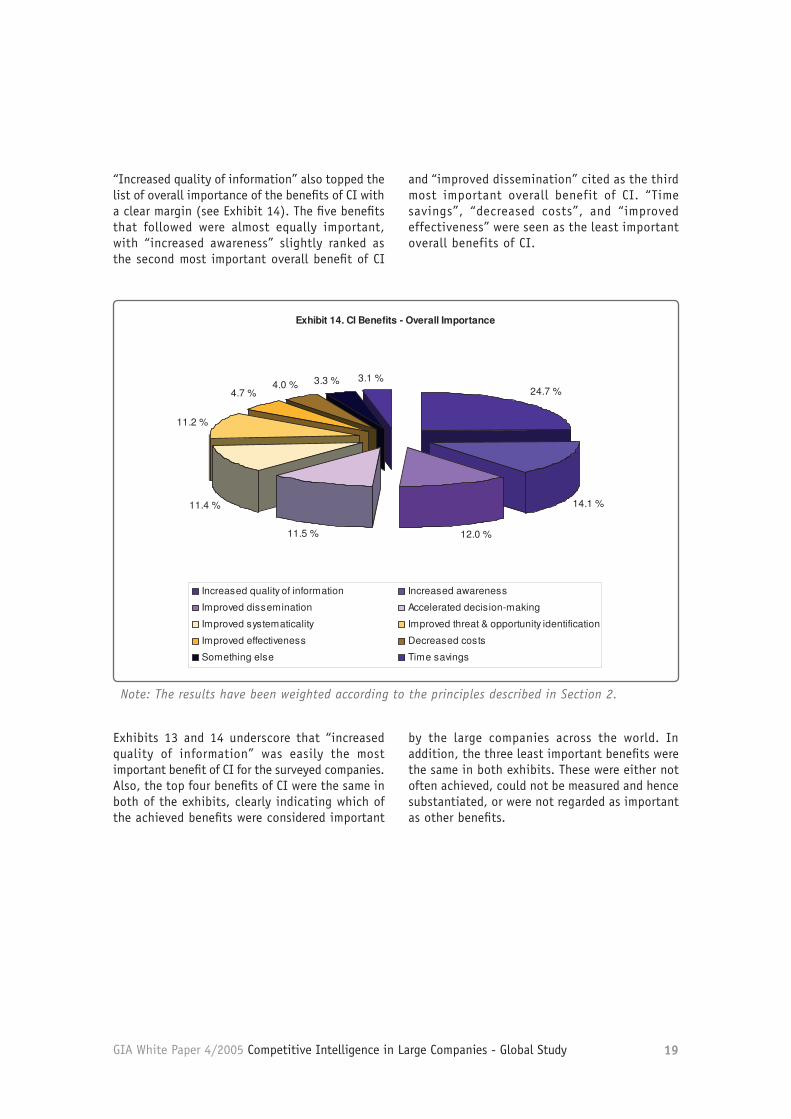
“Increased quality of information” also topped the list of overall importance of thebenefits of CI with a clear margin (see Exhibit 14). The five benefits that followedwere almost equally important, with “increased awareness” slightly ranked as thesecond most important overall benefit of CI and “improved dissemination” cited asthe third most important overall benefit of CI. “Time savings”, “decreased costs”, and“improved effectiveness” were seen as the least important overall benefits of CI.
3.1.9 BENEFITS ACHIEVED THROUGH THE USE OF CI
“Increased quality of information” was cited as “the most important” benefit of CI by one third of the responding companies as shown in Exhibit 13. Also, “increased awareness” and “accelerated
decision-making” were often offered by respondents as “the most important” benefits. “The 2nd most important” and the “3rd most important” benefits are not taken into account in Exhibit 13.
GIA White Paper 4/2005 Competitive Intelligence in Large Companies - Global Study 19
Exhibits 13 and 14 underscore that “increased quality of information” was easily the most important benefit of CI for the surveyed companies. Also, the top four benefits of CI were the same in both of the exhibits, clearly indicating which of the achieved benefits were considered important
by the large companies across the world. In addition, the three least important benefits were the same in both exhibits. These were either not often achieved, could not be measured and hence substantiated, or were not regarded as important as other benefits.
Note: The results have been weighted according to the principles described in Section 2.
16
GIA White Paper 4/2005 Competitive Intelligence in Large Companies – GlobalStudy
Exhibit 14. CI Benefits - Overall Importance
24.7 %
14.1 %
12.0 %11.5 %
11.4 %
11.2 %
4.7 %4.0 % 3.3 % 3.1 %
Increased quality of information Increased awareness
Improved dissemination Accelerated decision-making
Improved systematicality Improved threat & opportunity identification
Improved effectiveness Decreased costs
Something else Time savings
Note: The results have been weighted according to the principles described in Section 2.
Exhibits 13 and 14 underscore that “increased quality of information” was easily themost important benefit of CI for the surveyed companies. Also, the top four benefitsof CI were the same in both of the exhibits, clearly indicating which of the achievedbenefits were considered important by the large companies across the world. Inaddition, the three least important benefits were the same in both exhibits. Thesewere either not often achieved, could not be measured and hence substantiated, orwere not regarded as important as other benefits.
3.2ORGANIZATION OF THE ACTIVITY
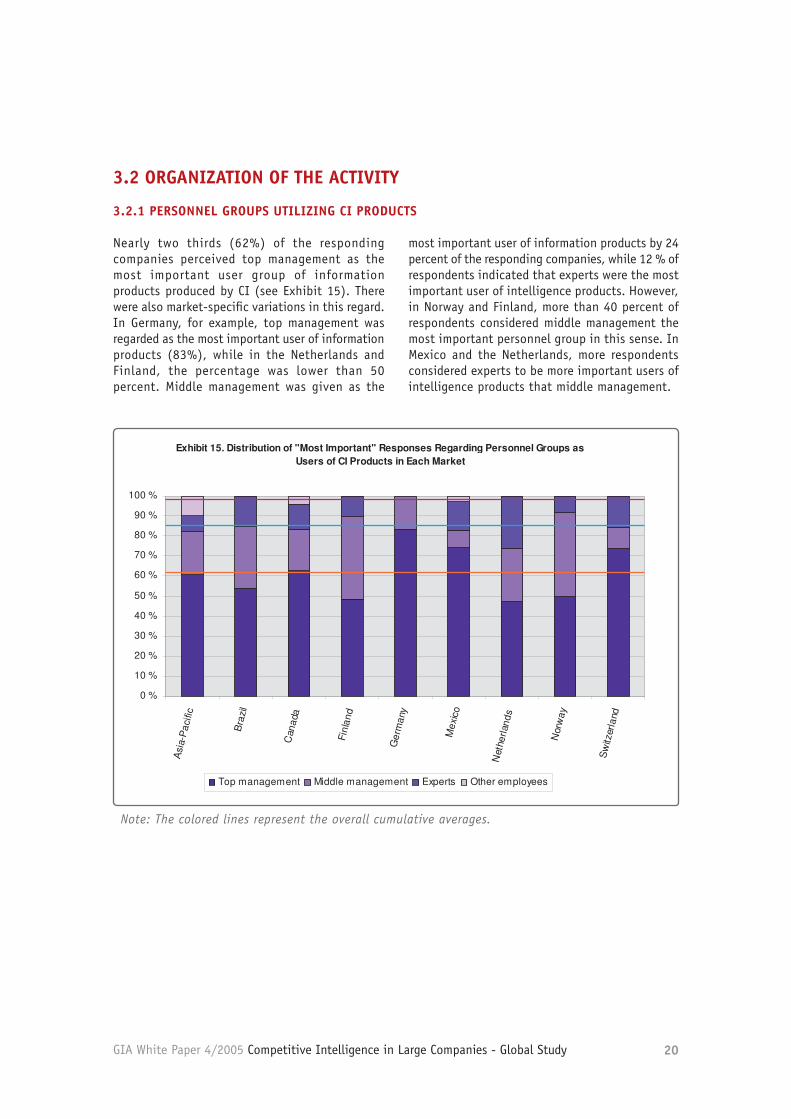
3.2.1 PERSONNEL GROUPS UTILIZING CI PRODUCTSNearly two thirds (62%) of the responding companies perceived top management asthe most important user group of information products produced by CI (see Exhibit15). There were also market-specific variations in this regard. In Germany, forexample, top management was regarded as the most important user of informationproducts (83%), while in the Netherlands and Finland, the percentage was lower than50 percent. Middle management was given as the most important user of informationproducts by 24 percent of the responding companies, while 12 % of respondentsindicated that experts were the most important user of intelligence products. However,in Norway and Finland, more than 40 percent of respondents considered middlemanagement the most important personnel group in this sense. In Mexico and theNetherlands, more respondents considered experts to be more important users ofintelligence products that middle management.
“Increased quality of information” also topped the list of overall importance of the benefits of CI with a clear margin (see Exhibit 14). The five benefits that followed were almost equally important, with “increased awareness” slightly ranked as the second most important overall benefit of CI
and “improved dissemination” cited as the third most important overall benefit of CI. “Time savings”, “decreased costs”, and “improved effectiveness” were seen as the least important overall benefits of CI.
GIA White Paper 4/2005 Competitive Intelligence in Large Companies - Global Study 20
Note: The colored lines represent the overall cumulative averages.
17
GIA White Paper 4/2005 Competitive Intelligence in Large Companies – GlobalStudy
Exhibit 15. Distribution of "Most Important" Responses Regarding Personnel Groups asUsers of CI Products in Each Market
0 %
10 %
20 %
30 %
40 %
50 %
60 %
70 %
80 %
90 %
100 %
Asi
a-P
acifi
c
Bra
zil
Can
ada
Finl
and
Ger
man
y
Mex
ico
Net
herla
nds
Nor
way
Sw
itzer
land
Top management Middle management Experts Other employees
Note: The colored lines represent the overall cumulative averages.
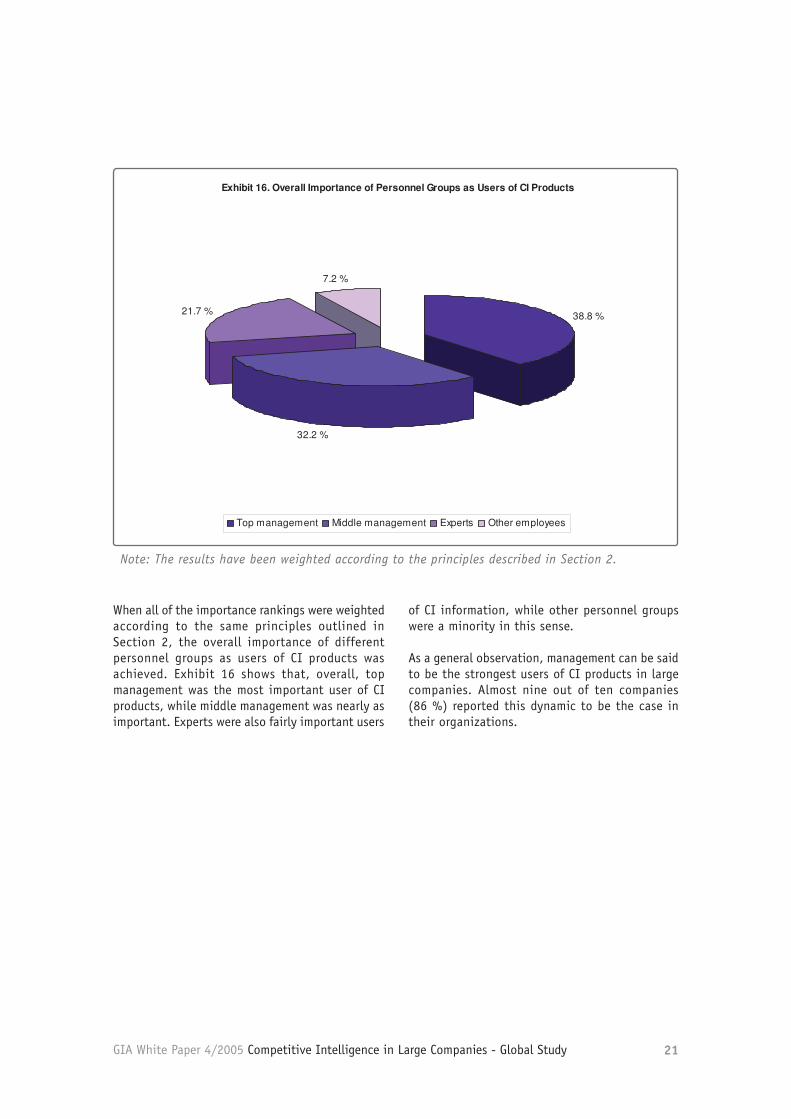
When all of the importance rankings were weighted according to the same principlesoutlined in Section 2, the overall importance of different personnel groups as users ofCI products was achieved. Exhibit 16 shows that, overall, top management was themost important user of CI products, while middle management was nearly asimportant. Experts were also fairly important users of CI information, while otherpersonnel groups were a minority in this sense.
Nearly two thirds (62%) of the responding companies perceived top management as the most important user group of information products produced by CI (see Exhibit 15). There were also market-specific variations in this regard. In Germany, for example, top management was regarded as the most important user of information products (83%), while in the Netherlands and Finland, the percentage was lower than 50 percent. Middle management was given as the
most important user of information products by 24 percent of the responding companies, while 12 % of respondents indicated that experts were the most important user of intelligence products. However, in Norway and Finland, more than 40 percent of respondents considered middle management the most important personnel group in this sense. In Mexico and the Netherlands, more respondents considered experts to be more important users of intelligence products that middle management.
3.2 ORGANIZATION OF THE ACTIVITY
3.2.1 PERSONNEL GROUPS UTILIZING CI PRODUCTS
GIA White Paper 4/2005 Competitive Intelligence in Large Companies - Global Study 21
Note: The results have been weighted according to the principles described in Section 2.
18
GIA White Paper 4/2005 Competitive Intelligence in Large Companies – GlobalStudy
Exhibit 16. Overall Importance of Personnel Groups as Users of CI Products
38.8 %
32.2 %
21.7 %
7.2 %
Top management Middle management Experts Other employees
Note: The results have been weighted according to the principles described in Section 2.
As a general observation, management can be said to be the strongest users of CIproducts in large companies. Almost nine out of ten companies (86 %) reported thisdynamic to be the case in their organizations.
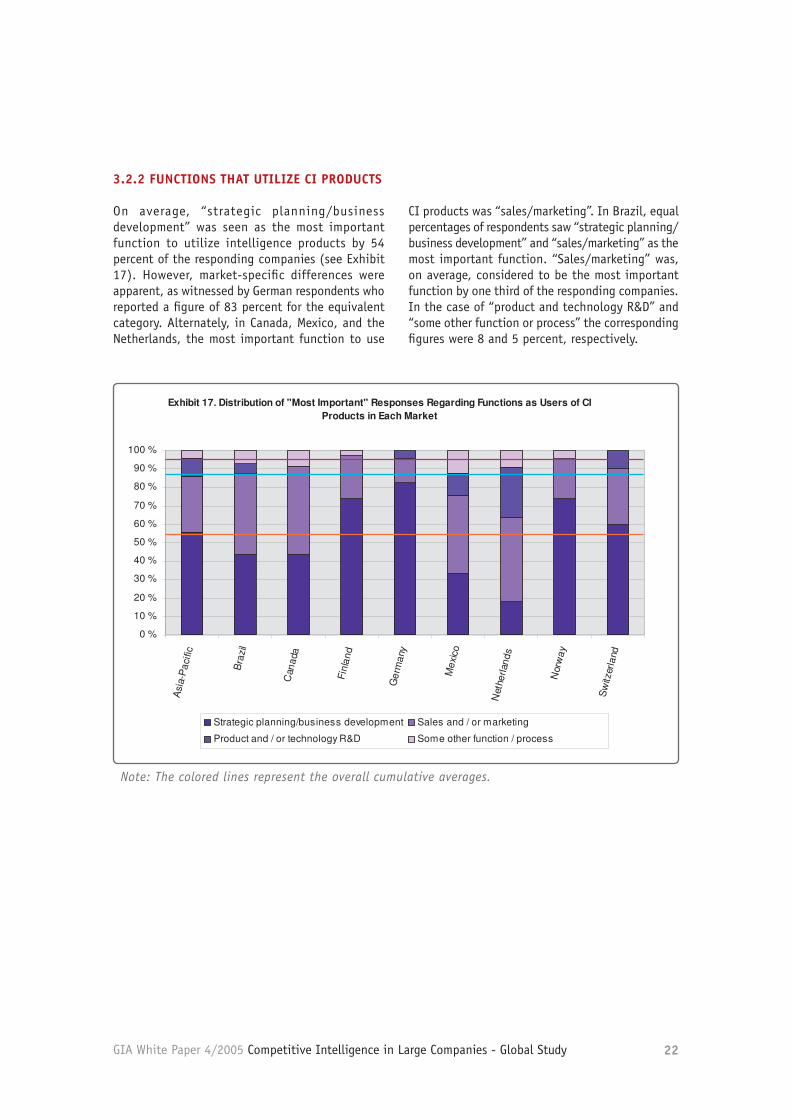
3.2.2 FUNCTIONS THAT UTILIZE CI PRODUCTSOn average, “strategic planning/business development” was seen as the mostimportant function to utilize intelligence products by 54 percent of the respondingcompanies (see Exhibit 17). However, market-specific differences were apparent, aswitnessed by German respondents who reported a figure of 83 percent for theequivalent category. Alternately, in Canada, Mexico, and the Netherlands, the mostimportant function to use CI products was “sales/marketing”. In Brazil, equalpercentages of respondents saw “strategic planning/business development” and“sales/marketing” as the most important function. “Sales/marketing” was, on average,considered to be the most important function by one third of the respondingcompanies. In the case of “product and technology R&D” and “some other function orprocess” the corresponding figures were 8 and 5 percent, respectively.
When all of the importance rankings were weighted according to the same principles outlined in Section 2, the overall importance of different personnel groups as users of CI products was achieved. Exhibit 16 shows that, overall, top management was the most important user of CI products, while middle management was nearly as important. Experts were also fairly important users
of CI information, while other personnel groups were a minority in this sense.
As a general observation, management can be said to be the strongest users of CI products in large companies. Almost nine out of ten companies (86 %) reported this dynamic to be the case in their organizations.
GIA White Paper 4/2005 Competitive Intelligence in Large Companies - Global Study 22
Note: The colored lines represent the overall cumulative averages.
19
GIA White Paper 4/2005 Competitive Intelligence in Large Companies – GlobalStudy
Exhibit 17. Distribution of "Most Important" Responses Regarding Functions as Users of CIProducts in Each Market
0 %
10 %
20 %
30 %
40 %
50 %
60 %
70 %
80 %
90 %
100 %
Asi
a-P
acifi
c
Bra
zil
Can
ada
Finl
and
Ger
man
y
Mex
ico
Net
herla
nds
Nor
way
Sw
itzer
land
Strategic planning/business development Sales and / or marketing
Product and / or technology R&D Some other function / process
Note: The colored lines represent the overall cumulative averages.
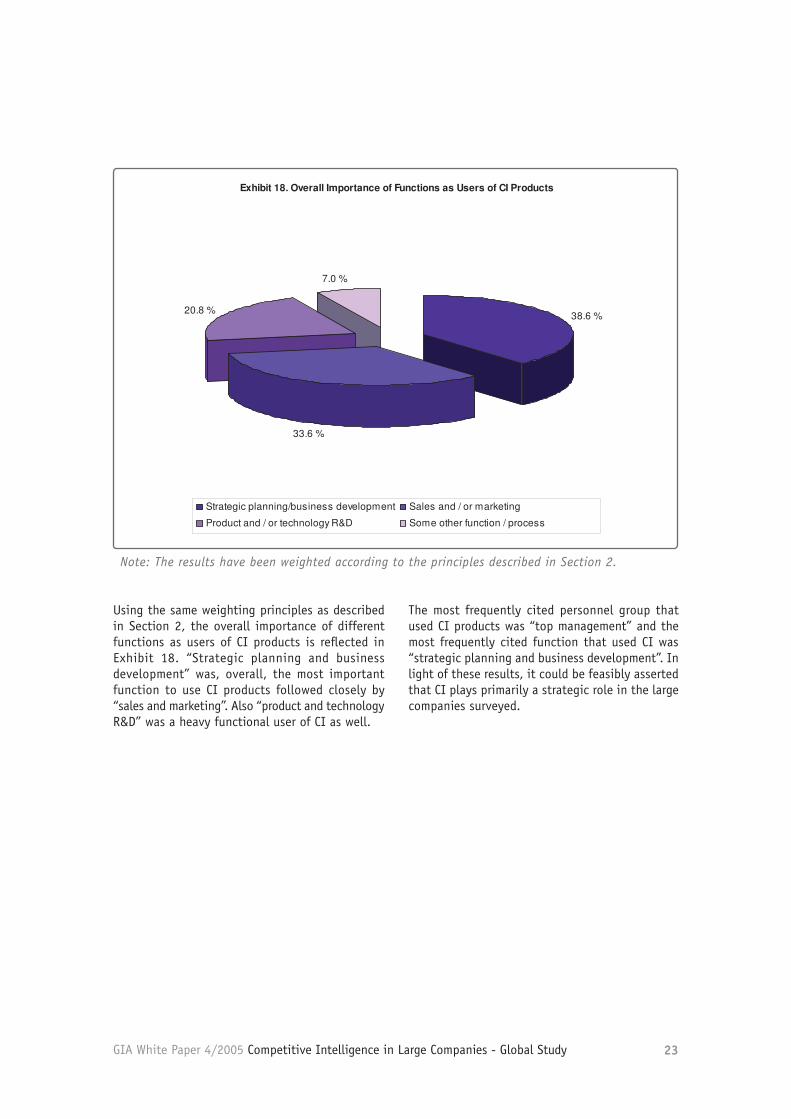
Using the same weighting principles as described in Section 2, the overallimportance of different functions as users of CI products is reflected in Exhibit 18.“Strategic planning and business development” was, overall, the most importantfunction to use CI products followed closely by “sales and marketing”. Also “productand technology R&D” was a heavy functional user of CI as well.
3.2.2 FUNCTIONS THAT UTILIZE CI PRODUCTS
On average, “strategic planning/business development” was seen as the most important function to utilize intelligence products by 54 percent of the responding companies (see Exhibit 17). However, market-specific differences were apparent, as witnessed by German respondents who reported a figure of 83 percent for the equivalent category. Alternately, in Canada, Mexico, and the Netherlands, the most important function to use
CI products was “sales/marketing”. In Brazil, equal percentages of respondents saw “strategic planning/business development” and “sales/marketing” as the most important function. “Sales/marketing” was, on average, considered to be the most important function by one third of the responding companies. In the case of “product and technology R&D” and “some other function or process” the corresponding figures were 8 and 5 percent, respectively.
GIA White Paper 4/2005 Competitive Intelligence in Large Companies - Global Study 23
Note: The results have been weighted according to the principles described in Section 2.
20
GIA White Paper 4/2005 Competitive Intelligence in Large Companies – GlobalStudy
Exhibit 18. Overall Importance of Functions as Users of CI Products
38.6 %
33.6 %
20.8 %
7.0 %
Strategic planning/business development Sales and / or marketing
Product and / or technology R&D Some other function / process
Note: The results have been weighted according to the principles described in Section 2.
The most frequently cited personnel group that used CI products was “topmanagement” and the most frequently cited function that used CI was “strategicplanning and business development”. In light of these results, it could be feasiblyasserted that CI plays primarily a strategic role in the large companies surveyed.
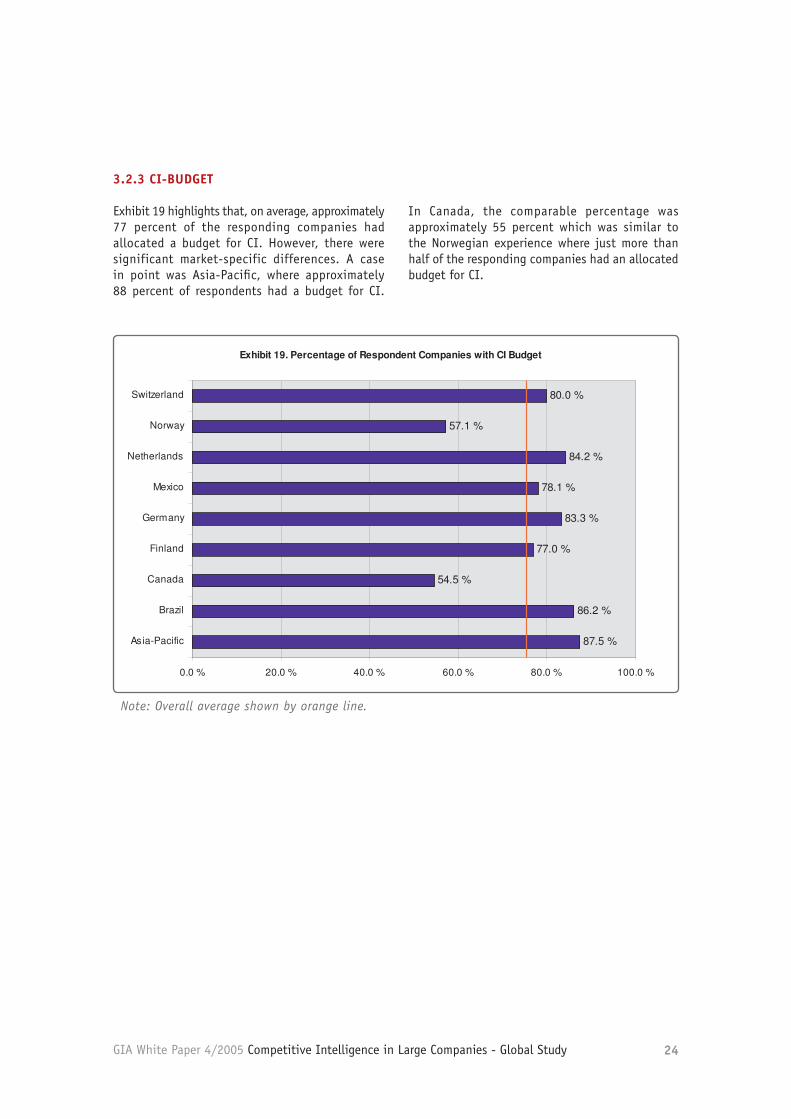
3.2.3 CI-BUDGETExhibit 19 highlights that, on average, approximately 77 percent of the respondingcompanies had allocated a budget for CI. However, there were significant market-specific differences. A case in point was Asia-Pacific, where approximately 88percent of respondents had a budget for CI. In Canada, the comparable percentagewas approximately 55 percent which was similar to the Norwegian experience wherejust more than half of the responding companies had an allocated budget for CI.
Using the same weighting principles as described in Section 2, the overall importance of different functions as users of CI products is reflected in Exhibit 18. “Strategic planning and business development” was, overall, the most important function to use CI products followed closely by “sales and marketing”. Also “product and technology R&D” was a heavy functional user of CI as well.
The most frequently cited personnel group that used CI products was “top management” and the most frequently cited function that used CI was “strategic planning and business development”. In light of these results, it could be feasibly asserted that CI plays primarily a strategic role in the large companies surveyed.
GIA White Paper 4/2005 Competitive Intelligence in Large Companies - Global Study 24
Note: Overall average shown by orange line.
21
GIA White Paper 4/2005 Competitive Intelligence in Large Companies – GlobalStudy
Exhibit 19. Percentage of Respondent Companies with CI Budget
87.5 %
86.2 %
54.5 %
77.0 %
83.3 %
78.1 %
84.2 %
57.1 %
80.0 %
0.0 % 20.0 % 40.0 % 60.0 % 80.0 % 100.0 %
Asia-Pacific
Brazil
Canada
Finland
Germany
Mexico
Netherlands
Norway
Switzerland
Exhibit 19. Percentage of Respondent Companies with CI Budget
87.5 %
86.2 %
54.5 %
77.0 %
83.3 %
78.1 %
84.2 %
57.1 %
80.0 %
0.0 % 20.0 % 40.0 % 60.0 % 80.0 % 100.0 %
Asia-Pacific
Brazil
Canada
Finland
Germany
Mexico
Netherlands
Norway
Switzerland
Note: Overall average shown by orange line.
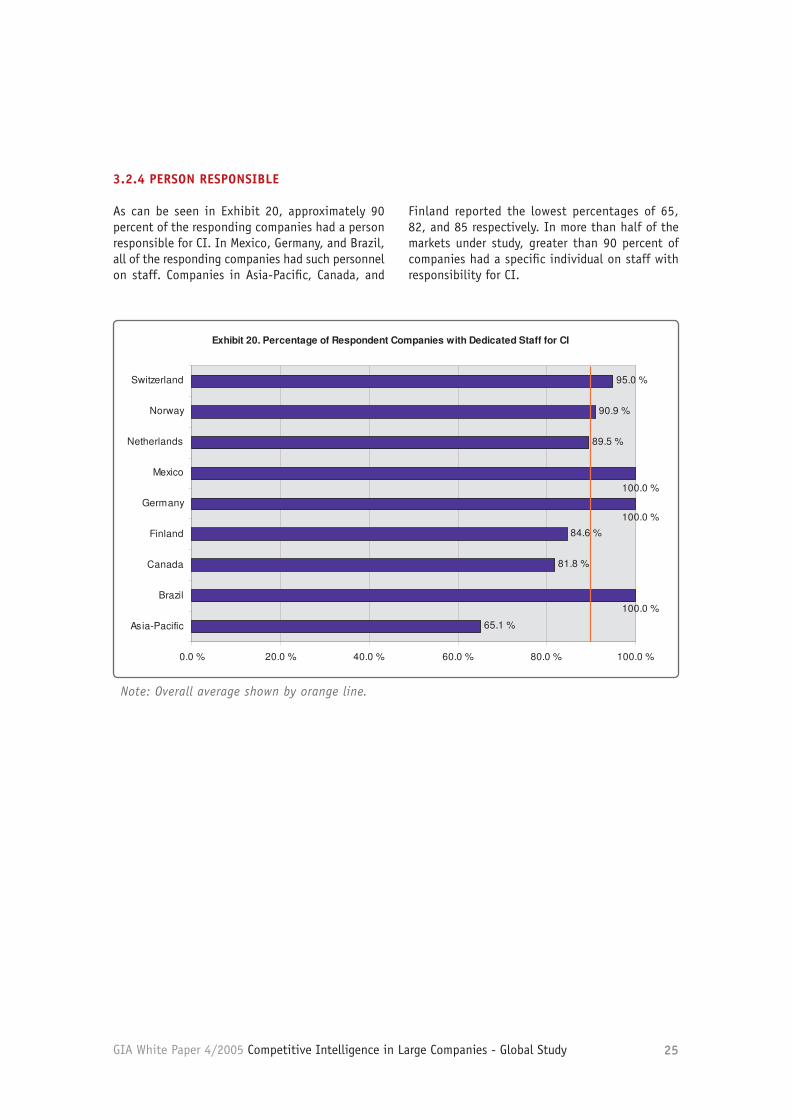
3.2.4 PERSON RESPONSIBLEAs can be seen in Exhibit 20, approximately 90 percent of the responding companieshad a person responsible for CI. In Mexico, Germany, and Brazil, all of theresponding companies had such personnel on staff. Companies in Asia-Pacific,Canada, and Finland reported the lowest percentages of 65, 82, and 85 respectively.In more than half of the markets under study, greater than 90 percent of companieshad a specific individual on staff with responsibility for CI.
3.2.3 CI-BUDGET
Exhibit 19 highlights that, on average, approximately 77 percent of the responding companies had allocated a budget for CI. However, there were significant market-specific differences. A case in point was Asia-Pacific, where approximately 88 percent of respondents had a budget for CI.
In Canada, the comparable percentage was approximately 55 percent which was similar to the Norwegian experience where just more than half of the responding companies had an allocated budget for CI.
GIA White Paper 4/2005 Competitive Intelligence in Large Companies - Global Study 25
Note: Overall average shown by orange line.
22
GIA White Paper 4/2005 Competitive Intelligence in Large Companies – GlobalStudy
Exhibit 20. Percentage of Respondent Companies with Dedicated Staff for CI
65.1 %
81.8 %
84.6 %
89.5 %
90.9 %
95.0 %
100.0 %
100.0 %
100.0 %
0.0 % 20.0 % 40.0 % 60.0 % 80.0 % 100.0 %
Asia-Pacific
Brazil
Canada
Finland
Germany
Mexico
Netherlands
Norway
Switzerland
Exhibit 20. Percentage of Respondent Companies with Dedicated Staff for CI
65.1 %
81.8 %
84.6 %
89.5 %
90.9 %
95.0 %
100.0 %
100.0 %
100.0 %
0.0 % 20.0 % 40.0 % 60.0 % 80.0 % 100.0 %
Asia-Pacific
Brazil
Canada
Finland
Germany
Mexico
Netherlands
Norway
Switzerland
Note: Overall average shown by orange line.
3.2.5 EMPLOYEES ALLOCATED TO CIAs Exhibit 21 shows, the median number of full-and part-time employees allocated toCI was, in general, quite low, especially taking into account the fact that theresponding companies were within the top 50 or top 100 in their respective markets.Asia-Pacific seemed to be the only exception, although the figure was somewhatdistorted by very high figures reported by some of the responding companies. Whenthe responses with figures exceeding 1,000 are left out of the equation, the medianfigures of full-and part-time employees dedicated to CI becomes 9 and 2.25,respectively. However, even after accounting for probable outlier statistics, thesepercentages are still notably higher than in the other markets.
In Norway, the median number of both full- and part-time employees was one.Finland had the second smallest number of full-time employees allocated to CI in theresponding companies, even though the total number was third highest. Germancompanies seemed to have fairly large intelligence units compared to other marketsunder study. However, German companies did not usually have anyone working part-time in CI. In less than half of the markets under study did companies employ part-time staff in CI (measured in median figures). Switzerland and Finland seem to beexceptional given their relative high proportion of part-time employees allocated to CI.
3.2.4 PERSON RESPONSIBLE
As can be seen in Exhibit 20, approximately 90 percent of the responding companies had a person responsible for CI. In Mexico, Germany, and Brazil, all of the responding companies had such personnel on staff. Companies in Asia-Pacific, Canada, and
Finland reported the lowest percentages of 65, 82, and 85 respectively. In more than half of the markets under study, greater than 90 percent of companies had a specific individual on staff with responsibility for CI.
GIA White Paper 4/2005 Competitive Intelligence in Large Companies - Global Study 26
Note: The orange and turquoise lines show the global median numbers of full-time and part-time employees, respectively.
23
GIA White Paper 4/2005 Competitive Intelligence in Large Companies – GlobalStudy
Exhibit 21. Full-Time and Part-Time Employee Allocation to CI
0
5
10
15
20
25
Asia-Pacific
Brazil
Canada
Finland
Germany
Mexico
Netherlands
Norway
Switzerla
nd
Full-time employees (median) Part-time employees (median)
Exhibit 21. Full-Time and Part-Time Employee Allocation to CI
0
5
10
15
20
25
Asia-Pacific
Brazil
Canada
Finland
Germany
Mexico
Netherlands
Norway
Switzerla
nd
Full-time employees (median) Part-time employees (median)
Note: The orange and turquoise lines show the global median numbers of full-time and part-time employees, respectively.
3.3 FUTURE OUTLOOK OF CI
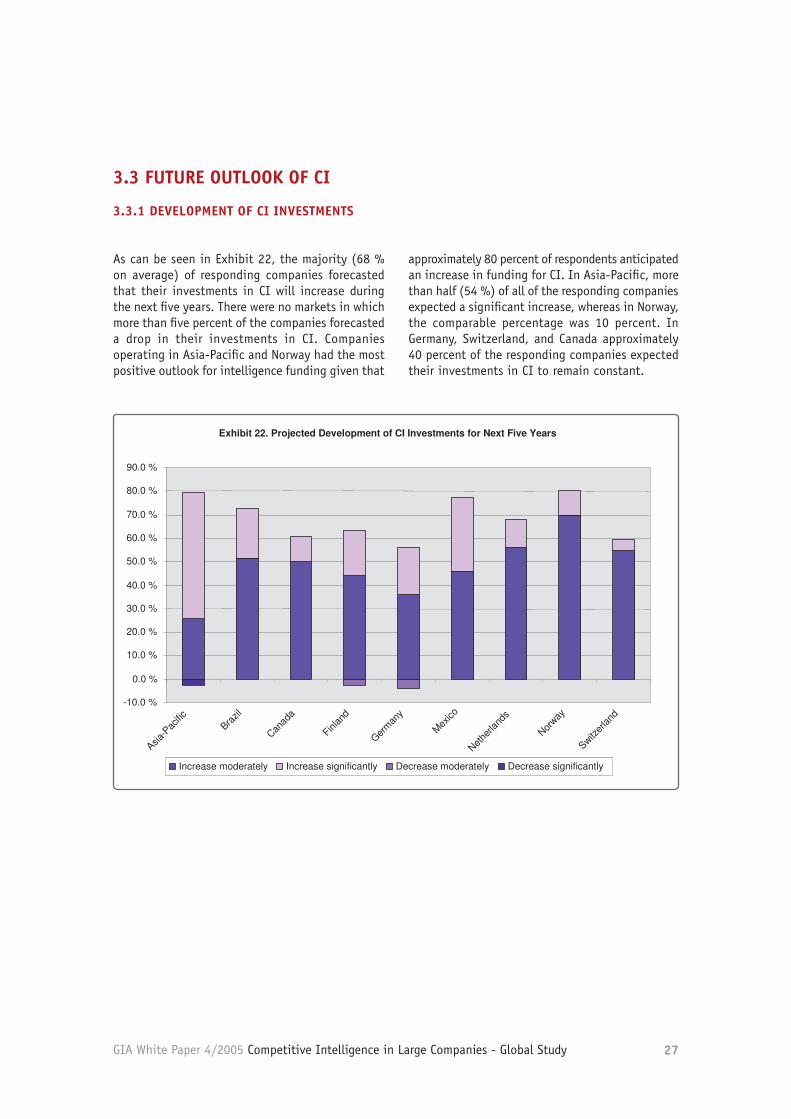
3.3.1DEVELOPMENT OF CI INVESTMENTSAs can be seen in Exhibit 22, the majority (68 % on average) of respondingcompanies forecasted that their investments in CI will increase during the next fiveyears. There were no markets in which more than five percent of the companiesforecasted a drop in their investments in CI. Companies operating in Asia-Pacific andNorway had the most positive outlook for intelligence funding given thatapproximately 80 percent of respondents anticipated an increase in funding for CI. InAsia-Pacific, more than half (54 %) of all of the responding companies expected asignificant increase, whereas in Norway, the comparable percentage was 10 percent.In Germany, Switzerland, and Canada approximately 40 percent of the respondingcompanies expected their investments in CI to remain constant.
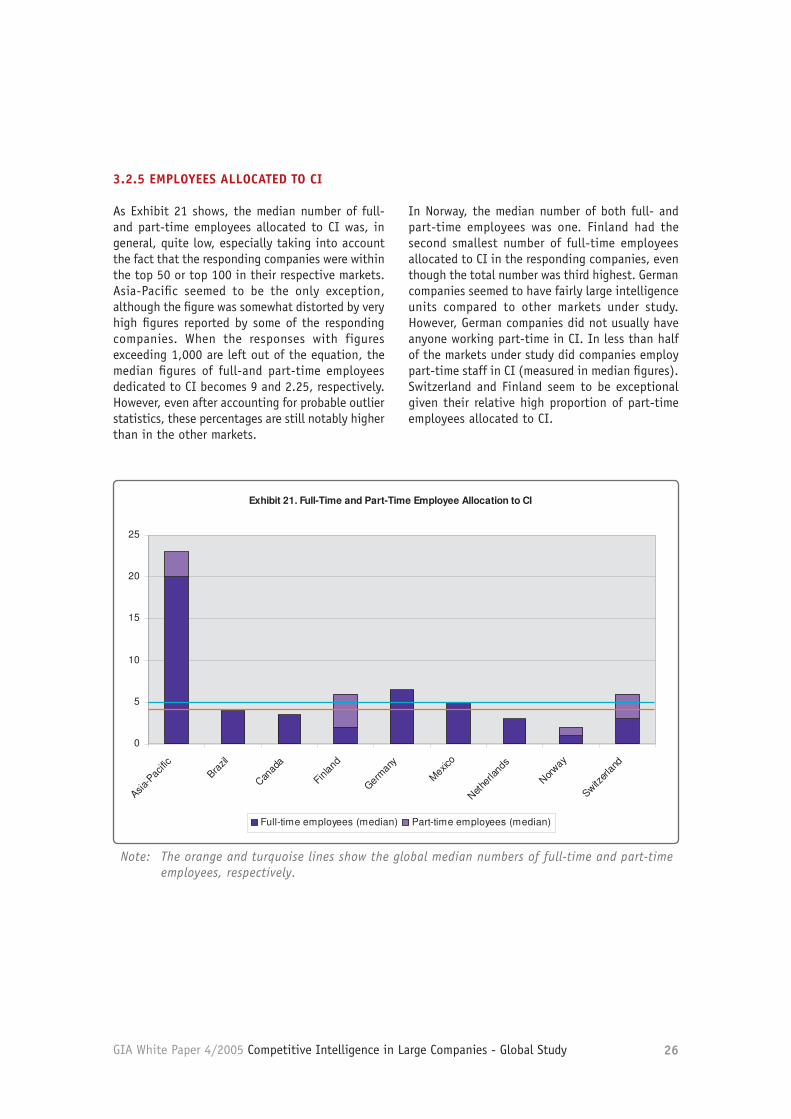
3.2.5 EMPLOYEES ALLOCATED TO CI
As Exhibit 21 shows, the median number of full-and part-time employees allocated to CI was, in general, quite low, especially taking into account the fact that the responding companies were within the top 50 or top 100 in their respective markets. Asia-Pacific seemed to be the only exception, although the figure was somewhat distorted by very high figures reported by some of the responding companies. When the responses with figures exceeding 1,000 are left out of the equation, the median figures of full-and part-time employees dedicated to CI becomes 9 and 2.25, respectively. However, even after accounting for probable outlier statistics, these percentages are still notably higher than in the other markets.
In Norway, the median number of both full- and part-time employees was one. Finland had the second smallest number of full-time employees allocated to CI in the responding companies, even though the total number was third highest. German companies seemed to have fairly large intelligence units compared to other markets under study. However, German companies did not usually have anyone working part-time in CI. In less than half of the markets under study did companies employ part-time staff in CI (measured in median figures). Switzerland and Finland seem to be exceptional given their relative high proportion of part-time employees allocated to CI.
GIA White Paper 4/2005 Competitive Intelligence in Large Companies - Global Study 27
24
GIA White Paper 4/2005 Competitive Intelligence in Large Companies – GlobalStudy
Exhibit 22. Projected Development of CI Investments for Next Five Years
-10.0 %
0.0 %
10.0 %
20.0 %
30.0 %
40.0 %
50.0 %
60.0 %
70.0 %
80.0 %
90.0 %
Asia-Pacific
Brazil
Canada
Finland
Germany
Mexico
Netherlands
Norway
Switzerla
nd
Increase moderately Increase significantly Decrease moderately Decrease significantly
Exhibit 22. Projected Development of CI Investments for Next Five Years
-10.0 %
0.0 %
10.0 %
20.0 %
30.0 %
40.0 %
50.0 %
60.0 %
70.0 %
80.0 %
90.0 %
Asia-Pacific
Brazil
Canada
Finland
Germany
Mexico
Netherlands
Norway
Switzerla
nd
Increase moderately Increase significantly Decrease moderately Decrease significantlyIncrease moderately Increase significantly Decrease moderately Decrease significantly
The responding companies appeared to value CI given their intentions to increasetheir investments in it. It might be inferred from this observed intention that the lowerthe projected investment growth, the higher the level of the activity already. However,there was not enough evidence to categorically state this as fact or even speculate itas probable.
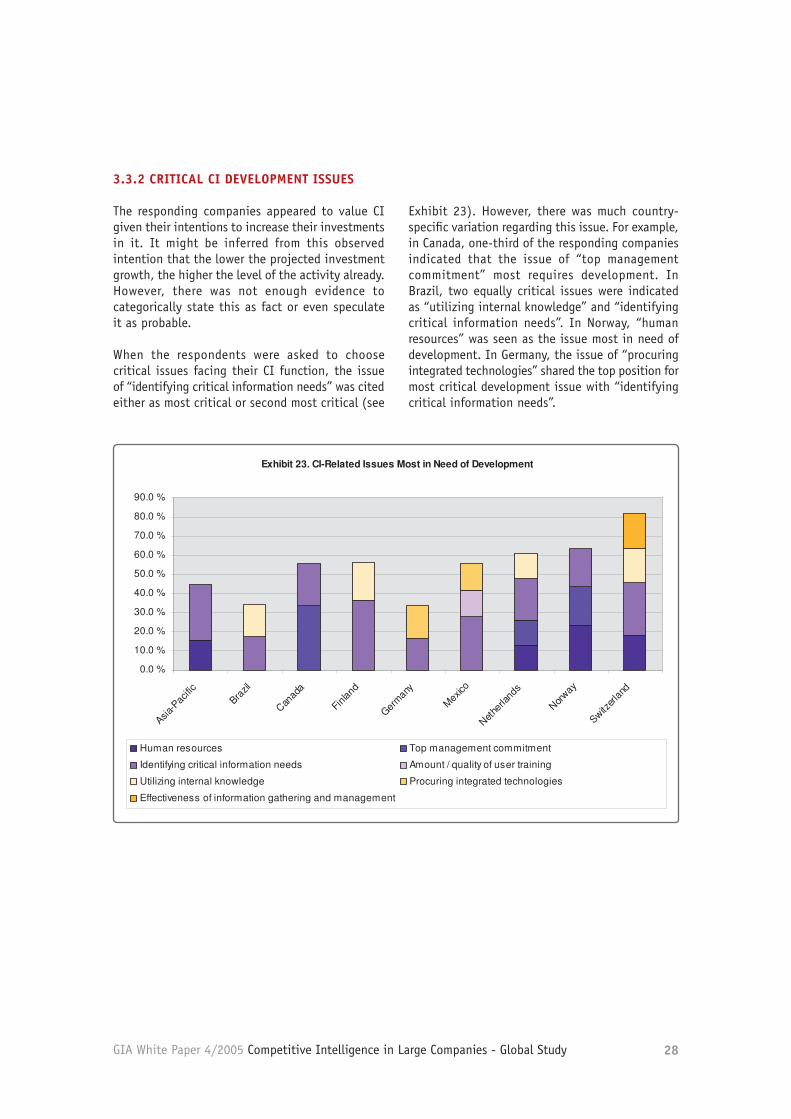
3.3.2 CRITICAL CI DEVELOPMENT ISSUESWhen the respondents were asked to choose critical issues facing their CI function,the issue of “identifying critical information needs” was cited either as most critical orsecond most critical (see Exhibit 23). However, there was much country-specificvariation regarding this issue. For example, in Canada, one-third of the respondingcompanies indicated that the issue of “top management commitment” most requiresdevelopment. In Brazil, two equally critical issues were indicated as “utilizing internalknowledge” and “identifying critical information needs”. In Norway, “humanresources” was seen as the issue most in need of development. In Germany, theissue of “procuring integrated technologies” shared the top position for most criticaldevelopment issue with “identifying critical information needs”.
As can be seen in Exhibit 22, the majority (68 % on average) of responding companies forecasted that their investments in CI will increase during the next five years. There were no markets in which more than five percent of the companies forecasted a drop in their investments in CI. Companies operating in Asia-Pacific and Norway had the most positive outlook for intelligence funding given that
approximately 80 percent of respondents anticipated an increase in funding for CI. In Asia-Pacific, more than half (54 %) of all of the responding companies expected a significant increase, whereas in Norway, the comparable percentage was 10 percent. In Germany, Switzerland, and Canada approximately 40 percent of the responding companies expected their investments in CI to remain constant.
3.3 FUTURE OUTLOOK OF CI
3.3.1 DEVELOPMENT OF CI INVESTMENTS
GIA White Paper 4/2005 Competitive Intelligence in Large Companies - Global Study 28
25
GIA White Paper 4/2005 Competitive Intelligence in Large Companies – GlobalStudy
Exhibit 23. CI-Related Issues Most in Need of Development
0.0 %
10.0 %
20.0 %
30.0 %
40.0 %
50.0 %
60.0 %
70.0 %
80.0 %
90.0 %
Asia-Pacific
Brazil
Canada
Finland
Germany
Mexico
Netherlands
Norway
Switzerla
nd
Human resources Top management commitment
Identifying critical information needs Amount / quality of user training
Utilizing internal knowledge Procuring integrated technologies
Effectiveness of information gathering and management
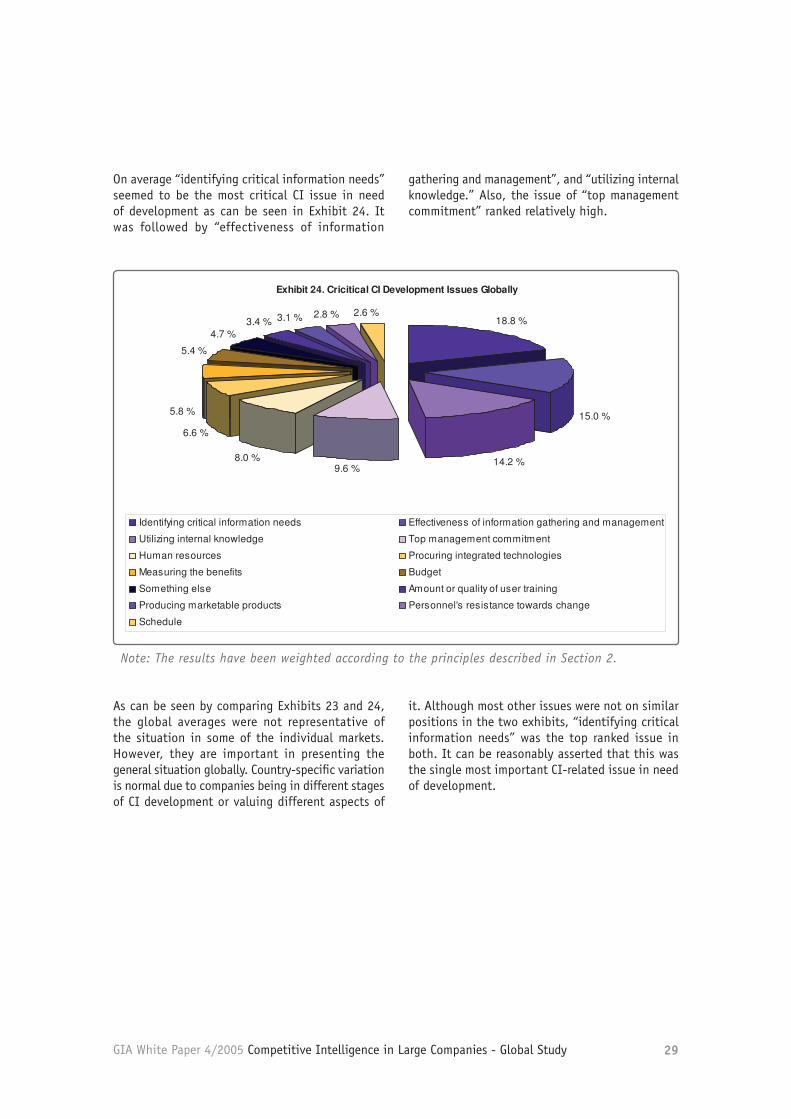
On average “identifying critical information needs” seemed to be the most critical CIissue in need of development as can be seen in Exhibit 24. It was followed by“effectiveness of information gathering and management”, and “utilizing internalknowledge.” Also, the issue of “top management commitment” ranked relatively high.
The responding companies appeared to value CI given their intentions to increase their investments in it. It might be inferred from this observed intention that the lower the projected investment growth, the higher the level of the activity already. However, there was not enough evidence to categorically state this as fact or even speculate it as probable.
When the respondents were asked to choose critical issues facing their CI function, the issue of “identifying critical information needs” was cited either as most critical or second most critical (see
Exhibit 23). However, there was much country-specific variation regarding this issue. For example, in Canada, one-third of the responding companies indicated that the issue of “top management commitment” most requires development. In Brazil, two equally critical issues were indicated as “utilizing internal knowledge” and “identifying critical information needs”. In Norway, “human resources” was seen as the issue most in need of development. In Germany, the issue of “procuring integrated technologies” shared the top position for most critical development issue with “identifying critical information needs”.
3.3.2 CRITICAL CI DEVELOPMENT ISSUES
GIA White Paper 4/2005 Competitive Intelligence in Large Companies - Global Study 29
As can be seen by comparing Exhibits 23 and 24, the global averages were not representative of the situation in some of the individual markets. However, they are important in presenting the general situation globally. Country-specific variation is normal due to companies being in different stages of CI development or valuing different aspects of
it. Although most other issues were not on similar positions in the two exhibits, “identifying critical information needs” was the top ranked issue in both. It can be reasonably asserted that this was the single most important CI-related issue in need of development.
26
GIA White Paper 4/2005 Competitive Intelligence in Large Companies – GlobalStudy
Exhibit 24. Cricitical CI Development Issues Globally
18.8 %
15.0 %
14.2 %9.6 %
8.0 %
6.6 %
5.8 %
5.4 %
4.7 %3.4 % 3.1 % 2.8 % 2.6 %
Identifying critical information needs Effectiveness of information gathering and management
Utilizing internal knowledge Top management commitment
Human resources Procuring integrated technologies
Measuring the benefits Budget
Something else Amount or quality of user training
Producing marketable products Personnel's resistance towards change
Schedule
Note: The results have been weighted according to the principles described in Section 2.
As can be seen by comparing Exhibits 23 and 24, the global averages were notrepresentative of the situation in some of the individual markets. However, they areimportant in presenting the general situation globally. Country-specific variation isnormal due to companies being in different stages of CI development or valuingdifferent aspects of it. Although most other issues were not on similar positions in thetwo exhibits, “identifying critical information needs” was the top ranked issue in both.It can be reasonably asserted that this was the single most important CI-related issuein need of development.
Note: The results have been weighted according to the principles described in Section 2.
On average “identifying critical information needs” seemed to be the most critical CI issue in need of development as can be seen in Exhibit 24. It was followed by “effectiveness of information
gathering and management”, and “utilizing internal knowledge.” Also, the issue of “top management commitment” ranked relatively high.
GIA White Paper 4/2005 Competitive Intelligence in Large Companies - Global Study 30
Almost nine in ten large-scale companies in various markets around the world used CI and on average had practiced it for three to five years. The CI units usually had four full-time employees and one part-time employee, with 88 percent of the companies also having named a person responsible for the activity. Nearly eight companies in ten had a CI budget and about two thirds were planning to increase their investments in the activity. These figures strongly indicate that CI was an established practice in large-scale companies in all continents.
CI also seemed to fill a primarily strategic role, with top management being the most important personnel user group of CI information products. Functionally, strategic planning and business development mimicked the results found for the personnel perspective. Continuous monitoring was seen as the most important CI element, with companies mainly focused on gathering information on competitors, customers, and their own industries. These three information needs can be seen forming the core of CI activity in large companies in markets around the world.
Most (70 %) of the information processing was done in-house, and 71 percent of it in a centralized unit. The large-scale companies were able to leverage tacit knowledge and market information possessed by internal personnel only satisfactorily. It was also one of the issues that needed the most development in addition to the issues of identifying critical information needs, and of gathering and managing information effectively. Practicing CI had most often benefited companies in the form of increased quality of information, increased general awareness, and improved threat and opportunity identification.
To conclude, this study asserts that CI was a fairly recently established, strategically active function in the large companies surveyed. The CI units were generally fairly small although most of the information processing was done internally. The companies that use CI were clearly reaping the benefits of the activity, although there were still some areas that need development. The core of CI activity was the continuous monitoring of competitors, customers, and companies’ own industry.
4. CONCLUSION
GIA White Paper 4/2005 Competitive Intelligence in Large Companies - Global Study 31
A. DEFINITION OF THE ACTIVITY
0. Is there a systematically organized activity to collect and analyze information regarding the external operating environment of your company?
a) Yes. Please, move to question no. 1. b) No. Please, answer the sub-questions below and move to question no. 17 on page 5.
I How do you keep up-to-date on the developments in your external operating environment? ______________________________________________________________ ______________________________________________________________ ______________________________________________________________
II Are you planning on launching an activity of this sort?a) Yes
I When? Why? Elaborate, please: _______________________________________________ _______________________________________________ _______________________________________________
b) No I Why not? Elaborate, please: _______________________________________________ _______________________________________________ _______________________________________________
1. What is the activity called? a) Business Intelligence b) Competitive Intelligence c) Competitor Intelligence d) Knowledge Management e) Market Intelligence f) Market Monitoring g) Market Research h) Market Analysis i) Something else, what?
2. For how long has the activity been systematically organized?a) Over 10 years b) 5–10 years c) 3–5 years d) 1–3 years e) Less than 1 year
o
o
o
o
o
o
o
o
o
o
o
o
o
o
o
o
o
o
APPENDIX 1 (1/6)
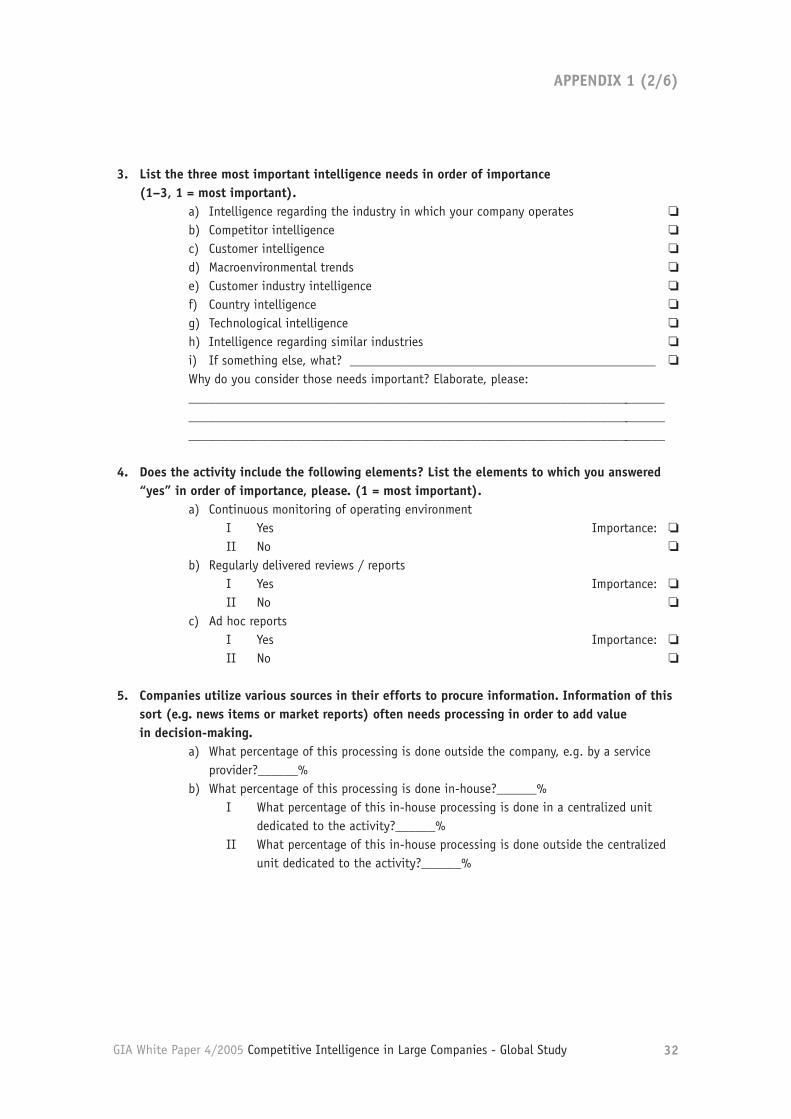
GIA White Paper 4/2005 Competitive Intelligence in Large Companies - Global Study 32
3. List the three most important intelligence needs in order of importance (1–3, 1 = most important).
a) Intelligence regarding the industry in which your company operates b) Competitor intelligence c) Customer intelligence d) Macroenvironmental trends e) Customer industry intelligence f) Country intelligence g) Technological intelligence h) Intelligence regarding similar industries i) If something else, what? ______________________________________________Why do you consider those needs important? Elaborate, please: ________________________________________________________________________________________________________________________________________________________________________________________________________________________
4. Does the activity include the following elements? List the elements to which you answered “yes” in order of importance, please. (1 = most important).
a) Continuous monitoring of operating environmentI Yes Importance:II No
b) Regularly delivered reviews / reportsI Yes Importance:II No
c) Ad hoc reportsI Yes Importance:II No
5. Companies utilize various sources in their efforts to procure information. Information of this sort (e.g. news items or market reports) often needs processing in order to add value in decision-making.
a) What percentage of this processing is done outside the company, e.g. by a service provider?______%b) What percentage of this processing is done in-house?______%
I What percentage of this in-house processing is done in a centralized unit dedicated to the activity?______%II What percentage of this in-house processing is done outside the centralized unit dedicated to the activity?______%
o
o
o
o
o
o
o
o
o
o
o
o
o
o
o
APPENDIX 1 (2/6)
GIA White Paper 4/2005 Competitive Intelligence in Large Companies - Global Study 33
6. Company personnel often have useful information about the external operating environment of the company. However, extracting and collecting this information in order to make it actionable can be a challenging task. In your opinion, how well have you been able to overcome this challenge?
a) Excellent b) Well c) Satisfactory d) Fair e) Poor What means do you use in extracting and collecting this information?________________________________________________________________________________________________________________________________________________________________________________________________________________________
7. Is there a data processing system / IT tool dedicated to the activity?a) Yes. Has been for more than 3 years b) Yes. Has been for less than 3 years c) Yes, a new one d) No, but is planned e) No and is not planned If you answered yes, briefly describe the purpose of use of this system / tool:________________________________________________________________________________________________________________________________________________
8. Please, list the three most important benefits gained through the activity in the order of importance (1 – 3, 1 = most important). Through the activity...
a) The general level of awareness has been increased b) The internal dissemination of information has been improved c) The decision-making processes have been accelerated d) The quality of information gained to support decision-making has been increasede) Cost savings have been achieved f) Time has been saved g) Activities have been made more effective (e.g. gathering overlapping information has been reduced/avoided) h) Gathering and analysis of information has been systematized i) Threat and opportunity identification has been improved j) Something else, what? _____________________________________________________________________ _____________________________________________________________________
o
o
o
o
o
o
o
o
o
o
o
o
o
o
o
o
o
o
o
o
APPENDIX 1 (3/6)
GIA White Paper 4/2005 Competitive Intelligence in Large Companies - Global Study 34
9. Give concrete examples on the ways your company assesses the benefits of the activity? _______________________________________________________________________________ _______________________________________________________________________________ _______________________________________________________________________________
B. ORGANIZATION OF THE ACTIVITY
a) How would you describe the organizational position of the unit in charge of the activity?
_____________________________________________________________________ _____________________________________________________________________
_____________________________________________________________________
b) How wide a responsibility does the unit have regarding the activity inside your company? (e.g. local, global, main responsibility etc.) _____________________________________________________________________
_____________________________________________________________________ _____________________________________________________________________
c) To which organizational level does the activity report to? _____________________________________________________________________ _____________________________________________________________________ _____________________________________________________________________
11. Which one(s) of the representatives of the following groups utilize the intelligence deliverables produced by the activity? Please, list the representatives of the groups in order of importance with regards to the utilization volume of the intelligence deliverables produced by the activity (1–3, 1 = most important).
a) Top managementI Yes Importance: II No
b) Middle managementI Yes Importance: II No
c) ExpertsI Yes Importance: II No
d) Other employeesI Yes Importance: II No
10.
o
o
o
o
o
o
o
o
APPENDIX 1 (4/6)
GIA White Paper 4/2005 Competitive Intelligence in Large Companies - Global Study 35
12. Which one(s) of the following functions utilizes the intelligence deliverables produced by the activity? Please, list the functions in order of importance in regard to the utilization volume of the intelligence products produced by the activity (1 – 3, 1 = most important).
a) Strategic planning / business developmentI Yes Importance: II No
b) Sales and / or marketingI Yes Importance: II No
c) Product and / or technology R&DI Yes Importance: II No
d) Some other function or process, what? ____________________________________________________________________
I Yes Importance: II No
13. Has a budget been allocated for the activity?a) Yes b) No
I If you answered no, where are the costs directed? _____________________________________________________________ _____________________________________________________________
14. Is there a person responsible for the activity? a) Yes
I If you answered yes, what is the title of the responsible person? _____________________________________________________________
b) No
15. How many full-time employees are allocated to the activity? _____ people
16. How many part-time employees are allocated to the activity? _____ people
C. THE FUTURE
17. Do you see the investment for the activity in the next five years as likely to...a) Increase significantly b) Increase moderately c) Remain the same d) Decrease moderately e) Decrease significantly
o
o
o
o
o
o
o
o
o
o
o
o
o
o
o
o
o
APPENDIX 1 (5/6)
GIA White Paper 4/2005 Competitive Intelligence in Large Companies - Global Study 36
18. Choose the three most important issues that need developing and list them in order of importance (1 – 3, 1 = the most important).
a) Staying on schedule b) Budget c) Mitigating the resistance of personnel to change d) Human resources e) Top management commitment f) Identifying critical information needs g) Amount of user training h) Utilizing internal knowledge i) Procuring appropriate, integrated technologies j) Effectiveness of information gathering and management k) Measuring the benefits of the activity l) Producing marketable products in the activity m) Something else, what?__________________________________________________
19. What kind of changes do you see taking place in the next five years regarding the activity? _______________________________________________________________________________
_______________________________________________________________________________ _______________________________________________________________________________
o
o
o
o
o
o
o
o
o
o
o
o
o
APPENDIX 1 (6/6)
GIA White Paper 4/2005 Competitive Intelligence in Large Companies - Global Study 37
The GIA White Paper series
1/2004 Introduction to Competitive Intelligence2/2004 Introduction to Strategic Intelligence3/2004 Measuring the Benefits of Competitive Intelligence4/2004 Key Success Factors of Competitive Intelligence1/2005 Developing an Intelligence System2/2005 Building Strategic Intelligence Capabilities through Scenario Planning3/2005 Recipe for Success in a Competitive Intelligence Intranet4/2005 Competitive Intelligence in Large Companies - Global Study
The Global Intelligence Alliance (GIA) is a global network of business research and Competitive Intelligence (CI) consulting companies. Leveraging its worldwide reach, the Global Intelligence Alliance provides multinational organizations with a single source for all CI requirements including: process consulting, intelligence services, education, and leading technology solutions.
For further information or assistance in any Competitive Intelligence-related matters, please contact the GIA Member company closest to You, or refer to the GIA website at www.globalintelligence.com.
About the GIAAdditional information about the Global Intelligence Alliance
Global Intelligence Alliance Group
Global Intelligence Alliance Australasia Level 12, 95 Pitt Street, Sydney, NSW 2000, Australia
Global Intelligence Alliance Latin America Rua Joaquim Floriano, 466 cj 306 – Itaim Bibi CEP: 04534-002 – São Paulo, SP, Brazil
Global Intelligence Alliance Canada 174 Spadina Avenue, Suite 302, Toronto, Ontario, M5T 2C2, Canada
GatewayBaltic Elizabetes 51, 1010 Riga, Latvia
Global Intelligence Alliance China Unit 2602, United Power International Plaza, 1158 Jiangning Road, Shanghai, 200060, P.R. China
Global Intelligence Alliance Finland Itämerenkatu 1, 00180 Helsinki, Finland
RV Conseil 48, rue des Moines - 75017 Paris, France
Global Intelligence Alliance Germany GmbH Dorotheenstraße 1, 45130 Essen, Germany
Global Intelligence Alliance Hong Kong 31/F, Tower One, Times Square, 1 Matheson Street, Causeway Bay, Hong Kong
McRBC Nogizaka Lilien Heim 601, 1-26-16, Minami-Aoyama, Minato-ku, Tokyo 107-0062 Japan
3mecca 6th F. Kyungjae Tongshin Bldg, 111 Junghak-dong, Jongno-gu, Seoul, Korea 110-150
Americas Market Intelligence (Mexico) Pestalozzi 923, Col. Del Valle Mexico, D.F. 03100 Mexico
Growth Setting Avenida Engenheiro Duarte Pacheco, Amoreiras, Torre 2, Piso 5, sala 9, 1070-102 Lisboa, Portugal
ALT Research & Consulting 105122, Tschelkovskoe shosse, 2, bld.1, Moscow, Russia
Global Intelligence Alliance Singapore 8 Eu Tong Sen Street, #23-81 The Central, Singapore 059818
Butterfl y Eff ect Intelligence North Block, Sheldon Place Offi ce Park, 5 Lone Close, Lonehill, South Africa
RV Conseil Tunisie 11, avenue 02 mars, Manouba, Tunisia
Global Intelligence Alliance UK 55 Old Broad Street, London EC2M 1RX, United Kingdom
Global Intelligence Alliance USA Inc. 1 Penn Plaza, 36th fl oor, New York, NY 10119, USA
Americas Market Intelligence 166 Alhambra Circle, Suite 200, Coral Gables, FL 33134, USA
Global Intelligence Alliance USA Inc. 8770 West Bryn Mawr Avenue, Suite 1300, Chicago, IL 60631, USA
+358-(0)[email protected]
+86-21-6279 [email protected]
+358-10-613-2000fi [email protected]
+ 33-1-42 29 56 [email protected]
+82-(0)[email protected]
+52-1-55-4345 [email protected]
+351-210-480 [email protected]
+7-495-788 59 [email protected]
+33-1-42-29-56-72 [email protected]
+1-305-458-2493usafl [email protected]
For more information, please visit www.globalintelligence.com or contact the GIA representative closest to you:
International
Australia
Brazil
Canada
Central & Eastern Europe
China
Finland
France
Germany
Hong Kong
Japan
South Korea
Mexico
Portugal
Russia
Singapore
South Africa
Tunisia
UK
USA East Coast
USA Florida
USA Midwest
© 2014 Global Intelligence Alliance. All rights reserved.
Glob
al In
telli
genc
e Al
lianc
e