competitiveness final1 andres villazon · pdf filedraft report: competitiveness of tropical...
TRANSCRIPT

Draft Report:
Competitiveness of Tropical
Timber Products at Major International Markets;
Trends and Opportunities for small and medium scale producers in developing
countries
by
R. Andrés Villazón M. FAO-FOIP Rome--Italy
Food and Agriculture Organization of the United Nations

Regional Study - The South Pacific
Forestry Products and Industry Division
Rome, June 2009
TABLE OF CONTENTS page
i. Executive Summary 2
ii. Abbreviations 4
1. Introduction 5
2. Competitiveness Definition 7
3. Description and Trends of major Markets: (products, competition,
consumption)
8
3.1. USA market 9
3.2. Japanese market 18
3.3. Chinese market 24
3.4. Italian market 31
3.5. French market 38
3.6. Iberian market 46
3.7. Main Markets Summary 55
4. International Transport of Tropical Timber Products 60
5. Opportunities for Tropical Producers: 64
5.1. Green Productivity and Green Supply Chain 65
5.2. Green Building Guidelines 67
5.3. Certification and Traceability 70
5.4. EU Action Plan for Forest Law Enforcement, Governance and
Trade FLEGT
72
5.5. E-commerce & E2Commerce 74
6. Conclusions 76
7. Recommendations 76
8. Bibliography 77

1
Executive Summary
This study focused on the following information:
1. Summarized data of tropical timber goods exchanges in and among major Global
Markets;
2. Summarized data of tropical timber competition at major global markets;
3. Main drivers of competitiveness and market demand;
4. Emerging drivers.
Trends of Major Markets:
U.S.:
Demand in the US market for wood-based goods is closely linked to the construction sector, which is based on new housing constructions and renovations
Severe reductions in emissions levels of urea formaldehyde are requested by California Air Resources Board (CARB) for MDF’s and hardwood plywood. CARB’s rules set different standards for each different type of board and phases of application, affecting the tropical plywood niche.
ASIA:
Demand of wooden goods in Japan’s market has changed over the historic period of time
Total demand of wood in Japan is decreasing at an average rate of 2% per year, since 2000
China’s wood products demand will continue to rise in line with the growth of population and income
Europe:
European purchasing power, especially Italy, becomes weaker and as a consequence, taxes to the government by young persons decrease, pension rates increase progressively and public spending constrains affects the entire economy
Today tropical timber is purchased by industrials and distributors, based on the merits of the inherent characteristics of each species
The French market is the most species-flexible of all tropical timber importing countries
Low levels of new constructions are expected in Spain and Portugal
Major Market Analysis
The six major markets analyzed have as a common issue the relation between housing and wood consumption

2
Imports of tropical roundwood have remained at low levels with a declining trend. Factors such as logs exports prohibition in supplier’s countries, environmental issues, high transportation costs, processing labour costs, lower prices and better qualities of non tropical logs are all contributing to this decline in trade of tropical logs.
Through all the traditional products (logs, sawnwood, furniture), plywood has remained more or less stable, and trends indicate it may remain that way; nevertheless, competition with cheaper raw materials is menacing these products.
Fuelwood is slowly increasing in major markets; it is a niche where some advantages could be taken for tropical fuelwood (pellets and charcoal for example).
decreasing log exchanges and increasing exchange in processed products have changed the way wood is transported (containerization of the timber-products trade)
Issues of environment and competitiveness are increasingly linked as never before
The Financial crisis is a key aspect to the house building demand
Opportunities
Certification (as CoC or SFM) is an important factor to open or maintain market’s niches. Production philosophies as the “green production” or fair trade would permit suppliers countries to reach competitiveness regarding environmental, social and economic issues. New requirements by main markets (Green Building codes, E2commerce) give the opportunity to open new market niches. Initiatives like the EU FLEGT provide opportunities as well as threats in the international market.
E-Commerce
China’s e-commerce development is a step behind compared to the European countries and the U.S.
E-commerce is expected to increase in the coming 6 years though actual economic crisis
E-customers will search for different key aspects, such as final prize, transportation costs and delivering times
The cross-border potential of e-commerce seems not to be fully exploited yet

3
ii. Abbreviations
APO: Asian Productivity Organization
B/L: Bill of Lading
CARB: California Air Resources Board
CoC: Chain of Custody
E2Commerce: Electronic-Eco-Commerce
E-Commerce: Electronic Commerce
EWP: Engineered wood products
FLEGT: Forest Law Enforcement, Governance and Trade
FSC: Forest Stewardship council
GP: Green Production
GSC: Green Supply Chain
ISO: International Standard Organization
ITTO: The International Tropical Timber Organization
MDF: Medium Density Fibreboard
PEFC: Pan European Forest Certification
SFI: Sustainable Forestry Initiative
SFM: Sustainable Forest Management
SPWP: Secondary Processed Wood Products
VOC: Volatile Organic Compound
WBP: Wood Based Products
VOC Volatile Organic Compound

4
1. Introduction
At the present time, trade in wood and woods products has increased at regional and global
levels. However, over the last decades these commodities are facing increased competition
from non-wood based materials, even in specific market segments where “wood” was
traditionally been consider as the main raw material.
For several of these wood products, the raw material supply comes mainly from timbers
harvested in tropical natural forests. Competition with other materials such as plastics or
metals, as well as competition with timbers from temperate and boreal regions is seriously
affecting wood products’ competitiveness, reducing the market share for tropical timbers
supply in niche markets (such as window and door frames, external decking, garden
furniture,...).
Competition among materials and competition between tropical and non-tropical timbers is
fully acceptable. However, a loss of competitiveness of forest-based products in general, in
particular those from the tropics, may have serious impacts on the financial viability of
sustainable forest management and particularly of natural forests in the tropics. This decreases
the attractiveness to maintain land under forest cover, especially of natural forests in tropical
countries, hence increasing deforestation pressures.
In order to understand the competitiveness of wood products, it is important to consider that
major market requirements (e.g. quality, quantity, prizes, etc) vary between products. Then it
is not possible to consider only standard-made goods. We also need to consider the fact that
suppliers’ ability to produce goods varies enormously among them too; therefore the global
wood market is a very complex matter to study.
Major global markets, most of the times, are far away from main suppliers. Then aspects of
international logistics are essential to describe when it comes to analyzing the competitiveness
of tropical timber goods.
Certification is another key issue for any trade in major timber markets, and data confirmed
that it is very important to encourage suppliers’ countries to fully complete processes of

5
certification in order to fulfil international requirements; remembering always to find a
balance between costs and prices.
Increasingly e-trade opens up the door to new ways of wood goods exchange, which should
be analyzed in order to understand future competitiveness regarding new e-commerce’s
philosophies.
Therefore this study is focusing on the following components:
1. Summarize data of tropical timber goods exchanges in major Global Markets
2. Summarize data of tropical timber competition in major global markets
3. Describe main aspects regarding competitiveness of major markets’ demand
4. Describe possibly new aspects of future major markets
6
3. Competitiveness Definition:
Regarding the main topic of this research, it is vital to clarify the competitiveness meaning.
Therefore according to Sasatani’s Working Paper (FAO 2008) definition, “competitiveness is
the ability to produce goods more inexpensively in the sector in a nation than the sectors in
other nations”; this definition is based on the productivity concept as the most important
variable of competitiveness.
A more applicable definition would be: “the degree to which a country can, under free and
fair market conditions, produce goods and services which meet the test of international
markets, while simultaneously maintaining and expanding the real incomes of its people over
the long term” (Garelli, 2001) in which it would be important to add the social aspect as
improvement of suppliers welfare conditions and low environmental impact, specially when
considering Forest issues.
Recent indicators of competitiveness make reference to prosperity that a country can achieve
and maintain over a period of time, and as explained by Sasatani (FAO 2008) “Those
indicators represent national overall competitiveness and may be very different from the
competitiveness of forest sectors in the nations because the importance of the forestry sector
is likely to be very different in different parts of the world.”
7
3. Description and Trends in Major Markets
In this report, six of the major world’s markets are reflected: U.S.A., Japan, China, Italy,
France and the Iberian Countries.
Most of the data is quoted from studies on tropical timber between 2005 and 2008 from ITTO
(China, Italy, France and the Iberian Countries) and FAO (U.S.A. and Japan).
The main sources used in this research are studies mentioned above, as well as the Euro-stat
internet database site, FAO database and UNECE internet website.
8
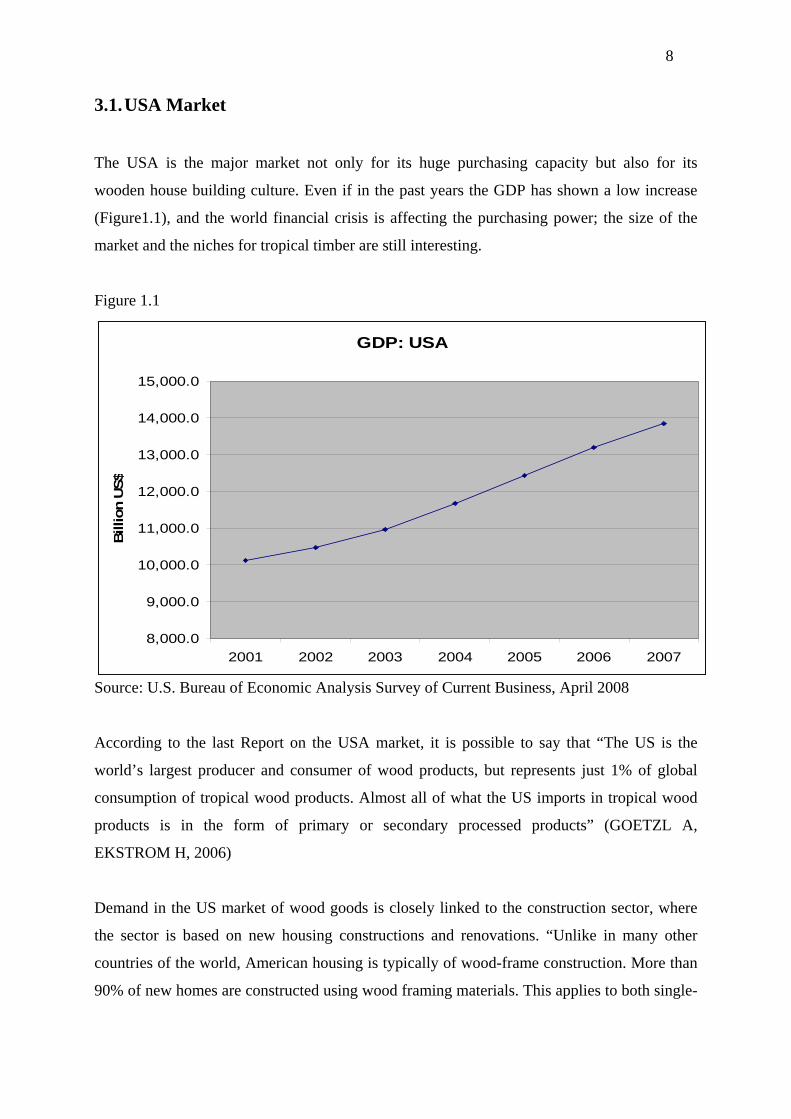
3.1. USA Market
The USA is the major market not only for its huge purchasing capacity but also for its
wooden house building culture. Even if in the past years the GDP has shown a low increase
(Figure1.1), and the world financial crisis is affecting the purchasing power; the size of the
market and the niches for tropical timber are still interesting.
Figure 1.1
GDP: USA
8,000.0
9,000.0
10,000.0
11,000.0
12,000.0
13,000.0
14,000.0
15,000.0
2001 2002 2003 2004 2005 2006 2007
Billion U
S$
Source: U.S. Bureau of Economic Analysis Survey of Current Business, April 2008
According to the last Report on the USA market, it is possible to say that “The US is the
world’s largest producer and consumer of wood products, but represents just 1% of global
consumption of tropical wood products. Almost all of what the US imports in tropical wood
products is in the form of primary or secondary processed products” (GOETZL A,
EKSTROM H, 2006)
Demand in the US market of wood goods is closely linked to the construction sector, where
the sector is based on new housing constructions and renovations. “Unlike in many other
countries of the world, American housing is typically of wood-frame construction. More than
90% of new homes are constructed using wood framing materials. This applies to both single-
9
family houses as well as multifamily units of four stories or less” ((GOETZL A, EKSTROM
H, 2006).
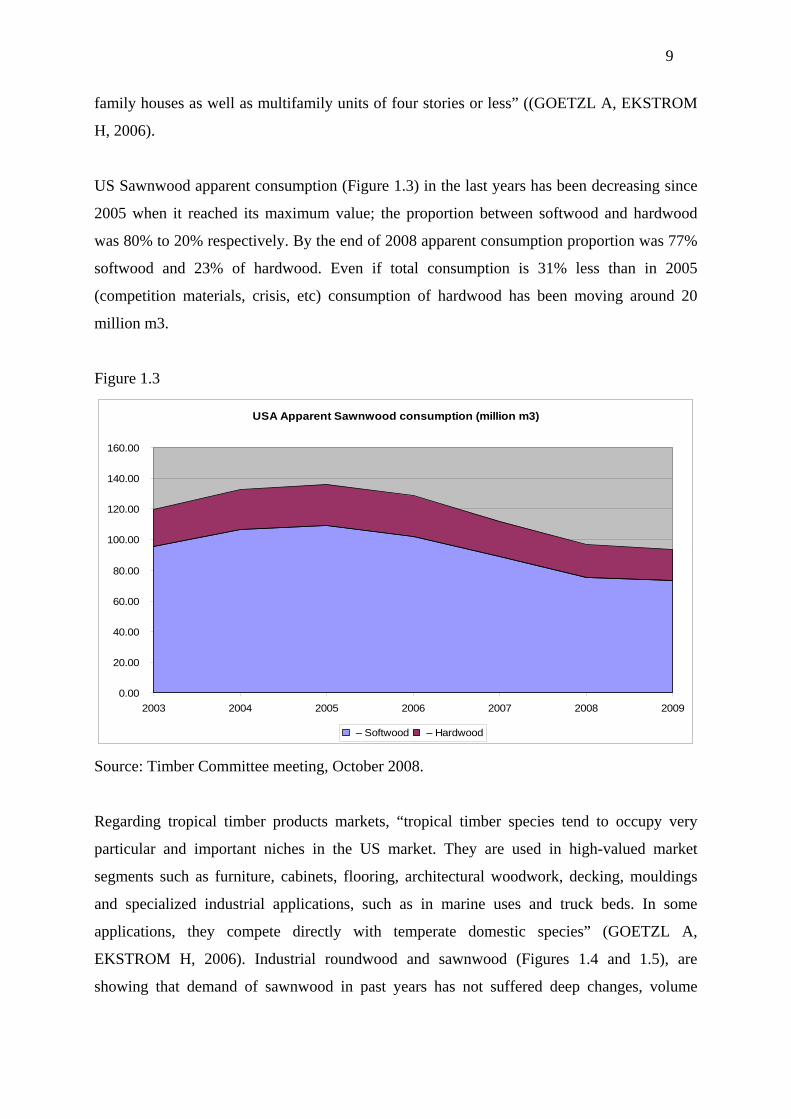
US Sawnwood apparent consumption (Figure 1.3) in the last years has been decreasing since
2005 when it reached its maximum value; the proportion between softwood and hardwood
was 80% to 20% respectively. By the end of 2008 apparent consumption proportion was 77%
softwood and 23% of hardwood. Even if total consumption is 31% less than in 2005
(competition materials, crisis, etc) consumption of hardwood has been moving around 20
million m3.
Figure 1.3
USA Apparent Sawnwood consumption (million m3)
0.00
20.00
40.00
60.00
80.00
100.00
120.00
140.00
160.00
2003 2004 2005 2006 2007 2008 2009
– Softwood – Hardwood
Source: Timber Committee meeting, October 2008.
Regarding tropical timber products markets, “tropical timber species tend to occupy very
particular and important niches in the US market. They are used in high-valued market
segments such as furniture, cabinets, flooring, architectural woodwork, decking, mouldings
and specialized industrial applications, such as in marine uses and truck beds. In some
applications, they compete directly with temperate domestic species” (GOETZL A,
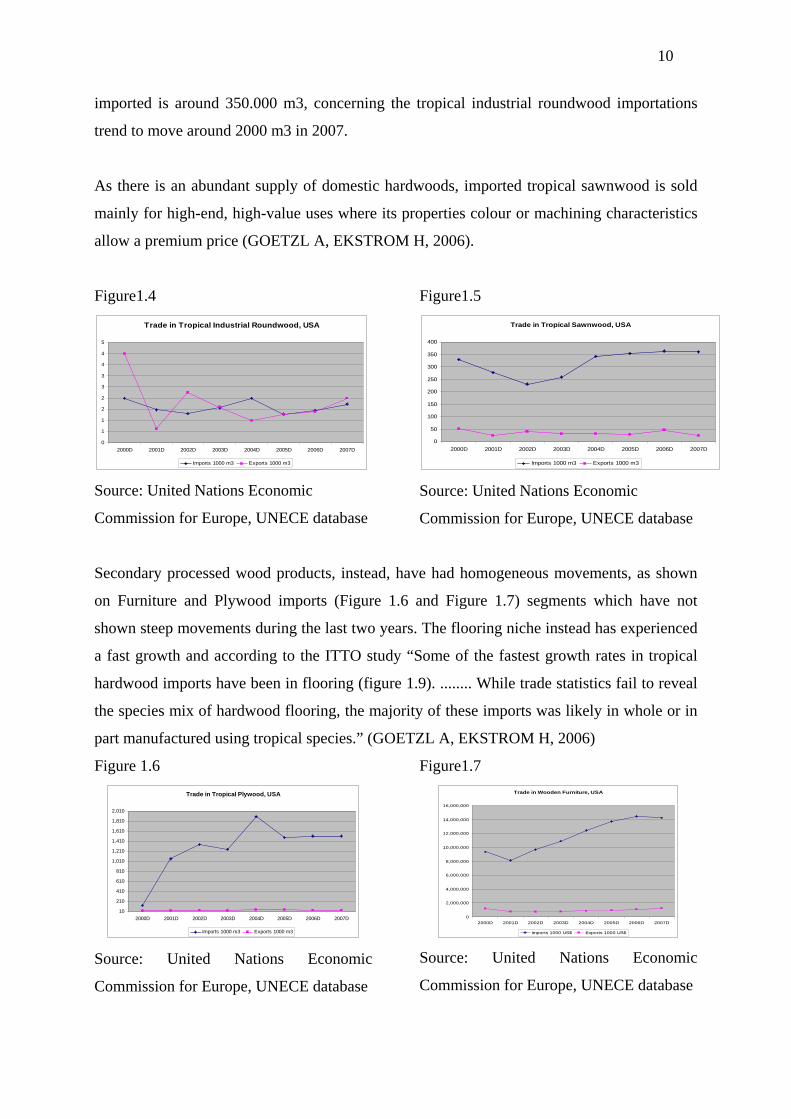
EKSTROM H, 2006). Industrial roundwood and sawnwood (Figures 1.4 and 1.5), are
showing that demand of sawnwood in past years has not suffered deep changes, volume
10
imported is around 350.000 m3, concerning the tropical industrial roundwood importations
trend to move around 2000 m3 in 2007.
As there is an abundant supply of domestic hardwoods, imported tropical sawnwood is sold
mainly for high-end, high-value uses where its properties colour or machining characteristics
allow a premium price (GOETZL A, EKSTROM H, 2006).
Figure1.4
Trade in Tropical Industrial Roundwood, USA
0
1
1
2
2
3
3
4
4
5
2000D 2001D 2002D 2003D 2004D 2005D 2006D 2007D
Imports 1000 m3 Exports 1000 m3
Source: United Nations Economic
Commission for Europe, UNECE database
Figure1.5
Trade in Tropical Sawnwood, USA
0
50
100
150
200
250
300
350
400
2000D 2001D 2002D 2003D 2004D 2005D 2006D 2007D
Imports 1000 m3 Exports 1000 m3
Source: United Nations Economic
Commission for Europe, UNECE database
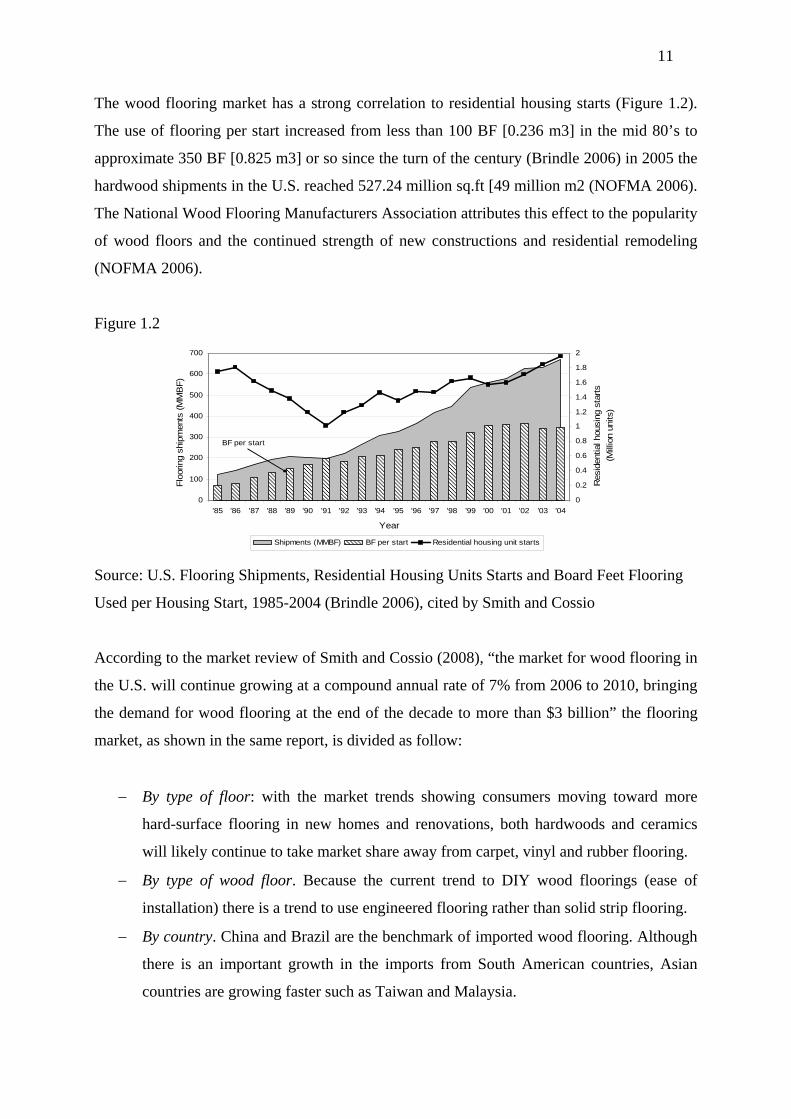
Secondary processed wood products, instead, have had homogeneous movements, as shown
on Furniture and Plywood imports (Figure 1.6 and Figure 1.7) segments which have not
shown steep movements during the last two years. The flooring niche instead has experienced
a fast growth and according to the ITTO study “Some of the fastest growth rates in tropical
hardwood imports have been in flooring (figure 1.9). ........ While trade statistics fail to reveal
the species mix of hardwood flooring, the majority of these imports was likely in whole or in
part manufactured using tropical species.” (GOETZL A, EKSTROM H, 2006)
Figure 1.6
Trade in Tropical Plywood, USA
10
210
410
610
810
1,010
1,210
1,410
1,610
1,810
2,010
2000D 2001D 2002D 2003D 2004D 2005D 2006D 2007D
Imports 1000 m3 Exports 1000 m3
Source: United Nations Economic
Commission for Europe, UNECE database
Figure1.7
Trade in Wooden Furniture, USA
0
2,000,000
4,000,000
6,000,000
8,000,000
10,000,000
12,000,000
14,000,000
16,000,000
2000D 2001D 2002D 2003D 2004D 2005D 2006D 2007D
Imports 1000 US$ Exports 1000 US$
Source: United Nations Economic
Commission for Europe, UNECE database
11
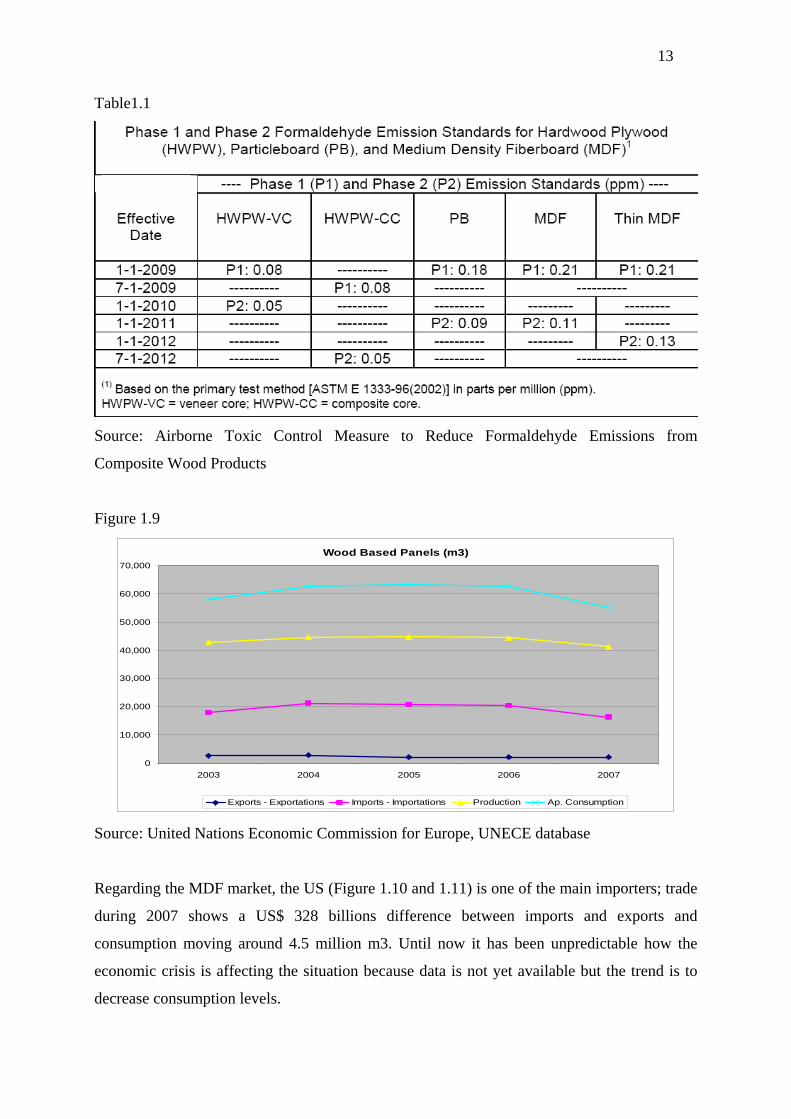
The wood flooring market has a strong correlation to residential housing starts (Figure 1.2).
The use of flooring per start increased from less than 100 BF [0.236 m3] in the mid 80’s to
approximate 350 BF [0.825 m3] or so since the turn of the century (Brindle 2006) in 2005 the
hardwood shipments in the U.S. reached 527.24 million sq.ft [49 million m2 (NOFMA 2006).
The National Wood Flooring Manufacturers Association attributes this effect to the popularity
of wood floors and the continued strength of new constructions and residential remodeling
(NOFMA 2006).
Figure 1.2
BF per start
0
100
200
300
400
500
600
700
'85 '86 '87 '88 '89 '90 '91 '92 '93 '94 '95 '96 '97 '98 '99 '00 '01 '02 '03 '04
Year
Flo
orin
g sh
ipm
ents
(M
MB
F)
0
0.2
0.4
0.6
0.8
1
1.2
1.4
1.6
1.8
2
Res
iden
tial h
ousi
ng s
tarts
(Mill
ion
units
)
Shipments (MMBF) BF per start Residential housing unit starts
Source: U.S. Flooring Shipments, Residential Housing Units Starts and Board Feet Flooring
Used per Housing Start, 1985-2004 (Brindle 2006), cited by Smith and Cossio
According to the market review of Smith and Cossio (2008), “the market for wood flooring in
the U.S. will continue growing at a compound annual rate of 7% from 2006 to 2010, bringing
the demand for wood flooring at the end of the decade to more than $3 billion” the flooring
market, as shown in the same report, is divided as follow:
By type of floor: with the market trends showing consumers moving toward more
hard-surface flooring in new homes and renovations, both hardwoods and ceramics
will likely continue to take market share away from carpet, vinyl and rubber flooring.
By type of wood floor. Because the current trend to DIY wood floorings (ease of
installation) there is a trend to use engineered flooring rather than solid strip flooring.
By country. China and Brazil are the benchmark of imported wood flooring. Although
there is an important growth in the imports from South American countries, Asian
countries are growing faster such as Taiwan and Malaysia.

12
Concerning Tropical Veneer Sheets (Figure 1.8), since 2005 breakpoint imports have not
recuperated previous quotas yet, the volume movement is around 30.000 m3. However the
secondary processed wood products (SPWP) are challenging new threats, especially the
plywood market; “Regulations on formaldehyde product emissions are emerging as a major
issue and may have far-reaching implications for the US wood panel market.” (GOETZL A,
EKSTROM H, 2006). From this year the State of California has established strict limitations
on Formaldehyde emissions from wood products; impacting the future trade deeply.
Figure 1.8
Tropical Veneer Sheets
0
10
20
30
40
50
60
70
80
90
100
2000D 2001D 2002D 2003D 2004D 2005D 2006D 2007D
Imports 1000 m3 Exports 1000 m3
Source: United Nations Economic Commission for Europe, UNECE database
Remarkable reductions in emissions levels of urea formaldehyde are requested by California
Air Resources Board (CARB) for MDF’s and hardwood plywood. CARB’s rules set different
standards for each different type of board and phases of application as shown in the table 1.1
Relating to main competition for tropical woods in end-use, the review of MDF and wood
based panels (WBP) is moving as follows: the WBP market has decreased in the period 2006-
2007; even though the imports have decreased the national production and exportation have
remained at the same levels (Figure 1.9).
13
Table1.1
Source: Airborne Toxic Control Measure to Reduce Formaldehyde Emissions from
Composite Wood Products
Figure 1.9
Wood Based Panels (m3)
0
10,000
20,000
30,000
40,000
50,000
60,000
70,000
2003 2004 2005 2006 2007
Exports - Exportations Imports - Importations Production Ap. Consumption
Source: United Nations Economic Commission for Europe, UNECE database
Regarding the MDF market, the US (Figure 1.10 and 1.11) is one of the main importers; trade
during 2007 shows a US$ 328 billions difference between imports and exports and
consumption moving around 4.5 million m3. Until now it has been unpredictable how the
economic crisis is affecting the situation because data is not yet available but the trend is to
decrease consumption levels.
14
Figure 1.10
MDF Market
0
1,000
2,000
3,000
4,000
5,000
6,000
2003 2004 2005 2006 2007
10
00
m3
Consumption - Consommation Production
Source: United Nations Economic
Commission for Europe, UNECE database
Figure 1.11
MDF
0
50,000
100,000
150,000
200,000
250,000
300,000
350,000
400,000
450,000
500,000
2003 2004 2005 2006 2007
1000
US
$
Imports - Importations Exports - Exportations
Source: United Nations Economic
Commission for Europe, UNECE database
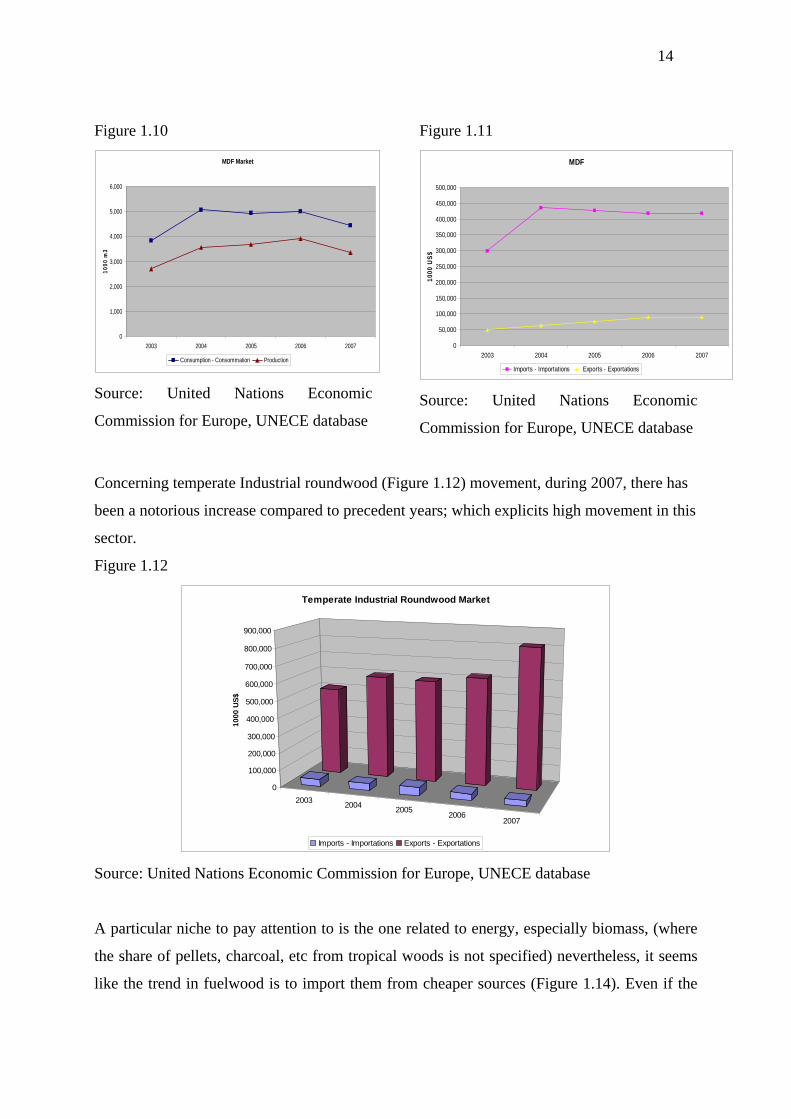
Concerning temperate Industrial roundwood (Figure 1.12) movement, during 2007, there has
been a notorious increase compared to precedent years; which explicits high movement in this
sector.
Figure 1.12
20032004
20052006
2007
0
100,000
200,000
300,000
400,000
500,000
600,000
700,000
800,000
900,000
10
00
US
$
Temperate Industrial Roundwood Market
Imports - Importations Exports - Exportations
Source: United Nations Economic Commission for Europe, UNECE database
A particular niche to pay attention to is the one related to energy, especially biomass, (where
the share of pellets, charcoal, etc from tropical woods is not specified) nevertheless, it seems
like the trend in fuelwood is to import them from cheaper sources (Figure 1.14). Even if the
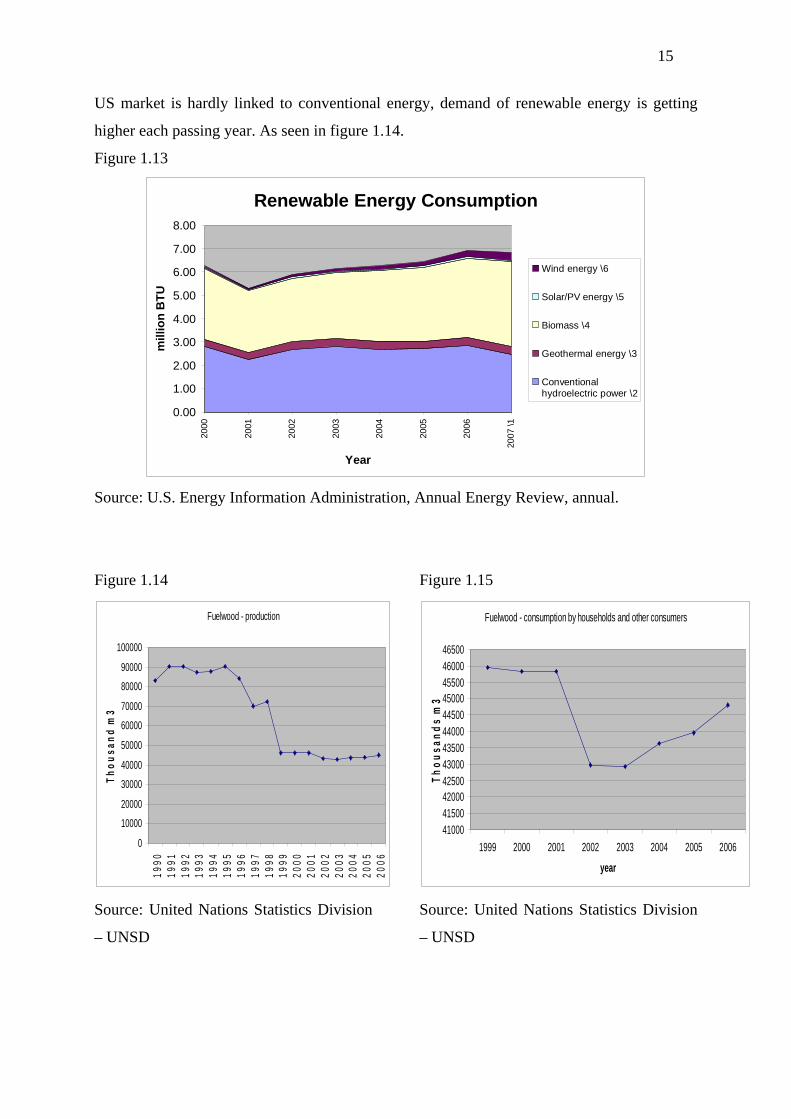
15
US market is hardly linked to conventional energy, demand of renewable energy is getting
higher each passing year. As seen in figure 1.14.
Figure 1.13
Renewable Energy Consumption
0.00
1.00
2.00
3.00
4.00
5.00
6.00
7.00
8.00
2000
2001
2002
2003
2004
2005
2006
2007
\1
Year
mill
ion
BT
U
Wind energy \6
Solar/PV energy \5
Biomass \4
Geothermal energy \3
Conventionalhydroelectric power \2
Source: U.S. Energy Information Administration, Annual Energy Review, annual.
Figure 1.14
Fuelwood - production
0
10000
20000
30000
40000
50000
60000
70000
80000
90000
100000
19
90
19
91
19
92
19
93
19
94
19
95
19
96
19
97
19
98
19
99
20
00
20
01
20
02
20
03
20
04
20
05
20
06
Th
ou
sa
nd
m3
Source: United Nations Statistics Division
– UNSD
Figure 1.15
Fuelwood - consumption by households and other consumers
410004150042000425004300043500440004450045000455004600046500
1999 2000 2001 2002 2003 2004 2005 2006
year
Th
ou
sa
nd
s m
3
Source: United Nations Statistics Division
– UNSD

16
Summarizing market’s trends in Tropical Timber Products:
Tropical Wood
Roundwood Sawnwood Plywood Veneer Wooden Furniture
Flooring
Trends of Competition (MDF, WBP, Temperate woods)
Imports Saw tooth profile
Flat High ’00-‘06, Flat since then
decreasing up Fast growth
Flat
Exports Low Flat low Flat low low Flat
Regarding threats, a major one is the new formaldehyde emissions standard to be achieved by
producers and exporters. The Biomass niche seems to have an interesting future.
The Financial crisis is a key aspect to the house building demand and there are some issues to
take into consideration such as the GDP in 2008 decreased by 3.8% in which housing directly
contributed 0.85%. Production cut backs and consumption declines in nearly every segment
of the U.S. wood products industry: Softwood lumber demand down by 50% since 2005;
Hardwood lumber down by 35%; Structural panels down by 37% since 2005; and engineered
wood products (EWP) down by 30%. However the U.S. industry can position itself to take
advantage of the coming economic stimulus, such as green energy investments (Taylor R.
COFO 2009)
17
3.2. Japanese Market
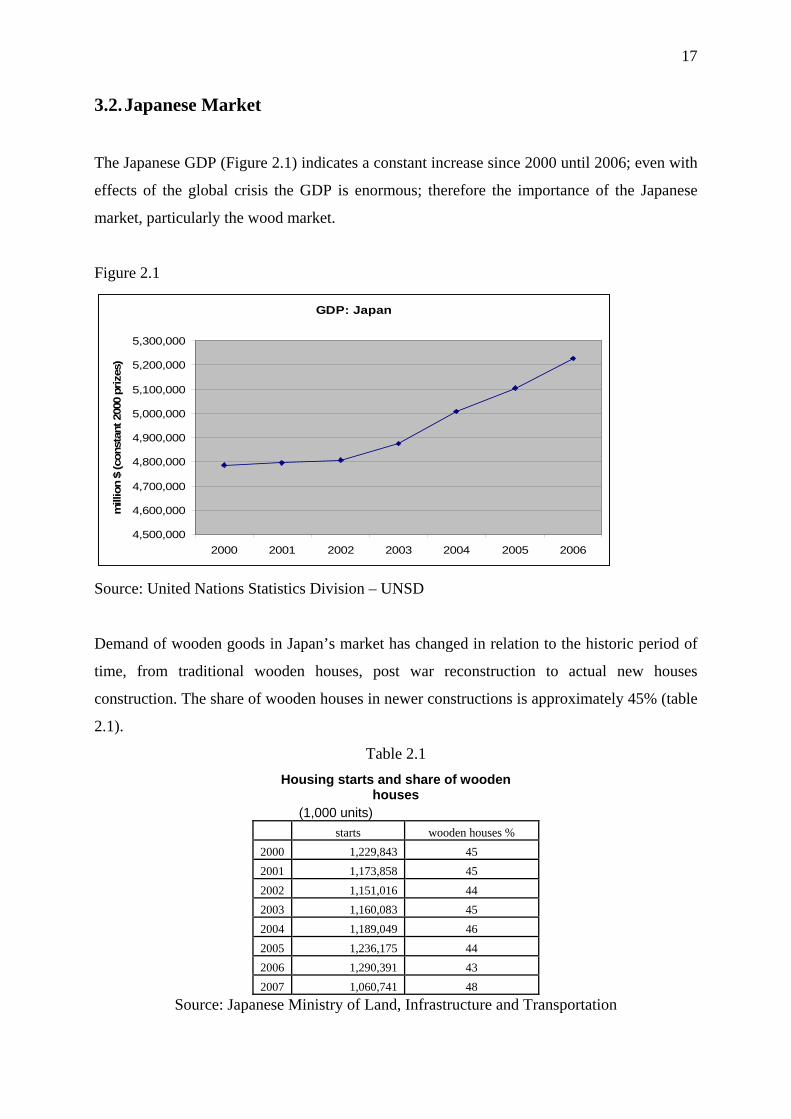
The Japanese GDP (Figure 2.1) indicates a constant increase since 2000 until 2006; even with
effects of the global crisis the GDP is enormous; therefore the importance of the Japanese
market, particularly the wood market.
Figure 2.1
GDP: Japan
4,500,000
4,600,000
4,700,000
4,800,000
4,900,000
5,000,000
5,100,000
5,200,000
5,300,000
2000 2001 2002 2003 2004 2005 2006
mill
ion $
(co
nst
ant 20
00 p
rize
s)
Source: United Nations Statistics Division – UNSD
Demand of wooden goods in Japan’s market has changed in relation to the historic period of
time, from traditional wooden houses, post war reconstruction to actual new houses
construction. The share of wooden houses in newer constructions is approximately 45% (table
2.1).
Table 2.1
Housing starts and share of wooden houses
(1,000 units)
starts wooden houses %
2000 1,229,843 45
2001 1,173,858 45
2002 1,151,016 44
2003 1,160,083 45
2004 1,189,049 46
2005 1,236,175 44
2006 1,290,391 43
2007 1,060,741 48
Source: Japanese Ministry of Land, Infrastructure and Transportation
18
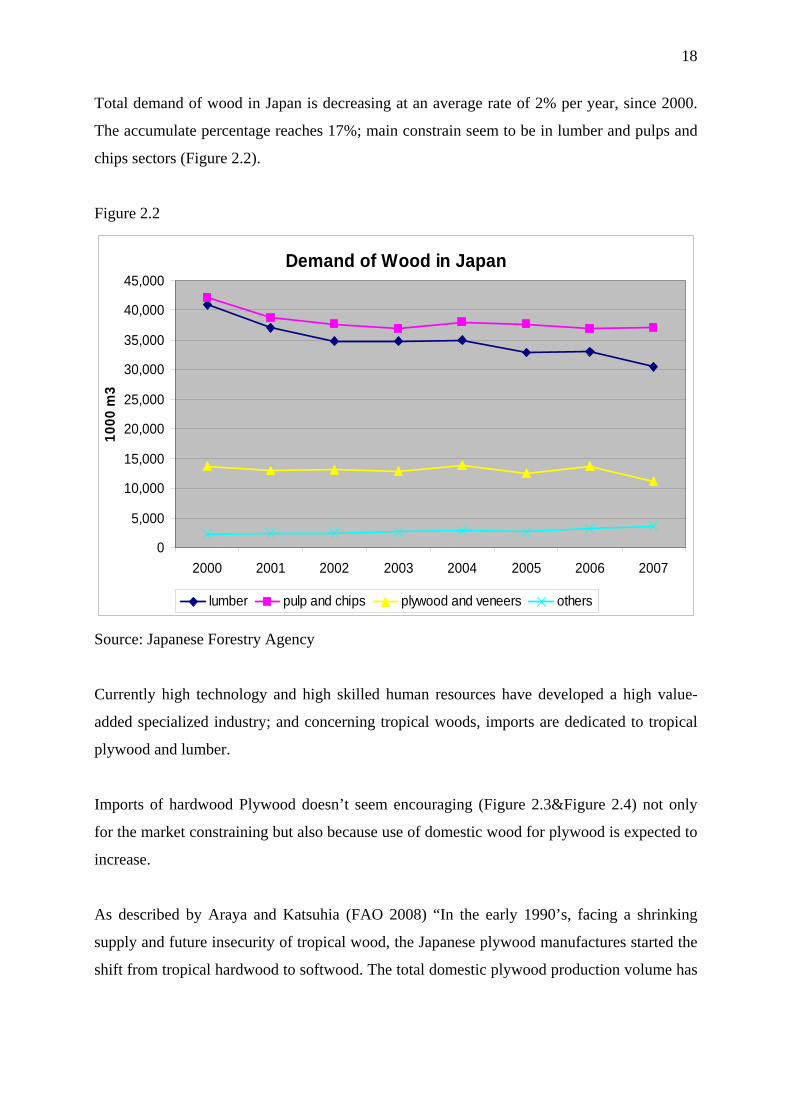
Total demand of wood in Japan is decreasing at an average rate of 2% per year, since 2000.
The accumulate percentage reaches 17%; main constrain seem to be in lumber and pulps and
chips sectors (Figure 2.2).
Figure 2.2
Demand of Wood in Japan
0
5,000
10,000
15,000
20,000
25,000
30,000
35,000
40,000
45,000
2000 2001 2002 2003 2004 2005 2006 2007
10
00
m3
lumber pulp and chips plywood and veneers others
Source: Japanese Forestry Agency
Currently high technology and high skilled human resources have developed a high value-
added specialized industry; and concerning tropical woods, imports are dedicated to tropical
plywood and lumber.
Imports of hardwood Plywood doesn’t seem encouraging (Figure 2.3&Figure 2.4) not only
for the market constraining but also because use of domestic wood for plywood is expected to
increase.
As described by Araya and Katsuhia (FAO 2008) “In the early 1990’s, facing a shrinking
supply and future insecurity of tropical wood, the Japanese plywood manufactures started the
shift from tropical hardwood to softwood. The total domestic plywood production volume has

19
been on the decline but the share of softwood plywood rose rapidly. In 2007, production of
softwood plywood accounted for 79% of the total.”
Figure 2.3
Imports of Hardwood Plywood
3,000.00
3,200.00
3,400.00
3,600.00
3,800.00
4,000.00
4,200.00
4,400.00
4,600.00
2000 2001 2002 2003 2004 2005 2006 2007
1000
m3
Source: Japan Ministry of Finance, “Trade Statistics”
Figure 2.4
Plywood Market: Japan
0
1,000
2,000
3,000
4,000
5,000
6,000
7,000
8,000
9,000
2000 2001 2002 2003 2004 2005 2006 2007
100
0m
3
Production Exports Imports Consumption
Source: Japanese Ministry of Finance, “Trade Statistics”, Ministry of Agriculture, Forestry &
Fisheries
20
The Japanese rate of self-sufficiency is growing quickly considering volumes demanded a 1%
increase each passing year is expected not only for plywood but for the entire sector’s major
imports replacements.
Relating to VOC (Volatile Organic Compound like formaldehyde, toluene, xylene, wood
preservatives, plasticizer, and termite repellents) which are released from adhesives, paints
and anti-corrosives contained in building materials and furniture, the Ministry of Construction
produced “Design and Construction Guidelines” and a “Users’ manual” and included clean
indoor air quality as one of the required performances under the Housing Quality Assurance
Law (Araya and Katsuhia, FAO 2008).
Permissible levels of indoor formaldehyde concentration are divided as follows: Fc0, Fc1 and
Fc2. The least emission products were given 4 stars (F4****) and their interior uses were
allowed with no limitations. Interior uses of F3 and F2 products were limited depending on
frequency of ventilation. F1 products were not to be used on interiors. New regulations on
formaldehyde emissions in the Building Code were enacted in 2003. The JAS also followed
by specifying low emission standards.
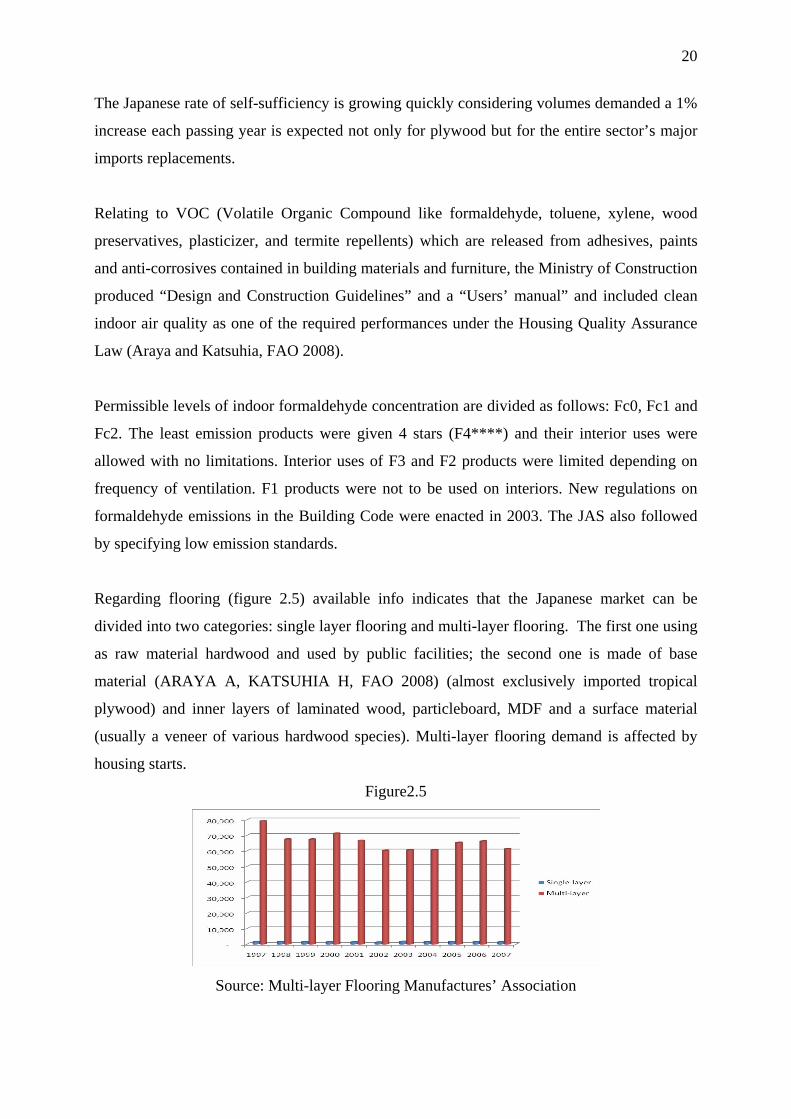
Regarding flooring (figure 2.5) available info indicates that the Japanese market can be
divided into two categories: single layer flooring and multi-layer flooring. The first one using
as raw material hardwood and used by public facilities; the second one is made of base
material (ARAYA A, KATSUHIA H, FAO 2008) (almost exclusively imported tropical
plywood) and inner layers of laminated wood, particleboard, MDF and a surface material
(usually a veneer of various hardwood species). Multi-layer flooring demand is affected by
housing starts.
Figure2.5
Source: Multi-layer Flooring Manufactures’ Association
21
Considering Araya and Katsuhia (FAO 2008) report it is important to mention forces of
change in the Japanese tropical wood market:
(1) Quality and safety of houses
(2) Concerns for health (VOC)
(3) Building Code, regarding materials
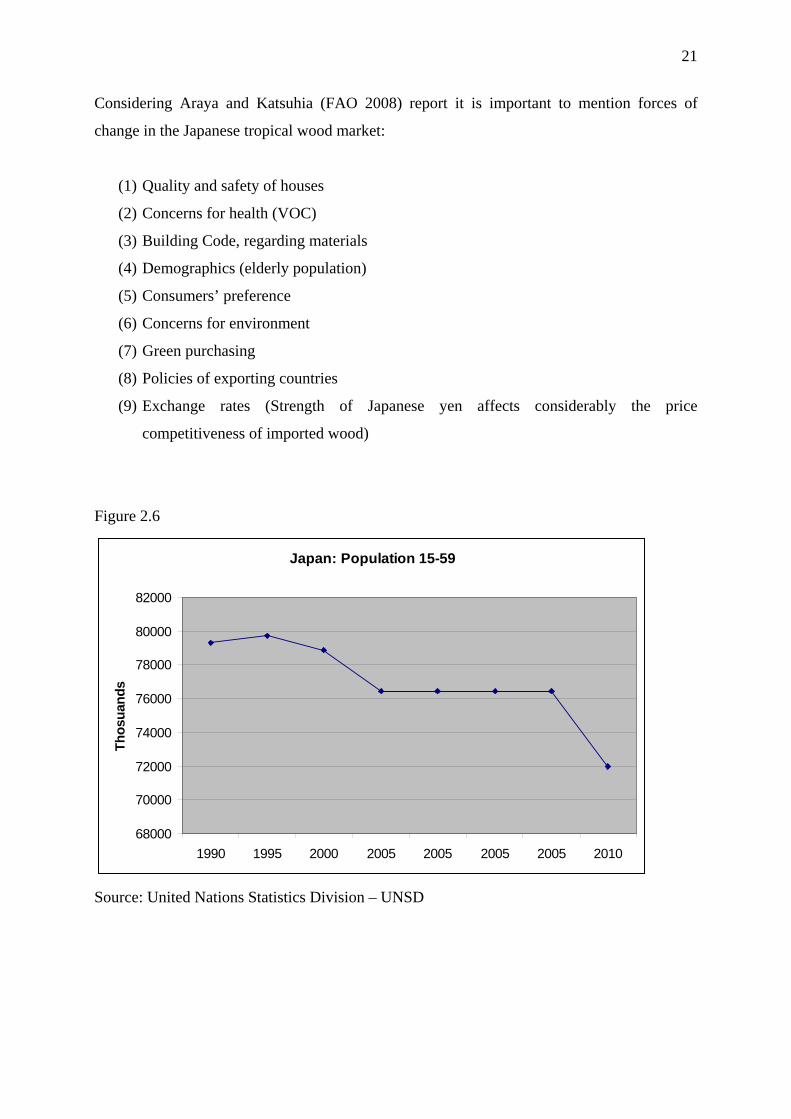
(4) Demographics (elderly population)
(5) Consumers’ preference
(6) Concerns for environment
(7) Green purchasing
(8) Policies of exporting countries
(9) Exchange rates (Strength of Japanese yen affects considerably the price
competitiveness of imported wood)
Figure 2.6
Japan: Population 15-59
68000
70000
72000
74000
76000
78000
80000
82000
1990 1995 2000 2005 2005 2005 2005 2010
Th
osu
and
s
Source: United Nations Statistics Division – UNSD

22
Tropical Wood: Japan
Roundwood Sawnwood Plywood Veneer Wooden Furniture
Fuelwood
Trends of Competition (MDF, WBP, Temperate woods)
Imports --- marginal decreasing decreasing ----- --- ---
Exports --- --- decreasing decreasing ---- ---- ---
23
3.3. Chinese Market
Presently China accounts for a large part of the growth in trade; according to FAO, its total
wood products imports rose from US$5.4 billion in 1990 to US$20.6 billion in 2006 and the
demand for wood products will continue to rise in line with the growth of population and
income. Following data consider China as a tropical wood importer
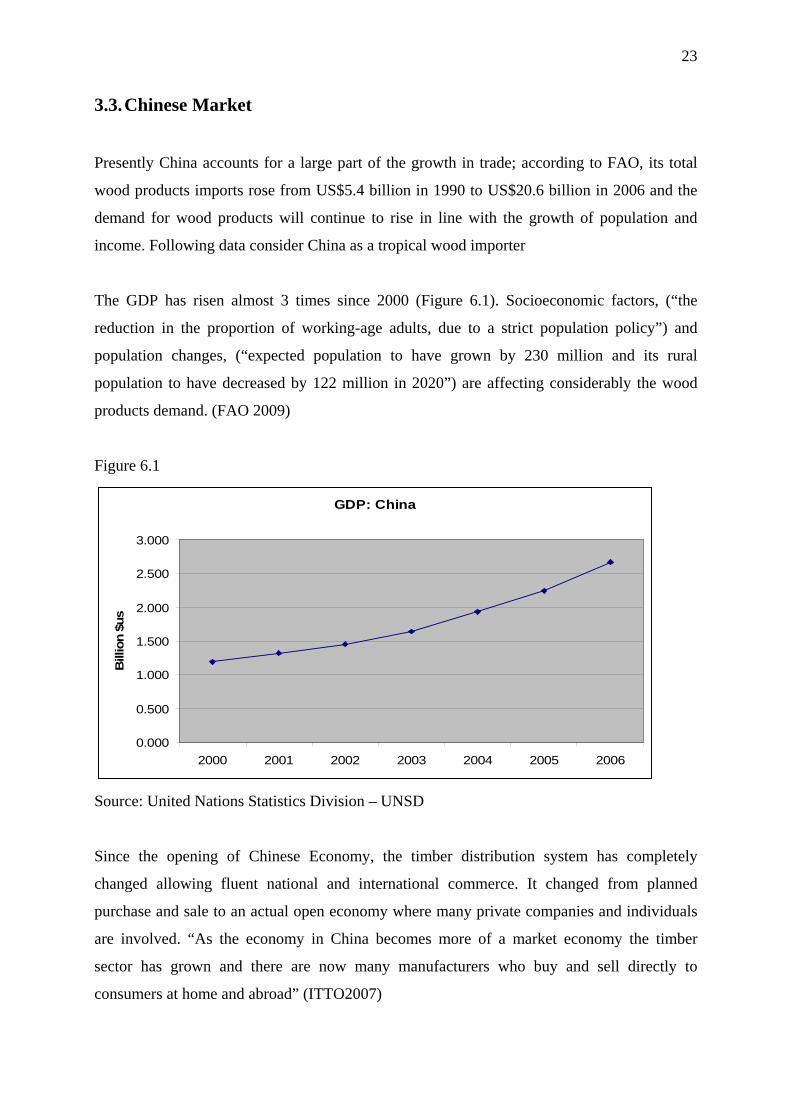
The GDP has risen almost 3 times since 2000 (Figure 6.1). Socioeconomic factors, (“the
reduction in the proportion of working-age adults, due to a strict population policy”) and
population changes, (“expected population to have grown by 230 million and its rural
population to have decreased by 122 million in 2020”) are affecting considerably the wood
products demand. (FAO 2009)
Figure 6.1
GDP: China
0.000
0.500
1.000
1.500
2.000
2.500
3.000
2000 2001 2002 2003 2004 2005 2006
Bill
ion $
us
Source: United Nations Statistics Division – UNSD
Since the opening of Chinese Economy, the timber distribution system has completely
changed allowing fluent national and international commerce. It changed from planned
purchase and sale to an actual open economy where many private companies and individuals
are involved. “As the economy in China becomes more of a market economy the timber
sector has grown and there are now many manufacturers who buy and sell directly to
consumers at home and abroad” (ITTO2007)
24
Due to China’s scarce self-sufficiency rate, imports of wood products are expected to
increase; “China has inadequate forest resources to sustain the present wood industries and is
especially deficient in high value, large diameter hardwoods and this situation cannot be
solved through efforts at self-sufficiency in a short period of time.” (ITTO 2007)
Therefore, China will still be an import dependant on raw materials (such as logs, sawnwood,
paper pulp and waste paper). On the topic of consumption, as described by the ITTO 2007
technical report, China will continue to be a huge potential market for tropical timber but the
main factor affecting China’s tropical timber consumption is not demand but the supply
capacity in the international market.
Regarding the market segmentation, as illustrated on the ITTO report, the market is divided as
follows:
Primary Wholesale market: These are markets in or close to the production areas or ports of
entry. These markets are concentration points and handle mainly logs. Close to China’s main
ports of entry for tropical logs primary wholesale markets have been established.
Secondary wholesale Market: These are markets located in geographically strategic points of
collection or transport hubs often in the centre of a producing area and close or convenient for
consuming areas. These markets are usually located in provincial capital cities or transport
hubs where it is convenient to store and redistribute wood products.
Tertiary retail market: This type of market is the retail wood market and is commonly located
in an area served by a secondary wholesale market or it may be located in an area with a large
population or where there is a concentration of wood product manufacturers. There are three
kinds of retail wood markets: the individual stall type market, the single company
monopolistic timber store and the timber supermarket which is more common in the big cities
in China
Regarding logs imports (Figure 6.2), since 1996 the proportion of tropical logs compared to
total log importations has decreased from 64% to 24% in 2006. However volumes imported in
2006 reached 5 million m3 more than in 1996 with an increasing trend since 1996.
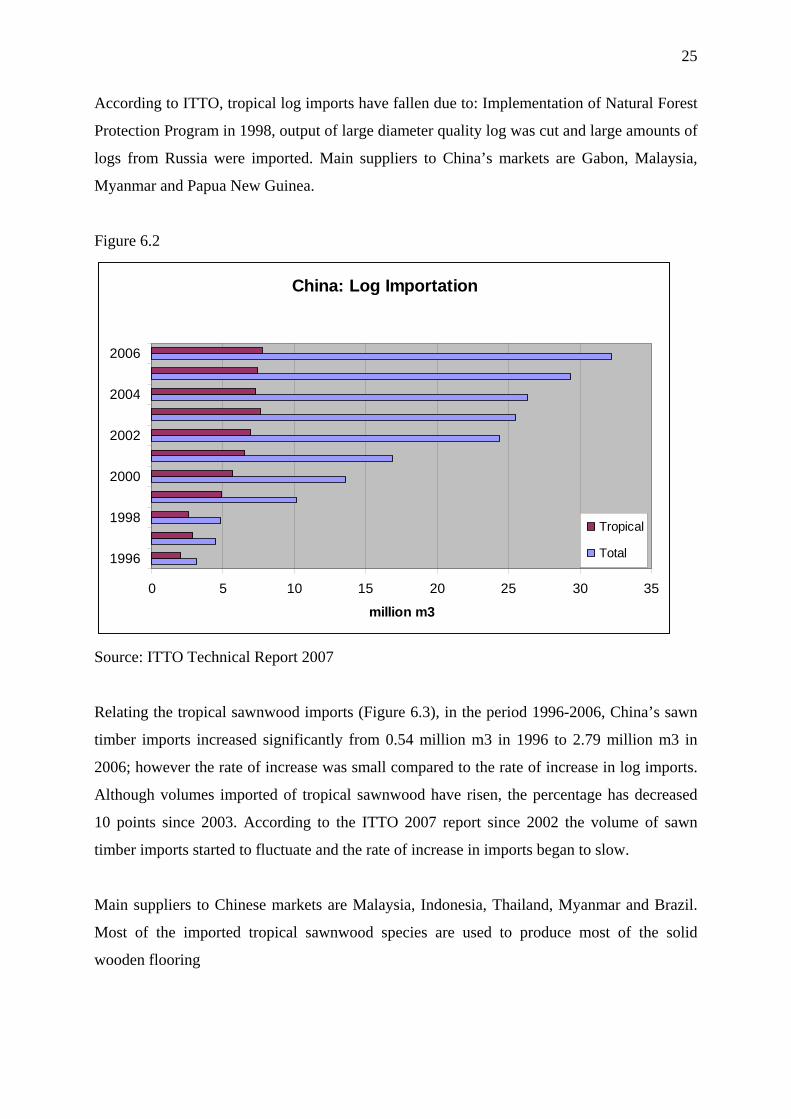
25
According to ITTO, tropical log imports have fallen due to: Implementation of Natural Forest
Protection Program in 1998, output of large diameter quality log was cut and large amounts of
logs from Russia were imported. Main suppliers to China’s markets are Gabon, Malaysia,
Myanmar and Papua New Guinea.
Figure 6.2
China: Log Importation
0 5 10 15 20 25 30 35
1996
1998
2000
2002
2004
2006
million m3
Tropical
Total
Source: ITTO Technical Report 2007
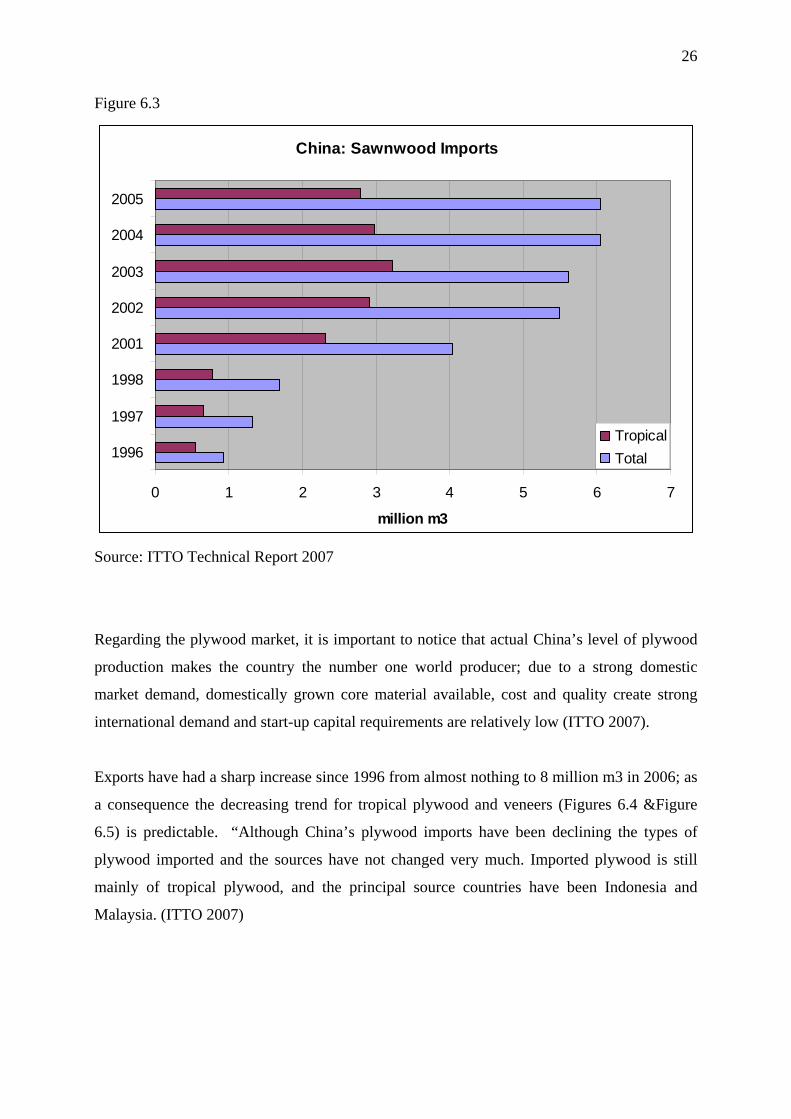
Relating the tropical sawnwood imports (Figure 6.3), in the period 1996-2006, China’s sawn
timber imports increased significantly from 0.54 million m3 in 1996 to 2.79 million m3 in
2006; however the rate of increase was small compared to the rate of increase in log imports.
Although volumes imported of tropical sawnwood have risen, the percentage has decreased
10 points since 2003. According to the ITTO 2007 report since 2002 the volume of sawn
timber imports started to fluctuate and the rate of increase in imports began to slow.
Main suppliers to Chinese markets are Malaysia, Indonesia, Thailand, Myanmar and Brazil.
Most of the imported tropical sawnwood species are used to produce most of the solid
wooden flooring
26
Figure 6.3
China: Sawnwood Imports
0 1 2 3 4 5 6 7
1996
1997
1998
2001
2002
2003
2004
2005
million m3
Tropical
Total
Source: ITTO Technical Report 2007
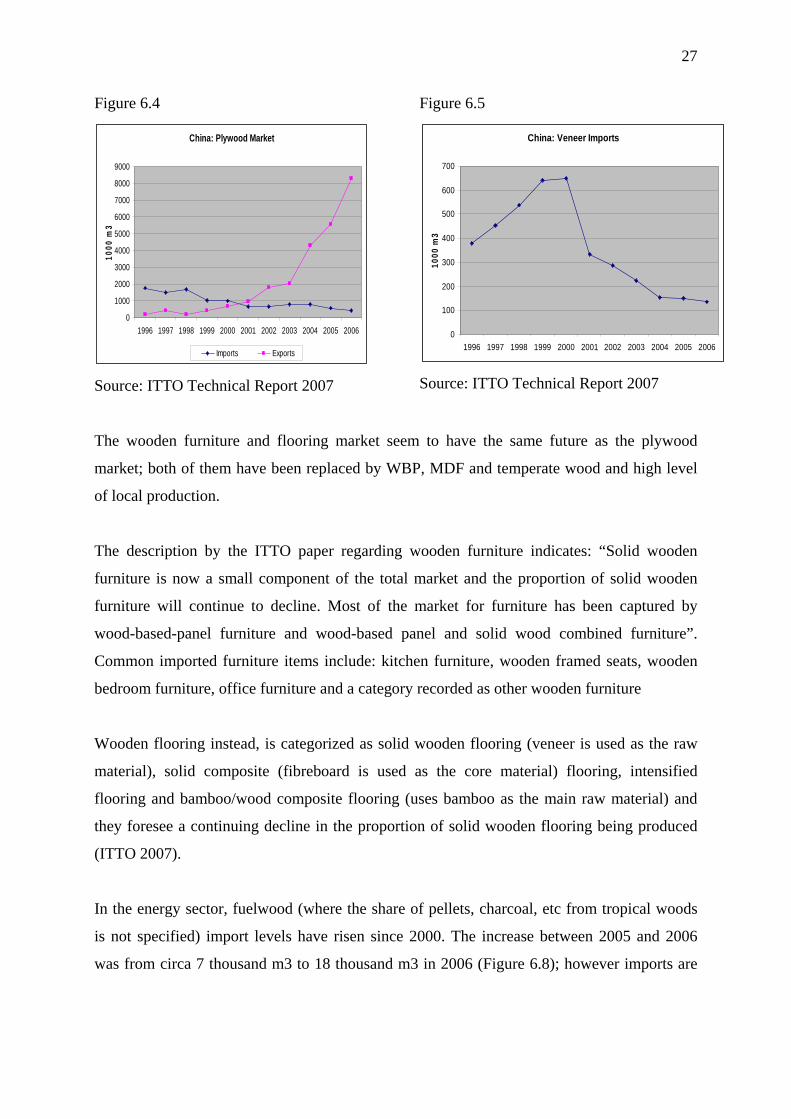
Regarding the plywood market, it is important to notice that actual China’s level of plywood
production makes the country the number one world producer; due to a strong domestic
market demand, domestically grown core material available, cost and quality create strong
international demand and start-up capital requirements are relatively low (ITTO 2007).
Exports have had a sharp increase since 1996 from almost nothing to 8 million m3 in 2006; as
a consequence the decreasing trend for tropical plywood and veneers (Figures 6.4 &Figure
6.5) is predictable. “Although China’s plywood imports have been declining the types of
plywood imported and the sources have not changed very much. Imported plywood is still
mainly of tropical plywood, and the principal source countries have been Indonesia and
Malaysia. (ITTO 2007)
27
Figure 6.4
China: Plywood Market
0
1000
2000
3000
4000
5000
6000
7000
8000
9000
1996 1997 1998 1999 2000 2001 2002 2003 2004 2005 2006
10
00
m3
Imports Exports
Source: ITTO Technical Report 2007
Figure 6.5
China: Veneer Imports
0
100
200
300
400
500
600
700
1996 1997 1998 1999 2000 2001 2002 2003 2004 2005 2006
10
00
m3
Source: ITTO Technical Report 2007
The wooden furniture and flooring market seem to have the same future as the plywood
market; both of them have been replaced by WBP, MDF and temperate wood and high level
of local production.
The description by the ITTO paper regarding wooden furniture indicates: “Solid wooden
furniture is now a small component of the total market and the proportion of solid wooden
furniture will continue to decline. Most of the market for furniture has been captured by
wood-based-panel furniture and wood-based panel and solid wood combined furniture”.
Common imported furniture items include: kitchen furniture, wooden framed seats, wooden
bedroom furniture, office furniture and a category recorded as other wooden furniture
Wooden flooring instead, is categorized as solid wooden flooring (veneer is used as the raw
material), solid composite (fibreboard is used as the core material) flooring, intensified
flooring and bamboo/wood composite flooring (uses bamboo as the main raw material) and
they foresee a continuing decline in the proportion of solid wooden flooring being produced
(ITTO 2007).
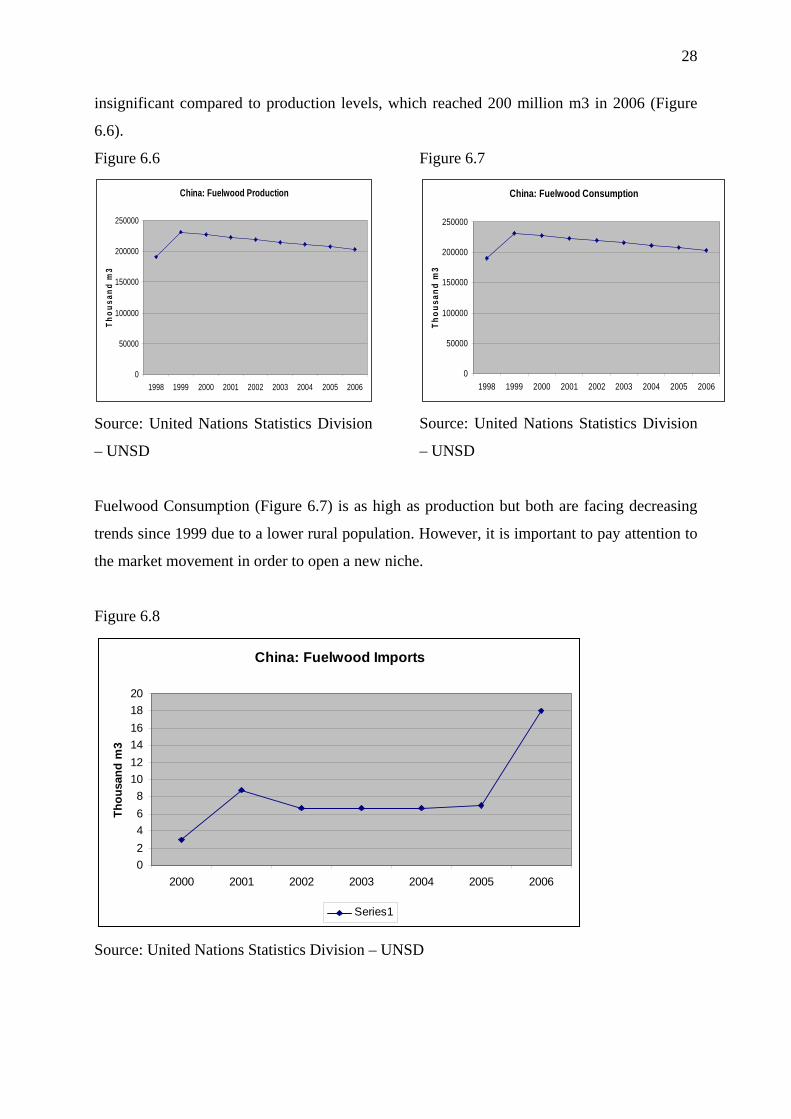
In the energy sector, fuelwood (where the share of pellets, charcoal, etc from tropical woods
is not specified) import levels have risen since 2000. The increase between 2005 and 2006
was from circa 7 thousand m3 to 18 thousand m3 in 2006 (Figure 6.8); however imports are
28
insignificant compared to production levels, which reached 200 million m3 in 2006 (Figure
6.6).
Figure 6.6
China: Fuelwood Production
0
50000
100000
150000
200000
250000
1998 1999 2000 2001 2002 2003 2004 2005 2006
Th
ou
sa
nd
m3
Source: United Nations Statistics Division
– UNSD
Figure 6.7
China: Fuelwood Consumption
0
50000
100000
150000
200000
250000
1998 1999 2000 2001 2002 2003 2004 2005 2006
Th
ou
sa
nd
m3
Source: United Nations Statistics Division
– UNSD
Fuelwood Consumption (Figure 6.7) is as high as production but both are facing decreasing
trends since 1999 due to a lower rural population. However, it is important to pay attention to
the market movement in order to open a new niche.
Figure 6.8
China: Fuelwood Imports
0
2
4
6
8
10
12
14
16
18
20
2000 2001 2002 2003 2004 2005 2006
Th
ou
san
d m
3
Series1
Source: United Nations Statistics Division – UNSD
29
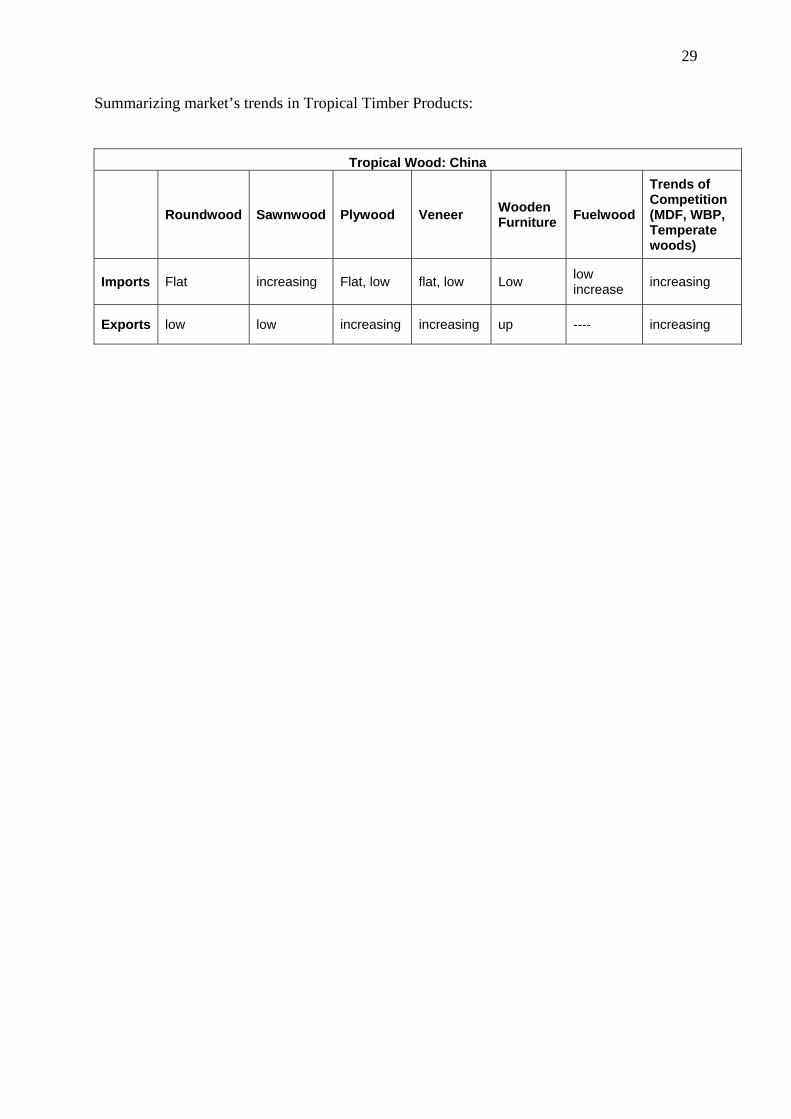
Summarizing market’s trends in Tropical Timber Products:
Tropical Wood: China
Roundwood Sawnwood Plywood Veneer Wooden Furniture
Fuelwood
Trends of Competition (MDF, WBP, Temperate woods)
Imports Flat increasing Flat, low flat, low Low low increase
increasing
Exports low low increasing increasing up ---- increasing

30
3.4. Italian Market
Italian macroeconomic data, considering the GDP, exposes that even if it has been rising
(figure 3.1) in comparison with Euro-area economies it has been lagging behind. The annual
change of the Italian real GDP has been a little lower than the average annual change of the
Euro-area GDP (table 3.1).
Table 3.1
Source: OECD
Figure 3.1
Italy: GDP
1,000,000
1,100,000
1,200,000
1,300,000
1,400,000
1,500,000
1,600,000
2000 2001 2002 2003 2004 2005 2006 2007
mill
ions
€
Source: Eurostat
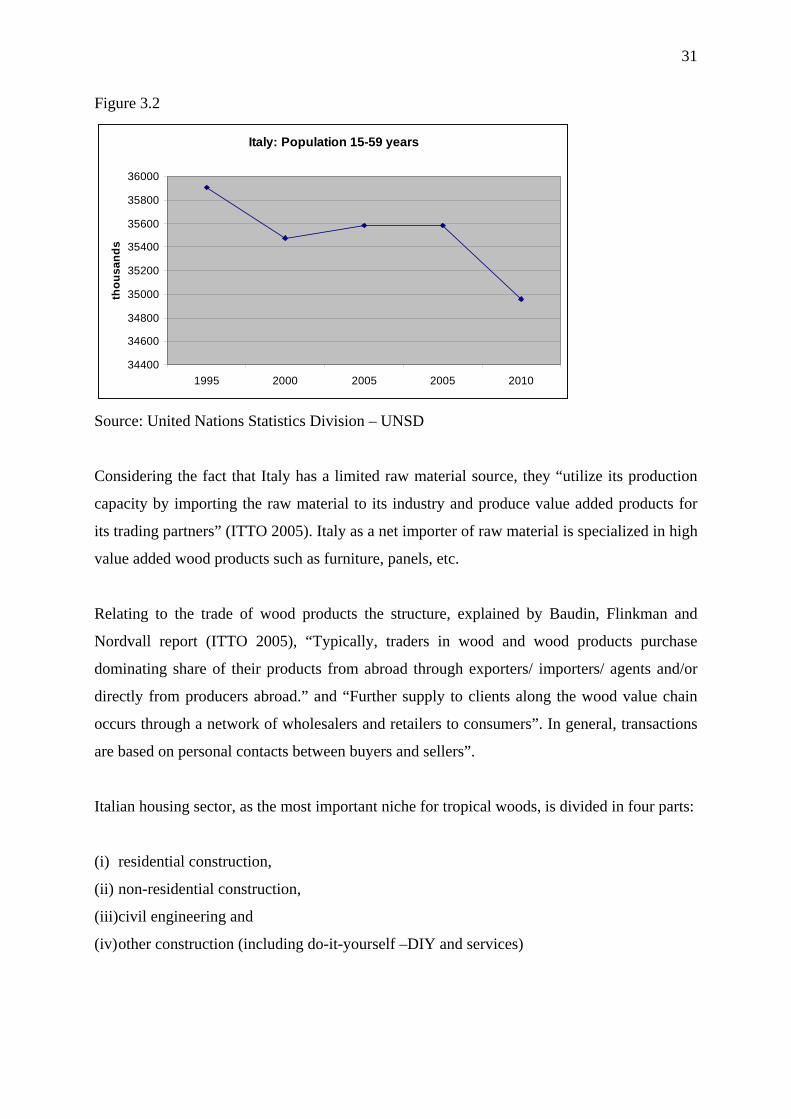
As less active economic population is expected (Figure 3.2), ageing population is becoming a
problem. Purchasing power becomes weaker and as a consequence; taxes to the government
by young persons decrease, pension rates increase progressively and public spending
constrains affecting the entire economy.
This structural weakness of the Italian economy is reducing the purchasing power of many
households and leads to lower domestic demand and consumer confidence, in general
(OECD, 2005).
31
Figure 3.2
Italy: Population 15-59 years
34400
34600
34800
35000
35200
35400
35600
35800
36000
1995 2000 2005 2005 2010
tho
us
an
ds
Source: United Nations Statistics Division – UNSD
Considering the fact that Italy has a limited raw material source, they “utilize its production
capacity by importing the raw material to its industry and produce value added products for
its trading partners” (ITTO 2005). Italy as a net importer of raw material is specialized in high
value added wood products such as furniture, panels, etc.
Relating to the trade of wood products the structure, explained by Baudin, Flinkman and
Nordvall report (ITTO 2005), “Typically, traders in wood and wood products purchase
dominating share of their products from abroad through exporters/ importers/ agents and/or
directly from producers abroad.” and “Further supply to clients along the wood value chain
occurs through a network of wholesalers and retailers to consumers”. In general, transactions
are based on personal contacts between buyers and sellers”.
Italian housing sector, as the most important niche for tropical woods, is divided in four parts:
(i) residential construction,
(ii) non-residential construction,
(iii)civil engineering and
(iv) other construction (including do-it-yourself –DIY and services)
32
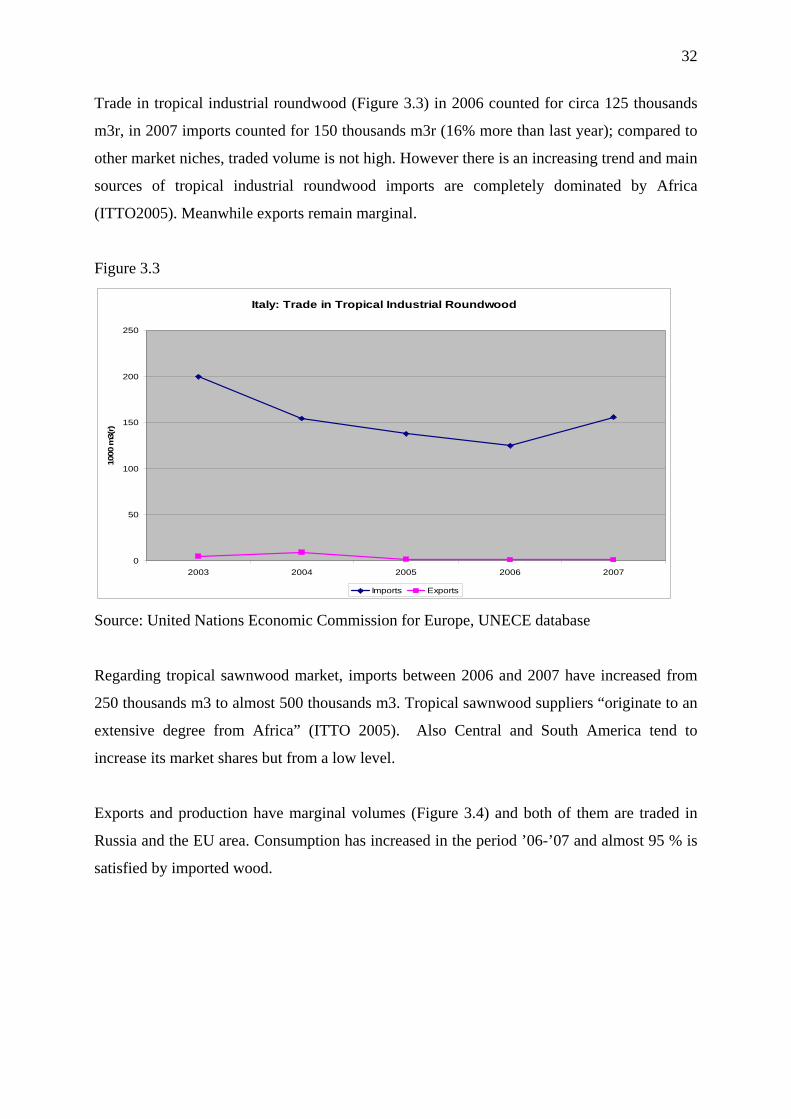
Trade in tropical industrial roundwood (Figure 3.3) in 2006 counted for circa 125 thousands
m3r, in 2007 imports counted for 150 thousands m3r (16% more than last year); compared to
other market niches, traded volume is not high. However there is an increasing trend and main
sources of tropical industrial roundwood imports are completely dominated by Africa
(ITTO2005). Meanwhile exports remain marginal.
Figure 3.3
Italy: Trade in Tropical Industrial Roundwood
0
50
100
150
200
250
2003 2004 2005 2006 2007
1000
m3(r
)
Imports Exports
Source: United Nations Economic Commission for Europe, UNECE database
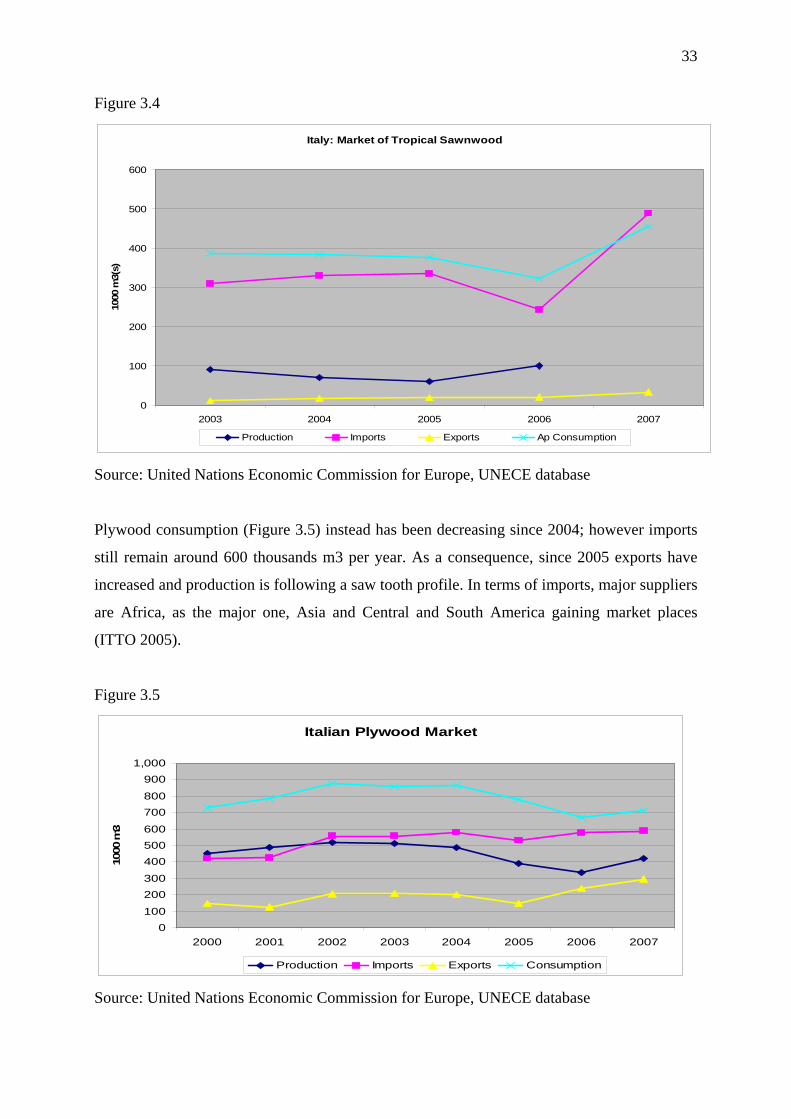
Regarding tropical sawnwood market, imports between 2006 and 2007 have increased from
250 thousands m3 to almost 500 thousands m3. Tropical sawnwood suppliers “originate to an
extensive degree from Africa” (ITTO 2005). Also Central and South America tend to
increase its market shares but from a low level.
Exports and production have marginal volumes (Figure 3.4) and both of them are traded in
Russia and the EU area. Consumption has increased in the period ’06-’07 and almost 95 % is
satisfied by imported wood.
33
Figure 3.4
Italy: Market of Tropical Sawnwood
0
100
200
300
400
500
600
2003 2004 2005 2006 2007
1000
m3(
s)
Production Imports Exports Ap Consumption
Source: United Nations Economic Commission for Europe, UNECE database
Plywood consumption (Figure 3.5) instead has been decreasing since 2004; however imports
still remain around 600 thousands m3 per year. As a consequence, since 2005 exports have
increased and production is following a saw tooth profile. In terms of imports, major suppliers
are Africa, as the major one, Asia and Central and South America gaining market places
(ITTO 2005).
Figure 3.5
Italian Plywood Market
0
100
200
300
400
500
600
700
800
900
1,000
2000 2001 2002 2003 2004 2005 2006 2007
1000 m
3
Production Imports Exports Consumption
Source: United Nations Economic Commission for Europe, UNECE database

34
Regarding trade in tropical veneer, trends show a fast grow importation since 2006; from 80
thousands m3 to nearly 140 thousands m3, an increased percentage of 40% since 2006 and
55% since 2003. Consumption has increased 25% in the same period and exportation around
80% between 06’-07’ (Figure 3.6). Main markets for Italian exports are the USA and China,
followed by the EU area, and supply is completely dominated by African countries (ITTO
2005).
Figure 3.6
Italy: Market of Tropical Veneer Sheets
0
20
40
60
80
100
120
140
2003 2004 2005 2006 2007
10
00
m3
Imports Exports Ap. Consumption
Source: United Nations Economic Commission for Europe, UNECE database
There is no specific information regarding furniture of tropical wood; then for Italy, which is
a high value added products manufacturer, exports of wooden furniture (Figure 3.7) sector
since 2004 has been almost unmovable and gaps with imports circa 5000 millions U$. Italy is
a net wooden furniture exporter.
Figure 3.7
Italy: Trade in Wooden Furniture
0
1,000,000
2,000,000
3,000,000
4,000,000
5,000,000
6,000,000
7,000,000
2002 2003 2004 2005 2006 2007
1000 U
S$
Imports Exports
Source: United Nations Economic Commission for Europe, UNECE database
35
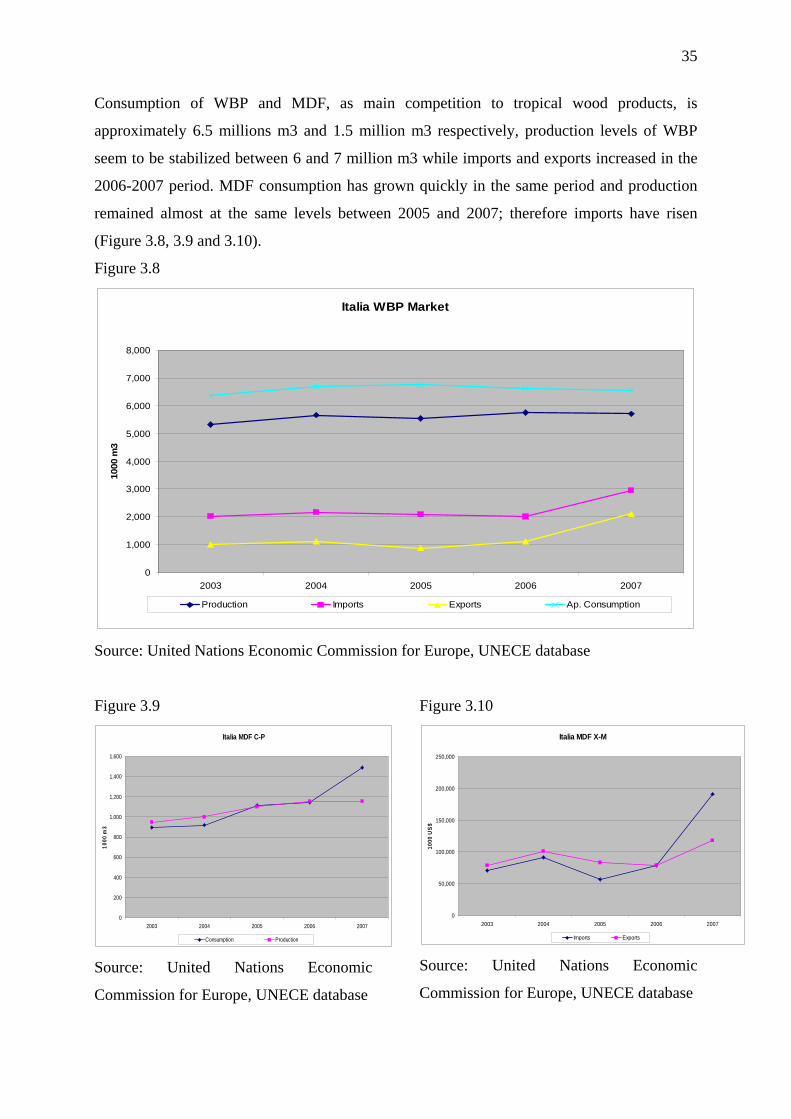
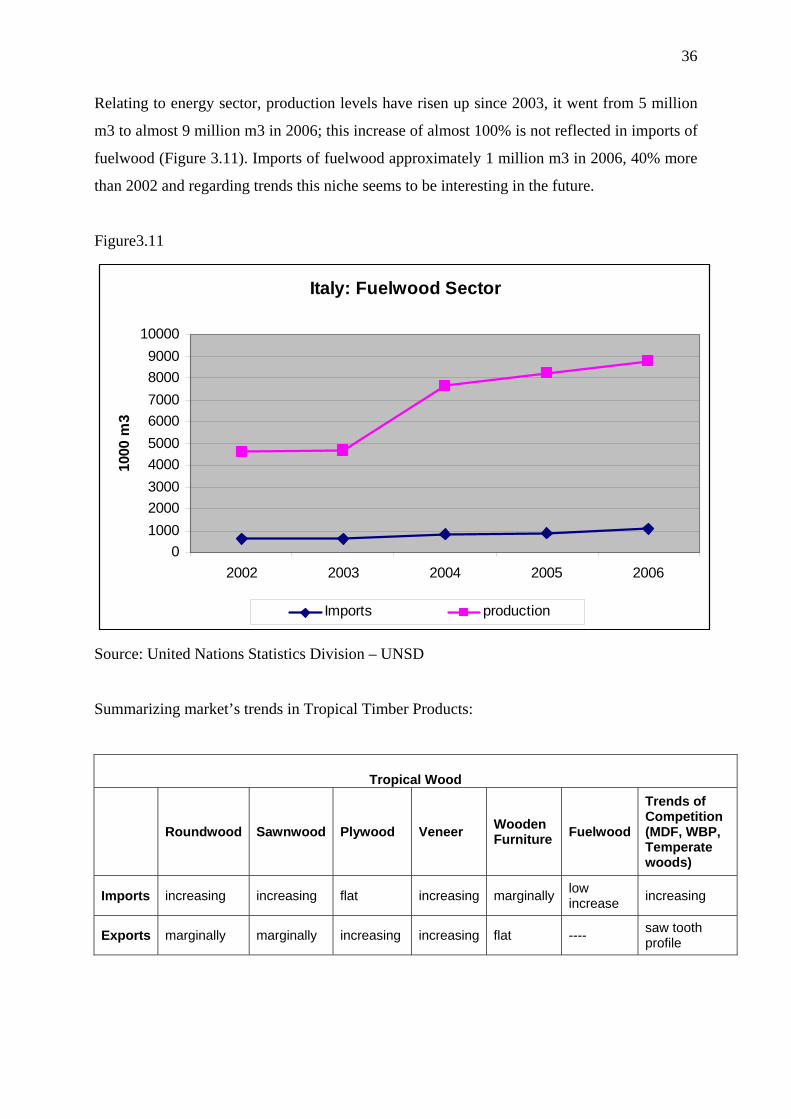
Consumption of WBP and MDF, as main competition to tropical wood products, is
approximately 6.5 millions m3 and 1.5 million m3 respectively, production levels of WBP
seem to be stabilized between 6 and 7 million m3 while imports and exports increased in the
2006-2007 period. MDF consumption has grown quickly in the same period and production
remained almost at the same levels between 2005 and 2007; therefore imports have risen
(Figure 3.8, 3.9 and 3.10).
Figure 3.8
Italia WBP Market
0
1,000
2,000
3,000
4,000
5,000
6,000
7,000
8,000
2003 2004 2005 2006 2007
1000 m
3
Production Imports Exports Ap. Consumption
Source: United Nations Economic Commission for Europe, UNECE database
Figure 3.9
Italia MDF C-P
0
200
400
600
800
1,000
1,200
1,400
1,600
2003 2004 2005 2006 2007
10
00
m3
Consumption Production
Source: United Nations Economic
Commission for Europe, UNECE database
Figure 3.10
Italia MDF X-M
0
50,000
100,000
150,000
200,000
250,000
2003 2004 2005 2006 2007
10
00
US
$
Imports Exports
Source: United Nations Economic
Commission for Europe, UNECE database
36
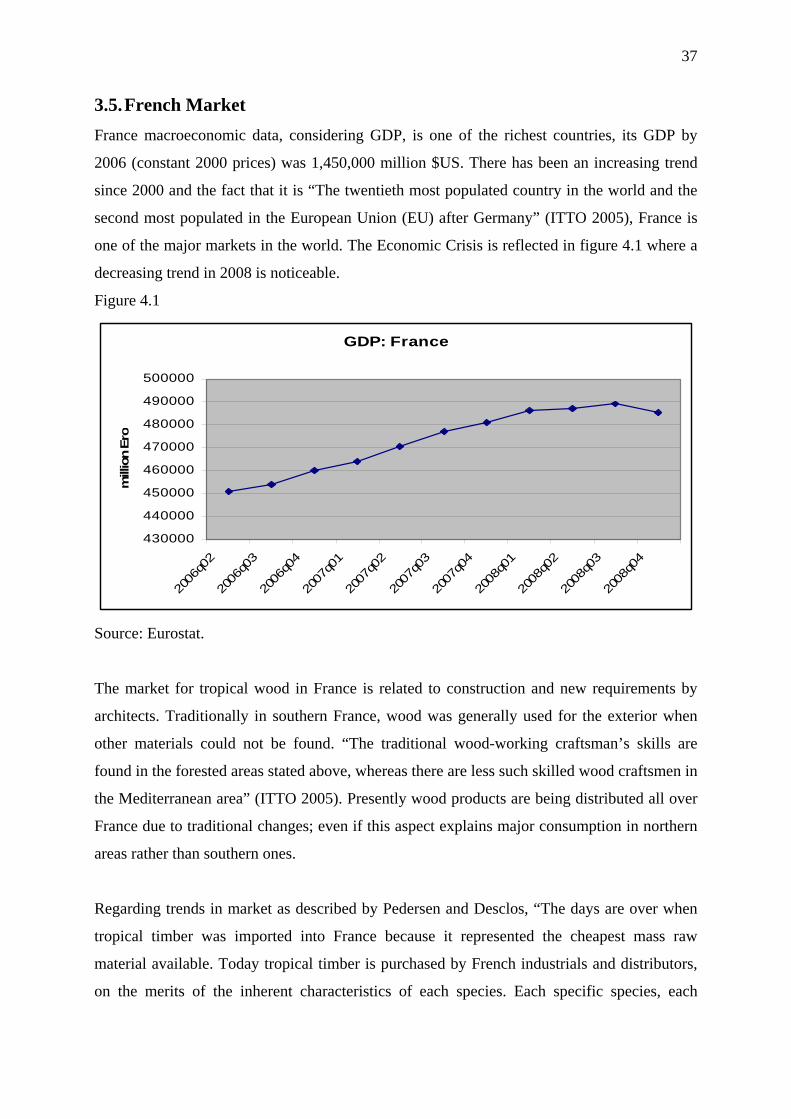
Relating to energy sector, production levels have risen up since 2003, it went from 5 million
m3 to almost 9 million m3 in 2006; this increase of almost 100% is not reflected in imports of
fuelwood (Figure 3.11). Imports of fuelwood approximately 1 million m3 in 2006, 40% more
than 2002 and regarding trends this niche seems to be interesting in the future.
Figure3.11
Italy: Fuelwood Sector
0
1000
2000
3000
4000
5000
6000
7000
8000
9000
10000
2002 2003 2004 2005 2006
1000
m3
Imports production
Source: United Nations Statistics Division – UNSD
Summarizing market’s trends in Tropical Timber Products:
Tropical Wood
Roundwood Sawnwood Plywood Veneer Wooden Furniture
Fuelwood
Trends of Competition (MDF, WBP, Temperate woods)
Imports increasing increasing flat increasing marginallylow increase
increasing
Exports marginally marginally increasing increasing flat ---- saw tooth profile
37
3.5. French Market
France macroeconomic data, considering GDP, is one of the richest countries, its GDP by
2006 (constant 2000 prices) was 1,450,000 million $US. There has been an increasing trend
since 2000 and the fact that it is “The twentieth most populated country in the world and the
second most populated in the European Union (EU) after Germany” (ITTO 2005), France is
one of the major markets in the world. The Economic Crisis is reflected in figure 4.1 where a
decreasing trend in 2008 is noticeable.
Figure 4.1
GDP: France
430000
440000
450000
460000
470000
480000
490000
500000
2006
q02
2006
q03
2006
q04
2007
q01
2007
q02
2007
q03
2007
q04
2008
q01
2008
q02
2008
q03
2008
q04
mill
ion E
ro
Source: Eurostat.
The market for tropical wood in France is related to construction and new requirements by
architects. Traditionally in southern France, wood was generally used for the exterior when
other materials could not be found. “The traditional wood-working craftsman’s skills are
found in the forested areas stated above, whereas there are less such skilled wood craftsmen in
the Mediterranean area” (ITTO 2005). Presently wood products are being distributed all over
France due to traditional changes; even if this aspect explains major consumption in northern
areas rather than southern ones.
Regarding trends in market as described by Pedersen and Desclos, “The days are over when
tropical timber was imported into France because it represented the cheapest mass raw
material available. Today tropical timber is purchased by French industrials and distributors,
on the merits of the inherent characteristics of each species. Each specific species, each
38
specific product specification, each specific quality definition corresponds exactly with a
specific end-use application.”
The trade structure is configured in order to minimize costs by unnecessary intermediates and
bring demand and offer of timber as close as possible. For example the creation of the web-
site www.bois.com/professionnels/campagne where construction companies, architects,
builders obtain information about wood-product use in technically advanced projects (ITTO
2005).
Figure 4.2
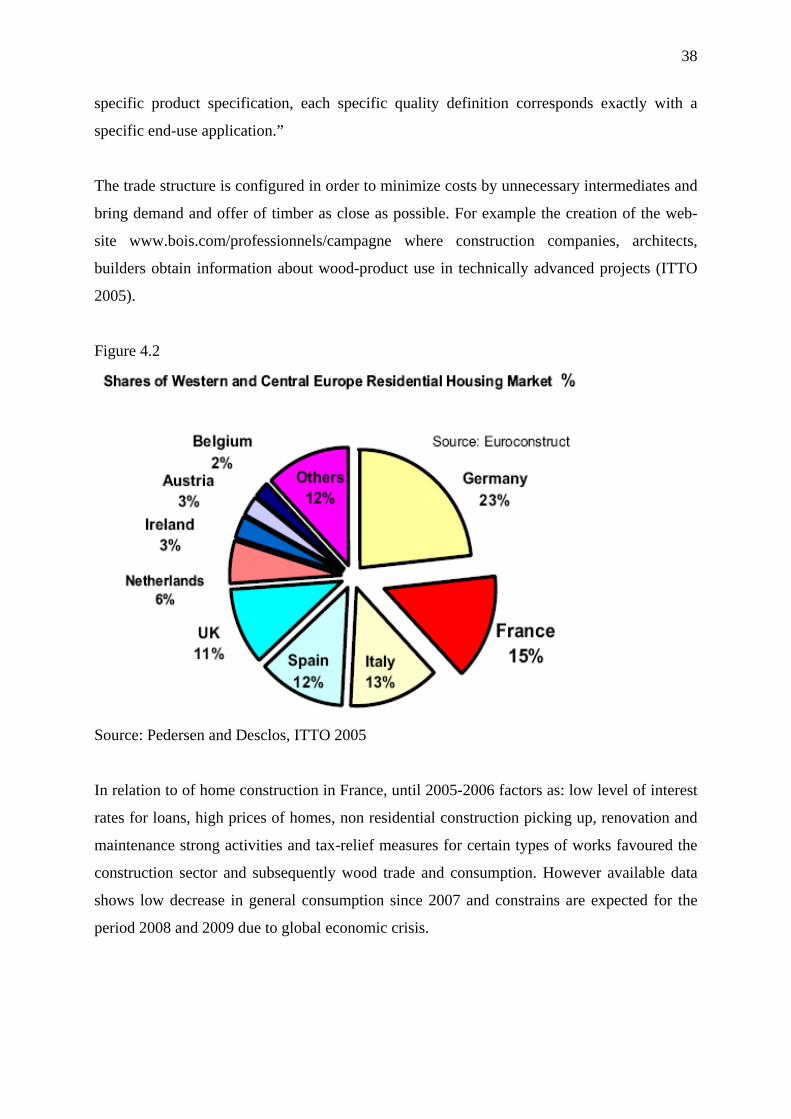
Source: Pedersen and Desclos, ITTO 2005
In relation to of home construction in France, until 2005-2006 factors as: low level of interest
rates for loans, high prices of homes, non residential construction picking up, renovation and
maintenance strong activities and tax-relief measures for certain types of works favoured the
construction sector and subsequently wood trade and consumption. However available data
shows low decrease in general consumption since 2007 and constrains are expected for the
period 2008 and 2009 due to global economic crisis.
39
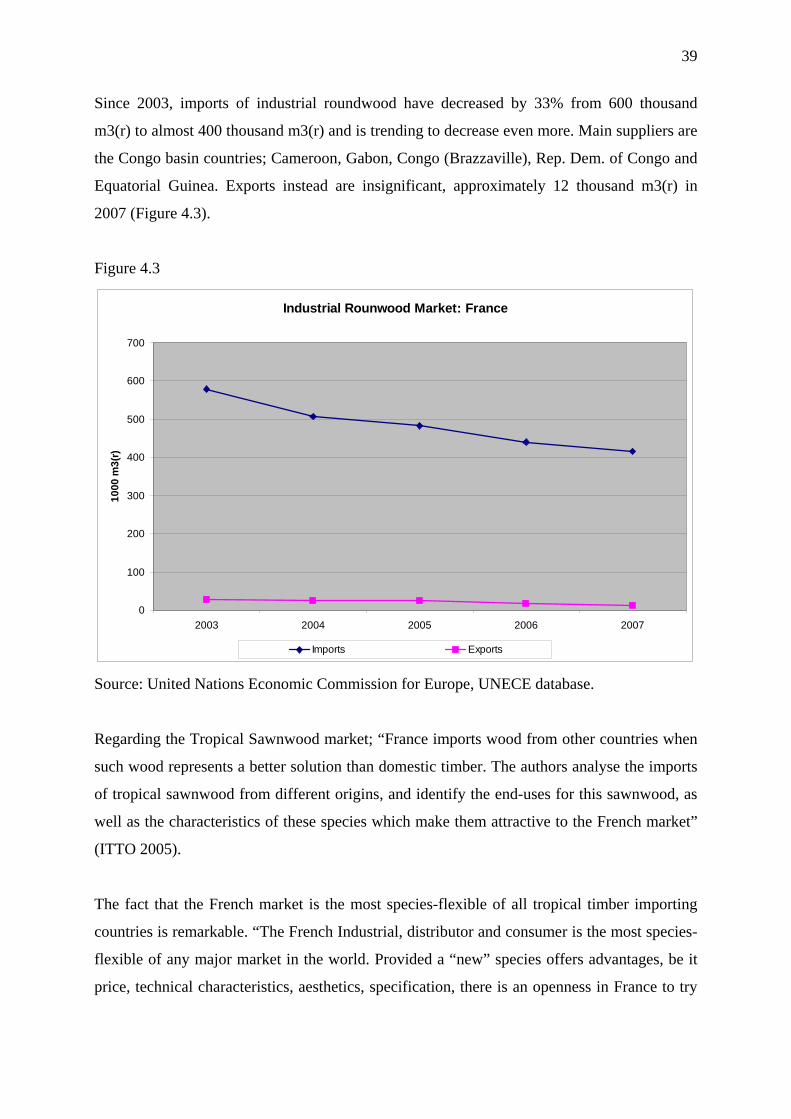
Since 2003, imports of industrial roundwood have decreased by 33% from 600 thousand
m3(r) to almost 400 thousand m3(r) and is trending to decrease even more. Main suppliers are
the Congo basin countries; Cameroon, Gabon, Congo (Brazzaville), Rep. Dem. of Congo and
Equatorial Guinea. Exports instead are insignificant, approximately 12 thousand m3(r) in
2007 (Figure 4.3).
Figure 4.3
Industrial Rounwood Market: France
0
100
200
300
400
500
600
700
2003 2004 2005 2006 2007
10
00 m
3(r
)
Imports Exports
Source: United Nations Economic Commission for Europe, UNECE database.
Regarding the Tropical Sawnwood market; “France imports wood from other countries when
such wood represents a better solution than domestic timber. The authors analyse the imports
of tropical sawnwood from different origins, and identify the end-uses for this sawnwood, as
well as the characteristics of these species which make them attractive to the French market”
(ITTO 2005).
The fact that the French market is the most species-flexible of all tropical timber importing
countries is remarkable. “The French Industrial, distributor and consumer is the most species-
flexible of any major market in the world. Provided a “new” species offers advantages, be it
price, technical characteristics, aesthetics, specification, there is an openness in France to try

40
something new which is rarely found in other tropical timber importing countries” (ITTO
2005).
Apparent consumption and imports of tropical sawnwood has increased by 20% in the 2006-
2007 period. Imports reached 500 thousands m3, the highest level in the last 4 years;
Consumption rose from circa 500 thousands m3 in 2003 to 600 thousand m3 in 2007. Exports
are insignificant compared to levels of imports. Local production shows a flat movement in
past 5 years, approximately 150 thousands m3 (Figure 4.4).
Figure 4.4
Tropical Sawnwood Market: France
0
100
200
300
400
500
600
700
2003 2004 2005 2006 2007
1000 m
3(s
)
Production Imports Exports Ap. Consumption
Source: United Nations Economic Commission for Europe, UNECE database.
The French tropical plywood market (Figure 4.5) has been affected by the raw materials
competition; production tends to decrease every year as well as consumption. Decreasing
rates of consumption are not as high as production rates. Imports have been increasing since
2005.
Considering Pedersen and Desclos’ statements; “As a consumer, importer, producer and
exporter, France has a unique profile in the trade of tropical plywood, French companies have
a long experience of tropical plywood manufacturing in France, but this sector is now in a
serious crisis. Several French producers are facing severe difficulties” (ITTO 2005).
41
Figure 4.5
Tropical Plywood Market: France
0
50
100
150
200
250
300
350
2000 2001 2002 2003 2004 2005 2006 2007
100
0 m
3
Production Imports Exports Ap. Consumption
Source: United Nations Economic Commission for Europe, UNECE database.
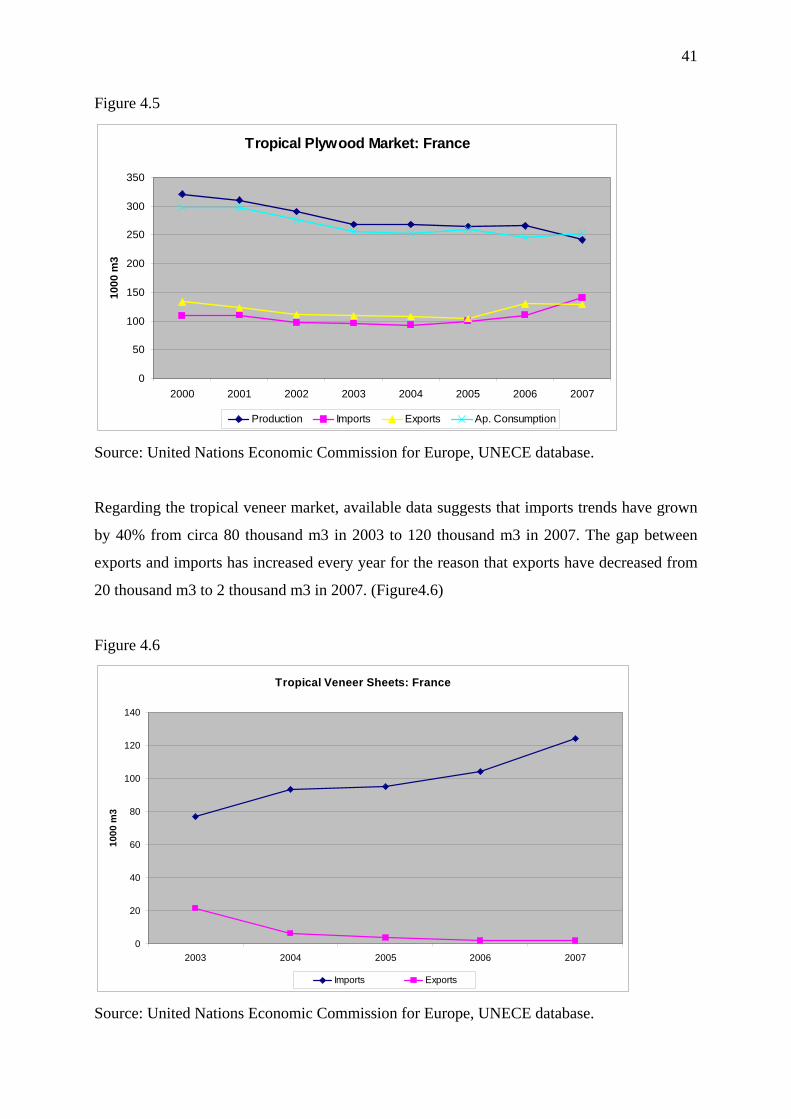
Regarding the tropical veneer market, available data suggests that imports trends have grown
by 40% from circa 80 thousand m3 in 2003 to 120 thousand m3 in 2007. The gap between
exports and imports has increased every year for the reason that exports have decreased from
20 thousand m3 to 2 thousand m3 in 2007. (Figure4.6)
Figure 4.6
Tropical Veneer Sheets: France
0
20
40
60
80
100
120
140
2003 2004 2005 2006 2007
100
0 m
3
Imports Exports
Source: United Nations Economic Commission for Europe, UNECE database.
42
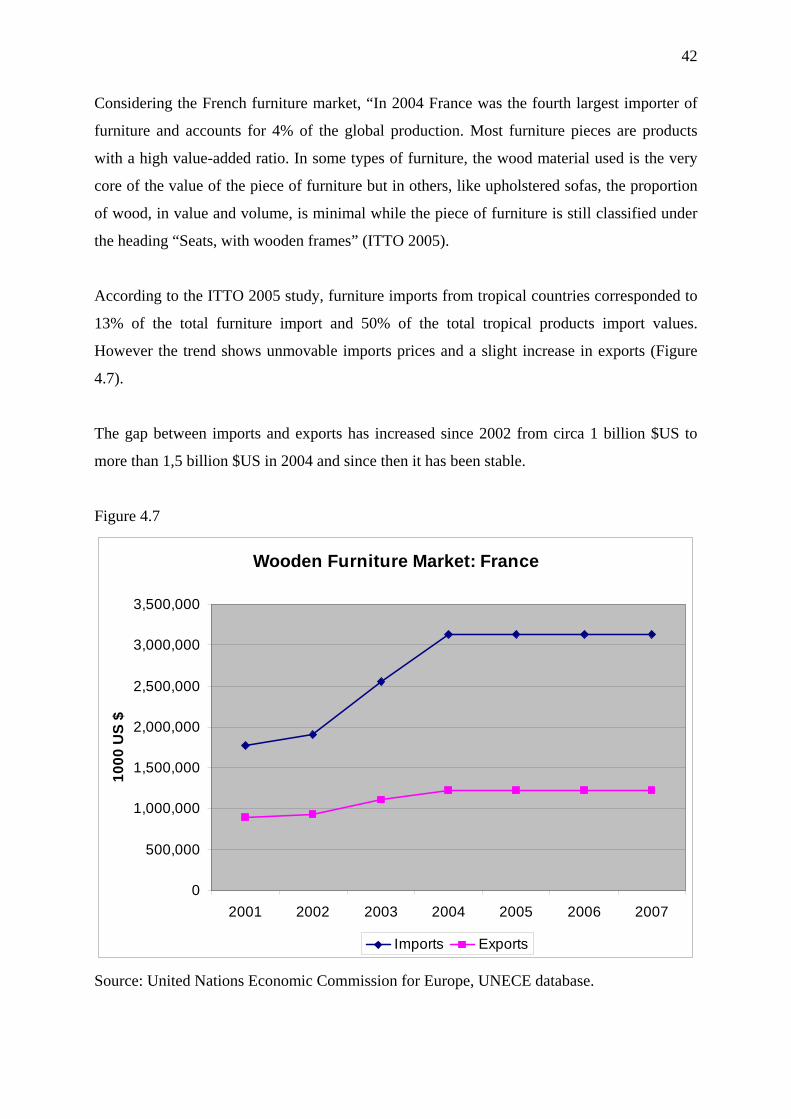
Considering the French furniture market, “In 2004 France was the fourth largest importer of
furniture and accounts for 4% of the global production. Most furniture pieces are products
with a high value-added ratio. In some types of furniture, the wood material used is the very
core of the value of the piece of furniture but in others, like upholstered sofas, the proportion
of wood, in value and volume, is minimal while the piece of furniture is still classified under
the heading “Seats, with wooden frames” (ITTO 2005).
According to the ITTO 2005 study, furniture imports from tropical countries corresponded to
13% of the total furniture import and 50% of the total tropical products import values.
However the trend shows unmovable imports prices and a slight increase in exports (Figure
4.7).
The gap between imports and exports has increased since 2002 from circa 1 billion $US to
more than 1,5 billion $US in 2004 and since then it has been stable.
Figure 4.7
Wooden Furniture Market: France
0
500,000
1,000,000
1,500,000
2,000,000
2,500,000
3,000,000
3,500,000
2001 2002 2003 2004 2005 2006 2007
10
00
US
$
Imports Exports
Source: United Nations Economic Commission for Europe, UNECE database.
43
Figure 4.8
France: Fuelwood Production
0
5000
10000
15000
20000
25000
30000
35000
40000
45000
1996 1997 1998 1999 2000 2001 2002 2003 2004 2005 2006
100
0 m
3
Source: United Nations Statistics Division
– UNSD
Figure 4.9
France: Fuelwood Imports
0
10
20
30
40
50
60
2002 2003 2004 2005 2006
10
00
m3
Source: United Nations Statistics Division
– UNSD
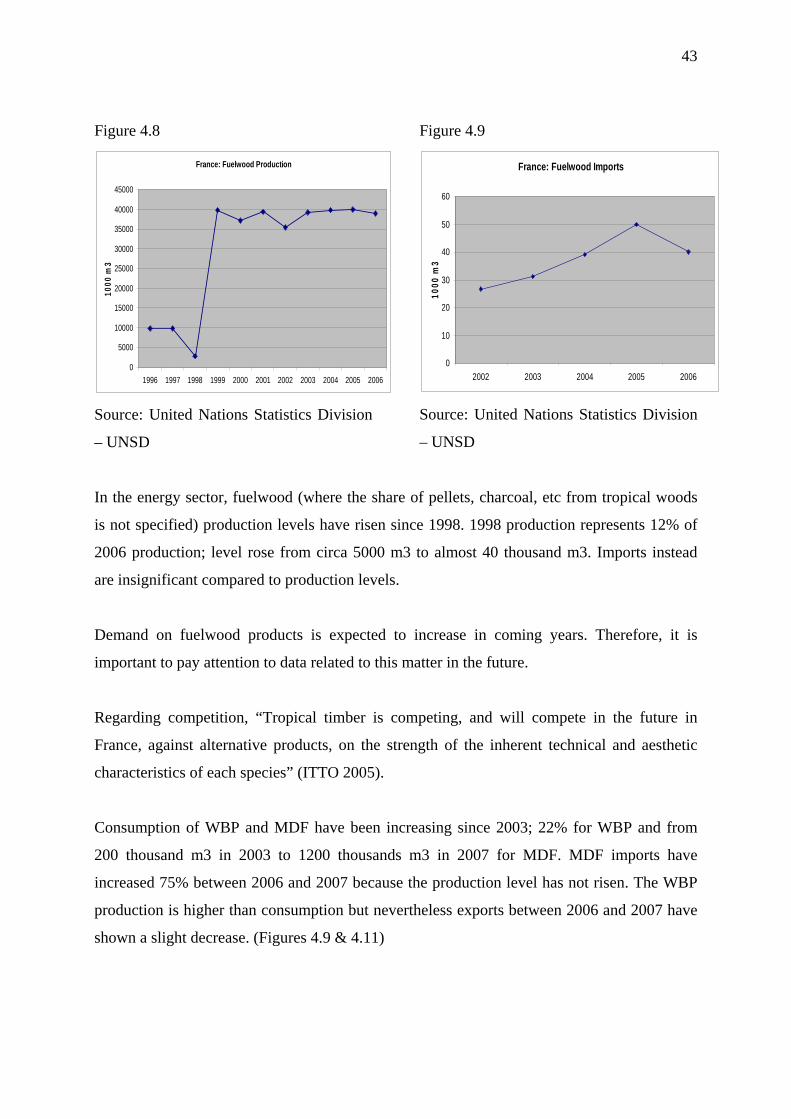
In the energy sector, fuelwood (where the share of pellets, charcoal, etc from tropical woods
is not specified) production levels have risen since 1998. 1998 production represents 12% of
2006 production; level rose from circa 5000 m3 to almost 40 thousand m3. Imports instead
are insignificant compared to production levels.
Demand on fuelwood products is expected to increase in coming years. Therefore, it is
important to pay attention to data related to this matter in the future.
Regarding competition, “Tropical timber is competing, and will compete in the future in
France, against alternative products, on the strength of the inherent technical and aesthetic
characteristics of each species” (ITTO 2005).
Consumption of WBP and MDF have been increasing since 2003; 22% for WBP and from
200 thousand m3 in 2003 to 1200 thousands m3 in 2007 for MDF. MDF imports have
increased 75% between 2006 and 2007 because the production level has not risen. The WBP
production is higher than consumption but nevertheless exports between 2006 and 2007 have
shown a slight decrease. (Figures 4.9 & 4.11)

44
Figure 4.9
WBP Market: France
0
1,000
2,000
3,000
4,000
5,000
6,000
7,000
2003 2004 2005 2006 2007
1000
m3
Production Imports Exports Ap. Consumption
Source: United Nations Economic Commission for Europe, UNECE database.
Figure 4.10
MDF Market: France
0
200
400
600
800
1,000
1,200
1,400
2003 2004 2005 2006 2007
10
00
m3
Consumption Production
Source: United Nations Economic
Commission for Europe, UNECE database.
Figure 4.11
MDF Market: France
0
50,000
100,000
150,000
200,000
250,000
300,000
2003 2004 2005 2006 2007
10
00
US
$
Imports Exports
Source: United Nations Economic
Commission for Europe, UNECE database.
Summarizing market’s trends in Tropical Timber Products:
Tropical Wood
Roundwood Sawnwood Plywood Veneer Wooden Furniture
Fuelwood
Trends of Competition (MDF, WBP, Temperate woods)
Imports decreasing increasing low increase
increasing High, Flat low increase
increasing
Exports decreasing marginally flat decreasing flat ---- saw tooth profile
45
3.6. Iberian Market
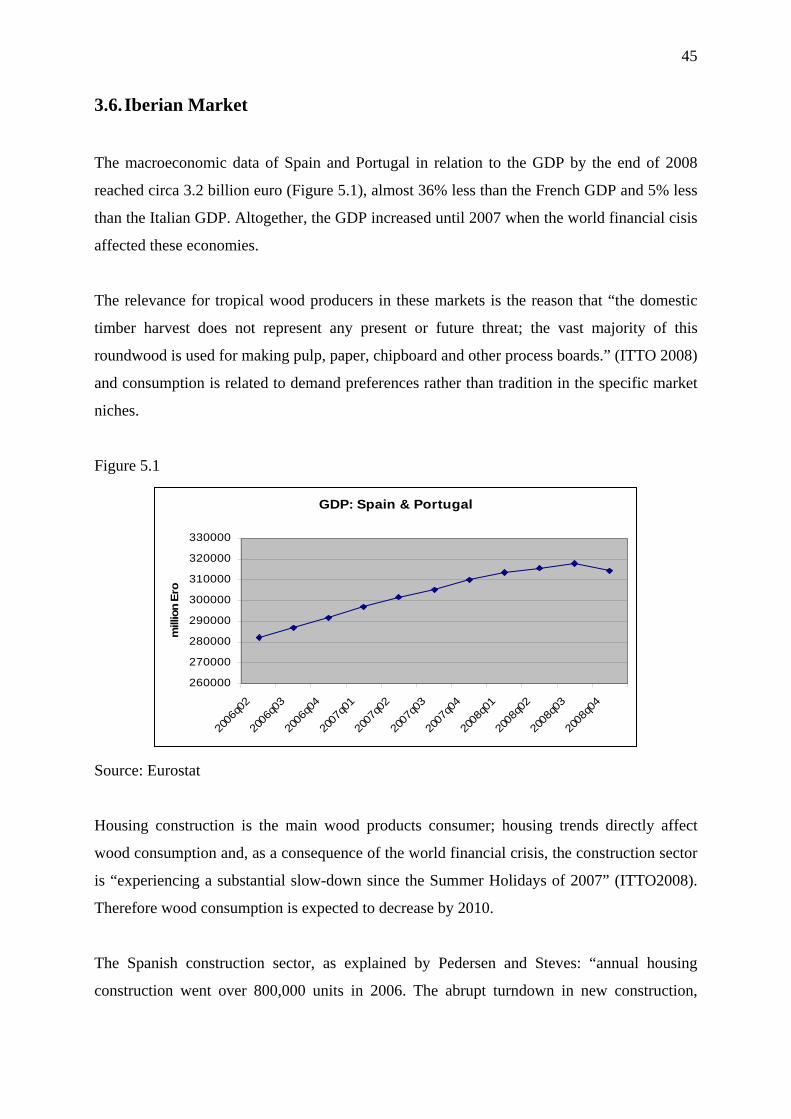
The macroeconomic data of Spain and Portugal in relation to the GDP by the end of 2008
reached circa 3.2 billion euro (Figure 5.1), almost 36% less than the French GDP and 5% less
than the Italian GDP. Altogether, the GDP increased until 2007 when the world financial cisis
affected these economies.
The relevance for tropical wood producers in these markets is the reason that “the domestic
timber harvest does not represent any present or future threat; the vast majority of this
roundwood is used for making pulp, paper, chipboard and other process boards.” (ITTO 2008)
and consumption is related to demand preferences rather than tradition in the specific market
niches.
Figure 5.1
GDP: Spain & Portugal
260000
270000
280000
290000
300000
310000
320000
330000
2006
q02
2006
q03
2006
q04
2007
q01
2007
q02
2007
q03
2007
q04
2008
q01
2008
q02
2008
q03
2008
q04
mill
ion E
ro
Source: Eurostat
Housing construction is the main wood products consumer; housing trends directly affect
wood consumption and, as a consequence of the world financial crisis, the construction sector
is “experiencing a substantial slow-down since the Summer Holidays of 2007” (ITTO2008).
Therefore wood consumption is expected to decrease by 2010.
The Spanish construction sector, as explained by Pedersen and Steves: “annual housing
construction went over 800,000 units in 2006. The abrupt turndown in new construction,
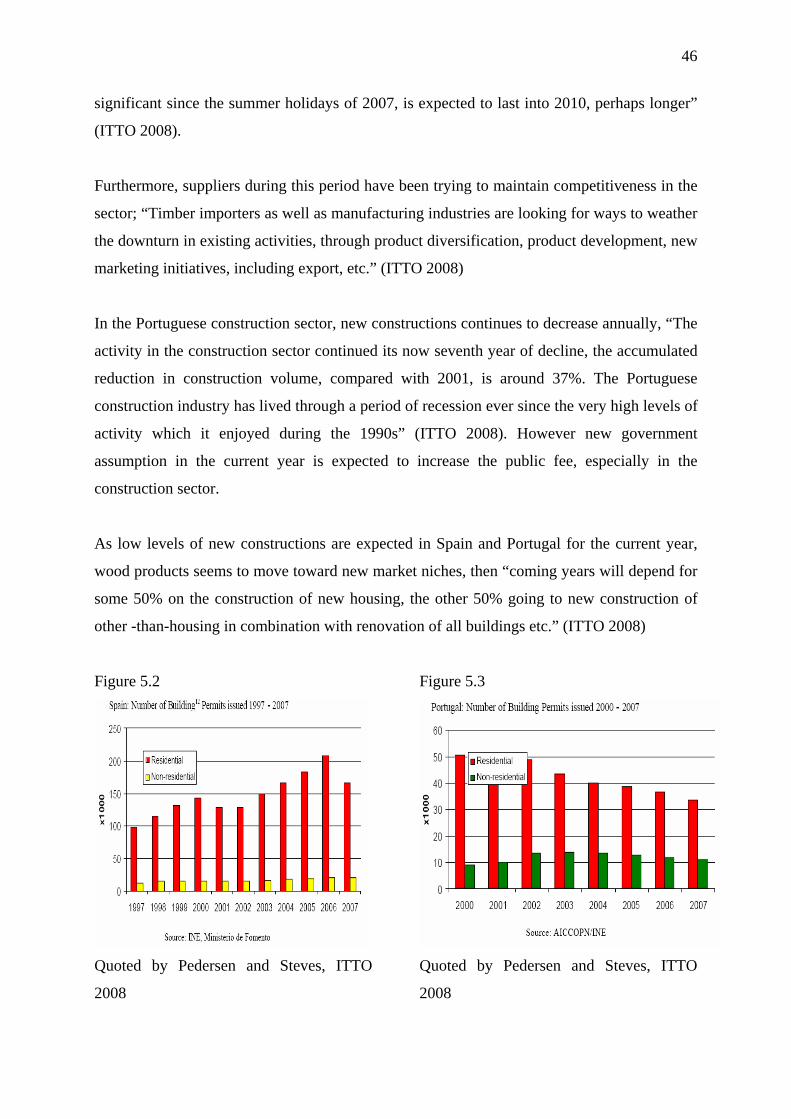
46
significant since the summer holidays of 2007, is expected to last into 2010, perhaps longer”
(ITTO 2008).
Furthermore, suppliers during this period have been trying to maintain competitiveness in the
sector; “Timber importers as well as manufacturing industries are looking for ways to weather
the downturn in existing activities, through product diversification, product development, new
marketing initiatives, including export, etc.” (ITTO 2008)
In the Portuguese construction sector, new constructions continues to decrease annually, “The
activity in the construction sector continued its now seventh year of decline, the accumulated
reduction in construction volume, compared with 2001, is around 37%. The Portuguese
construction industry has lived through a period of recession ever since the very high levels of
activity which it enjoyed during the 1990s” (ITTO 2008). However new government
assumption in the current year is expected to increase the public fee, especially in the
construction sector.
As low levels of new constructions are expected in Spain and Portugal for the current year,
wood products seems to move toward new market niches, then “coming years will depend for
some 50% on the construction of new housing, the other 50% going to new construction of
other -than-housing in combination with renovation of all buildings etc.” (ITTO 2008)
Figure 5.2
Quoted by Pedersen and Steves, ITTO
2008
Figure 5.3
Quoted by Pedersen and Steves, ITTO
2008

47
Regarding the tropical wood market, like in most countries, specific data identifying the
production and trade of timber products made from tropical wood is not clear enough.
Nevertheless, available data indicates in most items a saw tooth movement.
Altogether industrial roundwood trade (Figure 5.4) confirms the decreasing import trend. It
declined from almost 350 thousand m3(r) to 300 thousands m3(r) during the 2003-2007
period. “This decline is expected to continue, as the tropical timber producing countries are
exporting less or no logs, increasing the export of first or secondary processed wood
products.” (ITTO 2008)
Spain and Portugal’s main suppliers of industrial roundwood are African countries from the
Congo River basin, where log exportation is not yet forbidden
Figure 5.4
Tropical Industrial Rounwood Trade: Spain and Portugal
0
50
100
150
200
250
300
350
400
2003 2004 2005 2006 2007
1000
m3(
r)
Imports Exports
Source: United Nations Economic Commission for Europe, UNECE database.
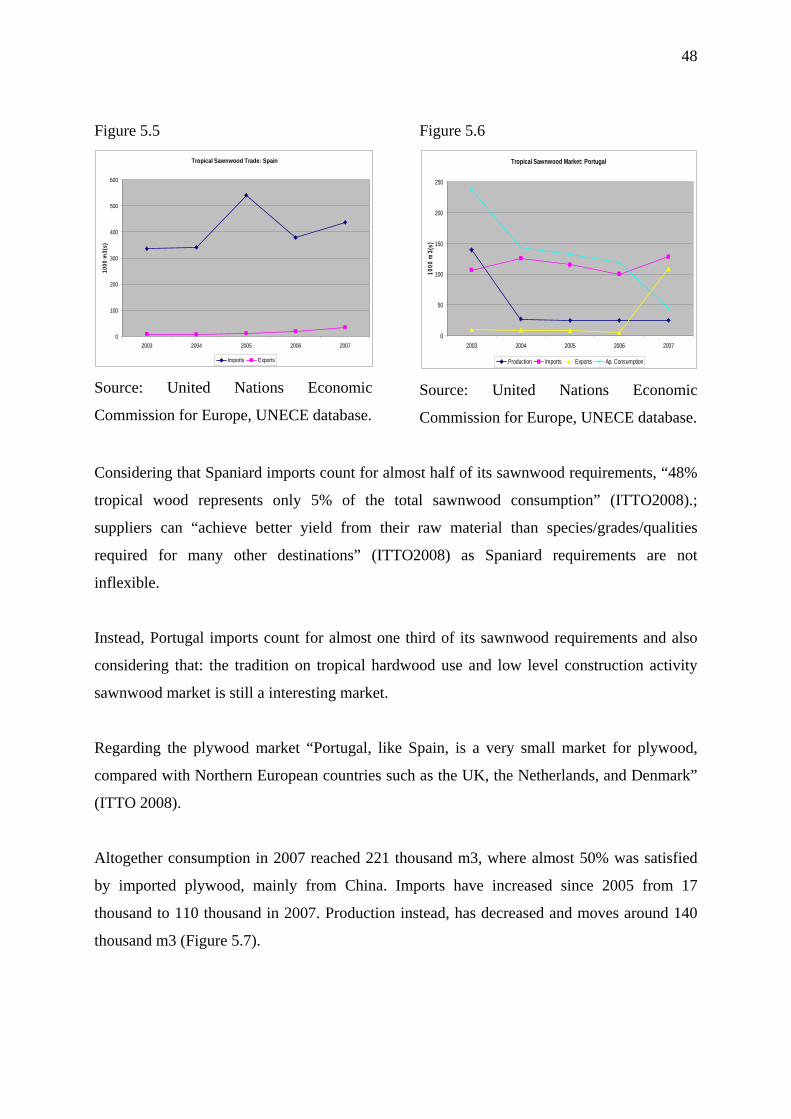
Regarding tropical sawnwood (Figures 5.5 & 5.6), Spaniard imports show a saw tooth
movement from 2003 until 2007, nevertheless in the same period imports have increased 30%
reaching a maximal value of 541 thousand m3 in 2005. On the other hand, Portuguese
consumption has decreased from circa 250 thousand m3 in 2003 to almost 50 thousand m3 in
2007; as a consequence exports have increased while imports remained almost constant.
48
Figure 5.5
Tropical Sawnwood Trade: Spain
0
100
200
300
400
500
600
2003 2004 2005 2006 2007
1000
m3(
s)
Imports Exports
Source: United Nations Economic
Commission for Europe, UNECE database.
Figure 5.6
Tropical Sawnwood Market: Portugal
0
50
100
150
200
250
2003 2004 2005 2006 2007
1000
m3(
s)
Production Imports Exports Ap. Consumption
Source: United Nations Economic
Commission for Europe, UNECE database.
Considering that Spaniard imports count for almost half of its sawnwood requirements, “48%
tropical wood represents only 5% of the total sawnwood consumption” (ITTO2008).;
suppliers can “achieve better yield from their raw material than species/grades/qualities
required for many other destinations” (ITTO2008) as Spaniard requirements are not
inflexible.
Instead, Portugal imports count for almost one third of its sawnwood requirements and also
considering that: the tradition on tropical hardwood use and low level construction activity
sawnwood market is still a interesting market.
Regarding the plywood market “Portugal, like Spain, is a very small market for plywood,
compared with Northern European countries such as the UK, the Netherlands, and Denmark”
(ITTO 2008).
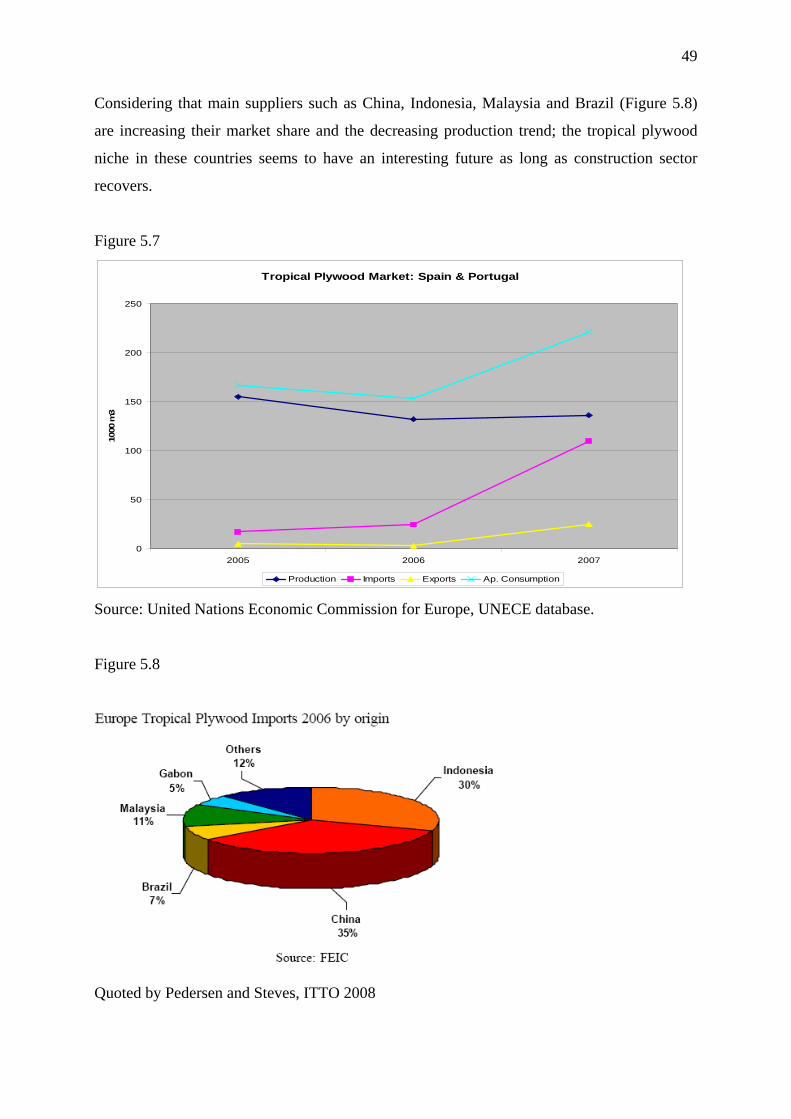
Altogether consumption in 2007 reached 221 thousand m3, where almost 50% was satisfied
by imported plywood, mainly from China. Imports have increased since 2005 from 17
thousand to 110 thousand in 2007. Production instead, has decreased and moves around 140
thousand m3 (Figure 5.7).
49
Considering that main suppliers such as China, Indonesia, Malaysia and Brazil (Figure 5.8)
are increasing their market share and the decreasing production trend; the tropical plywood
niche in these countries seems to have an interesting future as long as construction sector
recovers.
Figure 5.7
Tropical Plywood Market: Spain & Portugal
0
50
100
150
200
250
2005 2006 2007
1000 m
3
Production Imports Exports Ap. Consumption
Source: United Nations Economic Commission for Europe, UNECE database.
Figure 5.8
Quoted by Pedersen and Steves, ITTO 2008
50
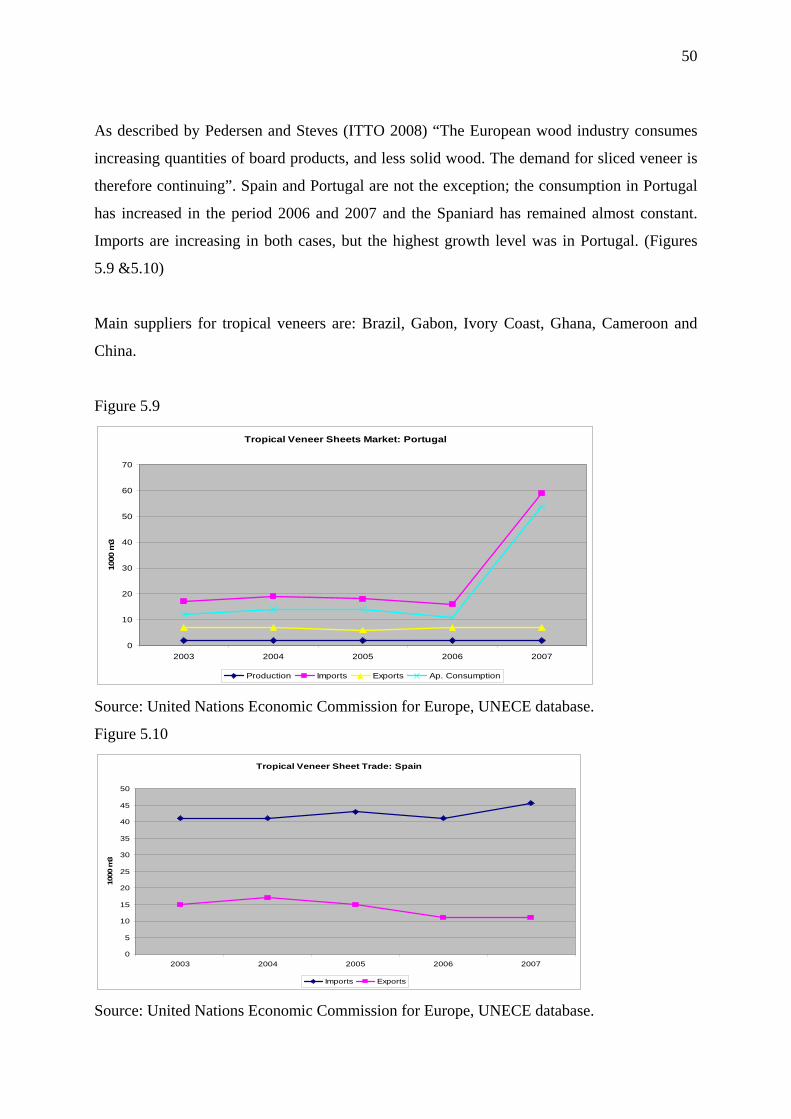
As described by Pedersen and Steves (ITTO 2008) “The European wood industry consumes
increasing quantities of board products, and less solid wood. The demand for sliced veneer is
therefore continuing”. Spain and Portugal are not the exception; the consumption in Portugal
has increased in the period 2006 and 2007 and the Spaniard has remained almost constant.
Imports are increasing in both cases, but the highest growth level was in Portugal. (Figures
5.9 &5.10)
Main suppliers for tropical veneers are: Brazil, Gabon, Ivory Coast, Ghana, Cameroon and
China.
Figure 5.9
Tropical Veneer Sheets Market: Portugal
0
10
20
30
40
50
60
70
2003 2004 2005 2006 2007
1000 m
3
Production Imports Exports Ap. Consumption
Source: United Nations Economic Commission for Europe, UNECE database.
Figure 5.10
Tropical Veneer Sheet Trade: Spain
0
5
10
15
20
25
30
35
40
45
50
2003 2004 2005 2006 2007
1000 m
3
Imports Exports
Source: United Nations Economic Commission for Europe, UNECE database.
51
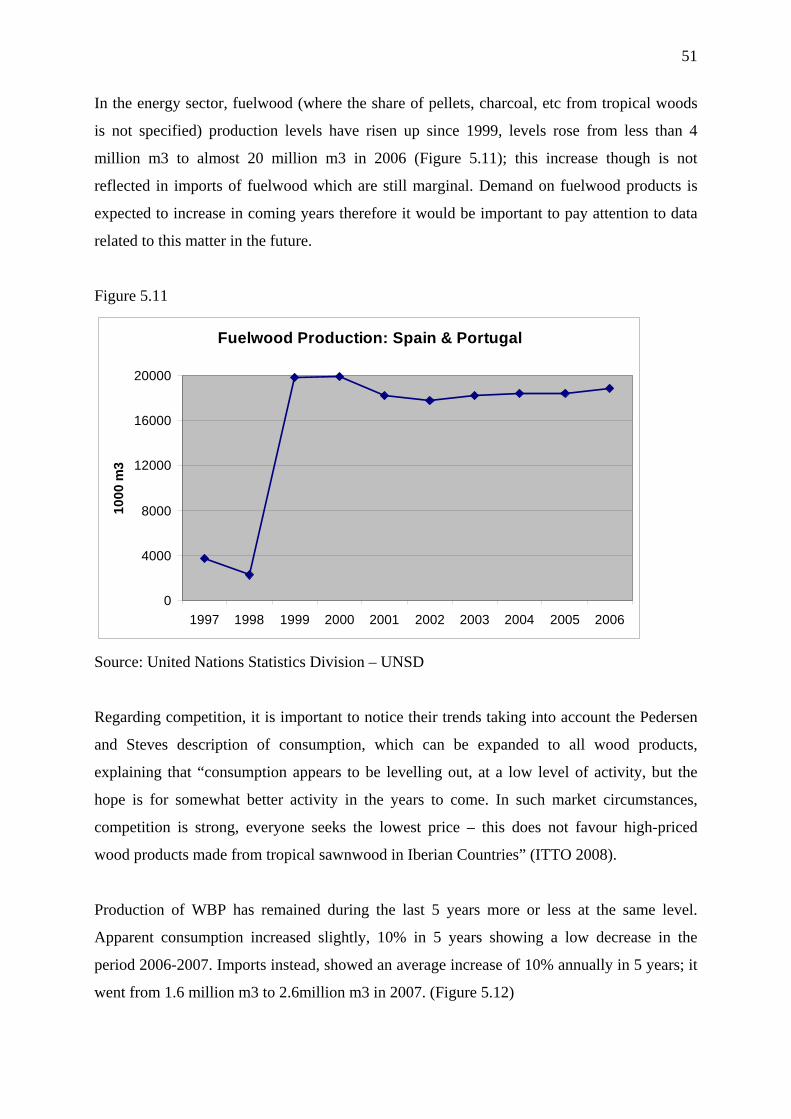
In the energy sector, fuelwood (where the share of pellets, charcoal, etc from tropical woods
is not specified) production levels have risen up since 1999, levels rose from less than 4
million m3 to almost 20 million m3 in 2006 (Figure 5.11); this increase though is not
reflected in imports of fuelwood which are still marginal. Demand on fuelwood products is
expected to increase in coming years therefore it would be important to pay attention to data
related to this matter in the future.
Figure 5.11
Fuelwood Production: Spain & Portugal
0
4000
8000
12000
16000
20000
1997 1998 1999 2000 2001 2002 2003 2004 2005 2006
10
00
m3
Source: United Nations Statistics Division – UNSD
Regarding competition, it is important to notice their trends taking into account the Pedersen
and Steves description of consumption, which can be expanded to all wood products,
explaining that “consumption appears to be levelling out, at a low level of activity, but the
hope is for somewhat better activity in the years to come. In such market circumstances,
competition is strong, everyone seeks the lowest price – this does not favour high-priced
wood products made from tropical sawnwood in Iberian Countries” (ITTO 2008).
Production of WBP has remained during the last 5 years more or less at the same level.
Apparent consumption increased slightly, 10% in 5 years showing a low decrease in the
period 2006-2007. Imports instead, showed an average increase of 10% annually in 5 years; it
went from 1.6 million m3 to 2.6million m3 in 2007. (Figure 5.12)

52
Figure 5.12
WBP Market: Spain & Portugal
0
1,000
2,000
3,000
4,000
5,000
6,000
7,000
2003 2004 2005 2006 2007
1000
m3
Production Imports Exports Ap. Consumption
Source: United Nations Economic Commission for Europe, UNECE database.
In relation to the MDF market, Spaniard consumption has abruptly fallen between 2006 and
2007; as a consequence exports have increased and imports decreased while production levels
have remained at the same levels compared to precedent years.
Figure 5.13
MDF Market: Spain
0
200
400
600
800
1,000
1,200
1,400
1,600
2003 2004 2005 2006 2007
10
00 m
3
Consumption Production
Source: United Nations Economic
Commission for Europe, UNECE database.
Figure 5.14
MFD Market: Spain
0
50,000
100,000
150,000
200,000
250,000
300,000
350,000
400,000
450,000
500,000
2003 2004 2005 2006 2007
10
00 U
S $
Imports Exports
Source: United Nations Economic
Commission for Europe, UNECE database.
53
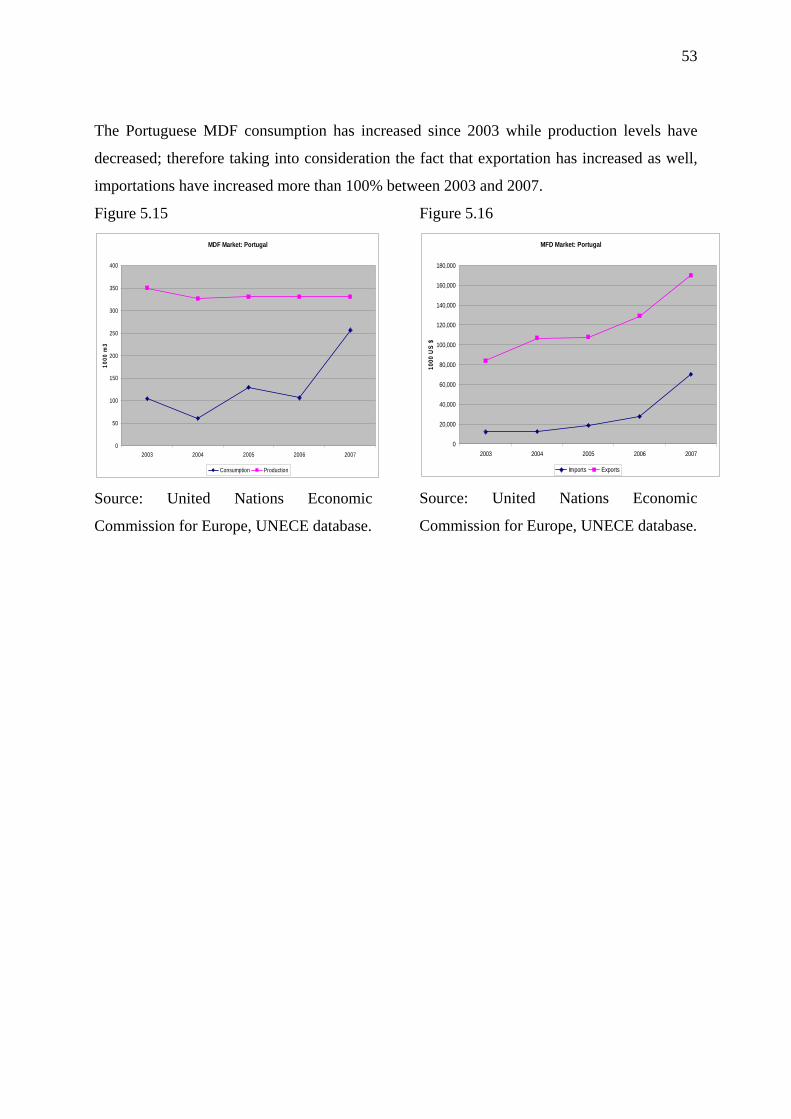
The Portuguese MDF consumption has increased since 2003 while production levels have
decreased; therefore taking into consideration the fact that exportation has increased as well,
importations have increased more than 100% between 2003 and 2007.
Figure 5.15
MDF Market: Portugal
0
50
100
150
200
250
300
350
400
2003 2004 2005 2006 2007
10
00
m3
Consumption Production
Source: United Nations Economic
Commission for Europe, UNECE database.
Figure 5.16
MFD Market: Portugal
0
20,000
40,000
60,000
80,000
100,000
120,000
140,000
160,000
180,000
2003 2004 2005 2006 2007
1000
US
$
Imports Exports
Source: United Nations Economic
Commission for Europe, UNECE database.
54
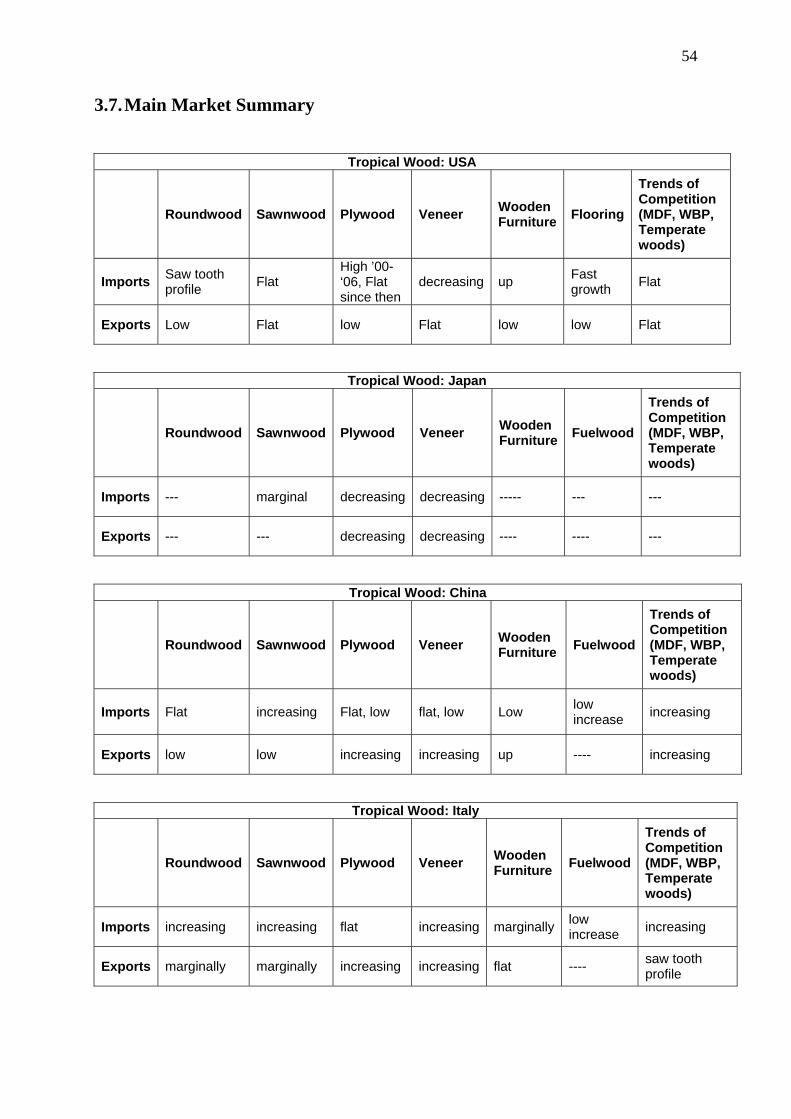
3.7. Main Market Summary
Tropical Wood: USA
Roundwood Sawnwood Plywood Veneer Wooden Furniture
Flooring
Trends of Competition (MDF, WBP, Temperate woods)
Imports Saw tooth profile
Flat High ’00-‘06, Flat since then
decreasing up Fast growth
Flat
Exports Low Flat low Flat low low Flat
Tropical Wood: Japan
Roundwood Sawnwood Plywood Veneer Wooden Furniture
Fuelwood
Trends of Competition (MDF, WBP, Temperate woods)
Imports --- marginal decreasing decreasing ----- --- ---
Exports --- --- decreasing decreasing ---- ---- ---
Tropical Wood: China
Roundwood Sawnwood Plywood Veneer Wooden Furniture
Fuelwood
Trends of Competition (MDF, WBP, Temperate woods)
Imports Flat increasing Flat, low flat, low Low low increase
increasing
Exports low low increasing increasing up ---- increasing
Tropical Wood: Italy
Roundwood Sawnwood Plywood Veneer Wooden Furniture
Fuelwood
Trends of Competition (MDF, WBP, Temperate woods)
Imports increasing increasing flat increasing marginallylow increase
increasing
Exports marginally marginally increasing increasing flat ---- saw tooth profile
55
Tropical Wood: France
Roundwood Sawnwood Plywood Veneer Wooden Furniture
Fuelwood
Trends of Competition (MDF, WBP, Temperate woods)
Imports decreasing increasing low increase
increasing High, Flat low increase
increasing
Exports decreasing marginally flat decreasing flat ---- saw tooth profile
Tropical Wood: Spain
Roundwood Sawnwood Plywood Veneer Wooden Furniture
Fuelwood
Trends of Competition (MDF, WBP, Temperate woods)
Imports decreasing increasing high growth
increasing not analyzed
low increase
increasing
Exports marginal marginal decreasing decreasingnot analyzed
---- saw tooth profile, decreasing
Tropical Wood: Portugal
Roundwood Sawnwood Plywood Veneer Wooden Furniture
Fuelwood
Trends of Competition (MDF, WBP, Temperate woods)
Imports decreasing increasing High increase
high increase
not analyzed
low increase
increasing
Exports marginal increasing low increase
flat not analyzed
---- saw tooth profile, decreasing
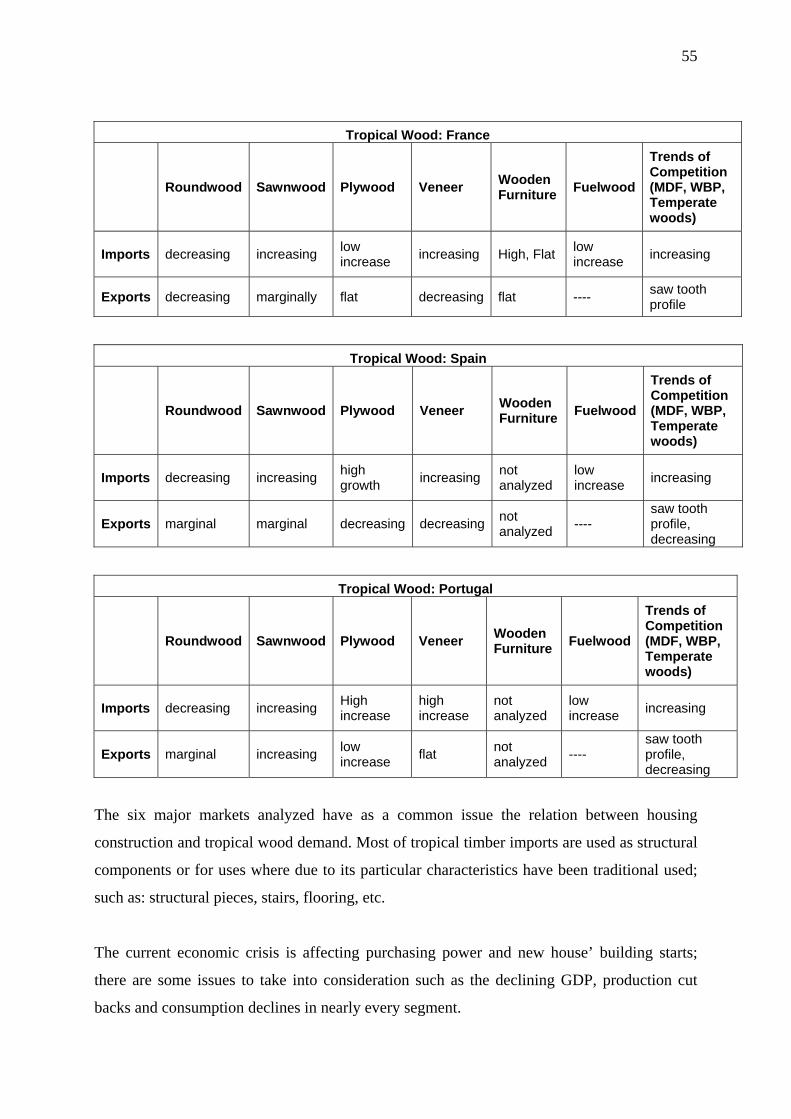
The six major markets analyzed have as a common issue the relation between housing
construction and tropical wood demand. Most of tropical timber imports are used as structural
components or for uses where due to its particular characteristics have been traditional used;
such as: structural pieces, stairs, flooring, etc.
The current economic crisis is affecting purchasing power and new house’ building starts;
there are some issues to take into consideration such as the declining GDP, production cut
backs and consumption declines in nearly every segment.
56
Imports of tropical roundwood have remained at low levels with a declining trend. Factors
such as logs exports prohibition in supplier’s countries, environmental issues, high
transportation costs, processing labour costs, lower prices and better qualities of non tropical
logs are all contributing to this decline in trade of tropical logs.
Through all the traditional products (logs, sawnwood, furniture), plywood has remained more
or less stable, trends show it will remain that way; nevertheless, competition with cheaper raw
materials is menacing these products. Veneers instead, depend on the country requirements,
for example in France (ITTO 2005) peeled, sliced and sawn veneers are very distinct products
belonging to very different domains:
Peeled veneers manufacturing is a step of the plywood manufacturing process. As
such this activity is fully integrated in the plywood plants and, practically, is not
considered in France as an independent activity. It accounts, by far for the largest part
of the production.
Sliced veneer manufacturing, on the contrary, while a much smaller activity in matter
of volume, is an independent activity with import, export and domestic trade.
Sawn veneers are produced in very small volumes in small units. This product is
mainly used in cabinet making and is often closer to craftsmanship than to industry.
Tropical sawnwood, as described in the Chinese and US market, is used to produce most of
the solid wooden flooring; therefore it demands is closely linked to the flooring sector.
Ageing population in Europe, Japan and China will deeply affect the wood market, less
economic active population is reflected by fewer purchases; however this effect is not
expected in the US.
Fuelwood is slowly increasing in major markets; it is a niche where some advantages could be
taken in the future for tropical fuelwood (pellets and charcoal for example).
Regarding threats, the major ones are the new formaldehyde emissions standard to be
achieved by producers and exporters in the US market and the new ISO standards which
would also be implemented as well in coming years for secondary processed wood products.
57
The inadequate forest resources of China, Europe and Japan reflect the lack to sustain the
present wood industries and it is especially deficient in high value, large diameter hardwoods.
Regarding new species introduction, amongst the traditional timber importing countries,
France is the most species flexible wood market, followed by the US. Iberian countries
instead, have flexible specifications and qualities which will generally allow the tropical
timber producer to obtain a better yield when selling to the more selective markets.
Market trends in the six markets have moved like this:
Figure 7.1
6500
7000
7500
8000
8500
9000
1000
m3
2003 2004 2005 2006
Tropical Industrial Roundwood Imports
China France Italy Iberian C. USA
Figure 7.2
0%
20%
40%
60%
80%
100%
2003 2004 2005 2006
Tropical Industrial Roundwood Imports
China France Italy Iberian C. USA
Figure 7.3
0
500
1000
1500
2000
2500
3000
3500
4000
4500
5000
1000
m3
2003 2004 2005 2006 2007
Tropical Sawnwood Imports
China France Italy Iberian C USA
Figure 7.4
0%
10%
20%
30%
40%
50%
60%
70%
80%90%
100%
2003 2004 2005 2006 2007
Tropical Sawnwood Imports
China France Italy Iberian C USA
58
Figure 7.5
0
1000
2000
3000
4000
5000
6000
7000
8000
1000
m3
2000 2001 2002 2003 2004 2005 2006 2007
Tropical Plywood Imports
China France Italy Japan Iberian C. USA
Figure 7.6
0%
10%
20%
30%
40%
50%
60%
70%
80%
90%
100%
2000 2001 2002 2003 2004 2005 2006 2007
Tropical Plywood Imports
China France Italy Japan Iberian C. USA
59
4. International Transport of Tropical Timber
Due to the fact that major markets for tropical woods, like the European Countries, Japan, the
US, are far from main suppliers in Asia, Africa and South America, it is important to describe
logistics aspects related to their international transport. Competitiveness of wood products in
major markets is also a result of good transportation logistics.
It is essential to describe timber transportation from forest to the final consumer in view of
key aspects such as traceability, certification, legality among others; the ITTO 2007a report
on lumber transportation describes three ways of bringing timber from forest to ships or
vessels.
First, most timber from forest production is carried by trucks covering short distances from
forest to the mill and/or the port of export. This forest transport is generally operated by the
forest operator with locally owned and purchased trucks.
Secondly, railway transportation: this method is cheaper than and preferable to using trucks.
Logs and processed products are loaded on railways as bulk cargo or in containers, on
appropriated carriages and transported to port.
Thirdly river transportation: this mode of transportation is often preferred by inland
producers, forest dwelling peoples and concession holders since the adjacent or nearby
waterway provides direct access from the forest to the port of export. Combining river
transport with trucks and/or railways is the cheapest method of transportation in the Amazon,
Congo Basin, and Borneo. On rivers, timber is transported by raft (logs only) or on barges (all
products). Usually, barges are locally owned by concession holders who ensure transportation
to the port of export.
Once products arrive to ports, they are loaded to vessels, which are divided in three main
types to transport timber products (described by ITTO 2007a), depending on the product
(roundwood, sawnwood, etc).
60
Bulk Carriers: All vessels designed to carry bulk cargo such as grain or logs. With a
capacity between 5.000 and 25.000 Long Tons, bulk carriers are mainly used for logs,
bundles or pallets.
Container ships: Ships equipped with permanent container cells, with little or no
space for other types of cargo. There usually take regular routes such as lines between
Africa to Europe, or between South East Asia and North East Asia. Talking about
producing countries, container ships bring processed products such as television, etc…
and come back for example with sawntimber.
Roll-on/Roll-off vessels: Ships specially designed to carry wheeled containers or
trailers using interior ramps.
Currently decreasing log exchanges and increasing exchange in processed products have
changed the way wood is transported “There have been fewer cargo vessels available to
transport timber as incoming vessels are increasingly of the container vessel type, and bulk
vessels have been tied up in Asian destinations” (ITTO 2007a).
Containerization transport is currently the main way for sea transport, as it offers advantages
such as:
Loading processed products
Providing protection against pilferage and damage,
Providing greater flexibility in managing by simple trans-shipment the many
combinations between the port of shipment and destinations
Effect on transportation as described by the ITTO 2007a report is “that regular lines are
offering fewer bulk carriers and more container ships”.
Another effect of changing trends in timber shipping, described by ITTO 2007a report,
consists in the difficulties of checking the cargo in the container itself:
Supplier and customs authorities compute in m3
Ship computes by “boxes” therefore weight

61
Relating to this subject, suppliers must balance technical aspects (shrinkage of wood,
moisture content, volume, weight) to maximize the space in the container. However
frequently suppliers’ countries do not have enough technical knowledge of timber species or
do not have technical tools due to industry scale to make good decisions.
Regarding documentation which is required for loading, include five indispensable
documents:
Timber specifications
Cargo invoices
Certificate of Origin
Phytosanitary Certificate
Bill of Lading (B/L)
As explained by the ITTO report:
Timber specifications: This is a list of products with the details of each piece such as the
vernacular name of the species, type of product, number of pieces, measurement and volume,
port of shipment, and also the destination and generally the name of the ship.
Cargo invoices (commercial invoices): This represents a complete record of the transactions
between exporters and importers with regard to the goods sold. It also reports the content of
the shipment and serves as the basis for all other documents about the shipment.
Certificate of Origin: Established by the administration (coordination between forest, customs
authorities and trade or export services), this official paper summarises the items of the
specification and commercial invoice in order to confirm the country of production and the
conformity of the cargo. This document is generally requested in consumer countries for
paying taxes (depending on a given country’s tax or other agreement with the exporting
country).
62
Phytosanitary Certificate: This document is usually issued by the local Department of
Agriculture to satisfy consumer country import regulations. Regarding timber, it indicates
whether a Cargo has been treated with non- prohibited products against xylophages and
moulds, and attests that the cargo is free from worms and fungal diseases.
Bill of Lading (B/L): This document establishes the terms of a contract between a shipper and
a transportation company. It serves as a document of title, a contract of carriage and a receipt
for goods. It describes the goods but cannot guarantee the cargo's origin and compliance with
national laws. The B/L (which indicates the commercial volumes) doesn’t necessarily reflect
the official export volumes (real volumes) which are declared for customs.
Producers in tropical countries may be at a disvanteged position, as compared to producers in
developed countries, regarding the availability of the overseas infrastructure, logistic
knowledge and other transport related matter.
63
5. Opportunities for Tropical wood producers
Opportunities for tropical wood producers from developing countries to sell into major global
markets are closely related to product quality and specifications, prices, environmental issues,
product’s traceability and the way products are promoted (marketing). While these producers
have a direct input to control their production costs and or improve product quality, they are
still much less directly involved when it comes to co-defining the “environmental” and/ or
‘legal” standards / procedures that are increasingly becoming important factors in governing
the tropical timber trade. Tropical producers will thus have to become much more pro-active
in the definition of the environmental and legal procedures of the timber trade.
Thus, Certification (as CoC or SFM) is an important factor to open or maintain market’s
niches. Production philosophies as the “green production” or fair trade would permit suppliers
countries to reach competitiveness regarding environmental, social and economic issues. New
requirements by main markets (Green Building codes, E2commerce) give the opportunity to
open new market niches and initiatives like the EU FLEGT with both opportunities and
threats.
Subsequently each one of them will be briefly described, following a review of focused key
publications.
64
5.1. Green Productivity and Green Supply Chain
As explained in the Green Productivity and Green Supply Chain Manual (APO 2008), The
Asian Productivity Organization (APO) has been promoting Green Productivity (GP) in the
Asia-Pacific region since 1994. GP is now widely accepted as a holistic approach to tackle
environmental issues and problems while simultaneously enhancing productivity, the
foundation of business competitiveness.
“Greening supply chains” (GSC) refers to industries and enterprises requiring that suppliers
and vendors take responsibility for meeting specific environmental requirements. GSC is part
of the green procurement process, which is especially important for large and multinational
enterprises that rely on many links in their supply chains for products and services. GSC not
only strengthens customer-supplier relationships, but also reduces costs, leads to sustainable
production and consumption, and provides potential opportunities to add value to businesses
(APO 2008).
The Green Productivity (GP) concept, established by the Asian Productivity Organization
(APO), aims for socioeconomic development with the ultimate objective of sustained
improvement in the quality of human life. It also emphasizes environmental improvement
combined with productivity enhancement and profitability. This concept ensures a structured
and participatory approach to achieving goals, which can be utilized for a Green Supply
Chain (GSC). Supply chain management is a very important factor that is directly related to
productivity and business competitiveness.
These definitions are an emerging concept not only for the Asia and the Pacific region, but to
the all suppliers’ countries, of which Latin-American and African countries must bring up to
date.
APO 2008 publication also explains that in order to achieve sustainable development in the
region, the creation of sustainable consumption patterns, the development of eco-products,
and the adoption of ISO 14000 standards (which aim to reduce the environmental footprint of
a business and to decrease the pollution and waste a business produces) would provide a
framework for enterprises to practice green purchasing.
65
Regarding market interaction, an excerpt of APO 2008 publication explains that: Green
Production is important in purchasing decisions, and developing new partnerships among
enterprises will drive the green supply chain and enhance sustainable performance. "Greening
the supply chain" refers to buyer industries and organizations requiring environmental
responsibility and certain environmental standards in their suppliers’ and vendors’ business
management systems and practices. These requirements are expected to be coherent with the
buyer industry’s core environmental policies and vision. In some cases, the buyer industry
also provides technical and/or financial assistance to suppliers/vendors to help them meet
these requirements.
Tropical producers working under this philosophy would have a powerful marketing tool into
International Markets, where environmental and social issues are key factors to reach them.
Therefore new market niches could be opened.
66
5.2. Green Building Codes
According to the U.S. Environmental Protection Agency and the American College of
Allergy, Asthma and Immunology, Americans spend 90% of their time indoors. As a result of
poor indoor air quality, toxic materials and other design attributes, many of the buildings
where we live and work can have a negative impact on our health. Green building
practitioners have embraced design methods to help mitigate these and other negative
impacts. Examples include design methods that bring more of the outside environment inside
through day-lighting, operable windows, better ventilation systems, and much more.
Explained by Metafore 2004 publication, Green building programs were established as
guidelines that address many of the negative environmental, human health, and financial
impacts of construction and occupancy of a building. A green building project involves an
integrated design process where environmental, social, and economic issues are considered
collectively to address a number of design and construction elements.
Ecological sensitivity in site selection
Consideration of future water use
Incorporation of energy efficiency systems that anticipate future energy demands
Systems and materials that enhance indoor air quality
Use of materials that not only enhance indoor air quality, but limit harm to the
environment or humans during the raw material extraction and manufacturing process
The appropriate use of wood products is commonly considered under both indoor air quality
and materials selection sections of most green building programs.
Most green building programs, following Metafore 2004 Publication, are intended to
transform supporting industries by creating incentives for using leading edge products and
technologies with environmentally friendly components. Currently, wood-related credits in
most green building programs address the quality of forest management behind specific wood
products as well as the reduction of waste by reusing and recycling existing wood. It may well
be that future iterations of green building programs offer points simply for using wood instead
of other materials such as steel and concrete based on life-cycle criteria.

67
While there are many forest certification systems worldwide, the Forest Stewardship Council
(FSC) certification system is recognized by the majority of green building programs and
offers a CoC certification to track products through manufacturing and distribution to
guarantee that a project owner receives the certified products that were requested.
As an example, the LEED (Leadership in Environment and Energy Design) program is a
voluntary, national (U.S.) standard for developing high-performance, sustainable buildings. It
was created by the U.S. Green Building Council to set a standard for environmentally friendly
buildings and promote competition in the marketplace. This program provides a complete
framework for assessing building performance and meeting sustainability goals.
The standard emphasizes state-of-the-art strategies for sustainable site development, water
savings, energy efficiency, materials selection and indoor environmental quality. There are
standards currently available for:
New construction and major renovation projects
Existing building operations
Commercial interiors projects
Core and shell projects
Regarding European Green Building Programme (launched in January 2005); it is one of the
"Intelligent Energy - Europe" Programme. The goal is to substantially improve end-use
energy efficiency and promote the use of renewable energy sources
According to Green Building Programme Partner Guidelines, V 2.2, March 2009 the Green
Building Programme is a European Commission voluntary programme through which non-
residential building owners and occupiers, being private or public organisations, are aided in
improving the energy efficiency and to introduce renewable energy sources into their building
stock.
In order to reach these niches, timber from Sustainable Managed tropical forests (SFM), and
even if/when applying SFM may increase production costs, should be pro-actively being
promoted and demonstrated at the markets in order to tap “Green Building Programme”
niches, including for renewable energy.

68
Due to green building programs offer points simply for using wood instead of other materials
such as steel and concrete based on life-cycle criteria, small scale certified producers in
developing countries have here an special niche market where governmental support in the
country of the end-user (EU, USA, Japan,...) is guaranteed and/or subject to (tax-) incentives.
69
5.3. Certification and Traceability
There are two elements related to certified wood products: forest management certification,
and chain-of-custody (CoC) certification. Several and different forest certification schemes
exist, and among the best known among companies that purchase forest products are: The
Forest Stewardship Council (FSC) which is an international system that certifies operations
worldwide. The Sustainable Forestry Initiative (SFI) is a certification system targeting
industrial forestry operations in Canada and the Programme for Endorsement of Forest
Certification schemes (PEFC). For more information on ongoing certification schemes see at
http://www.fao.org/DOCREP/003/X6720E/X6720E00.HTM.
When certification was first employed more than 10 years ago, many companies along the
forest products supply chain viewed certification as an opportunity for direct economic
benefits. The conventional wisdom at that time assumed that the end-use consumer would be
willing to pay more for a product certified as coming from a well-managed forest. In practice,
only a small segment of end-use consumers in the U.S. are actually willing to pay more for
environmentally-preferable products such as certified forest products. (Murphy, C., 2003.
“The Next Big Thing,” Fortune Small Business, Vol. 13, No. 5 June 2003. Time Inc.New
York, N.Y.)
As described by Metafore 2004 report, Forest management certification is a process where
forests are evaluated according to a set of standards, guidelines, and principles established by
a certification body, and are certified as well-managed by an independent third-party auditor
(or certifier). Once the forest has been awarded a forest management certification, the
landowner can sell logs as certified under that specific certification system.
In addition, some certification systems require that logs be sold to manufacturers that are CoC
certified if the products are to be labelled as certified. Chain-of custody certification is an
inventory control audit that requires certified materials to be inventoried and tracked
separately from non-certified inventory. To ensure that the product is not mixed with non-
certified materials, each step in the manufacturing and distribution chain needs to be CoC
certified.
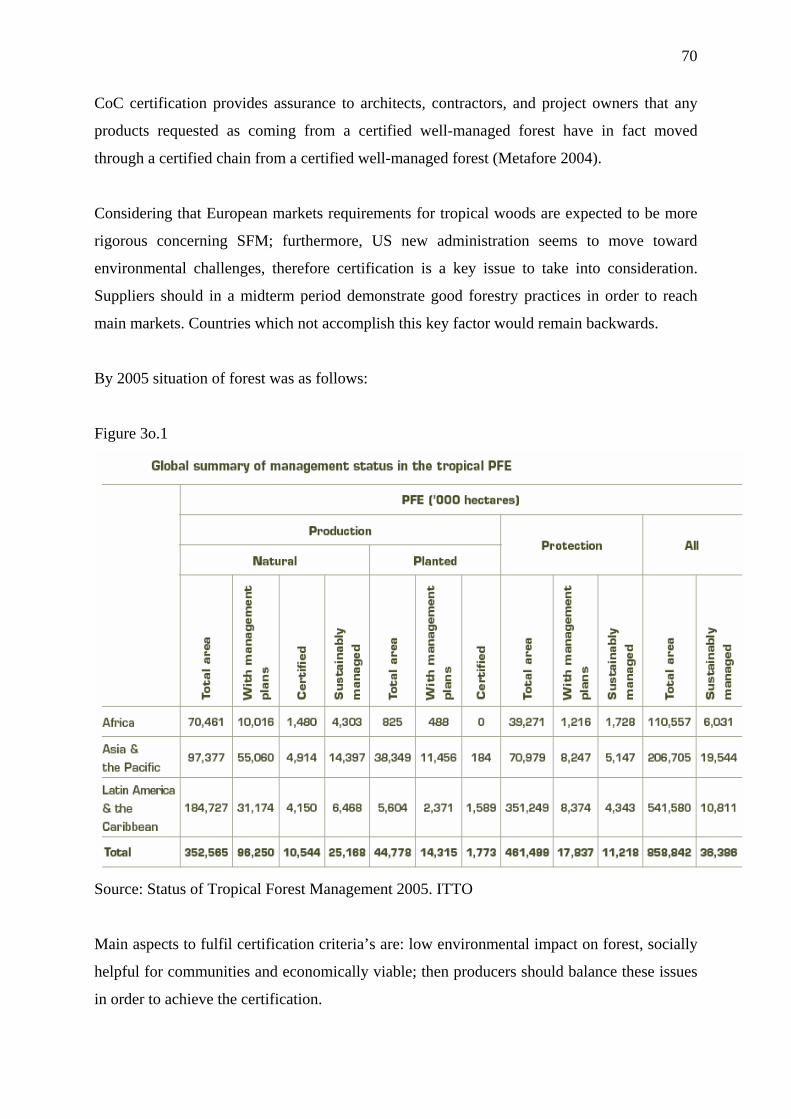
70
CoC certification provides assurance to architects, contractors, and project owners that any
products requested as coming from a certified well-managed forest have in fact moved
through a certified chain from a certified well-managed forest (Metafore 2004).
Considering that European markets requirements for tropical woods are expected to be more
rigorous concerning SFM; furthermore, US new administration seems to move toward
environmental challenges, therefore certification is a key issue to take into consideration.
Suppliers should in a midterm period demonstrate good forestry practices in order to reach
main markets. Countries which not accomplish this key factor would remain backwards.
By 2005 situation of forest was as follows:
Figure 3o.1
Source: Status of Tropical Forest Management 2005. ITTO
Main aspects to fulfil certification criteria’s are: low environmental impact on forest, socially
helpful for communities and economically viable; then producers should balance these issues
in order to achieve the certification.

71
5.4. EU Action Plan for Forest Law Enforcement, Governance and Trade
The Environmental Resource Management (ERM) 2004 publication describes the FLEGT
plan as follows:
In response to growing global concerns regarding illegal logging and a series of international
initiatives such as the G8 Action Plan on Forests, the EU Action Plan for Forest Law
Enforcement, Governance and Trade (FLEGT) was developed in May 2003 and approved by
the Council in October 2003. The Action Plan provides a strategic process and package
through which the EU proposes to address the growing problem of illegal logging. The aims
of the Action Plan are to:
Reduce the amount of illegal timber in trade (it is currently not illegal in the EU to
import illegally produced timber products);
Reduce the amount of illegal timber consumed; and
Reduce the scale and significance of illegal logging activities, currently prominent in
some key producing countries.
Given the complexities of developing a multilateral agreement the Action Plan focuses on
bilateral or regional actions. The Action Plan comprises the following sets of activities:
Development cooperation – with a focus on capacity-building and institutional
strengthening;
Trade in timber – primarily through the application of legality licences;
Public procurement;
Private sector initiatives – the encouragement of voluntary initiatives; and
Financing and investment safeguards.
Furthermore the publication explains that a key component of the Action Plan is the
application of the legality licensing system to identify legal products in partner countries and
license them for import to the EU, with unlicensed products being denied entry. However, the
overall aim is for the legality licensing scheme to be applied through voluntary bilateral
agreements between the EU and the partner producer country. Initially the legality licence
72
will be applied to only a limited range of products – logs and rough sawnwood – but this will
be gradually extended to include other wood-based products.
Following the production of the draft findings of this and other research the coverage of the
legality licence was extended to include plywood and veneer.
The licence will be applied at a national level in the producer country. It will be implemented
in the EU by a new regulation to be developed and applied at the EU level. In addition the
development of new legislation is being considered that will make it illegal to import illegally
produced timber products into the EU, from any source, including producer countries which
do not join the licensing scheme.
Imports to the EU of logs and sawnwood from countries not in the partnership agreements
would not be required to have a legality licence, as this system would only apply to those
producer countries which have negotiated an EU FLEGT Voluntary Partnership Agreement
(VPA). The impact on trade could therefore create global trade distortions, creating the
potential to trigger market substitution in the global trade.
Furthermore for those countries which are members of the VPA; they could have some
benefits, like exclusive markets to their products with low competition on similar niches from
others (non-VPA producers) among others, but it is not yet clear if their extra efforts would be
rewarded by a premium price.

73
5.5. E-commerce & E2Commerce
Actual trends of e-commerce show their relevance and need to better analyze it as a factor to
reach markets in a competitive way by tropical producers. Growth expectations vary
depending on market maturity and the characteristics of the country.
Considering that in Europe, “among retailers, the cross-border potential of e-commerce seems
not to be exploited: 51% of EU27 retailers sell via the internet, but only 21% are currently
conducting cross-border transactions, down from 29% in 2006 (in the EU25). The same
proportion (21%) advertises cross-border (Report on cross-border e-commerce in the EU
2009).
In France, Germany and the UK, as explained by the Forester Research 2009, e-commerce is
expected to increase in the coming 6 years though actual economic crisis. France would be
the country with the most high rate increase, it is predicted that each French will expend until
2014, in average 932 euro on line per year, 994 euro and in Germany 1703 euro respectively.
(Forester Research 2009).
E-commerce is now a widespread phenomenon in the UK, Germany, France, and the Nordic
countries, which also enjoy higher levels of cross-border e-commerce than average. This
suggests an underlying potential for cross-border e-commerce as other economies catch up.
(Report on cross-border e-commerce in the EU 2009)
According to the Forester Research 2009, customers will search for different key aspects,
such as final price, transportation costs and delivering times. Factors to pay attention to are
also promotion, product availability, trust, website performance, product information and ease
of payment transaction.
Regarding China, the e-commerce development is a step behind compared to the European
countries and the U.S. The lack of policies to develop informatics issues has been the main
reason of China’s delay (Massa 2007).
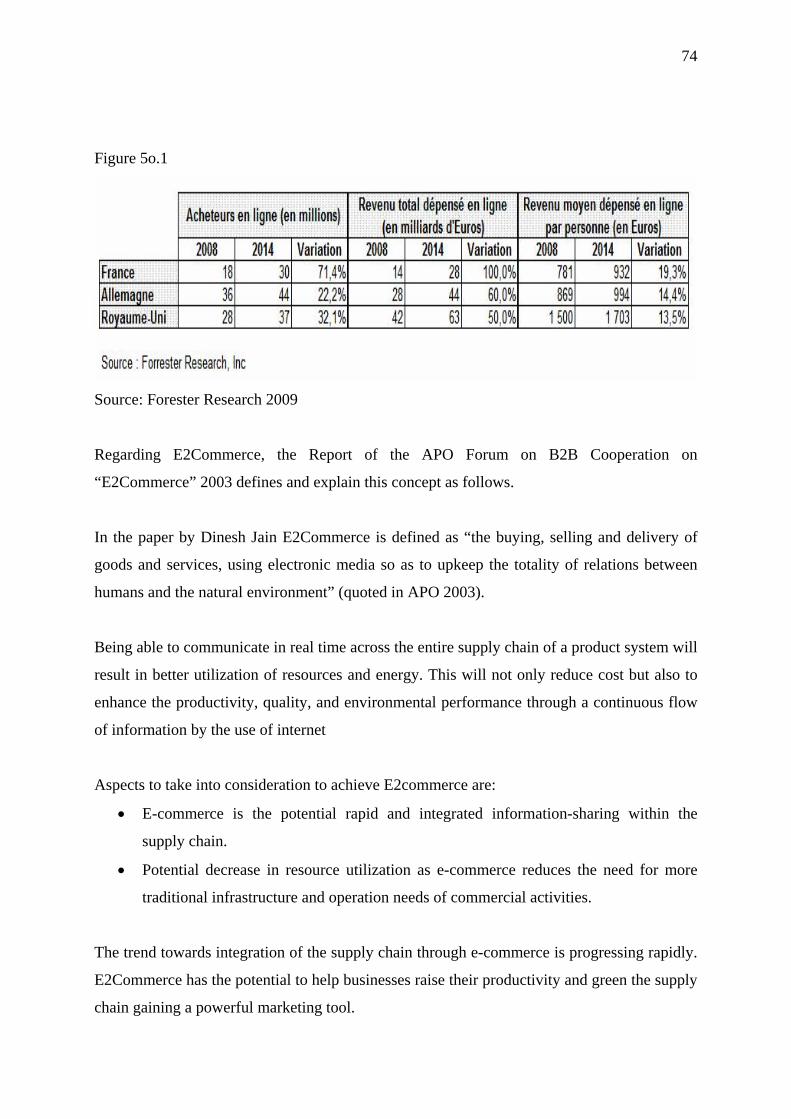
74
Figure 5o.1
Source: Forester Research 2009
Regarding E2Commerce, the Report of the APO Forum on B2B Cooperation on
“E2Commerce” 2003 defines and explain this concept as follows.
In the paper by Dinesh Jain E2Commerce is defined as “the buying, selling and delivery of
goods and services, using electronic media so as to upkeep the totality of relations between
humans and the natural environment” (quoted in APO 2003).
Being able to communicate in real time across the entire supply chain of a product system will
result in better utilization of resources and energy. This will not only reduce cost but also to
enhance the productivity, quality, and environmental performance through a continuous flow
of information by the use of internet
Aspects to take into consideration to achieve E2commerce are:
E-commerce is the potential rapid and integrated information-sharing within the
supply chain.
Potential decrease in resource utilization as e-commerce reduces the need for more
traditional infrastructure and operation needs of commercial activities.
The trend towards integration of the supply chain through e-commerce is progressing rapidly.
E2Commerce has the potential to help businesses raise their productivity and green the supply
chain gaining a powerful marketing tool.
75
6. Conclusions
6.1. Tropical timber raw material (logs and sawnwood) trade trends are decreasing at
major markets analyzed (except China). Consumption is closely linked to the
Construction sector
6.2. Decreasing log exchanges and increasing trade in processed products have changed
the way wood is transported
6.3. Of all the traditional products (logs, sawnwood, furniture), the tropical plywood trade
has remained more or less stable, trends show it will remain that way; nevertheless,
competition with cheaper raw materials is menacing these products
6.4. Competitiveness of tropical wood products vis a vis temperate lumber and other
materials (steel, plastic) is decreasing (some more than others) and is expected to
decrease further. However new niche markets, such the Green building guidelines
supported by government (tax) incentives can offer new opportunities for tropical
wood producers.
7. Recommendations
Update and get more data in the German, British and Swedish market (consumption,
requirements, market segmentation, etc) is essential to complement this report, and by
considering the impact of global crisis.
It is helpful to look at the demand growth in order to predict some movements in future’s
consumption; however it is also important to analyze main suppliers’ countries where the
raw material comes from, such as Brazil, or Malaysia; and in transit processing countries
like China and Vietnam.
E-commerce represents a great opportunity to open new market niches where international
free trade agreements permits the movements of goods without restriction (NAFTA and
the EU). This is a new practical way to reach cross-border customers in these countries.
An analysis on the impact of (cross-border) E-commerce on the tropical timber trade
would be relevant to identify trends and opportunities for new market niches.

76
The impact of the FLEGT initiative on tropical timber products would facilitate further
analysis of competitiveness. New and updated trade data of actual VPA countries related
to their exchanges during the last 5 years would help clarify or identify emerging trends.
77
8. Bibliography
Altalex, articolo di Rocco Gianluca Massa 2007
APO 2003: Report of the APO Forum on B2B Cooperation on “E2Commerce”;
Republic of China 20-24 November 2001 Edited by Lee Kiyau Loo and Foo Hee
Boon; 2003
APO 2008: Green Productivity and Green Supply Chain Manual
AQUINO R., DUARTE J.; “Análisis de mercado y su entorno internacional: Un
ensayo”; Trabajo de Investigación efectuado para la Cátedra de Gerencia de Mercados
Competitivos, del Postgrado en Gerencia Empresarial; Universidad Santa María de
Caracas. Venezuela. April 2008.
ARAYA A, KATSUHIA H; “Japanese Wood Market and Use of Tropical Wood”;
FAO 2008.
BAUDIN A, FLINKMAN M, NORDVALL H.O.; “Review of the Italian Tropical
Market-With Focus on Tropical Timber”; ITTO 2005.
Bob Smith, Victor Cossio; Competitiveness of Forest Products at Global Markets;
with Particular Emphasis on Tropical Forest Products and on Small and Medium Scale
Producers; 2008
CAPELLOTTO G., Artiche about Forrester Research 2009; March 2009
http://lnx.giovannicappellotto.it/2009/03/20/ecommerce_in_francia/
CHINESE ACADEMY OF FORESTRY, RESEARCH INSTITUTE OF FORESTRY
POLICY AND INFORMATION; “Trade Flows and Distribution of Tropical Wood
Products in China”; Technical Report of ITTO Project PD171/02; Beijing 2007.
CONDE E; “¿Cómo mejorar los niveles de competitividad en la organización?”;
Centro Universitario José Marti Peréz, Sancti Spíritus; Cuba 2004.
FRIPP Emily, FLEGT AND TRADE: What will the impacts be?; The
Environmental Resource Management (ERM) 2004
http://www.unece.org/timber/mis/fp-stats.htm
ITTO 2005; OLE PEDERSEN AND PIERRE M. DESCLOS; Review of the French Timber Market; 2005
ITTO 2007; Report on the Review of the US Market for Tropical Timber Products
ITTO 2007a: STUDY ON THE INTERNATIONAL TRANSPORTATION OF
TROPICAL TIMBER PRODUCTS; CEM-CFI(XL)/5
ITTO 2008; Ole Pedersen & Antonio Esteves; Review of the Iberian Timber Markets

78
Metafore 2004, Certification and the U.S. Market for Tropical Wood Products
Murphy, C., 2003. “The Next Big Thing,” Fortune Small Business, Vol. 13, No. 5
June 2003. Time Inc.New York, N.Y.
MUTHOO M; “Review of the Indian Timber Market”; PPD49/02(M); ITTO 2004.
Report on cross-border e-commerce in the EU; COMMISSION OF THE EUROPEAN
COMMUNITIES, Brussels 2009.
State of Worlds Forest 2009; FAO 2009
Status of Tropical Forest Management 2005. ITTO
Taylor R; Perspectives from North America: Current USA Wood Products Industry/
Market Situation; COFO World Forest Week 20 March 2009, Rome, Italy
The Global Competitiveness Report 2008-2009 © 2008 World Economic Forum
U.S. Bureau of Economic Analysis” Survey of Current Business”, April 2008.
U.S. Census Bureau "2008 National Population Projections," released August 2008;
http://www.census.gov/population/www/projections/2008projections.html
U.S. Forest Service. U.S. Timber Production, Trade, Consumption, and Price
Statistics 1965-1999. Research Paper FPL-RP-595.
United Nations Statistics Division – UNSD
WORLD TRADE REPORT 2008 Trade in a Globalizing World; World Trade
Organization.