competitiveness measurement: an alternative...
TRANSCRIPT

Competitiveness
measurement:
alternative approaches
Instituto de Pesquisa
Econômica Aplicada
Agência Brasileira de
Desenvolvimento Industrial
Universidade de São Paulo
Summary
Competitiveness: earlier definitions
The Porter’s approach
The most famous competitiveness indexes:
The CGI from the WEF and the WCS from
the IMD.
Strengths and weaknesses of these indexes
Towards an alternative approach, based on
competitive strategies of the firms
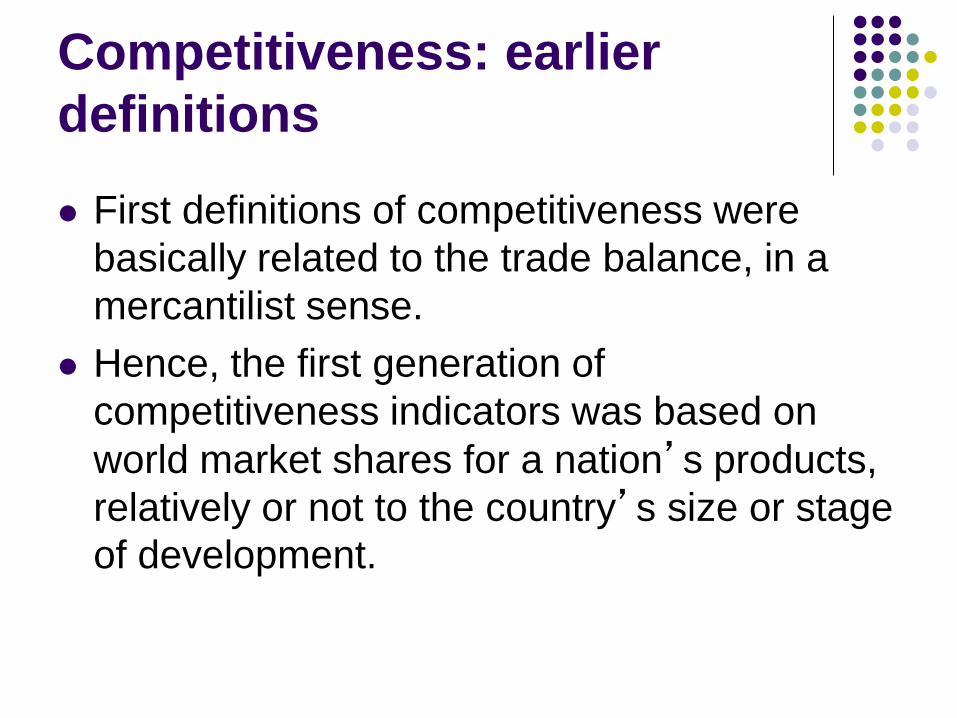
Competitiveness: earlier
definitions
First definitions of competitiveness were
basically related to the trade balance, in a
mercantilist sense.
Hence, the first generation of
competitiveness indicators was based on
world market shares for a nation’s products,
relatively or not to the country’s size or stage
of development.

Competitiveness: earlier
definitions (2)
However, since the mercantilist view of
competitiveness implies that world trade is a
zero-sum game, it can support misleading
public policies, such as protectionism, wage
policies and exchange rate over-devaluations
in order to “keep the nation competitive”
(although this kind of policies still sounds very
appealing to the public opinion).

Competitiveness: earlier
definitions (3)
Then specialists became to take into account
wages, productivity and living standards of a
nation as the main goals to be competitive
internationally. Thus, the trade balance
began to be seen as a pre-condition and a
means to these aims, since everybody knows
about the consequences of trade-unbalanced
growth.
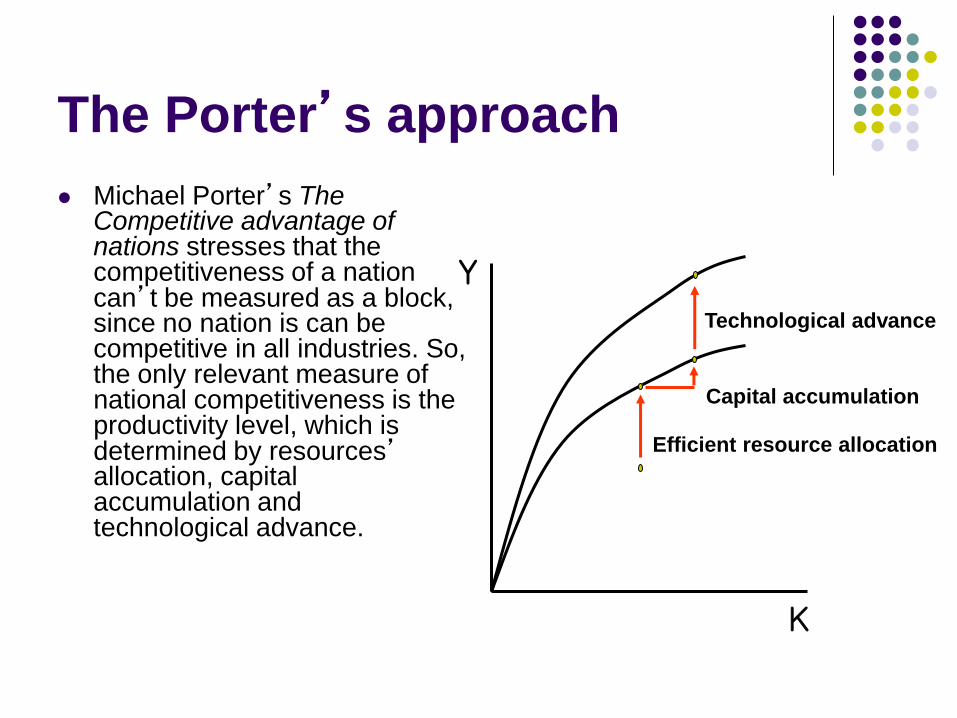
The Porter’s approach
Michael Porter’s The Competitive advantage of nations stresses that the competitiveness of a nation can’t be measured as a block, since no nation is can be competitive in all industries. So, the only relevant measure of national competitiveness is the productivity level, which is determined by resources’ allocation, capital accumulation and technological advance.
K
Efficient resource allocation
Capital accumulation
Technological advance
Y

The Porter’s approach (2)
In this sense, “prosperity is created, not inherited. It does not grows out of a country’s natural endowments, its interest rates, or its currency’s value”.
The very nature of the competitive advantage of firms is based on innovation, in its broadest sense: new ways of doing things – business and organizational innovations, adding services to products and so on. Innovative firms compete by differentiating their products or services, so their competitive advantage does not rely on low costs and price competition.
The link between firms’ innovation-based strategies and success and the competitive advantage of nations is provided by the four attributes of a nation that individually and as a system constitute the “Porter’s Diamond”.
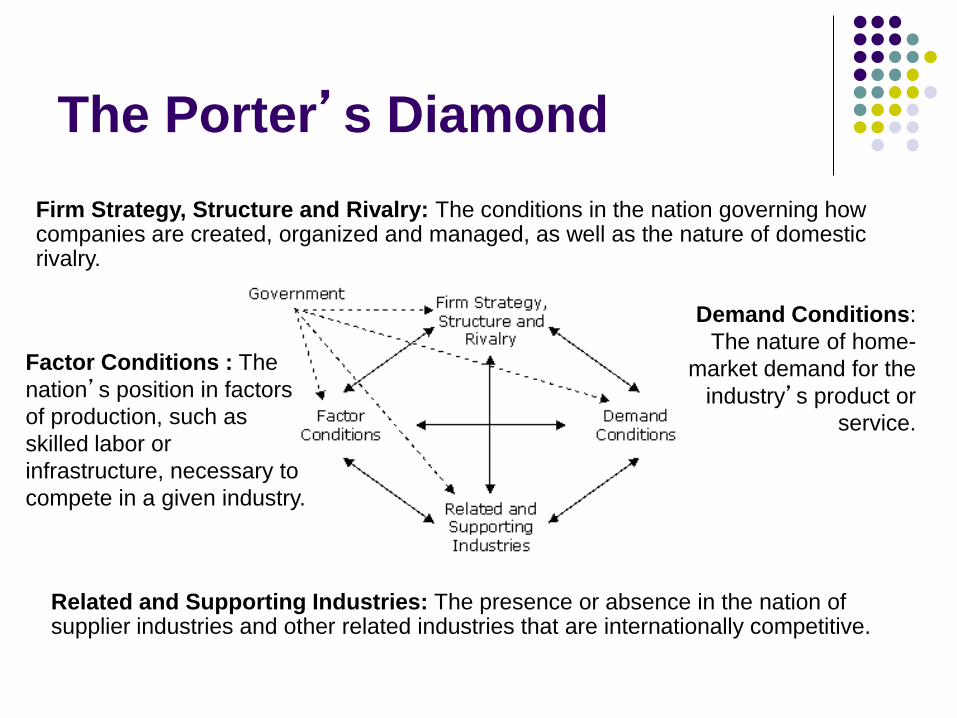
The Porter’s Diamond
Factor Conditions : The
nation’s position in factors
of production, such as
skilled labor or
infrastructure, necessary to
compete in a given industry.
Related and Supporting Industries: The presence or absence in the nation of supplier industries and other related industries that are internationally competitive.
Demand Conditions:
The nature of home-
market demand for the
industry’s product or
service.
Firm Strategy, Structure and Rivalry: The conditions in the nation governing how companies are created, organized and managed, as well as the nature of domestic rivalry.

Porter’s stages of
development
Porter also provides a typology of stages of economic development, which is supposed to occur in four phases:
1. Factor-Driven – based on natural resources or cheap unskilled labor;
2. Investment-Driven – a phase when there is huge capital accumulation through domestic and international savings, and consequently productivity boosts;
3. Innovation-Driven – according to Porter, the most prosperous stage, when firms seek innovation as a competitive strategy;
4. Wealth-Driven – countries are at the last stage when competition is less intense, firms seek keeping their positions, usually through government policies (rent-seeking behavior), and workers have non-economic aspirations.

The role of the government in
Porter’s framework
The role of the government is rather inductive
than proactive, in the sense that it should
strengthen the corners of the diamond, for
example providing macro stability, adequate
infra-structure and quality basic education;
financing basic research and fomenting the
National Innovation System, applying anti-
trust policies, ensuring competition and so
forth.
Main criticisms on competitiveness
and the Krugman-Dunning
controversy
The most famous critique-article to the competitiveness concept is Paul Krugman’s “Competitiveness: a dangerous obsession”.
The main arguments are:
1. The concept is wrong: countries do not “compete” in the same way enterprises do, surpluses do not necessarily mean prosperity and international trade is not a zero-sum game;
2. Competitiveness theoricians use very loose concepts such as “high value-added sectors” or confound comparative advantage with competitive advantage
Main criticisms on competitiveness
and the Krugman-Dunning
controversy (2)
3. Notwithstanding competitiveness is a meanless
word, one may argue that its rhetorical use is useful.
However, misconceptions may lead to wrong
policies.
So, why competitiveness is so popular?
1. It’s business language, and thus it sounds strongly
appealing to politicians and their supporters;
2. Some domestic problems are put in an international
context.

Main criticisms on competitiveness
and the Krugman-Dunning
controversy (3)
Professor Dunning’s reply to Krugman focused in three points:
1. Competitiveness does matter because it’s a way of benchmarking policies and productivity.
2. Competitiveness does matter if there are market imperfections, innovation externalities, ownership competitive advantages, capital mobility and intense intra-industry trade.
3. Competitiveness doesn’t matter only if the H-O theorem conditions holds (and productivity differentials are unavoidable).
Krugman’s response: “I’ve never said benchmarking was not important, and I’ve never neglected market failures.”

Main criticisms on competitiveness
and the Krugman-Dunning
controversy (4)
Other criticisms:
1. Porter does not define anywhere in his book what he means exactly by competitiveness and its scope (Industry-level or national-level? National productivity or market share of national goods? By the way, what’s a national good?).
2. The methodology is clearly inductive, but he doesn’t explicit what were the criteria to select the cases.
Main criticisms on competitiveness
and the Krugman-Dunning
controversy (4)
3. He assumes that the price elasticity of differentiated products is zero.
4. He doesn’t care about factors’ scarcities or misallocations in the production of differentiated products.
5. His theory has to be seriously modified to deal with transnational companies.
6. “Real world trade” and commodities exports matter for the sustainability of the differentiated goods strategy.
7. The empirical validity of the theory is highly questionable.

And what now?
Nowadays, if one wants to deal with competitiveness, he/she needs to define it in a much broader and dynamic sense. Its concept relies not only on productivity or efficiency concerns, but also in environmental and social issues.
Hence, an holistic tentative concept would be:
“The competitiveness of a nation means the relationship between factors, policies and
institutions and the conditions for firms improve their business performance, given social and
environmental concerns”.

The most famous
competitiveness indexes
Doubtlessly, the most famous competitiveness indexes are the Global Competitiveness Index (GCI – the former Growth Competitiveness Index) from the World Economic Forum (WEF) and the World Competitiveness Scoreboard (WCS) from the Institute for Management Development (IMD).
They are an very comprehensive attempt to translate the concept of competitiveness into indexes and make possible international comparisons.
Both are Swiss made, published annually and up until the middle of the 90’s were the same index.

The most famous competitiveness
indexes: methodology
Both indexes depart from basically the same definition of competitiveness:
GCI:
“Competitiveness [is the] set of factors, policies and institutions that determine the level of productivity of a country”
The Global Competitiveness Report, WEF, 2006
WCS:
“Competitiveness analyses how nations and enterprises manage the totality of their competencies to achieve prosperity and profit”
IMD World Competitiveness Yearbook 2006

The most famous competitiveness
indexes: methodology (2)
Similarly, both indexes follow the same methodology:
1. They are ex-ante measures of competitiveness, since they measure not only the performance of the countries but basically the “pillars” for economic growth;
2. Subindexes for these “pillars” are created, which are condensed onto a scalar and a competitiveness ranking of the nations or regions is provided;
3. Both rely on hard data as well as soft data from executives and businessman’s opinion surveys, mainly to assess the more subjective pillars, such as the quality of the institutions, governmental favoritism, business sophistication and so on.
This methodological approach is employed in several other indicators, for example, the World Bank’s assessment of the investment climate.
The most famous competitiveness
indexes: Why are they made?
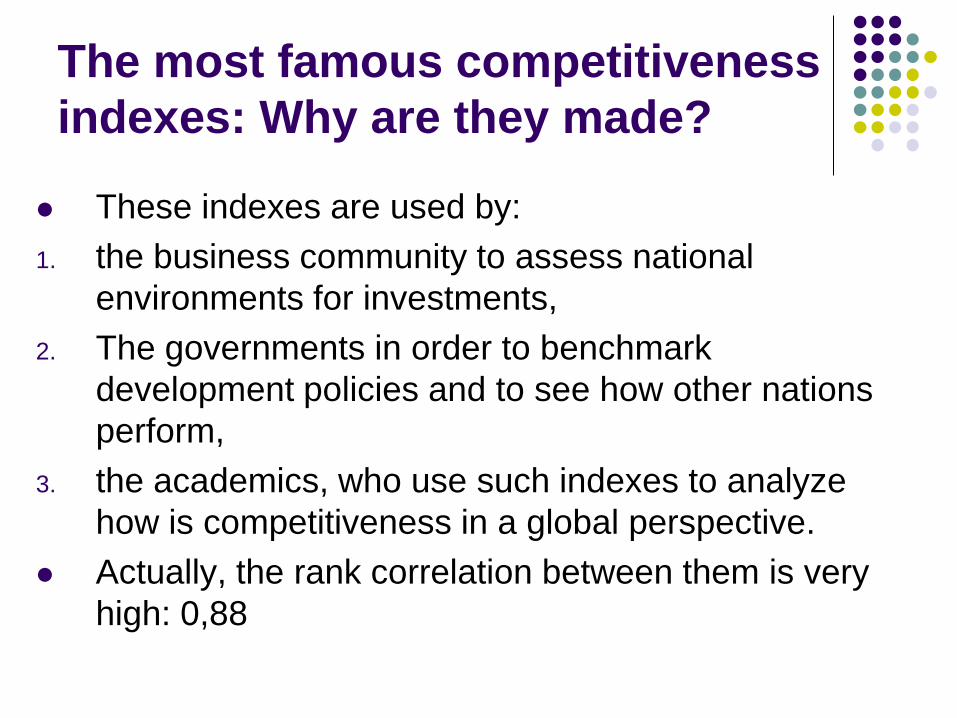
These indexes are used by:
1. the business community to assess national
environments for investments,
2. The governments in order to benchmark
development policies and to see how other nations
perform,
3. the academics, who use such indexes to analyze
how is competitiveness in a global perspective.
Actually, the rank correlation between them is very
high: 0,88

Meet the GCI...
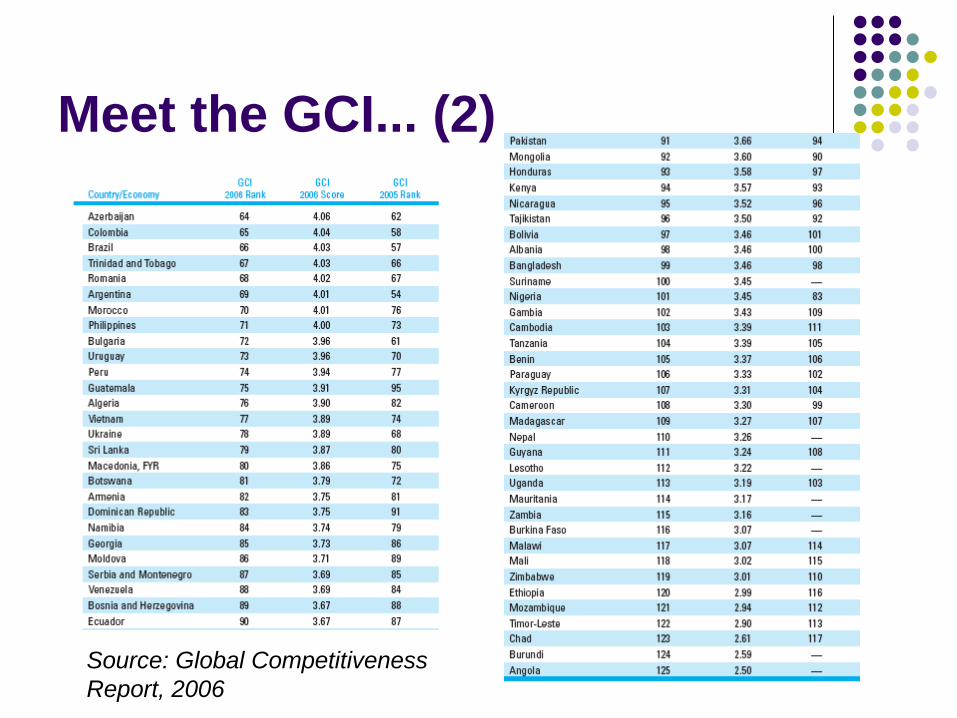
Meet the GCI... (2)
Source: Global Competitiveness
Report, 2006
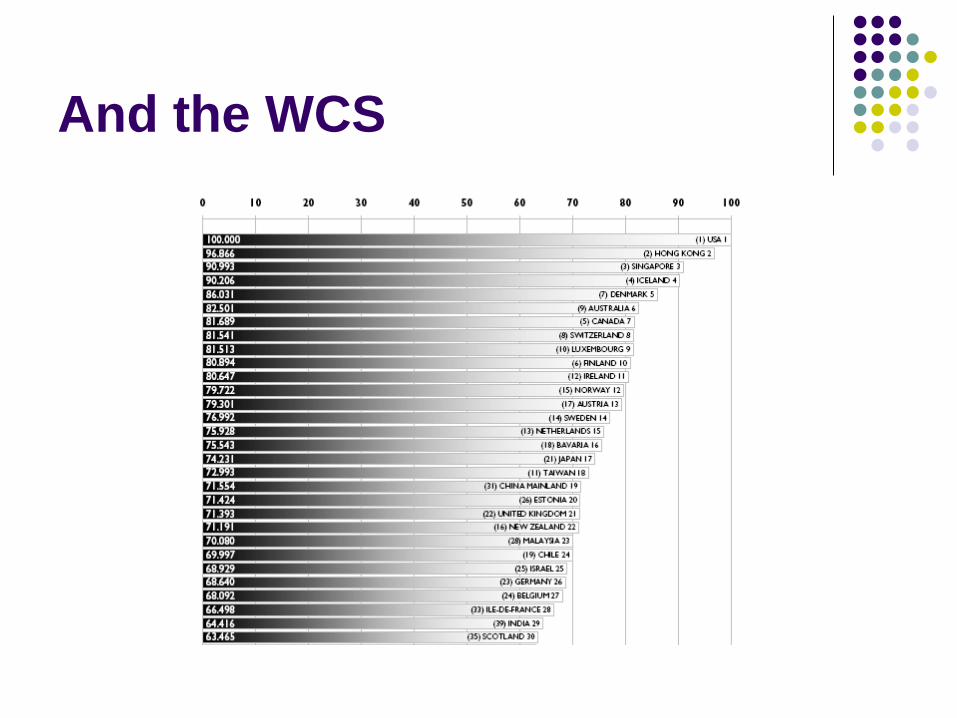
And the WCS
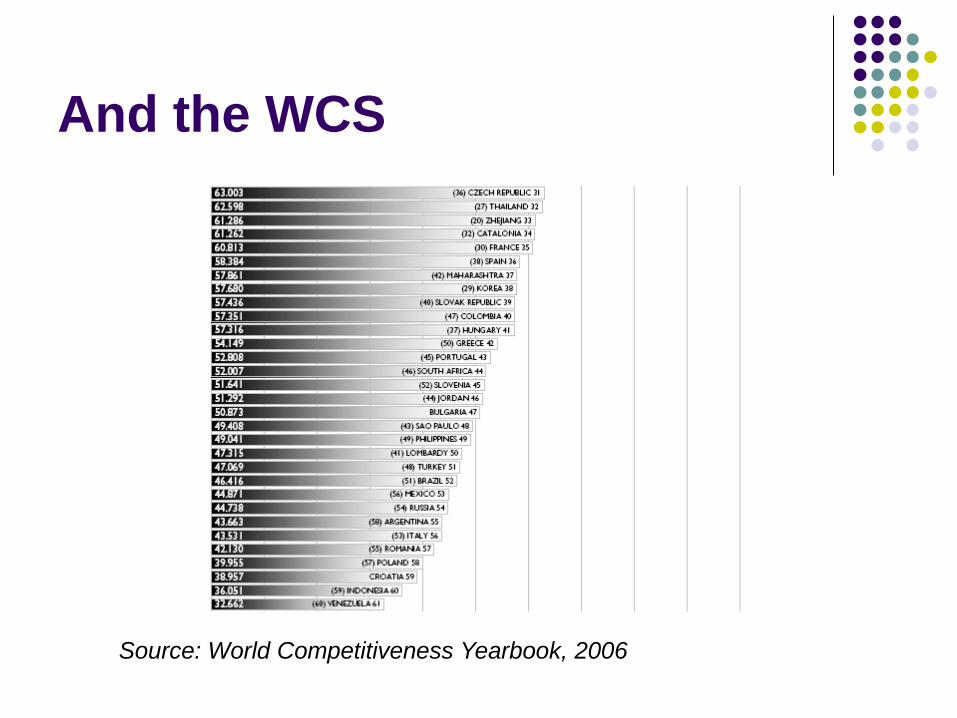
And the WCS
Source: World Competitiveness Yearbook, 2006
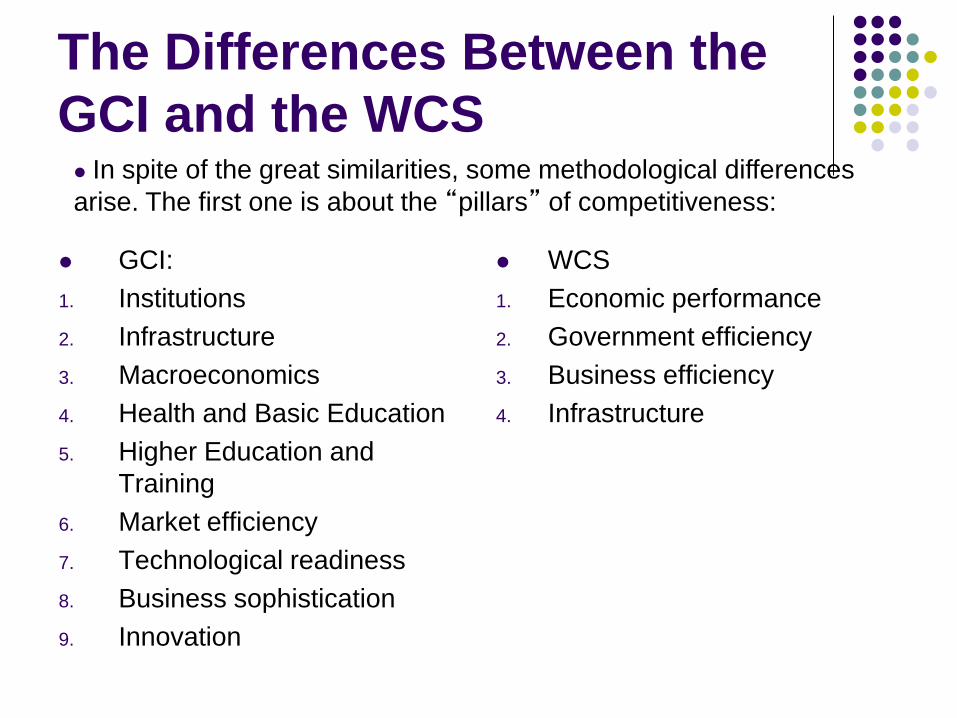
The Differences Between the
GCI and the WCS
GCI:
1. Institutions
2. Infrastructure
3. Macroeconomics
4. Health and Basic Education
5. Higher Education and
Training
6. Market efficiency
7. Technological readiness
8. Business sophistication
9. Innovation
WCS
1. Economic performance
2. Government efficiency
3. Business efficiency
4. Infrastructure
In spite of the great similarities, some methodological differences
arise. The first one is about the “pillars” of competitiveness:
The Differences Between the
GCI and the WCS (2)
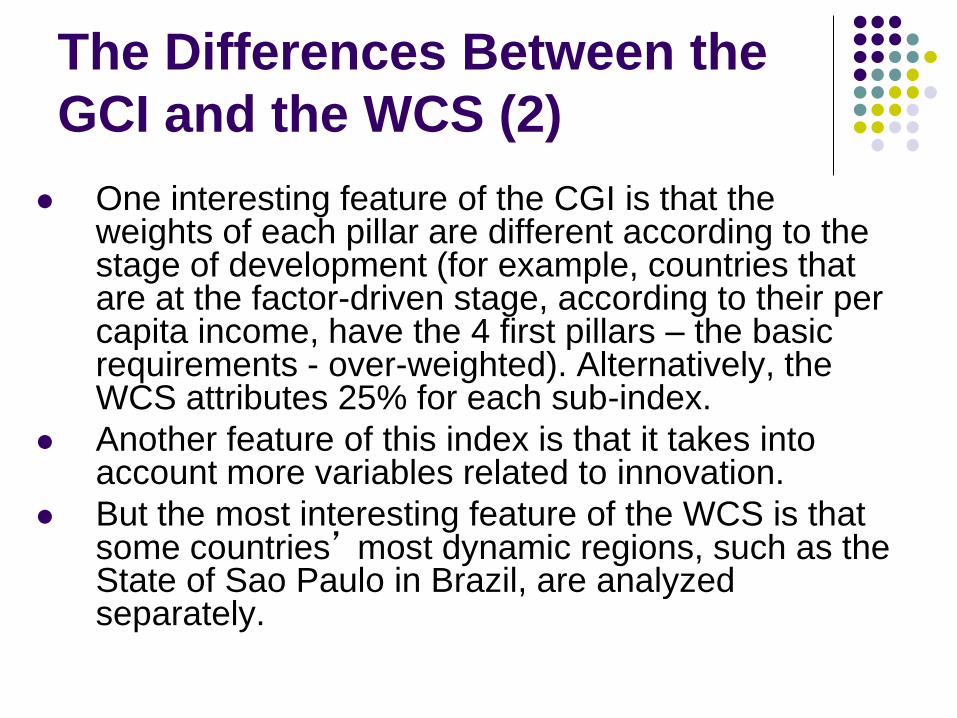
One interesting feature of the CGI is that the weights of each pillar are different according to the stage of development (for example, countries that are at the factor-driven stage, according to their per capita income, have the 4 first pillars – the basic requirements - over-weighted). Alternatively, the WCS attributes 25% for each sub-index.
Another feature of this index is that it takes into account more variables related to innovation.
But the most interesting feature of the WCS is that some countries’ most dynamic regions, such as the State of Sao Paulo in Brazil, are analyzed separately.

Strengths and weaknesses of
this approach
The main strength of the GCI and WCS is
that they provide a comprehensive but easy
and straightforward indicator of ex-ante
competitiveness, comparable between
countries and which can be very useful for
benchmarking policies and its outcomes.
But there are some weaknesses, three of
them practical ones and two of theoretical
nature.
Practical weakness n. 1: Do they
measure growth competitiveness?
The answer is, incredibly, no. For example, there is no correlation between the rank at the GCI and observed GDP growth, even in the long run.
Perhaps these indexes are more related to the risk of doing business, or, at some extent, with the level of development (see, for instance, the top 10 list). But even it is the case, there are some surprises, that are strongly related to the next 2 weaknesses: countries switch a lot their positions and - maybe because of it – conjuncture influences a lot in the classification.

Correlation between the GCI and
WCS and observed growth, 1995-
2003

Practical weakness n. 2: Countries
switch a lot their positions
If competitiveness is understood as a
structural concept, then strong changes at
the rankings should not happen. Very often
countries switch 10 positions within a year
period (for instance, Brazil’s GCI is in 66st
position in 2006, but was in the 57st last year
and in the 44st in 2001, basically the same
happened with Egypt and Colombia).

Some examples…

Practical weakness n. 3:
Conjuncture affects a lot
Maybe this is the main reason why countries
switch their classifications so much. For
instance, this year champion at the
Macroeconomic Pillar was Algeria, followed
by Kwait, Qatar and United Arab Emirates,
just because the rise of the oil prices.
Theoretical weakness n. 1: Do the base
indicators reflect competitiveness?
Some of the base indicators used to calculate the competitiveness indexes do not capture the dynamics of the phenomenon. For example, trade and fiscal balances must be analyzed according to an intertemporal framework, and not only by a quick assessment of deficits or surpluses in a given year. Specifically about the trade balance, the year-by-year analysis leads to a mercantilist assessment of competitiveness.

Theoretical weakness n. 2: How can pre-
conditions be translated into growth?
According to Porter’s view, sometimes initial factors
disadvantages are the main motivation to firms
innovate and overcome these difficulties.
Additionally, the size of the market loses a lot of its
relevance if consumers are not quality demanding
and do not pressure companies to innovate in order
to respond to their needs.
This is the main problem of the ex-ante
competitiveness measures: pre-conditions do not
necessarily become actual growth.

The Korean proposal (Cho,
Moon and Kim, 2008)
Theoretical background: The Dual Double
Diamond
Eight factors:
Physical factors: Factor conditions, Business
Context, Related and Supporting Industries,
Demand Conditions
Human Factors: Workers, Politicians and
bureaucrats, Entrepreneurs, Professionals

Evolution of competitiveness
diamonds
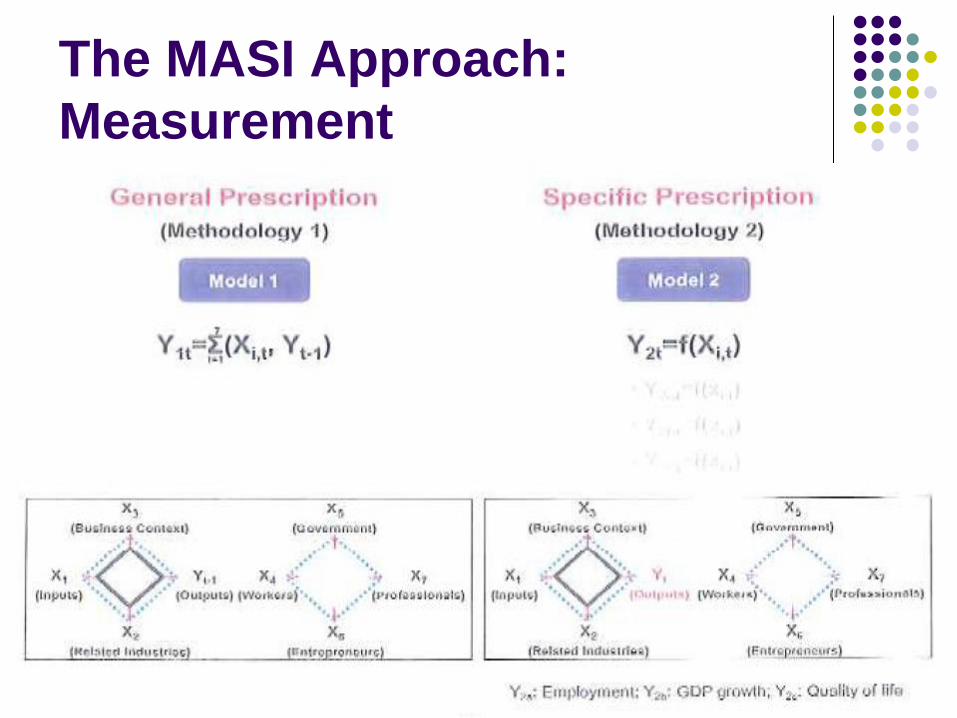
The MASI Approach:
Measurement
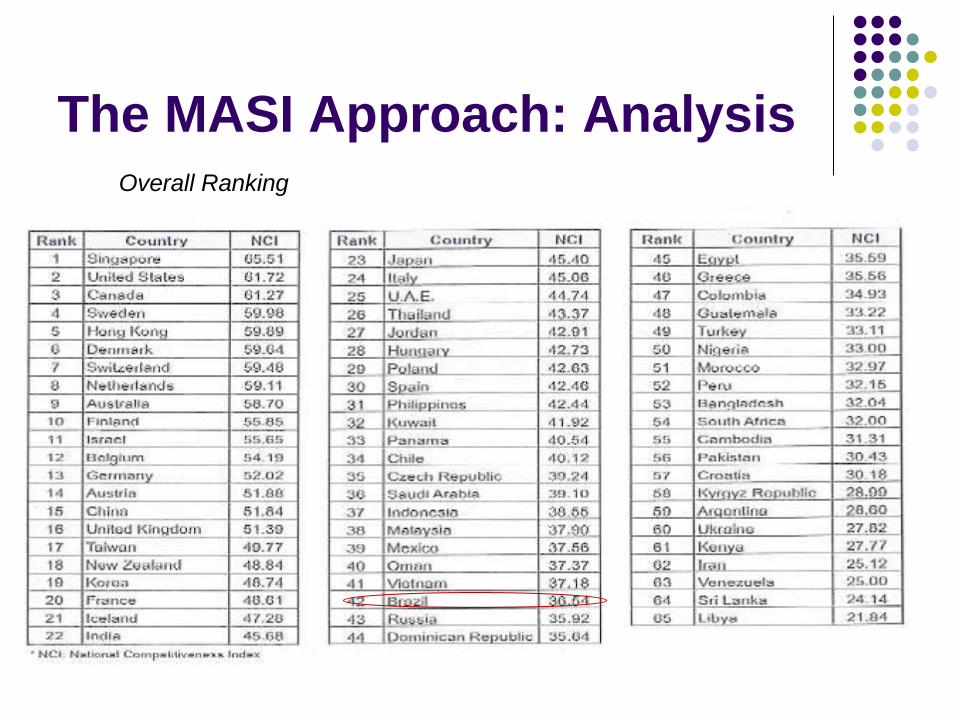
The MASI Approach: Analysis Overall Ranking

The MASI Approach: Analysis The Chinese Case
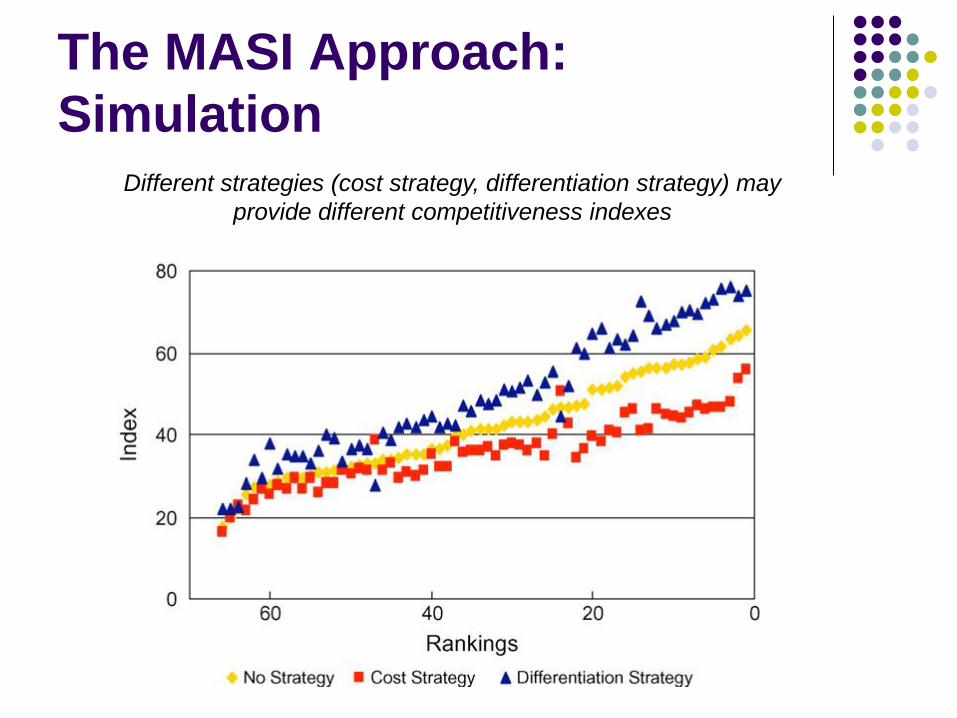
The MASI Approach:
Simulation
Different strategies (cost strategy, differentiation strategy) may
provide different competitiveness indexes
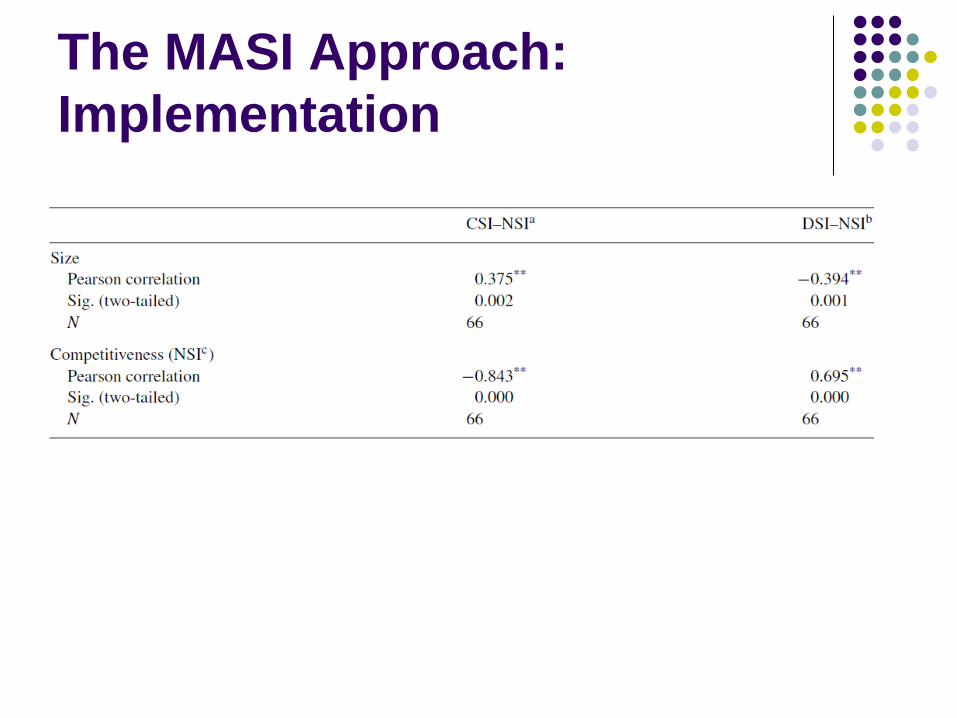
The MASI Approach:
Implementation
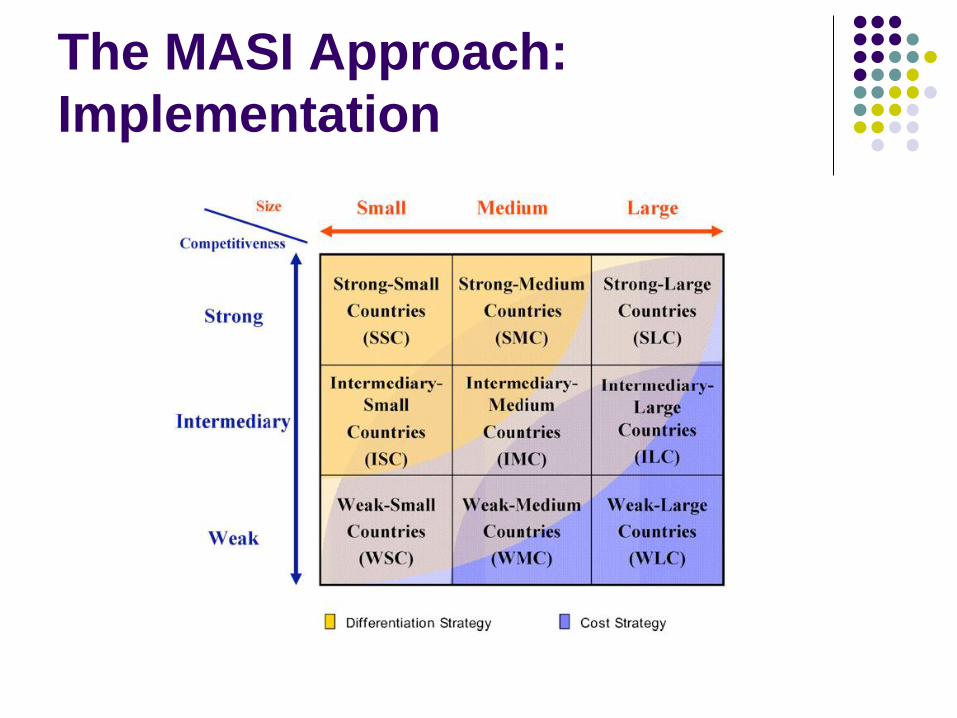
The MASI Approach:
Implementation

The MASI Approach:
Implementation

Towards an alternative
approach
Rather than substitute, we developed a
methodology of industrial structure
comparisons that is complementary to the ex-
ante analysis: we analyze competitiveness
and more precisely the firms’ competitive
strategies in an ex-post way, based on
innovation and industrial surveys.
This kind of analysis is completely a new
one.
The firms’ competitive
strategies approach: why?
Remember that the very nature of competitive advantage relies on consistent innovation and product differentiation as a competitive strategy.
But no country can be competitive in all industries, since not every firm can achieve the innovation-based pattern of competition. Moreover, the competitive strategies of the firms must be related to the nations’ stage of development.

The firms’ competitive
strategies approach: what is it?
So, we created a classification that allows us distinguish and analyze, through key variables and indicators, three competitive strategies:
1. Firms that reacted proactively during the nineties, investing on innovation and product differentiation as a competitive strategy;
2. Firms that made a partial adjustment of production processes in order to face the international competition (mainly investing on purchases of capital goods and so innovating in processes);
3. and those that are less innovative and productive, which survive in a smaller scale and exploiting local markets, mainly through low costs of labor.
The firms’ competitive strategies
approach: what is it? (2)
Note that within a country the three kinds of firms coexist and interact with each other. So if on the one hand that’s not easy to create a single score and ranking for the countries, on the other hand that’s exactly where the richness of the approach relies upon.
We can point out strengths and weaknesses of each category of firms (specially the first two) and, specially, we can characterize their technological learning, cooperation and technical change and the corresponding short run outcomes. In this sense, our classification is rather dynamic and structural than static and conjuncture influenced.
The firms’ competitive strategies
approach: how is it made?
In Brazil, we translated the competitive strategies into indicators in the following way:
A. Firms that innovate and differentiate products: i. Firms that innovate new products to the national markets according to the
Brazilian Manufacturing Innovation Survey, and
ii. export and earn a export price 30% higher than the rest of Brazilian exporter of that product.
B. Firms that are specialized in standardized products i. The rest of the exporters - because exports are a good proxy for a successful
adaptation to the competitive environment, or
ii. non-exporters that have higher productivity than the exporters in its industrial sector – because exporting involves sunk costs and very competitive firms can be non-exporters.
C. Firms that do not differentiate products and have a lower productivity
i. Firms that did not fall in the above categories.
The firms’ competitive strategies
approach: how is it made? (2)
However, in order to make international comparisons available, we had to change a bit the criteria to reclassify the “A” firms, since we did not have how to assess the differentiated export prices. So, the resulting classification was:
X. Firms that innovate and differentiate products: i. Firms that innovate new products to the national markets according to
Innovation Surveys, and
ii. invest more than the sectoral average in R&D/total revenue (following a common criterion between the countries for the sectoral averages).
Y. Firms that are specialized in standardized products i. The rest of the exporters, or
ii. non-exporters that have higher productivity than the exporters in its
iii. industrial sector.
Z. Non-innovative firms that have a lower productivity i. Firms that did not fall in the above categories.
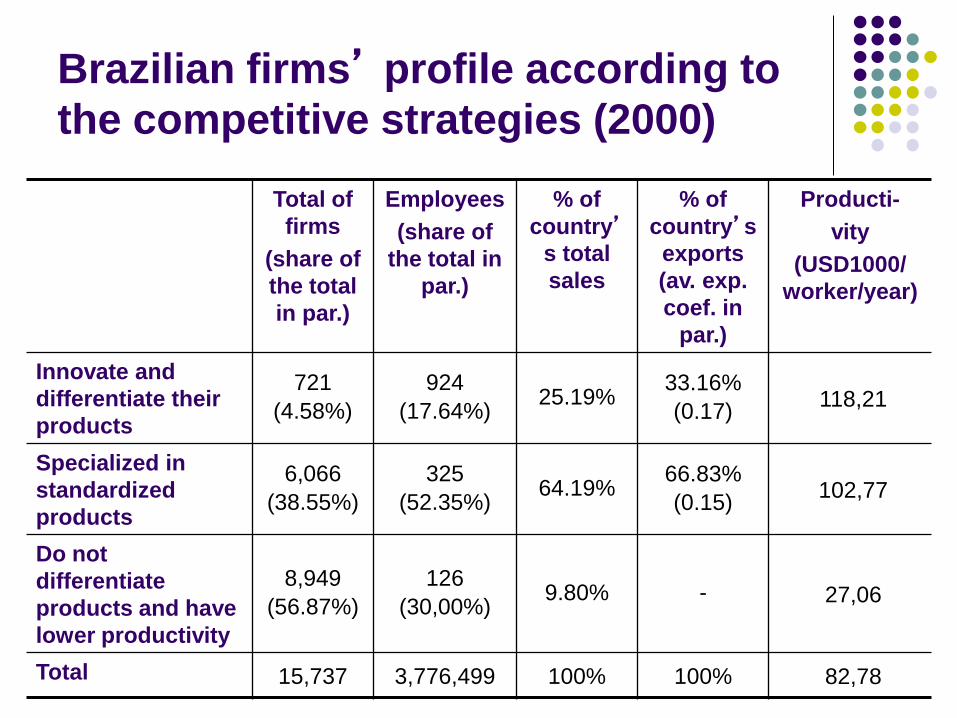
Brazilian firms’ profile according to
the competitive strategies (2000)
Total of
firms
(share of
the total
in par.)
Employees
(share of
the total in
par.)
% of
country’s total
sales
% of
country’s
exports
(av. exp.
coef. in
par.)
Producti-
vity
(USD1000/
worker/year)
Innovate and
differentiate their
products
721
(4.58%)
924
(17.64%) 25.19%
33.16%
(0.17) 118,21
Specialized in
standardized
products
6,066
(38.55%)
325
(52.35%) 64.19%
66.83%
(0.15) 102,77
Do not
differentiate
products and have
lower productivity
8,949
(56.87%)
126
(30,00%) 9.80% - 27,06
Total 15,737 3,776,499 100% 100% 82,78
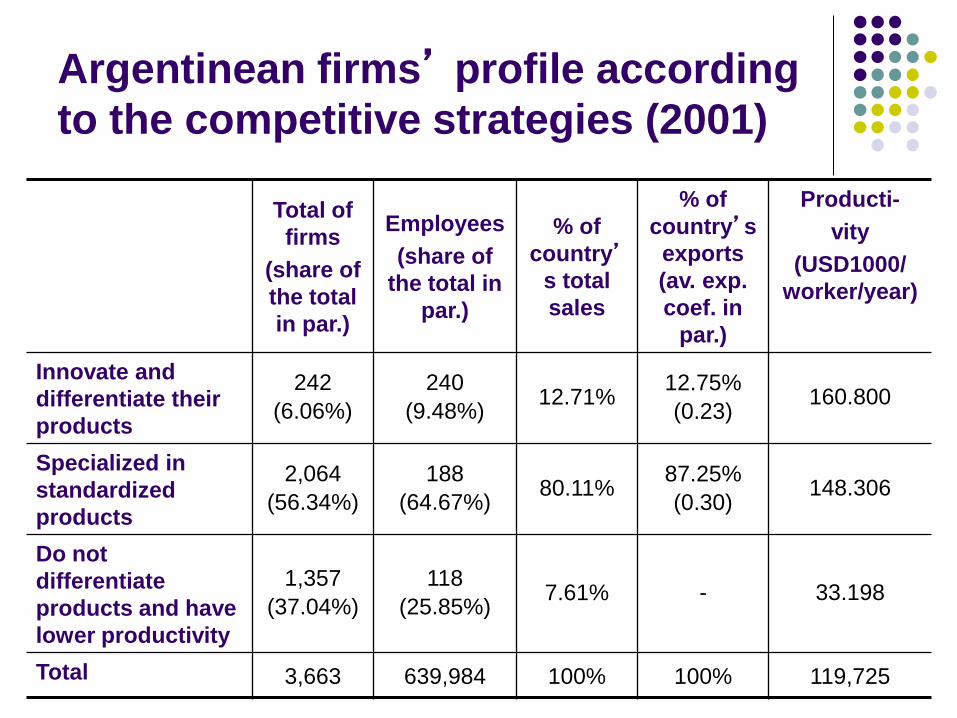
Argentinean firms’ profile according
to the competitive strategies (2001)
Total of
firms
(share of
the total
in par.)
Employees
(share of
the total in
par.)
% of
country’s total
sales
% of
country’s
exports
(av. exp.
coef. in
par.)
Producti-
vity
(USD1000/
worker/year)
Innovate and
differentiate their
products
242
(6.06%)
240
(9.48%) 12.71%
12.75%
(0.23) 160.800
Specialized in
standardized
products
2,064
(56.34%)
188
(64.67%) 80.11%
87.25%
(0.30) 148.306
Do not
differentiate
products and have
lower productivity
1,357
(37.04%)
118
(25.85%) 7.61% - 33.198
Total 3,663 639,984 100% 100% 119,725

Mexican firms’ profile according to
the competitive strategies (2000)
Total of
firms
(share of
the total
in par.)
Employees
(share of
the total in
par.)
% of
country’s total
sales
% of
country’s
exports
(av. exp.
coef. in
par.)
Producti-
vity
(USD1000/
worker/year)
Innovate and
differentiate their
products
263
(3.23%)
385
(5.29%) 5.30%
3.48%
(0.22) 98,191
Specialized in
standardized
products
4,179
(51.29%)
288
(62.75%) 82.70%
96.52%
(0.52) 129,099
Do not
differentiate
products and have
lower productivity
3,705
(45.48%)
165
(31.96%) 11.99% - 36,672
Total 8,147 1,918,942 100% 100% 97,83
Some comments on the results
In all of the Latin American countries firms that are specialized in standardized products have the largest share of exports, total employment and sales.
Notwithstanding, in Brazil innovating and product-differentiating firms have a larger share of employment, sales and manufacturing than in the other countries.
In Mexico, the specialization towards the standardized products is so strong that firms that are specialized in these products are in fact more productive than those that invest in product differentiation as a competitive strategy.
Now, let us take a look at some technological indicators.
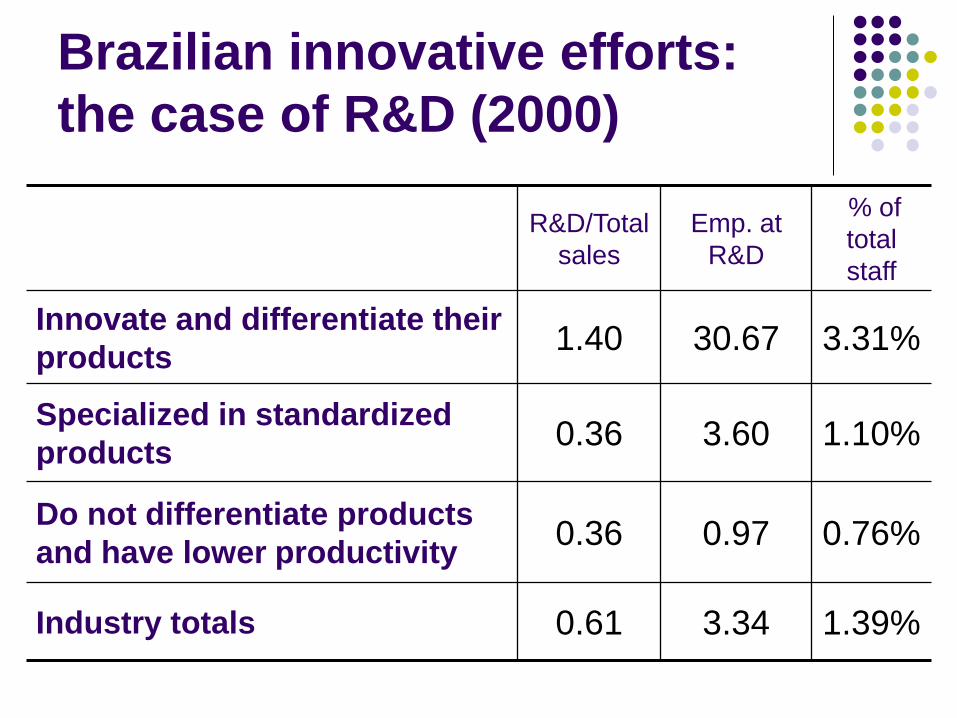
Brazilian innovative efforts:
the case of R&D (2000)
R&D/Total
sales
Emp. at
R&D
% of
total
staff
Innovate and differentiate their
products 1.40 30.67 3.31%
Specialized in standardized
products 0.36 3.60 1.10%
Do not differentiate products
and have lower productivity 0.36 0.97 0.76%
Industry totals 0.61 3.34 1.39%
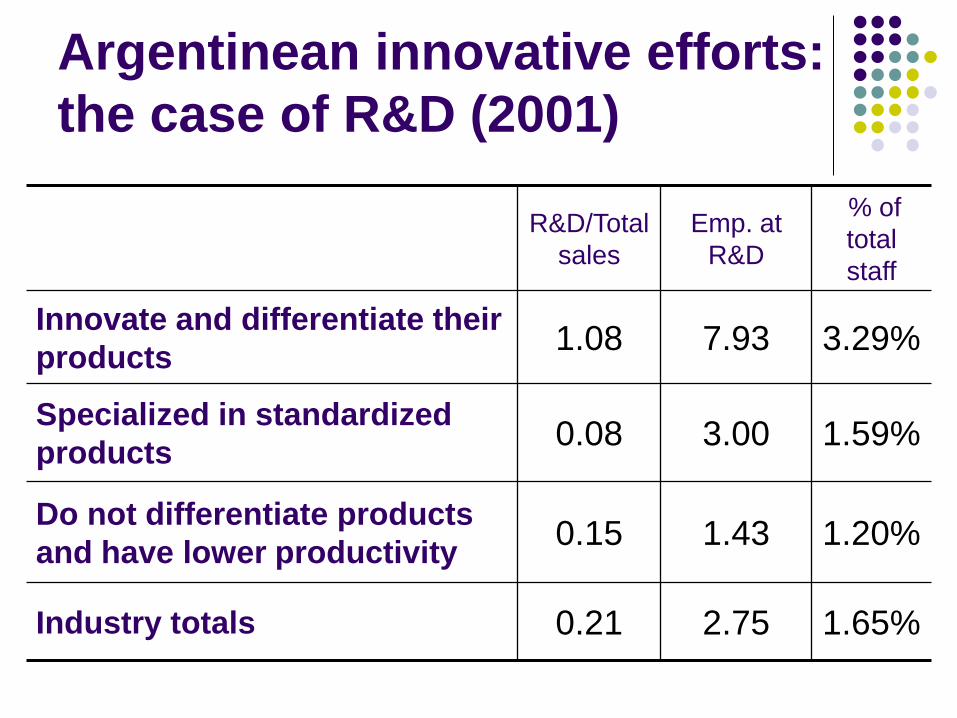
Argentinean innovative efforts:
the case of R&D (2001)
R&D/Total
sales
Emp. at
R&D
% of
total
staff
Innovate and differentiate their
products 1.08 7.93 3.29%
Specialized in standardized
products 0.08 3.00 1.59%
Do not differentiate products
and have lower productivity 0.15 1.43 1.20%
Industry totals 0.21 2.75 1.65%
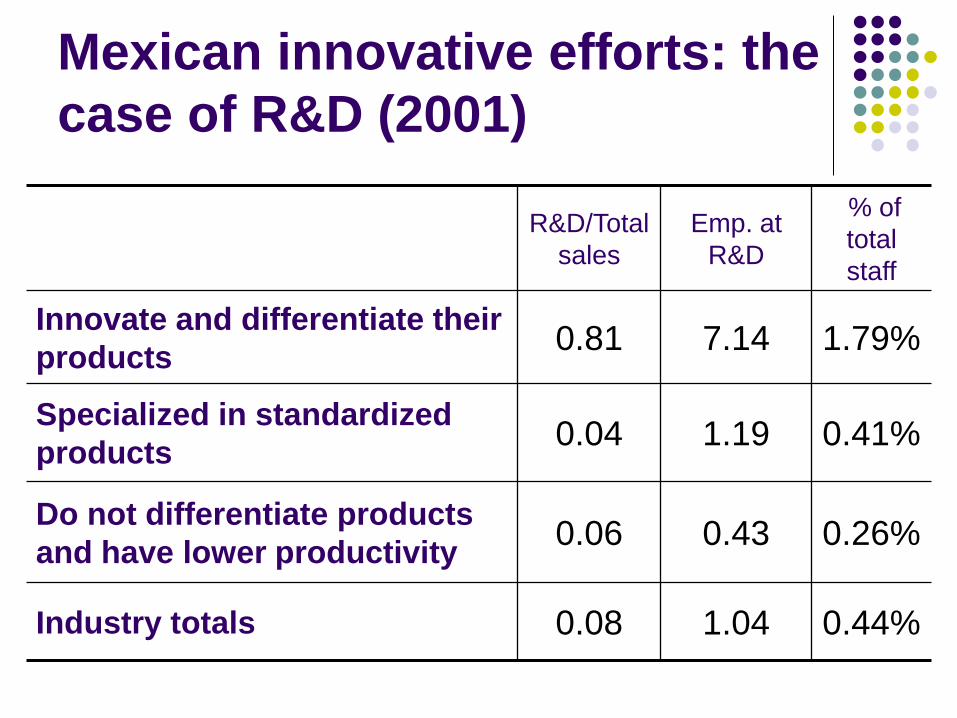
Mexican innovative efforts: the
case of R&D (2001)
R&D/Total
sales
Emp. at
R&D
% of
total
staff
Innovate and differentiate their
products 0.81 7.14 1.79%
Specialized in standardized
products 0.04 1.19 0.41%
Do not differentiate products
and have lower productivity 0.06 0.43 0.26%
Industry totals 0.08 1.04 0.44%
Some comments on the results
In all of the Latin American countries innovative efforts are considerably low. For the sake of comparison, in Germany the R&D/Industrial sales indicator is 2.7% and in France it is 2.5%.
In Brazil, we have more people employed in R&D in each firm, but the % of total employees as a proportion of the total staff is not so different than in Argentina because of the larger scale of Brazilian firms.
In Mexico the R&D/industrial sales indicator reaches the lowest value: only 0,08%, which clearly illustrates the competitive strategy of Mexican firms (Note: the Mexican Innovation Survey did not interview the Maquila firms).
Now let us take a look on how the innovative expenditures are distributed.

Brazilian firms’ innovation
expenditures distribution (2000)
Y firms
47%
26%
27% Machines and
equipment
In house R&D
Others
X firms
33%
35%
32% Machines and
equipment
In house R&D
Others
Z firms
56%
16%
28% Machines and
equipment
In house R&D
Others
Argentinean firms’ innovation
expenditures distribution (2001)
Y firms
74%
7%
19%Machines and
equipment
In house R&D
Others
X firms
53%
21%
26% Machines and
equipment
In house R&D
Others
Z firms
32%
24%
44%
Machines and
equipment
In house R&D
Others
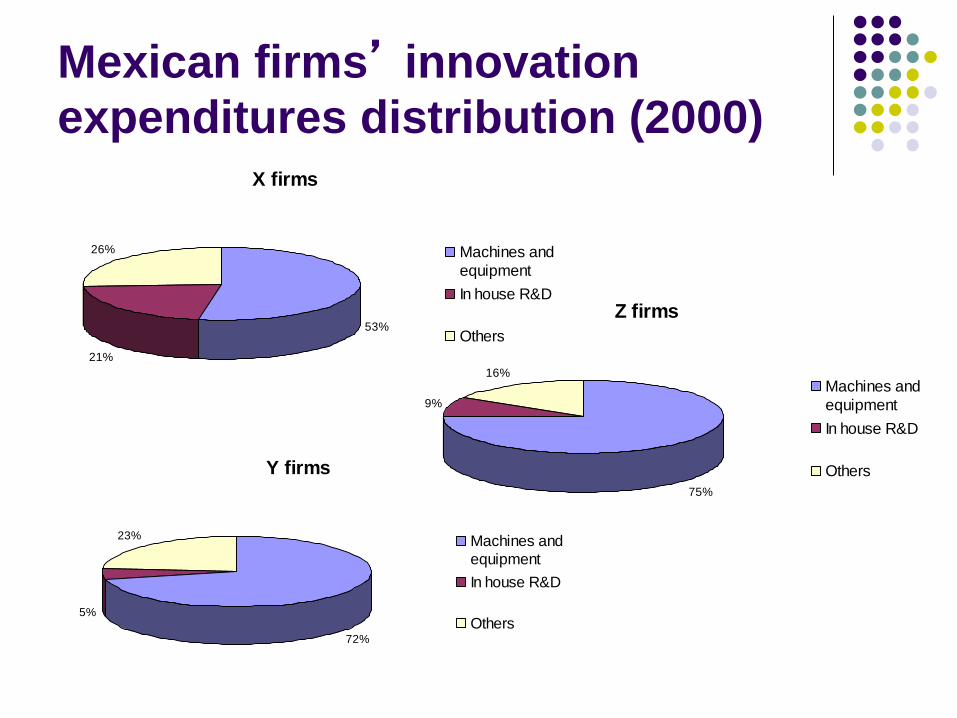
Mexican firms’ innovation
expenditures distribution (2000)
Y firms
72%
5%
23% Machines and
equipment
In house R&D
Others
X firms
53%
21%
26% Machines and
equipment
In house R&D
Others
Z firms
75%
9%
16%
Machines and
equipment
In house R&D
Others

Some comments on the results
In all of the Latin American countries innovative efforts are biased towards the acquisition of machines and other equipments related to process innovation. For the sake of comparison, in Spain the in house R&D is the most important category of innovative effort: for example, the X firms in Spain spend 58% of the innovation bill in this kind of innovative effort, the similar figures for the Y and Z are 40% and 64%, respectively (preliminary results).
In Mexico, this pattern is much stronger, one more evidence of the Mexican technological and competitive strategy.

(Possible) Future steps
Our team already classified and analyzed,
according to the presented methodology, the
industrial structures from Brazil, Argentina
and Mexico. These results will be presented
in two books.
We are ready to start a benchmarking work
with advanced economies, such as USA,
Canada, Germany, Switzerland, France and
Spain.

Thank you very much!!!