compilation of pharmaceutical applications · compilation of pharmaceutical ... a selection is...
TRANSCRIPT
Robust Applications, Fluidly Running Electrochemistry Discover the difference
The most reliable LC-ECapplications forDrugs & Pharmaceuticalsanalysis
Antipsychotic drugsClozapine OlanzapineRisperidone
PET imaging tracerFluorodeoxyglucose (FDG)FDG impurities
Pharmaceuticals, APIAcetaminophenArtemetherArtemisinin, Dihydro-artemisininBetadex sulfobutyl ether sodiumEtoposideEpinephrine Heparinmesna BNP77878-OH-DPATVincristineSulfidesGlutathioneAminothiolsDisulfides
Aminoglycoside drugsAmikacin Framycetin sulphateGentamicin sulphate Kanamycin NetilmycinNeomycin sulfateSpectinomycinLincomycinTobramycin
Application NoteDrugs & Pharmaceuticals
Compilation of Pharmaceutical Applications
n ALEXYS Analyzers in Pharma and Biotech
n Optimized for performance
n Dedicated system solutions
n Reproducible and robust
A selection is presented of different application notes from the work of a few of our many users.
These notes demonstrate the versatility of our analyzers in different experimental conditions.
Figure 1: ALEXYS Analyzer.
Contents
217-011 Azithromycin
217-008 Formoterol
217-007 Etoposide
217-006 Artemisinin, dihydro-artemisinin and artemether
215-004 8-hydroxy-2’-deoxyguanosine
215-003 O6-methylguanine
215-002 8-Hydroxydeoxyguanosine
215-001 7-Methylguanine
218-005 Vitamin K
218-001 Q10, Ubiquinols, Vitamine E and ß-carotene
217-012 Mesna and pro-drug BNP7787
217-004 Vincristine
ALEXYS Application Note # 217_025_05
2
Compilation of Pharmaceutical Applications
Azithromycin in pharmaceutical dosage formsIntroduction
Azithromycin belongs to the macrolides and is an acid stable
erythromycin derivative used for antibacterial infections. It
has quite favourable pharmacokinetic properties and is high-
ly effective against respiratory tract infections, sexually trans-
mitted diseases and non-classical pathogens like Heliobacter
pylori. Azithromycin has been analysed in biological fluids
and in pharmaceutical dosage forms by LC using different de-
tection techniques. Among these, electrochemical detection
(EC) excels because of its intrinsic sensitivity and precision.
In some cases quite unusual LC-EC conditions (pH, modifier,
column materials) have been applied. Also, in the official USP
method two amperometric working electrodes in a serial ar-
rangement have been prescribed. We have determined the
LC and EC conditions allowing the use of standard reversed-
phase column materials, relatively low modifier concentra-
tions, a neutral pH and a single working electrode.
Method
Mobile phase conditions were optimised towards the use of
a single working electrode, a low background current and a
standard reversed phase column. It appeared that the con-
ditions listed below fulfilled these requirements resulting in
highly sensitive, selective and reproducible analyses. Stock
solutions of Azithromycin (USP) were made up in 100% in
methanol to a final concentration of 200 μM. Standards for a
calibration curve were obtained by diluting this solution 200,
2000 times with mobile phase.
0
1
2
3
4
5
6
7
8
0 1 2 3 4 5time (min)
Sign
al (n
A)
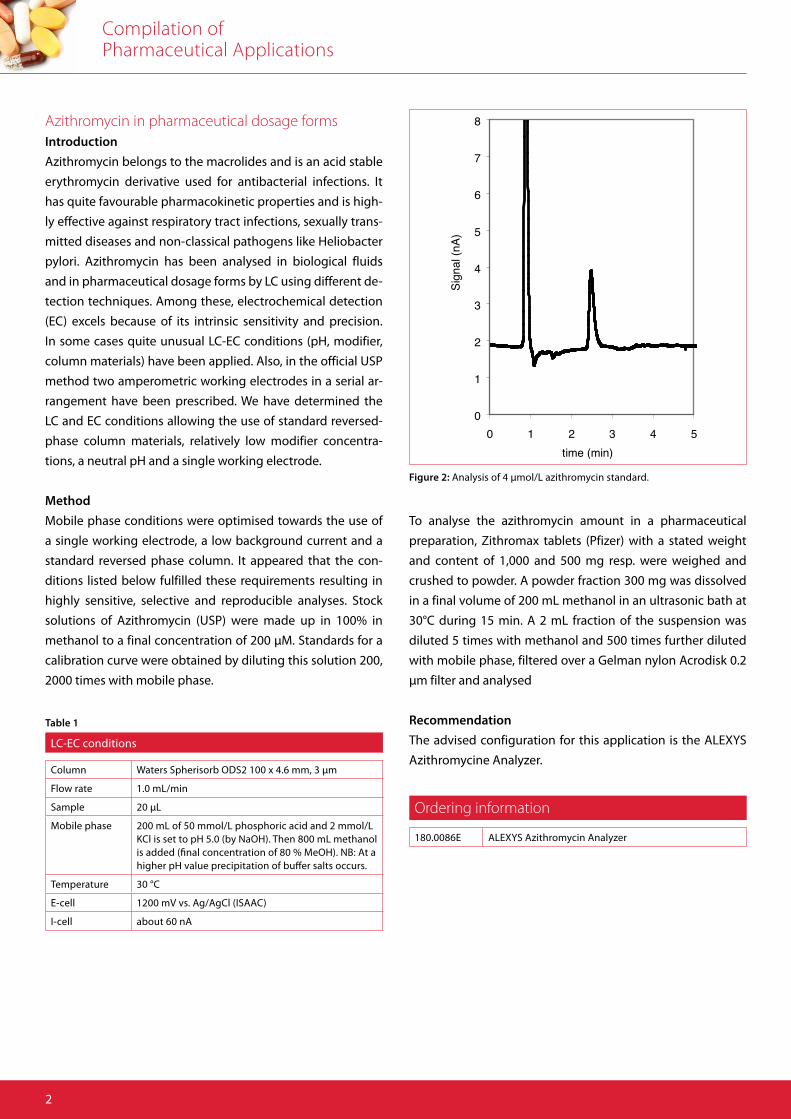
Figure 2: Analysis of 4 μmol/L azithromycin standard.
LC-EC conditions
Column Waters Spherisorb ODS2 100 x 4.6 mm, 3 μm
Flow rate 1.0 mL/min
Sample 20 μL
Mobile phase 200 mL of 50 mmol/L phosphoric acid and 2 mmol/L KCl is set to pH 5.0 (by NaOH). Then 800 mL methanol is added (final concentration of 80 % MeOH). NB: At a higher pH value precipitation of buffer salts occurs.
Temperature 30 °C
E-cell 1200 mV vs. Ag/AgCl (ISAAC)
I-cell about 60 nA
Table 1
To analyse the azithromycin amount in a pharmaceutical
preparation, Zithromax tablets (Pfizer) with a stated weight
and content of 1,000 and 500 mg resp. were weighed and
crushed to powder. A powder fraction 300 mg was dissolved
in a final volume of 200 mL methanol in an ultrasonic bath at
30°C during 15 min. A 2 mL fraction of the suspension was
diluted 5 times with methanol and 500 times further diluted
with mobile phase, filtered over a Gelman nylon Acrodisk 0.2
μm filter and analysed
Recommendation
The advised configuration for this application is the ALEXYS
Azithromycine Analyzer.
Ordering information
180.0086E ALEXYS Azithromycin Analyzer
Compilation of Pharmaceutical Applications
3
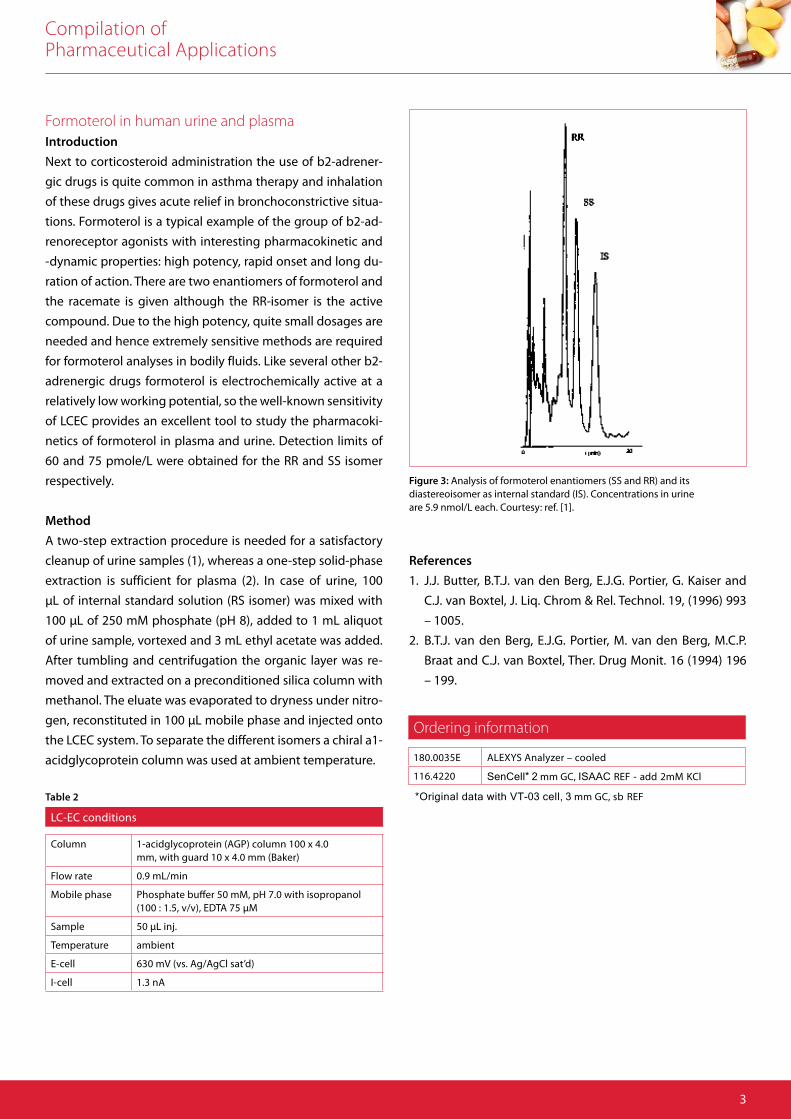
Figure 3: Analysis of formoterol enantiomers (SS and RR) and itsdiastereoisomer as internal standard (IS). Concentrations in urineare 5.9 nmol/L each. Courtesy: ref. [1].
LC-EC conditions
Column 1-acidglycoprotein (AGP) column 100 x 4.0mm, with guard 10 x 4.0 mm (Baker)
Flow rate 0.9 mL/min
Mobile phase Phosphate buffer 50 mM, pH 7.0 with isopropanol(100 : 1.5, v/v), EDTA 75 μM
Sample 50 μL inj.
Temperature ambient
E-cell 630 mV (vs. Ag/AgCl sat’d)
I-cell 1.3 nA
Table 2
Formoterol in human urine and plasmaIntroduction
Next to corticosteroid administration the use of b2-adrener-
gic drugs is quite common in asthma therapy and inhalation
of these drugs gives acute relief in bronchoconstrictive situa-
tions. Formoterol is a typical example of the group of b2-ad-
renoreceptor agonists with interesting pharmacokinetic and
-dynamic properties: high potency, rapid onset and long du-
ration of action. There are two enantiomers of formoterol and
the racemate is given although the RR-isomer is the active
compound. Due to the high potency, quite small dosages are
needed and hence extremely sensitive methods are required
for formoterol analyses in bodily fluids. Like several other b2-
adrenergic drugs formoterol is electrochemically active at a
relatively low working potential, so the well-known sensitivity
of LCEC provides an excellent tool to study the pharmacoki-
netics of formoterol in plasma and urine. Detection limits of
60 and 75 pmole/L were obtained for the RR and SS isomer
respectively.
Method
A two-step extraction procedure is needed for a satisfactory
cleanup of urine samples (1), whereas a one-step solid-phase
extraction is sufficient for plasma (2). In case of urine, 100
μL of internal standard solution (RS isomer) was mixed with
100 μL of 250 mM phosphate (pH 8), added to 1 mL aliquot
of urine sample, vortexed and 3 mL ethyl acetate was added.
After tumbling and centrifugation the organic layer was re-
moved and extracted on a preconditioned silica column with
methanol. The eluate was evaporated to dryness under nitro-
gen, reconstituted in 100 μL mobile phase and injected onto
the LCEC system. To separate the different isomers a chiral a1-
acidglycoprotein column was used at ambient temperature.
Ordering information
References
1. J.J. Butter, B.T.J. van den Berg, E.J.G. Portier, G. Kaiser and
C.J. van Boxtel, J. Liq. Chrom & Rel. Technol. 19, (1996) 993
– 1005.
2. B.T.J. van den Berg, E.J.G. Portier, M. van den Berg, M.C.P.
Braat and C.J. van Boxtel, Ther. Drug Monit. 16 (1994) 196
– 199.
*Original data with VT-03 cell, 3 mm GC, sb REF
180.0035E ALEXYS Analyzer – cooled
116.4220 SenCell* 2 mm GC, ISA AC REF - add 2mM KCl
Compilation of Pharmaceutical Applications
44
Etoposide in biological matricesIntroduction
Cancer cells may become resistant to a variety of drugs with
different structures or cellular targets, called multi-drug resis-
tance. Particularly the blood-brain and the blood-cerebrospi-
nal fluid (blood-CSF) barrier limit the access of drugs to the
central nervous system and hence limit the effectiveness of
anti-cancer drugs in CNS tumours. In the current study etopo-
side has been used as a tool to investigate transport processes
over the blood-CSF barrier in mice. It appears that Multidrug
Resistance Related Protein 1 (MRP1) helps to limit distribu-
tion of xenobiotics like etoposide and converse multi-drug
resistance (MDR). MRP 1 inhibitors as well as MDR-inhibitors
can be used to improve the passage of anti-cancer drugs over
the blood-CSF and the blood-brain barrier (1). Due to the fact
that etoposide is electrochemically active, the high sensitiv-
ity of LCEC could be fully exploited to study pharmacokinetic
profiles of this drug in brains of MDR1a and MDR1b deficient
mice (MRP1(+/+)) and MDR1a-MDR1b and MRP1 deficient
mice (MRP1(-/-)).
Method
Etoposide was infused into the tail vein of MRP1(-/-) and
MRP1(+/+) mice (60 mg/kg, 100 μL in 2 min). CSF was col-
lected during a period of one hour after start of the infusion.
Subsequently, the animals were decapitated and blood and
brain were collected for etoposide analysis. Prior to analysis,
CSF, brain tissue and plasma were stored at –30°C. All 3 matri-
ces were analysed by LCEC but CSF without further pre-treat-
ment. Plasma was diluted with phosphate buffer (50 mM, pH
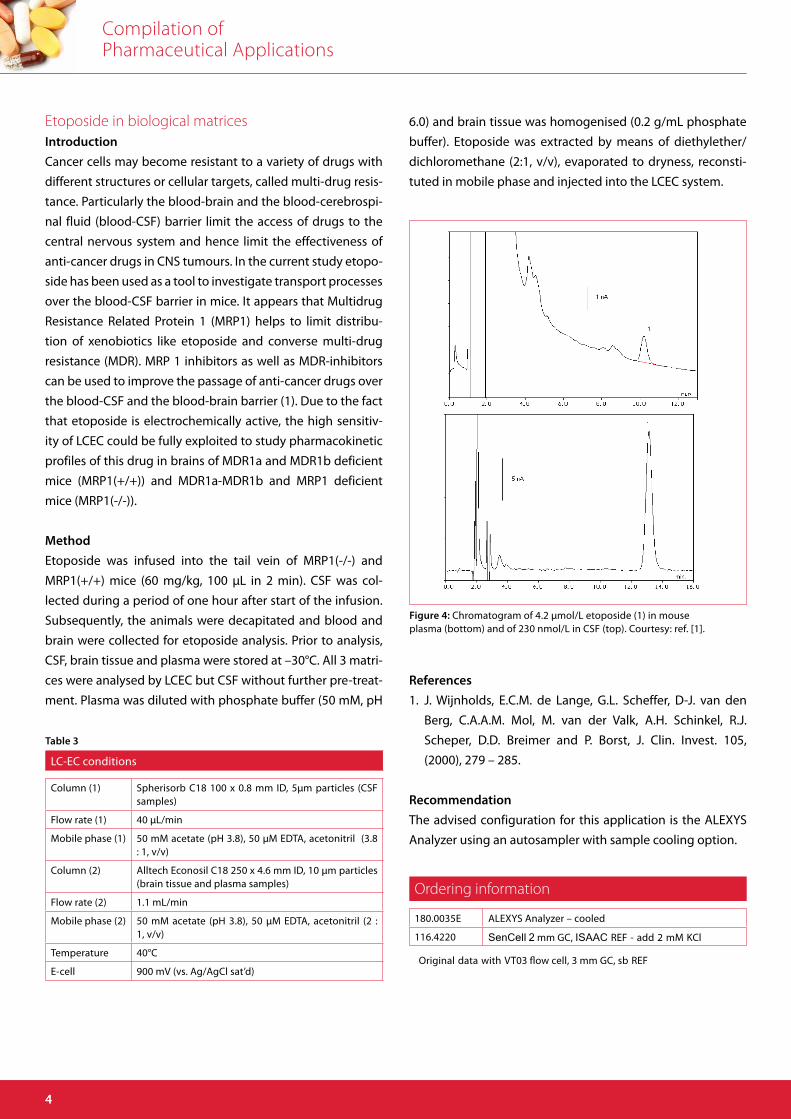
Figure 4: Chromatogram of 4.2 μmol/L etoposide (1) in mouseplasma (bottom) and of 230 nmol/L in CSF (top). Courtesy: ref. [1].
4
References
1. J. Wijnholds, E.C.M. de Lange, G.L. Scheffer, D-J. van den
Berg, C.A.A.M. Mol, M. van der Valk, A.H. Schinkel, R.J.
Scheper, D.D. Breimer and P. Borst, J. Clin. Invest. 105,
(2000), 279 – 285.
Recommendation
The advised configuration for this application is the ALEXYS
Analyzer using an autosampler with sample cooling option.
Ordering information
180.0035E ALEXYS Analyzer – cooled
116.4220 SenCell 2 mm GC, ISAAC REF - add 2 mM KCl
LC-EC conditions
Column (1) Spherisorb C18 100 x 0.8 mm ID, 5μm particles (CSF samples)
Flow rate (1) 40 μL/min
Mobile phase (1) 50 mM acetate (pH 3.8), 50 μM EDTA, acetonitril (3.8 : 1, v/v)
Column (2) Alltech Econosil C18 250 x 4.6 mm ID, 10 μm particles (brain tissue and plasma samples)
Flow rate (2) 1.1 mL/min
Mobile phase (2) 50 mM acetate (pH 3.8), 50 μM EDTA, acetonitril (2 : 1, v/v)
Temperature 40°C
E-cell 900 mV (vs. Ag/AgCl sat’d)
Table 3
6.0) and brain tissue was homogenised (0.2 g/mL phosphate
buffer). Etoposide was extracted by means of diethylether/
dichloromethane (2:1, v/v), evaporated to dryness, reconsti-
tuted in mobile phase and injected into the LCEC system.
Original data with VT03 flow cell, 3 mm GC, sb REF
Compilation of Pharmaceutical Applications
55
itacilppA lacituecamra ons
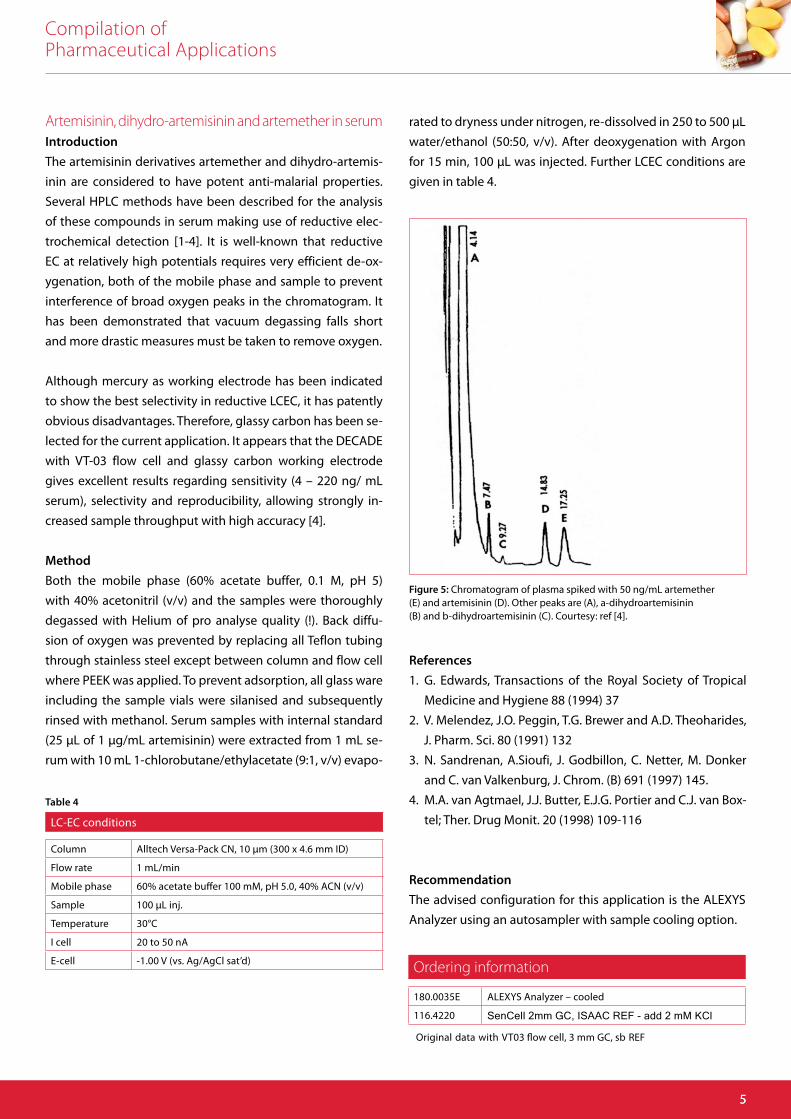
Figure 5: Chromatogram of plasma spiked with 50 ng/mL artemether(E) and artemisinin (D). Other peaks are (A), a-dihydroartemisinin(B) and b-dihydroartemisinin (C). Courtesy: ref [4].
LC-EC conditions
Column Alltech Versa-Pack CN, 10 μm (300 x 4.6 mm ID)
Flow rate 1 mL/min
Mobile phase 60% acetate buffer 100 mM, pH 5.0, 40% ACN (v/v)
Sample 100 μL inj.
Temperature 30°C
I cell 20 to 50 nA
E-cell -1.00 V (vs. Ag/AgCl sat’d)
Table 4
Artemisinin, dihydro-artemisinin and artemether in serumIntroduction
The artemisinin derivatives artemether and dihydro-artemis-
inin are considered to have potent anti-malarial properties.
Several HPLC methods have been described for the analysis
of these compounds in serum making use of reductive elec-
trochemical detection [1-4]. It is well-known that reductive
EC at relatively high potentials requires very efficient de-ox-
ygenation, both of the mobile phase and sample to prevent
interference of broad oxygen peaks in the chromatogram. It
has been demonstrated that vacuum degassing falls short
and more drastic measures must be taken to remove oxygen.
Although mercury as working electrode has been indicated
to show the best selectivity in reductive LCEC, it has patently
obvious disadvantages. Therefore, glassy carbon has been se-
lected for the current application. It appears that the DECADE
with VT-03 flow cell and glassy carbon working electrode
gives excellent results regarding sensitivity (4 – 220 ng/ mL
serum), selectivity and reproducibility, allowing strongly in-
creased sample throughput with high accuracy [4].
Method
Both the mobile phase (60% acetate buffer, 0.1 M, pH 5)
with 40% acetonitril (v/v) and the samples were thoroughly
degassed with Helium of pro analyse quality (!). Back diffu-
sion of oxygen was prevented by replacing all Teflon tubing
through stainless steel except between column and flow cell
where PEEK was applied. To prevent adsorption, all glass ware
including the sample vials were silanised and subsequently
rinsed with methanol. Serum samples with internal standard
(25 μL of 1 μg/mL artemisinin) were extracted from 1 mL se-
rum with 10 mL 1-chlorobutane/ethylacetate (9:1, v/v) evapo-
Ordering information
180.0035E ALEXYS Analyzer – cooled
116.4220
References
1. G. Edwards, Transactions of the Royal Society of Tropical
Medicine and Hygiene 88 (1994) 37
2. V. Melendez, J.O. Peggin, T.G. Brewer and A.D. Theoharides,
J. Pharm. Sci. 80 (1991) 132
3. N. Sandrenan, A.Sioufi, J. Godbillon, C. Netter, M. Donker
and C. van Valkenburg, J. Chrom. (B) 691 (1997) 145.
4. M.A. van Agtmael, J.J. Butter, E.J.G. Portier and C.J. van Box-
tel; Ther. Drug Monit. 20 (1998) 109-116
Recommendation
The advised configuration for this application is the ALEXYS
Analyzer using an autosampler with sample cooling option.
rated to dryness under nitrogen, re-dissolved in 250 to 500 μL
water/ethanol (50:50, v/v). After deoxygenation with Argon
for 15 min, 100 μL was injected. Further LCEC conditions are
given in table 4.
Original data with VT03 flow cell, 3 mm GC, sb REF
SenCell 2mm GC, ISAAC REF - add 2 mM KCl
Compilation of Pharmaceutical Applications
6
8-hydroxy-2’-deoxyguanosine in brain tissue DNAIntroduction
Oxidative damage to proteins and DNA occurs as a conse-
quence of the generation of oxidants such as superoxide an-
ions, hydrogen peroxide and hydroxyl radicals. 8-hydroxy-2’-
deoxyguanosine (8-OH-dGuo) is considered to be a useful
biomarker of oxidative DNA damage since its formation can
also be induced by oxidative stress (1). The analysis of the pat-
tern of DNA adduct formation is required for evaluation and
comparison of the genotoxic response of chemicals in bio-
logical systems. The classical and quite expensive approach
involves the use of radioactively labelled genotoxic agents.
However, a number of DNA adducts appears to be electro-
chemically active (2). For this class of adducts the comparable,
high sensitivity of LC-EC offers an excellent and inexpensive
alternative. In this application note the method for 8-OH-
dGuo is presented. Further details can be found in the paper
of Te Koppele et al. (3).
Method
Human brain tissue DNA was obtained from clinically diag-
nosed Alzheimer’s disease cases. After isolation and prepa-
ration of DNA samples, the DNA was hydrolysed and 50 μL
aliquots were injected directly into the HPLC system. To quan-
titate normal DNA nucleosides and 8-OH-dGuo, isocratical
separation occurred on a reverse phase column and the efflu-
ent was detected by UV and EC detection, connected in series,
respectively. Reproducibility of the overall assay was validat-
ed with human and rat brain, processed as described above.
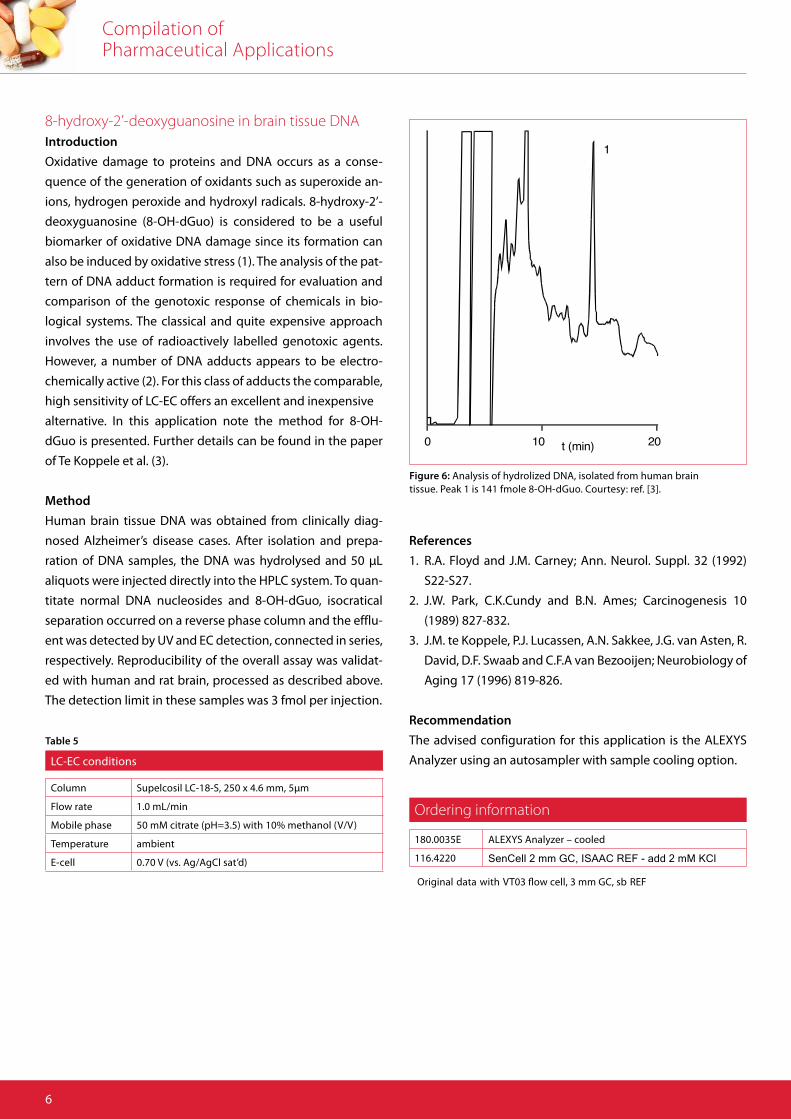
The detection limit in these samples was 3 fmol per injection.
0 10 20
1
t (min)
Figure 6: Analysis of hydrolized DNA, isolated from human braintissue. Peak 1 is 141 fmole 8-OH-dGuo. Courtesy: ref. [3].
References
1. R.A. Floyd and J.M. Carney; Ann. Neurol. Suppl. 32 (1992)
S22-S27.
2. J.W. Park, C.K.Cundy and B.N. Ames; Carcinogenesis 10
(1989) 827-832.
3. J.M. te Koppele, P.J. Lucassen, A.N. Sakkee, J.G. van Asten, R.
David, D.F. Swaab and C.F.A van Bezooijen; Neurobiology of
Aging 17 (1996) 819-826.
Recommendation
The advised configuration for this application is the ALEXYS
Analyzer using an autosampler with sample cooling option.
Ordering information
180.0035E ALEXYS Analyzer – cooled
116.4220
LC-EC conditions
Column Supelcosil LC-18-S, 250 x 4.6 mm, 5μm
Flow rate 1.0 mL/min
Mobile phase 50 mM citrate (pH=3.5) with 10% methanol (V/V)
Temperature ambient
E-cell 0.70 V (vs. Ag/AgCl sat’d)
Table 5
Original data with VT03 flow cell, 3 mm GC, sb REF
SenCell 2 mm GC, ISAAC REF - add 2 mM KCl
Compilation of Pharmaceutical Applications
7
O6-methylguanine in rat spleen DNAIntroduction
The analysis of the pattern of DNA adduct formation is re-
quired for evaluation and comparison of the genotoxic re-
sponse of chemicals in biological systems. The classical and
quite expensive approach involves the use of radioactively la-
belled genotoxic agents. However, a number of DNA adducts
appears to be electrochemically active (Park et al., 1989). For
this class of adducts the comparable, high sensitivity of LC-EC
offers an excellent and inexpensive alternative. In this appli-
cation note the method for O6- methylguanine is presented.
Further details can be found in the paper of De Groot et al.
(1994).
Method
Hydrolysed DNA, obtained from rat liver tissue, is injected on
a strong cation exchange column (Partisil 10-SCX) and detect-
ed by UV absorption. The O6-methylguanine peak fraction is
collected, freeze-dried, and twice lyophilised/re-dissolved in
formic acid. Five μL of the formic acid solution is injected on
the reversed phase column for LC-EC processing.
If the fraction collection step is omitted, strong interference
may be expected from the relatively extremely high levels of
guanine and adenine in the sample, leading to unfavourable
detection conditions. With the present settings the detection
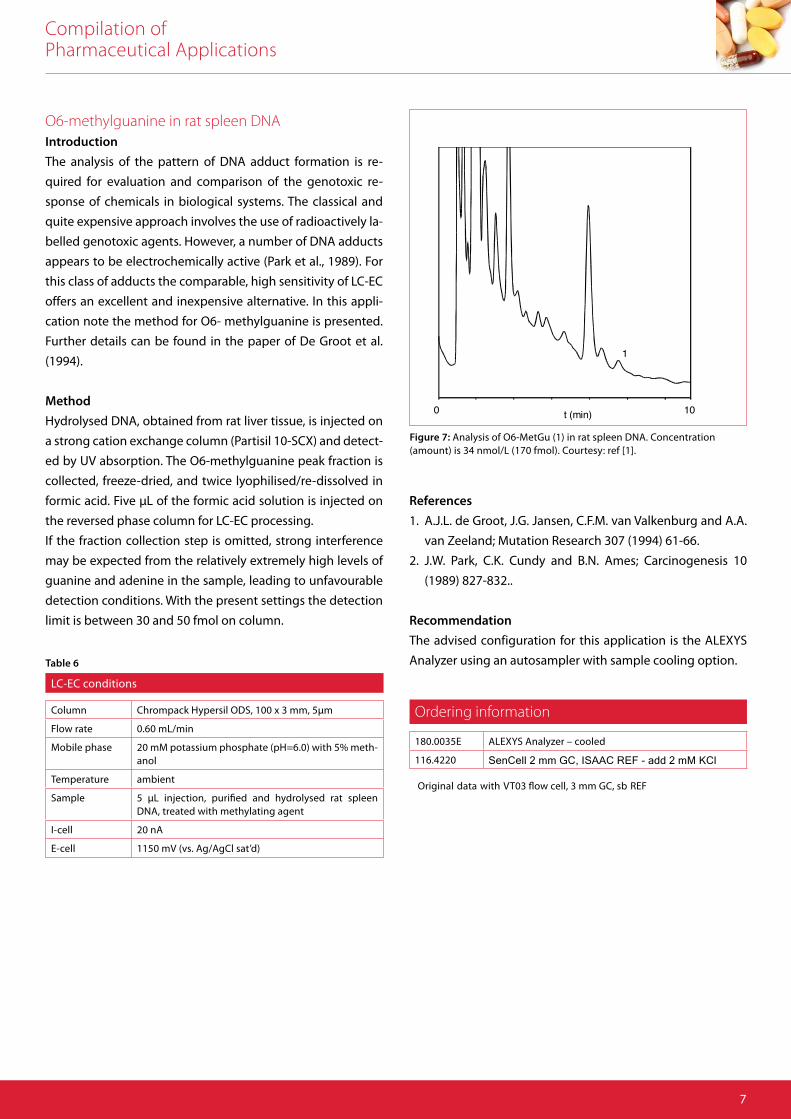
limit is between 30 and 50 fmol on column.
itacilppA lacituecamra ons
Page: 7
0 10t (min)
1
Figure 7: Analysis of O6-MetGu (1) in rat spleen DNA. Concentration(amount) is 34 nmol/L (170 fmol). Courtesy: ref [1].
References
1. A.J.L. de Groot, J.G. Jansen, C.F.M. van Valkenburg and A.A.
van Zeeland; Mutation Research 307 (1994) 61-66.
2. J.W. Park, C.K. Cundy and B.N. Ames; Carcinogenesis 10
(1989) 827-832..
Recommendation
The advised configuration for this application is the ALEXYS
Analyzer using an autosampler with sample cooling option.
Ordering information
180.0035E ALEXYS Analyzer – cooled
116.4220
LC-EC conditions
Column Chrompack Hypersil ODS, 100 x 3 mm, 5μm
Flow rate 0.60 mL/min
Mobile phase 20 mM potassium phosphate (pH=6.0) with 5% meth-anol
Temperature ambient
Sample 5 μL injection, purified and hydrolysed rat spleen DNA, treated with methylating agent
I-cell 20 nA
E-cell 1150 mV (vs. Ag/AgCl sat’d)
Table 6
Original data with VT03 flow cell, 3 mm GC, sb REF
SenCell 2 mm GC, ISAAC REF - add 2 mM KCl
Compilation of Pharmaceutical Applications
8
8-Hydroxydeoxyguanosine in lymphocyte DNAIntroduction
The analysis of the pattern of DNA adduct formation is re-
quired for evaluation and comparison of the genotoxic re-
sponse of chemicals in biological systems. The classical and
quite expensive approach involves the use of radioactively la-
belled genotoxic agents. However, a number of DNA adducts
appears to be electrochemically active (Park et al., 1989). For
this class of adducts the comparable, high sensitivity of LC-EC
offers an excellent and inexpensive alternative. In this applica-
tion note the method for 8- hydroxydeoxyguanosine is pre-
sented. Further details can be found in the paper of De Groot
et al. (1994).
Method
Hydrolysed DNA, obtained from lymphocytes of a non smok-
ing volunteer, is injected on a strong cation exchange column
(Partisil 10-SCX) and detected by UV absorption. The 8- hy-
droxydeoxyguanosine peak fraction is freeze-dried, and twice
lyophilised and re-dissolved in formic acid. Ten μL of the for-
mic acid solution is injected on the reversed phase column
for LC-EC processing. If the fraction collection step is omitted,
strong interference may be expected from the relatively ex-
tremely high levels of guanine and adenine in the sample,
leading to unfavourable detection conditions. With the pres-
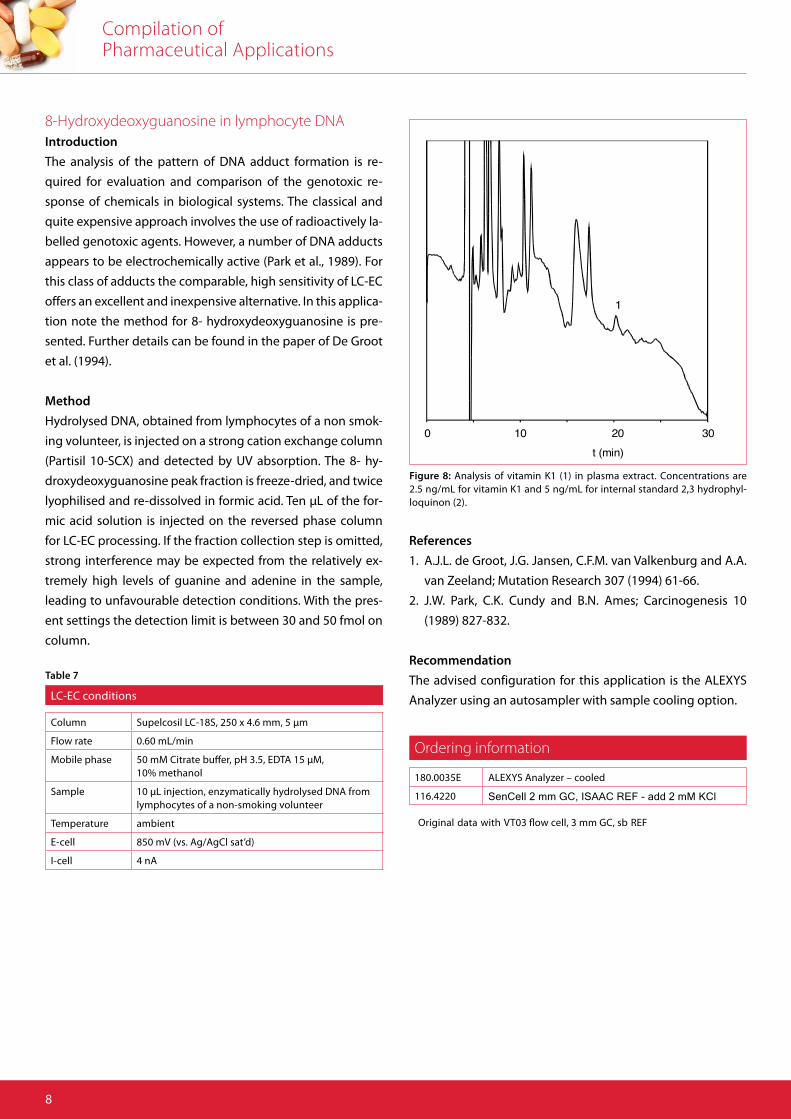
ent settings the detection limit is between 30 and 50 fmol on
column.
0 10 20 30t (min)
1
Figure 8: Analysis of vitamin K1 (1) in plasma extract. Concentrations are 2.5 ng/mL for vitamin K1 and 5 ng/mL for internal standard 2,3 hydrophyl-loquinon (2).
References
1. A.J.L. de Groot, J.G. Jansen, C.F.M. van Valkenburg and A.A.
van Zeeland; Mutation Research 307 (1994) 61-66.
2. J.W. Park, C.K. Cundy and B.N. Ames; Carcinogenesis 10
(1989) 827-832.
Recommendation
The advised configuration for this application is the ALEXYS
Analyzer using an autosampler with sample cooling option.
Ordering information
180.0035E ALEXYS Analyzer – cooled
116.4220
LC-EC conditions
Column Supelcosil LC-18S, 250 x 4.6 mm, 5 μm
Flow rate 0.60 mL/min
Mobile phase 50 mM Citrate buffer, pH 3.5, EDTA 15 μM, 10% methanol
Sample 10 μL injection, enzymatically hydrolysed DNA from lymphocytes of a non-smoking volunteer
Temperature ambient
E-cell 850 mV (vs. Ag/AgCl sat’d)
I-cell 4 nA
Table 7
Original data with VT03 flow cell, 3 mm GC, sb REF
SenCell 2 mm GC, ISAAC REF - add 2 mM KCl
Compilation of Pharmaceutical Applications
9
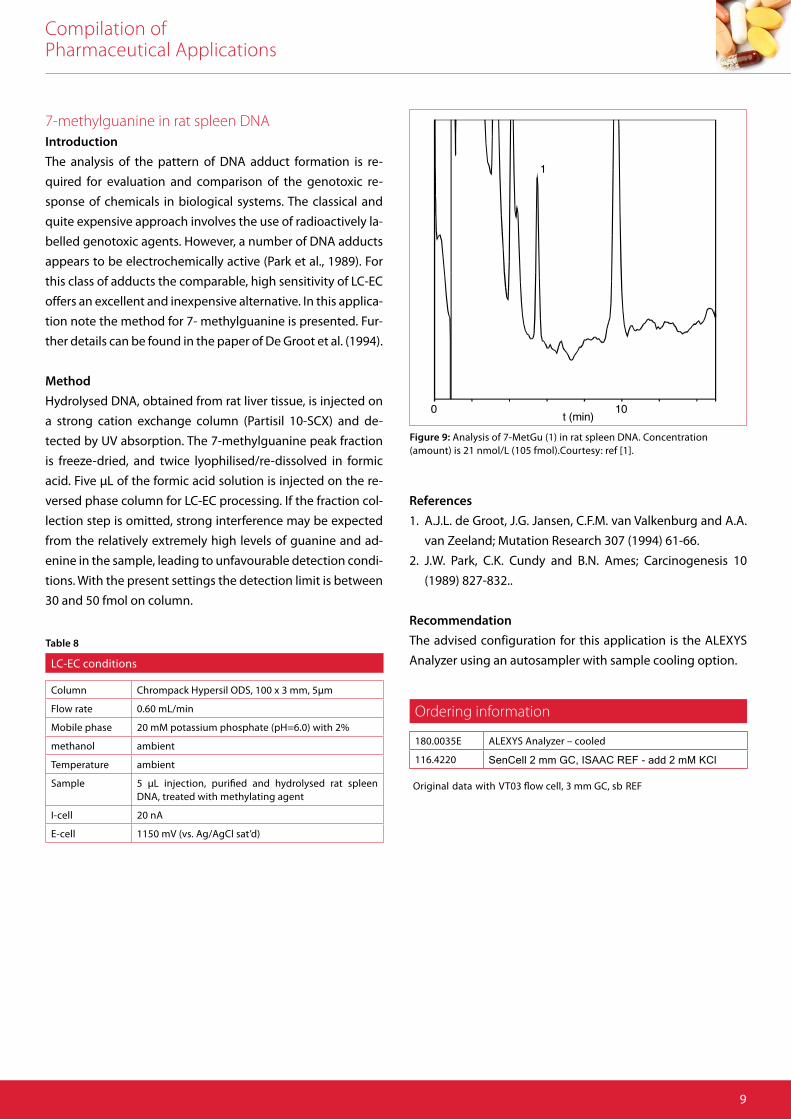
7-methylguanine in rat spleen DNAIntroduction
The analysis of the pattern of DNA adduct formation is re-
quired for evaluation and comparison of the genotoxic re-
sponse of chemicals in biological systems. The classical and
quite expensive approach involves the use of radioactively la-
belled genotoxic agents. However, a number of DNA adducts
appears to be electrochemically active (Park et al., 1989). For
this class of adducts the comparable, high sensitivity of LC-EC
offers an excellent and inexpensive alternative. In this applica-
tion note the method for 7- methylguanine is presented. Fur-
ther details can be found in the paper of De Groot et al. (1994).
Method
Hydrolysed DNA, obtained from rat liver tissue, is injected on
a strong cation exchange column (Partisil 10-SCX) and de-
tected by UV absorption. The 7-methylguanine peak fraction
is freeze-dried, and twice lyophilised/re-dissolved in formic
acid. Five μL of the formic acid solution is injected on the re-
versed phase column for LC-EC processing. If the fraction col-
lection step is omitted, strong interference may be expected
from the relatively extremely high levels of guanine and ad-
enine in the sample, leading to unfavourable detection condi-
tions. With the present settings the detection limit is between
30 and 50 fmol on column.
010t (min)
1
Figure 9: Analysis of 7-MetGu (1) in rat spleen DNA. Concentration(amount) is 21 nmol/L (105 fmol).Courtesy: ref [1].
References
1. A.J.L. de Groot, J.G. Jansen, C.F.M. van Valkenburg and A.A.
van Zeeland; Mutation Research 307 (1994) 61-66.
2. J.W. Park, C.K. Cundy and B.N. Ames; Carcinogenesis 10
(1989) 827-832..
Recommendation
The advised configuration for this application is the ALEXYS
Analyzer using an autosampler with sample cooling option.
Ordering information
180.0035E ALEXYS Analyzer – cooled
116.4220
LC-EC conditions
Column Chrompack Hypersil ODS, 100 x 3 mm, 5μm
Flow rate 0.60 mL/min
Mobile phase 20 mM potassium phosphate (pH=6.0) with 2%
methanol ambient
Temperature ambient
Sample 5 μL injection, purified and hydrolysed rat spleen DNA, treated with methylating agent
I-cell 20 nA
E-cell 1150 mV (vs. Ag/AgCl sat’d)
Table 8
Original data with VT03 flow cell, 3 mm GC, sb REF
SenCell 2 mm GC, ISAAC REF - add 2 mM KCl
Compilation of Pharmaceutical Applications
10
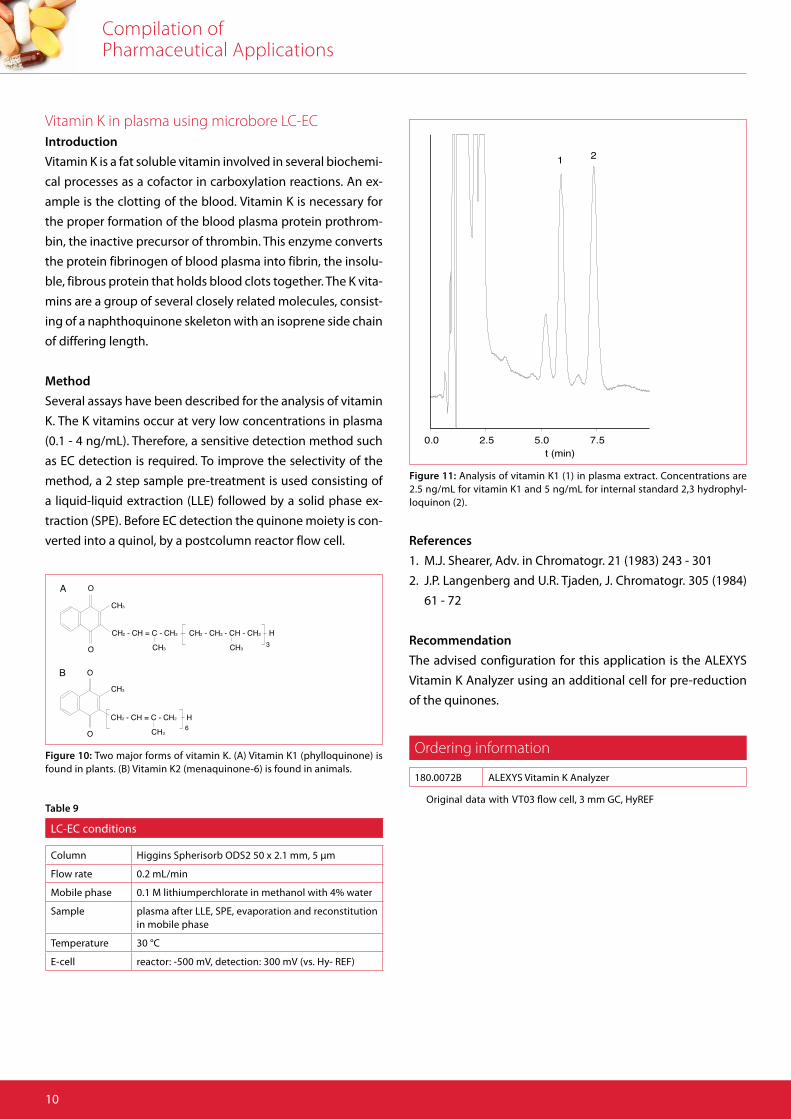
Vitamin K in plasma using microbore LC-ECIntroduction
Vitamin K is a fat soluble vitamin involved in several biochemi-
cal processes as a cofactor in carboxylation reactions. An ex-
ample is the clotting of the blood. Vitamin K is necessary for
the proper formation of the blood plasma protein prothrom-
bin, the inactive precursor of thrombin. This enzyme converts
the protein fibrinogen of blood plasma into fibrin, the insolu-
ble, fibrous protein that holds blood clots together. The K vita-
mins are a group of several closely related molecules, consist-
ing of a naphthoquinone skeleton with an isoprene side chain
of differing length.
Method
Several assays have been described for the analysis of vitamin
K. The K vitamins occur at very low concentrations in plasma
(0.1 - 4 ng/mL). Therefore, a sensitive detection method such
as EC detection is required. To improve the selectivity of the
method, a 2 step sample pre-treatment is used consisting of
a liquid-liquid extraction (LLE) followed by a solid phase ex-
traction (SPE). Before EC detection the quinone moiety is con-
verted into a quinol, by a postcolumn reactor flow cell.
t (min)0.0 2.5 5.0 7.5
1 2
O
O
H
H
CH3
CH3
CH3
CH3
CH3
O
O
CH - CH = C - CH22
CH - CH = C - CH22 CH - CH - CH - CH2 2 2
6
3
B
A
Figure 11: Analysis of vitamin K1 (1) in plasma extract. Concentrations are 2.5 ng/mL for vitamin K1 and 5 ng/mL for internal standard 2,3 hydrophyl-loquinon (2).
Figure 10: Two major forms of vitamin K. (A) Vitamin K1 (phylloquinone) is found in plants. (B) Vitamin K2 (menaquinone-6) is found in animals.
References
1. M.J. Shearer, Adv. in Chromatogr. 21 (1983) 243 - 301
2. J.P. Langenberg and U.R. Tjaden, J. Chromatogr. 305 (1984)
61 - 72
Recommendation
The advised configuration for this application is the ALEXYS
Vitamin K Analyzer using an additional cell for pre-reduction
of the quinones.
Ordering information
180.0072B ALEXYS Vitamin K Analyzer
LC-EC conditions
Column Higgins Spherisorb ODS2 50 x 2.1 mm, 5 μm
Flow rate 0.2 mL/min
Mobile phase 0.1 M lithiumperchlorate in methanol with 4% water
Sample plasma after LLE, SPE, evaporation and reconstitution in mobile phase
Temperature 30 °C
E-cell reactor: -500 mV, detection: 300 mV (vs. Hy- REF)
Table 9Original data with VT03 flow cell, 3 mm GC, HyREF
Compilation of Pharmaceutical Applications
11
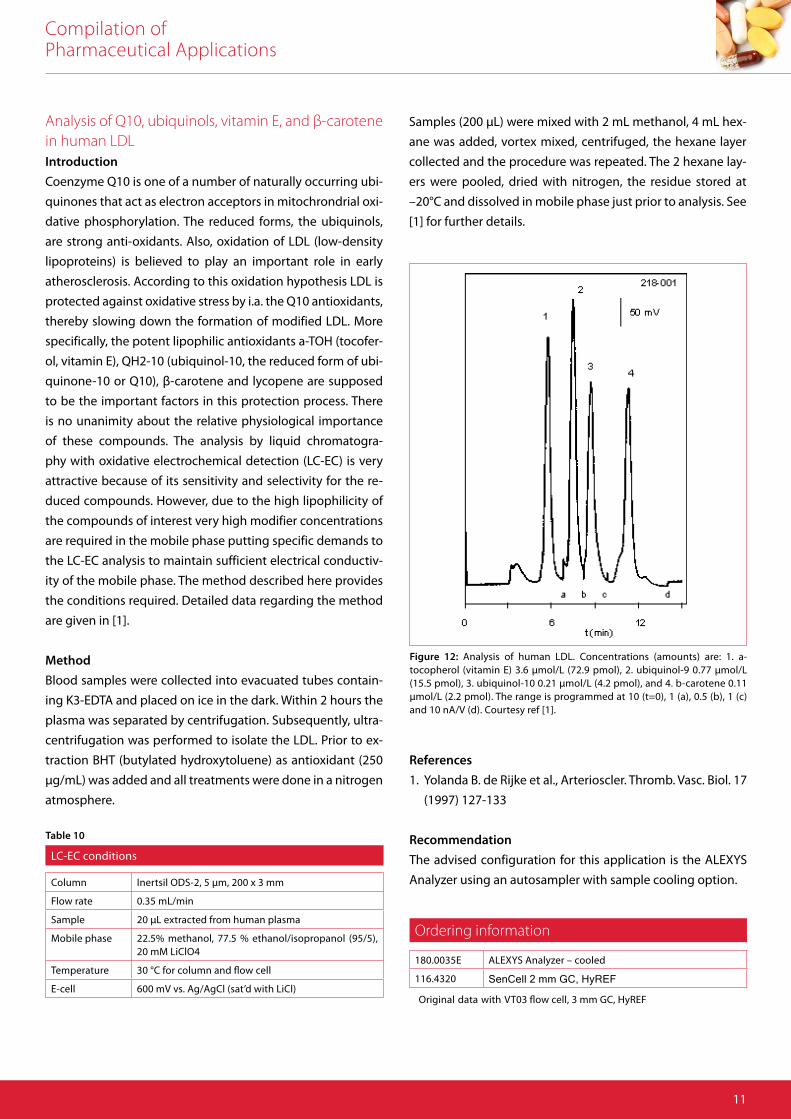
Analysis of Q10, ubiquinols, vitamin E, and β-carotenein human LDLIntroduction
Coenzyme Q10 is one of a number of naturally occurring ubi-
quinones that act as electron acceptors in mitochrondrial oxi-
dative phosphorylation. The reduced forms, the ubiquinols,
are strong anti-oxidants. Also, oxidation of LDL (low-density
lipoproteins) is believed to play an important role in early
atherosclerosis. According to this oxidation hypothesis LDL is
protected against oxidative stress by i.a. the Q10 antioxidants,
thereby slowing down the formation of modified LDL. More
specifically, the potent lipophilic antioxidants a-TOH (tocofer-
ol, vitamin E), QH2-10 (ubiquinol-10, the reduced form of ubi-
quinone-10 or Q10), β-carotene and lycopene are supposed
to be the important factors in this protection process. There
is no unanimity about the relative physiological importance
of these compounds. The analysis by liquid chromatogra-
phy with oxidative electrochemical detection (LC-EC) is very
attractive because of its sensitivity and selectivity for the re-
duced compounds. However, due to the high lipophilicity of
the compounds of interest very high modifier concentrations
are required in the mobile phase putting specific demands to
the LC-EC analysis to maintain sufficient electrical conductiv-
ity of the mobile phase. The method described here provides
the conditions required. Detailed data regarding the method
are given in [1].
Method
Blood samples were collected into evacuated tubes contain-
ing K3-EDTA and placed on ice in the dark. Within 2 hours the
plasma was separated by centrifugation. Subsequently, ultra-
centrifugation was performed to isolate the LDL. Prior to ex-
traction BHT (butylated hydroxytoluene) as antioxidant (250
μg/mL) was added and all treatments were done in a nitrogen
atmosphere.
Figure 12: Analysis of human LDL. Concentrations (amounts) are: 1. a-tocopherol (vitamin E) 3.6 μmol/L (72.9 pmol), 2. ubiquinol-9 0.77 μmol/L (15.5 pmol), 3. ubiquinol-10 0.21 μmol/L (4.2 pmol), and 4. b-carotene 0.11 μmol/L (2.2 pmol). The range is programmed at 10 (t=0), 1 (a), 0.5 (b), 1 (c) and 10 nA/V (d). Courtesy ref [1].
References
1. Yolanda B. de Rijke et al., Arterioscler. Thromb. Vasc. Biol. 17
(1997) 127-133
Recommendation
The advised configuration for this application is the ALEXYS
Analyzer using an autosampler with sample cooling option.
Ordering information
180.0035E ALEXYS Analyzer – cooled
116.4320
LC-EC conditions
Column Inertsil ODS-2, 5 μm, 200 x 3 mm
Flow rate 0.35 mL/min
Sample 20 μL extracted from human plasma
Mobile phase 22.5% methanol, 77.5 % ethanol/isopropanol (95/5), 20 mM LiClO4
Temperature 30 °C for column and flow cell
E-cell 600 mV vs. Ag/AgCl (sat’d with LiCl)
Table 10
Samples (200 μL) were mixed with 2 mL methanol, 4 mL hex-
ane was added, vortex mixed, centrifuged, the hexane layer
collected and the procedure was repeated. The 2 hexane lay-
ers were pooled, dried with nitrogen, the residue stored at
–20°C and dissolved in mobile phase just prior to analysis. See
[1] for further details.
Original data with VT03 flow cell, 3 mm GC, HyREF
SenCell 2 mm GC, HyREF
Compilation of Pharmaceutical Applications
12
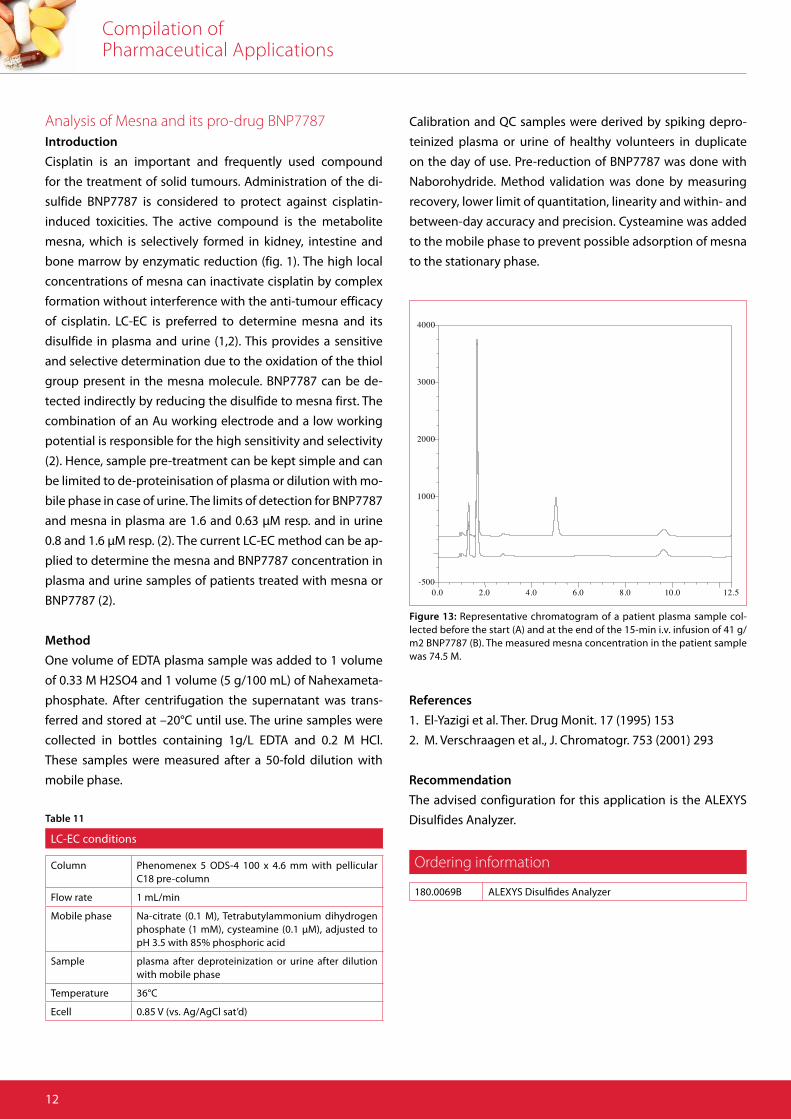
Analysis of Mesna and its pro-drug BNP7787Introduction
Cisplatin is an important and frequently used compound
for the treatment of solid tumours. Administration of the di-
sulfide BNP7787 is considered to protect against cisplatin-
induced toxicities. The active compound is the metabolite
mesna, which is selectively formed in kidney, intestine and
bone marrow by enzymatic reduction (fig. 1). The high local
concentrations of mesna can inactivate cisplatin by complex
formation without interference with the anti-tumour efficacy
of cisplatin. LC-EC is preferred to determine mesna and its
disulfide in plasma and urine (1,2). This provides a sensitive
and selective determination due to the oxidation of the thiol
group present in the mesna molecule. BNP7787 can be de-
tected indirectly by reducing the disulfide to mesna first. The
combination of an Au working electrode and a low working
potential is responsible for the high sensitivity and selectivity
(2). Hence, sample pre-treatment can be kept simple and can
be limited to de-proteinisation of plasma or dilution with mo-
bile phase in case of urine. The limits of detection for BNP7787
and mesna in plasma are 1.6 and 0.63 μM resp. and in urine
0.8 and 1.6 μM resp. (2). The current LC-EC method can be ap-
plied to determine the mesna and BNP7787 concentration in
plasma and urine samples of patients treated with mesna or
BNP7787 (2).
Method
One volume of EDTA plasma sample was added to 1 volume
of 0.33 M H2SO4 and 1 volume (5 g/100 mL) of Nahexameta-
phosphate. After centrifugation the supernatant was trans-
ferred and stored at –20°C until use. The urine samples were
collected in bottles containing 1g/L EDTA and 0.2 M HCl.
These samples were measured after a 50-fold dilution with
mobile phase.
-500
1000
2000
3000
4000
0.0 2.0 4.0 6.0 8.0 10.0 12.5
Figure 13: Representative chromatogram of a patient plasma sample col-lected before the start (A) and at the end of the 15-min i.v. infusion of 41 g/m2 BNP7787 (B). The measured mesna concentration in the patient sample was 74.5 M.
References
1. El-Yazigi et al. Ther. Drug Monit. 17 (1995) 153
2. M. Verschraagen et al., J. Chromatogr. 753 (2001) 293
Recommendation
The advised configuration for this application is the ALEXYS
Disulfides Analyzer.
Ordering information
180.0069B ALEXYS Disulfides Analyzer
LC-EC conditions
Column Phenomenex 5 ODS-4 100 x 4.6 mm with pellicular C18 pre-column
Flow rate 1 mL/min
Mobile phase Na-citrate (0.1 M), Tetrabutylammonium dihydrogen phosphate (1 mM), cysteamine (0.1 μM), adjusted to pH 3.5 with 85% phosphoric acid
Sample plasma after deproteinization or urine after dilution with mobile phase
Temperature 36°C
Ecell 0.85 V (vs. Ag/AgCl sat’d)
Table 11
Calibration and QC samples were derived by spiking depro-
teinized plasma or urine of healthy volunteers in duplicate
on the day of use. Pre-reduction of BNP7787 was done with
Naborohydride. Method validation was done by measuring
recovery, lower limit of quantitation, linearity and within- and
between-day accuracy and precision. Cysteamine was added
to the mobile phase to prevent possible adsorption of mesna
to the stationary phase.
Compilation of Pharmaceutical Applications
13
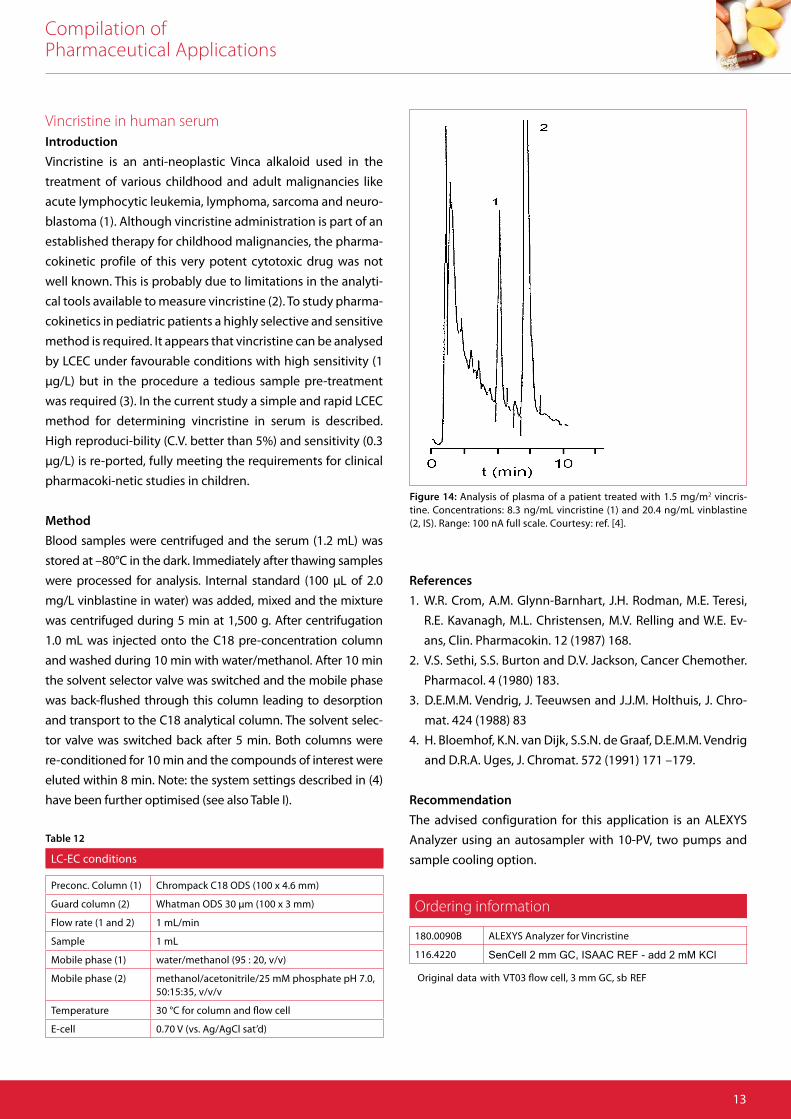
Vincristine in human serumIntroduction
Vincristine is an anti-neoplastic Vinca alkaloid used in the
treatment of various childhood and adult malignancies like
acute lymphocytic leukemia, lymphoma, sarcoma and neuro-
blastoma (1). Although vincristine administration is part of an
established therapy for childhood malignancies, the pharma-
cokinetic profile of this very potent cytotoxic drug was not
well known. This is probably due to limitations in the analyti-
cal tools available to measure vincristine (2). To study pharma-
cokinetics in pediatric patients a highly selective and sensitive
method is required. It appears that vincristine can be analysed
by LCEC under favourable conditions with high sensitivity (1
μg/L) but in the procedure a tedious sample pre-treatment
was required (3). In the current study a simple and rapid LCEC
method for determining vincristine in serum is described.
High reproduci-bility (C.V. better than 5%) and sensitivity (0.3
μg/L) is re-ported, fully meeting the requirements for clinical
pharmacoki-netic studies in children.
Method
Blood samples were centrifuged and the serum (1.2 mL) was
stored at –80°C in the dark. Immediately after thawing samples
were processed for analysis. Internal standard (100 μL of 2.0
mg/L vinblastine in water) was added, mixed and the mixture
was centrifuged during 5 min at 1,500 g. After centrifugation
1.0 mL was injected onto the C18 pre-concentration column
and washed during 10 min with water/methanol. After 10 min
the solvent selector valve was switched and the mobile phase
was back-flushed through this column leading to desorption
and transport to the C18 analytical column. The solvent selec-
tor valve was switched back after 5 min. Both columns were
re-conditioned for 10 min and the compounds of interest were
eluted within 8 min. Note: the system settings described in (4)
have been further optimised (see also Table I).
itacilppA lacituecamrah ons
Figure 14: Analysis of plasma of a patient treated with 1.5 mg/m2 vincris-tine. Concentrations: 8.3 ng/mL vincristine (1) and 20.4 ng/mL vinblastine (2, IS). Range: 100 nA full scale. Courtesy: ref. [4].
References
1. W.R. Crom, A.M. Glynn-Barnhart, J.H. Rodman, M.E. Teresi,
R.E. Kavanagh, M.L. Christensen, M.V. Relling and W.E. Ev-
ans, Clin. Pharmacokin. 12 (1987) 168.
2. V.S. Sethi, S.S. Burton and D.V. Jackson, Cancer Chemother.
Pharmacol. 4 (1980) 183.
3. D.E.M.M. Vendrig, J. Teeuwsen and J.J.M. Holthuis, J. Chro-
mat. 424 (1988) 83
4. H. Bloemhof, K.N. van Dijk, S.S.N. de Graaf, D.E.M.M. Vendrig
and D.R.A. Uges, J. Chromat. 572 (1991) 171 –179.
Recommendation
The advised configuration for this application is an ALEXYS
Analyzer using an autosampler with 10-PV, two pumps and
sample cooling option.
Ordering information
180.0090B ALEXYS Analyzer for Vincristine
116.4220
LC-EC conditions
Preconc. Column (1) Chrompack C18 ODS (100 x 4.6 mm)
Guard column (2) Whatman ODS 30 μm (100 x 3 mm)
Flow rate (1 and 2) 1 mL/min
Sample 1 mL
Mobile phase (1) water/methanol (95 : 20, v/v)
Mobile phase (2) methanol/acetonitrile/25 mM phosphate pH 7.0, 50:15:35, v/v/v
Temperature 30 °C for column and flow cell
E-cell 0.70 V (vs. Ag/AgCl sat’d)
Table 12
Original data with VT03 flow cell, 3 mm GC, sb REF
SenCell 2 mm GC, ISAAC REF - add 2 mM KCl
1414
Antec Scientific (USA) [email protected] www.AntecScientific.com T 888 572 0012
Antec Scientific (worldwide) [email protected] T +31 71 5813333
For research purpose only. The information shown in this communica-tion is solely to demonstrate the applicability of the ALEXYS system. The actual performance may be affected by factors beyond Antec’s control. Specifications mentioned in this application note are subject to change without further notice.
Compilation of Pharmaceutical Applications