compilation of radiochemical analyses of spent nuclear fuel … · 2007-07-10 · compilation of...
TRANSCRIPT
PNNL-13677
Compilation of Radiochemical Analyses of Spent Nuclear Fuel Samples M. C. Grady-Raap R. J. Talbert September 2001 Prepared for the U.S. Department of Energy under Contract DE-AC06-76RL01830
DISCLAIMER
This report was prepared as an account of work sponsored by an agency of the United States Government. Neither the United States Government nor any agency thereof, nor Battelle Memorial Institute, nor any of their employees, makes any warranty, express or implied, or assumes any legal liability or responsibility for the accuracy, completeness, or usefulness of any information, apparatus, product, or process disclosed, or represents that its use would not infringe privately owned rights. Reference herein to any specific commercial product, process, or service by trade name, trademark, manufacturer, or otherwise does not necessarily constitute or imply its endorsement, recommendation, or favoring by the United States Government or any agency thereof, or Battelle Memorial Institute. The views and opinions of authors expressed herein do not necessarily state or reflect those of the United States Government or any agency thereof.
PACIFIC NORTHWEST NATIONAL LABORATORY operated by BATTELLE
for the UNITED STATES DEPARTMENT OF ENERGY
under Contract DE-ACO6-76RL0183O
Printed in the United States of America
Available to DOE and DOE contractors from the Office of Scientific and Technical Information,
P.O. Box 62, Oak Ridge, TN 37831-0062; ph: (865) 576-8401 fax: (865) 576-5728
email: [email protected]
Available to the public from the National Technical Information Service, U.S. Department of Commerce, 5285 Port Royal Rd., Springfield, VA 22161
ph: (800) 553-6847 fax: (703) 605-6900
email: [email protected] online ordering: http://www.ntis.gov/ordering.htm
This document was printed on recycled paper. (8/00)

PNNL-13677
Compilation of Radiochemical Analyses of Spent Nuclear Fuel Samples M. C. Brady-Raap, Chief Engineer R. J. Talbert, Chief Engineer September 2001 Prepared for the U.S. Department of Energy under Contract DE-AC06-76RLO 1830 Pacific Northwest National Laboratory Richland, Washington 99352

Summary The objective of this report is to compile, in a single reference, several radiochemical analyses performed by the V.G. Khlopin Radium Institute, St. Petersburg, Russia. These analyses were performed for the Pacific Northwest National Laboratory. Four samples of spent nuclear fuel were analyzed for certain rare earths (Neodymium, Samarium, Europium, and Gadolinium) and one sample was analyzed for Rhodium. This work was conducted from 1993 to 1995 for the Department of Energy (DOE) Burnup Credit Program. To maximize the value of the Khlopin reports, no attempt has been made to “clean up” the English, nor has there been any attempt to alter data. The reports were reproduced, basically verbatim. Fuel exposure for each sample was extracted from old program records and added to the report. Two tables containing earlier chemical analyses on each sample were added as an appendix. The individuals who performed the analyses were A. A. Rimski-Korsakov, A. V. Stephanov, T. P. Makarova, V. M. Alexandruk, B. N. Beljaev, V. D. Domkin, and A. V. Lovtsus. All are from the V. G. Khlopin Radium Institute. Preparation of this report was requested by the Oakridge National Laboratory to support burnup credit efforts.
iii
Contents Summary ............................................................................................................................................ iii 1.0 Analysis of Samples 87-63 and 87-72 ........................................................................................ 1.1 1.1 Background on Work Performed on Samples 87-63 and 87-72 .......................................... 1.1 1.2 Initial Sample Evaluation and Preparation........................................................................... 1.1 1.3 Analytical Methods Applied – Short Description................................................................ 1.1 1.3.1 Standards Used in the Analysis.................................................................................. 1.1 1.3.2 Radiochemical Analysis............................................................................................. 1.2 1.4 Analytical Results ................................................................................................................ 1.4 2.0 Analysis of Samples 87-81 ......................................................................................................... 2.1 2.1 Background on Work Performed on Samples 87-81 ........................................................... 2.1 2.2 Initial Sample Evaluation and Preparation........................................................................... 2.1 2.3 Analytical Methods Applied - Short Description ................................................................ 2.2 2.3.1 SIMS Analysis Procedure and Corrections................................................................ 2.2 2.3.2 Laser Luminescence Determination of Sm and Eu.................................................... 2.2 2.3.3 Radiochemical Separation/Mass-Spectrometry Procedure ........................................ 2.3 2.4 Standards Used in the Analysis............................................................................................ 2.3 2.5 Analytical Results ................................................................................................................ 2.4 3.0 Rare Earths Analysis of Sample 87-108 ..................................................................................... 3.1 3.1 Background on Work Performed on Samples 87-108 ......................................................... 3.1 3.2 Initial Sample Evaluation and Preparation........................................................................... 3.1 3.3 Analytical Methods Applied – Short Description................................................................ 3.1
v
3.3.1 Standards Used in the Analysis.................................................................................. 3.1 3.3.2 Radiochemical Analysis............................................................................................. 3.2 3.3.3 Determination of Isotopic Composition..................................................................... 3.2 3.3.4 Laser Luminescence Determination of Sm and Eu.................................................... 3.3 3.3.5 Determination of Nd and Gd by Isotope Dilution...................................................... 3.4 3.4 Analytical Results ................................................................................................................ 3.5 4.0 Rhodium Analysis of Sample 87-108 ......................................................................................... 4.1 4.1 Background on Rhodium Analysis Performed on Sample 87-108 ...................................... 4.1 4.2 Experimental Method .......................................................................................................... 4.2 4.2.1 Dissolution of the sample........................................................................................... 4.2 4.2.2 Method of Inductively Coupled Plasma Mass Spectrometry..................................... 4.3 4.2.3 x-Ray Fluorescent Analysis (xRFA).......................................................................... 4.3 4.2.4 Preparation of Reference Solutions Indium and Rhodium ........................................ 4.5 4.3 Results of analysis of the sample 87-108............................................................................. 4.5 4.3.1 ICPMS ....................................................................................................................... 4.5 4.3.2 xRFA.......................................................................................................................... 4.7 4.4 Conclusions.......................................................................................................................... 4.7 4.5 Supporting Literature for Section 4 ..................................................................................... 4.8 5.0 References................................................................................................................................... 5.1 Appendix A - Additional Analyses Previously Performed ................................................................ A.1
vi
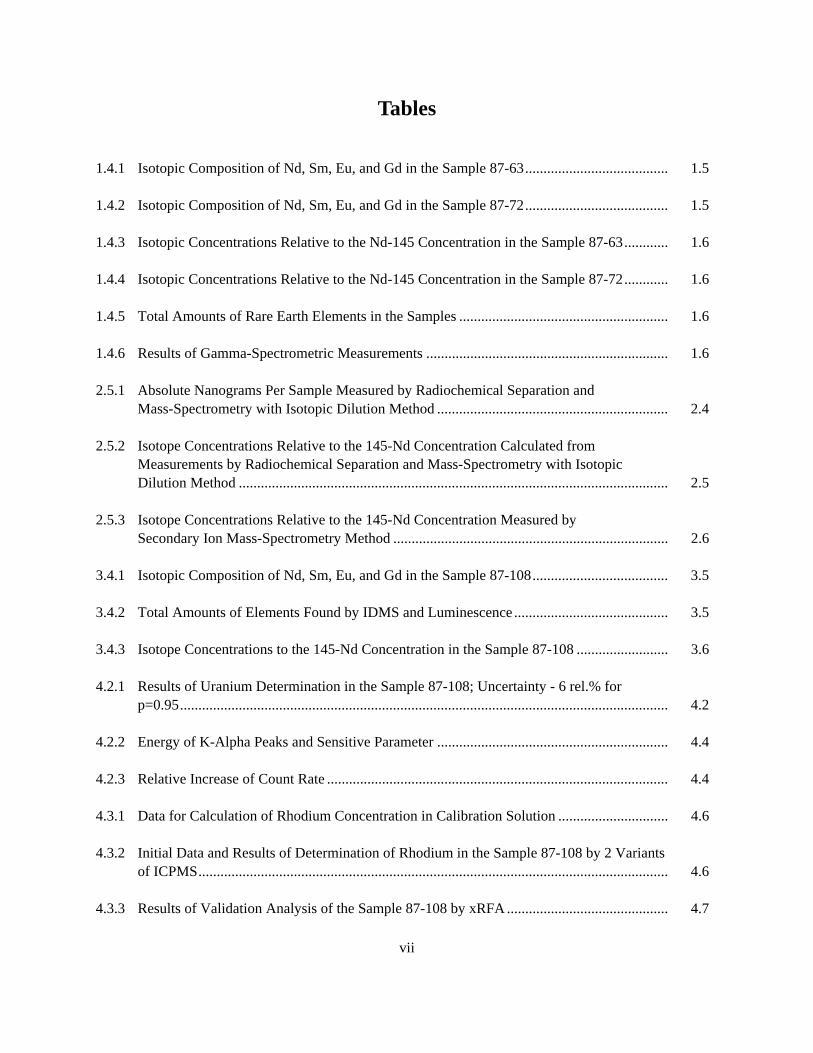
Tables 1.4.1 Isotopic Composition of Nd, Sm, Eu, and Gd in the Sample 87-63....................................... 1.5 1.4.2 Isotopic Composition of Nd, Sm, Eu, and Gd in the Sample 87-72....................................... 1.5 1.4.3 Isotopic Concentrations Relative to the Nd-145 Concentration in the Sample 87-63............ 1.6 1.4.4 Isotopic Concentrations Relative to the Nd-145 Concentration in the Sample 87-72............ 1.6 1.4.5 Total Amounts of Rare Earth Elements in the Samples ......................................................... 1.6 1.4.6 Results of Gamma-Spectrometric Measurements .................................................................. 1.6 2.5.1 Absolute Nanograms Per Sample Measured by Radiochemical Separation and Mass-Spectrometry with Isotopic Dilution Method ............................................................... 2.4 2.5.2 Isotope Concentrations Relative to the 145-Nd Concentration Calculated from Measurements by Radiochemical Separation and Mass-Spectrometry with Isotopic Dilution Method ..................................................................................................................... 2.5 2.5.3 Isotope Concentrations Relative to the 145-Nd Concentration Measured by Secondary Ion Mass-Spectrometry Method ........................................................................... 2.6 3.4.1 Isotopic Composition of Nd, Sm, Eu, and Gd in the Sample 87-108..................................... 3.5 3.4.2 Total Amounts of Elements Found by IDMS and Luminescence .......................................... 3.5 3.4.3 Isotope Concentrations to the 145-Nd Concentration in the Sample 87-108 ......................... 3.6 4.2.1 Results of Uranium Determination in the Sample 87-108; Uncertainty - 6 rel.% for p=0.95..................................................................................................................................... 4.2 4.2.2 Energy of K-Alpha Peaks and Sensitive Parameter ............................................................... 4.4 4.2.3 Relative Increase of Count Rate ............................................................................................. 4.4 4.3.1 Data for Calculation of Rhodium Concentration in Calibration Solution .............................. 4.6 4.3.2 Initial Data and Results of Determination of Rhodium in the Sample 87-108 by 2 Variants of ICPMS................................................................................................................................ 4.6 4.3.3 Results of Validation Analysis of the Sample 87-108 by xRFA ............................................ 4.7
vii

1.0 Analysis of Samples 87-63 and 87-72 1.1 Background on Work Performed on Samples 87-63 and 87-72 Samples 87-63 and 87-72 were partitioned from archived samples from ATM-104, Rod MKP-109. Section 104-MKP-109-P supplied the material for Sample 87-63 and had a burnup of 44.34 Mwd/KgU. Section 104-MKP-109-CC supplied the material for Sample 87-72 and had a burnup of 37.12 Mwd/KgU. Information on both the fuel rod, its irradiation history in a reactor, and information regarding the specific samples can be obtained in Reference 1. The samples were sent to the Khlopin Radium Institute in St. Petersburg, Russia for the analysis of abundances of several nuclides: Sm – 147, 149, 151, 152 Gd – 155 Eu – 155 Nd – 143, 145 Concentrations were to be measured as the amount of nuclide relative to Nd-145. 1.2 Initial Sample Evaluation and Preparation The samples were sent in the form of dry residues, in the bottom of glass vials, packed in lead containers and in a shipping drum. This package was transported by air freight to St. Petersburg and received in the Institute undamaged and sealed. The HPGe gamma-spectrometer was used to measure the activities in the sample. The only two nuclides detected were europium-154 and europium-155. Procedure used complied with OST 95 10234-86 (1987) Two different methods were chosen for the analysis of the samples: laser induced fluorimetry for direct determination of total Eu and Sm content in the sample and conventional isotope dilution mass spec-trometry (IDMS) with preliminary radiochemical isolation of pure Nd, Sm, Eu, and Gd for determination of isotope abundances of those elements and total amounts of Nd and Gd. 1.3 Analytical Methods Applied – Short Description 1.3.1 Standards Used in the Analysis The calibration of laser fluorimeter and IDMS were made with use of working reference solutions pre-pared from pure oxides of Nd, Sm, Eu, and Gd in accordance with Russian standard GOST 23862.0-79. According to information obtained from producer, all four oxides were of 99.97, 99.75, 99.94, and 9.9996% purity respectively. After calcinations until the constant weight was achieved, all oxides were dissolved in nitric acid and final solutions were weighed. Those stock solutions were prepared in 1993 and since that time the careful checking of their gross weight was carried out. This procedure enabled
1.1

Khlopin to correct the concentration of the stock solutions during the storage period. The concentration of the elements in the stock solutions and in the diluted solutions prepared from them was as follows (on December 1994):
In stock solution, mg/g
In diluted solution, ug/g
Nd 9.0171 49.09 Sm 5.200 11.09 Eu 8.067 4.44 Gd 4.959 192.9
The content of main isotopes in isotopic tracers Nd-142 and Gd-156 was 95.7 and 95.5 wt%, respectively. Their concentrations in spike solutions determined by means of isotope dilution mass spectrometry with use of working reference solutions of Nd and Gd of natural isotopic composition as tracers were as follows (on January 1995): Nd-142 – 7.92+-0.08 ug/g; Gd-156 – 4.03+-0.04 ug/g. 1.3.2 Radiochemical Analysis
1.3.2.1 Dissolution of the Samples The dried samples were dissolved in concentrated nitric acid, then evaporated to dryness and dissolved in 0.1 M nitric acid. The procedure of dissolution was carried out directly in the vials sent to the Radium Institute. Weights of the vials and solutions were the following:
Sample 87-63 87-72 Vials as received 18.74985 g 18.7096 g Vials with solution in 0.1 M nitric acid 21.84385 g 21.7721 g Solutions for analysis 3.09400 g 3.0625 g
1.3.2.2 Aliquoting of the Solutions
Solutions of the samples were aliquoted as follows:
Sample 87-63 87-72 For luminescence analysis 0.27425 g 0.25720 g For isotopic analysis 0.93805 g 1.3600 g For IDMS 0.98054 g 0.62538 g
1.3.2.3 Determination of Isotopic Composition
Analysis consisted of two stages. The first stage was the isolation of the pure rare earth elements by paper electrophoresis. For this an aliquots of each sample solution were dried. After dissolution in 0.001 M EDTA having pH = 1.7 the solution was applied on the strip of Whatman-31 paper and separated into pure fractions of individual elements (for subsequent mass-spectrometric investigation). Conditions
1.2
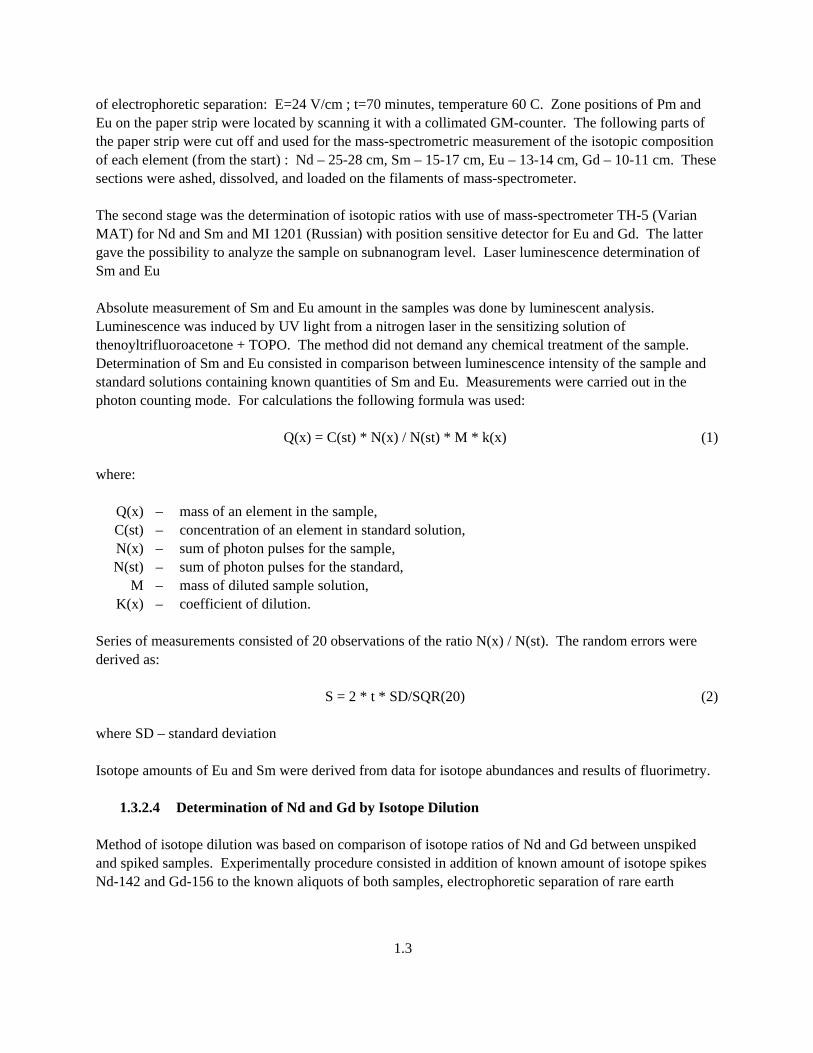
of electrophoretic separation: E=24 V/cm ; t=70 minutes, temperature 60 C. Zone positions of Pm and Eu on the paper strip were located by scanning it with a collimated GM-counter. The following parts of the paper strip were cut off and used for the mass-spectrometric measurement of the isotopic composition of each element (from the start) : Nd – 25-28 cm, Sm – 15-17 cm, Eu – 13-14 cm, Gd – 10-11 cm. These sections were ashed, dissolved, and loaded on the filaments of mass-spectrometer. The second stage was the determination of isotopic ratios with use of mass-spectrometer TH-5 (Varian MAT) for Nd and Sm and MI 1201 (Russian) with position sensitive detector for Eu and Gd. The latter gave the possibility to analyze the sample on subnanogram level. Laser luminescence determination of Sm and Eu Absolute measurement of Sm and Eu amount in the samples was done by luminescent analysis. Luminescence was induced by UV light from a nitrogen laser in the sensitizing solution of thenoyltrifluoroacetone + TOPO. The method did not demand any chemical treatment of the sample. Determination of Sm and Eu consisted in comparison between luminescence intensity of the sample and standard solutions containing known quantities of Sm and Eu. Measurements were carried out in the photon counting mode. For calculations the following formula was used: Q(x) = C(st) * N(x) / N(st) * M * k(x) (1) where: Q(x) – mass of an element in the sample, C(st) – concentration of an element in standard solution, N(x) – sum of photon pulses for the sample, N(st) – sum of photon pulses for the standard, M – mass of diluted sample solution, K(x) – coefficient of dilution. Series of measurements consisted of 20 observations of the ratio N(x) / N(st). The random errors were derived as: S = 2 * t * SD/SQR(20) (2) where SD – standard deviation Isotope amounts of Eu and Sm were derived from data for isotope abundances and results of fluorimetry.
1.3.2.4 Determination of Nd and Gd by Isotope Dilution Method of isotope dilution was based on comparison of isotope ratios of Nd and Gd between unspiked and spiked samples. Experimentally procedure consisted in addition of known amount of isotope spikes Nd-142 and Gd-156 to the known aliquots of both samples, electrophoretic separation of rare earth
1.3
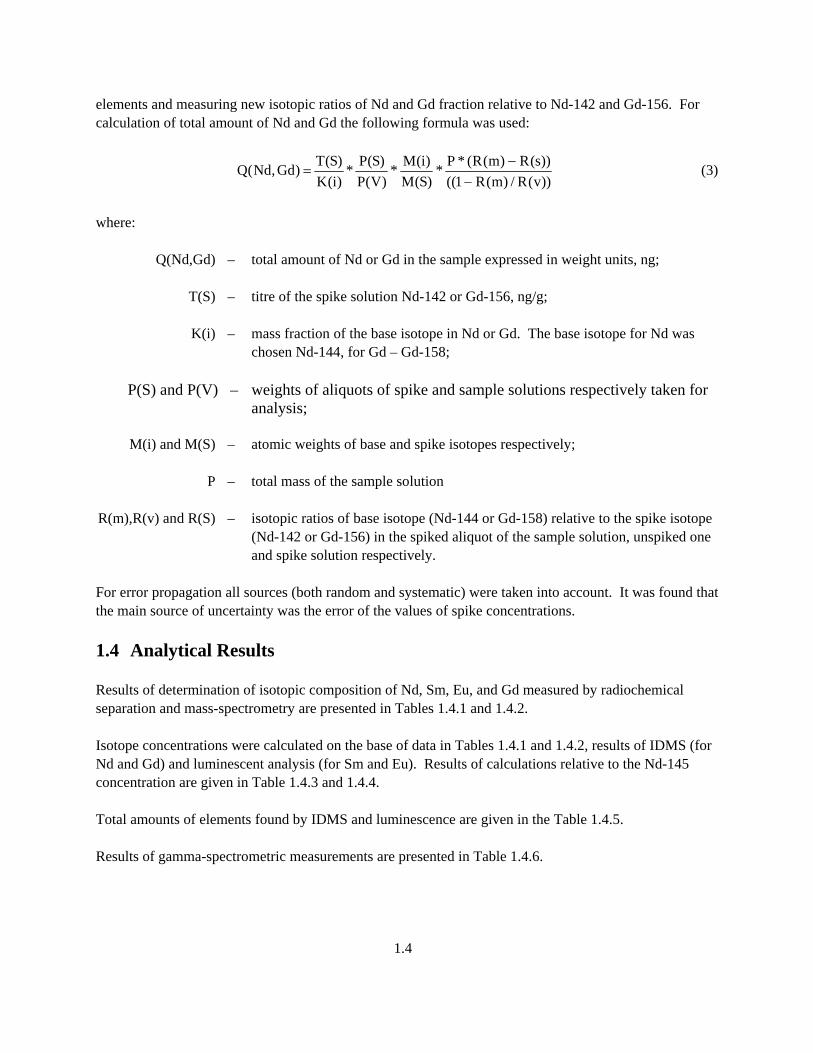
elements and measuring new isotopic ratios of Nd and Gd fraction relative to Nd-142 and Gd-156. For calculation of total amount of Nd and Gd the following formula was used:
))v(R/)m(R1(())s(R)m(R(*P*
)S(M)i(M*
)V(P)S(P*
)i(K)S(T)Gd,Nd(Q
−−
= (3)
where: Q(Nd,Gd) – total amount of Nd or Gd in the sample expressed in weight units, ng; T(S) – titre of the spike solution Nd-142 or Gd-156, ng/g; K(i) – mass fraction of the base isotope in Nd or Gd. The base isotope for Nd was
chosen Nd-144, for Gd – Gd-158; P(S) and P(V) – weights of aliquots of spike and sample solutions respectively taken for
analysis; M(i) and M(S) – atomic weights of base and spike isotopes respectively; P – total mass of the sample solution R(m),R(v) and R(S) – isotopic ratios of base isotope (Nd-144 or Gd-158) relative to the spike isotope
(Nd-142 or Gd-156) in the spiked aliquot of the sample solution, unspiked one and spike solution respectively.
For error propagation all sources (both random and systematic) were taken into account. It was found that the main source of uncertainty was the error of the values of spike concentrations. 1.4 Analytical Results Results of determination of isotopic composition of Nd, Sm, Eu, and Gd measured by radiochemical separation and mass-spectrometry are presented in Tables 1.4.1 and 1.4.2. Isotope concentrations were calculated on the base of data in Tables 1.4.1 and 1.4.2, results of IDMS (for Nd and Gd) and luminescent analysis (for Sm and Eu). Results of calculations relative to the Nd-145 concentration are given in Table 1.4.3 and 1.4.4. Total amounts of elements found by IDMS and luminescence are given in the Table 1.4.5. Results of gamma-spectrometric measurements are presented in Table 1.4.6.
1.4
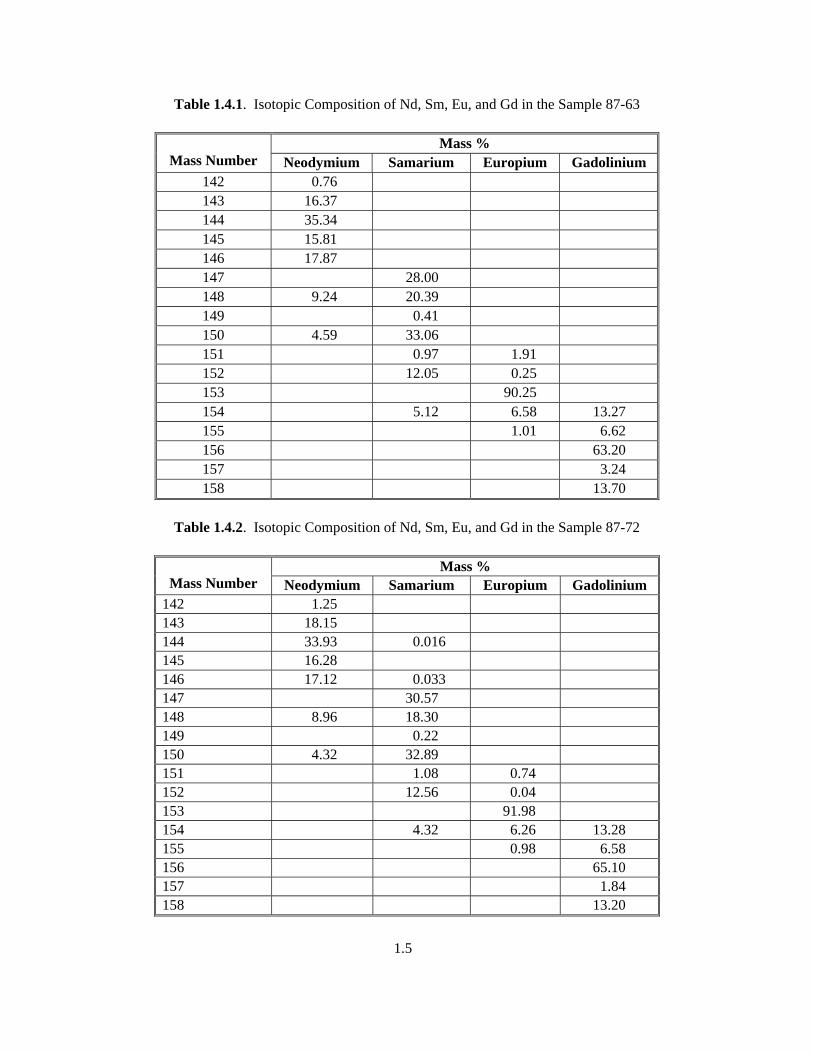
Table 1.4.1. Isotopic Composition of Nd, Sm, Eu, and Gd in the Sample 87-63
Mass % Mass Number Neodymium Samarium Europium Gadolinium
142 0.76 143 16.37 144 35.34 145 15.81 146 17.87 147 28.00 148 9.24 20.39 149 0.41 150 4.59 33.06 151 0.97 1.91 152 12.05 0.25 153 90.25 154 5.12 6.58 13.27 155 1.01 6.62 156 63.20 157 3.24 158 13.70
Table 1.4.2. Isotopic Composition of Nd, Sm, Eu, and Gd in the Sample 87-72
Mass %
Mass Number Neodymium Samarium Europium Gadolinium 142 1.25 143 18.15 144 33.93 0.016 145 16.28 146 17.12 0.033 147 30.57 148 8.96 18.30 149 0.22 150 4.32 32.89 151 1.08 0.74 152 12.56 0.04 153 91.98 154 4.32 6.26 13.28 155 0.98 6.58 156 65.10 157 1.84 158 13.20
1.5

Table 1.4.3. Isotope Concentrations Relative to the Nd-145 Concentration in the Sample 87-63
Mass % Mass Number Neodymium Samarium Europium Gadolinium
143 1.04+-0.02 145 1.00 147 0.365+-0.012 149 0.0054+-0.0004 150 0.431+-0.014 151 0.0127+-0.0006 152 0.157+-0.006 155 0.00215+-0.00006 0.0118+-0.0004
Table 1.4.4. Isotope Concentrations Relative to the Nd-145 Concentration in the Sample 87-72
Mass %
Mass Number Neodymium Samarium Europium Gadolinium 143 1.12+-0.01 145 1.00 147 0.365+-0.009 149 0.0025+-0.0003 150 0.391+-0.009 151 0.0127+-0.0004 152 0.148+-0.004 155 0.00187+-0.00005 0.0100+-0.0003
Table 1.4.5. Total Amounts of Rare Earth Elements in the Samples
Total Amount of Element, Microgram Per Sample
Element 87-63 87-72 Nd 31.50 +- 0.32 38.8 +- 0.4 Sm 6.5 +- 0.2 7.51 +- 0.15 Eu 1.054 +- 0.021 1.196 +- 0.025 Gd 0.89 +- 0.03 0.96 +- 0.03
Table 1.4.6. Results of Gamma-Spectrometric Measurements
Sample Nuclide Activity kBq Mass Per Sample, Nanogram Mass Ratio to Nd-145
87-63 Eu-154 Eu-155
0.596+-0.033 0.181+-0.011
59.2 +- 3.3 10.4 +- 0.6
0.0119 +- 0.0007 0.00209 +- 0.00012
87-72 Eu-154 Eu-155
0.729+-0.037 0.200+-0.011
74.0 +- 3.8 11.5 +- 0.6
0.0117 +- 0.0006 0.00182 +- 0.00009
1.6

Comparison between data of Tables 1.4.3, 1.4.4 and 1.4.6 show a rather good compliance of the results for europium-155.
1.7

2.0 Analysis of Samples 87-81 2.1 Background on Work Performed on Samples 87-81 Sample 87-81 was partitioned from an archived sample from ATM-104, Rod MKP-109, Section LL. This section was measured to have a burnup of 27.35 GWd/MTU. Information on both the fuel rod, its irradiation history in a reactor, and information regarding the specific sample can be obtained in Reference 1. This sample was sent to the Khlopin Radium Institute for the analysis of abundances of several nuclides:
Sm – 147, 149, 150, 151, 152 Gd - 155 Eu – 155 Nd – 143, 145
Concentrations were to be measured either in grains of nuclide per sample or as the amount of nuclide relative to Nd-145. 2.2 Initial Sample Evaluation and Preparation The sample was in the form of several milligrams of dry residue in a glass vial, packed in lead container and in the shipping drum. This package has been transported by air freight to St. Petersburg and received from customs in May 1993 - undamaged and sealed. The HPGe gamma-spectrometer was used to measure the activities in the sample. The only two nuclides detected were 154-Eu and 155-Eu:
154-Eu 840 +/- 100 KBq i.e., 80 +/- 10 ng 155-Eu 230 +/- 30 KBq i.e.,13 +/- 2 ng
Procedure used complied with the OST 95 10234-86(1.11.1987) Standard - and the sample had not to be removed from the original vial. This measurement was made only to evaluate the expected amounts of the fission products (both radioactive and stable) present in the sample and will be compared later with amounts detected by mass-spectrometry. Three different methods were chosen for the analysis of the sample: the secondary ion mass-spectrometry (SIMS) for panoramic investigations of isotopic ratios of rare earths, laser induced fluorimetry for direct determination of total Eu and Sm content in the sample and conventional isotope dilution mass spec-trometry with preliminary radiochemical isolation of pure Nd, Sm, Eu, and Gd for precise determination of isotope abundances of those elements and total amounts of Nd and Gd.
2.1

Two of these methods (SIMS and fluorimetry) can use the microgram quantity of material, while the latter needed as much of the sample material as possible. For the first method (SIMS) a small (about 1/1000) aliquot was taken from the sample. This was done by touching the inner wall of the sample vial with the end of a clean platinum wire slightly wetted with 0.1 M nitric acid and letting it dry. Repeated gamma-spectrometry measurement has shown that about 600 Bq of 154-Eu was present on the platinum wire, and consequently less than 1/1000 of the original sample material has been removed. That platinum wire was used in the SIMS analysis as described below, and the rest of the Sample went to the radiochemical analysis. Since all errors in absolute isotope concentrations in the sample weights are not less than several %, we did not correct the results for this (negligibly small) part of the sample we removed. 2.3 Analytical Methods Applied - Short Description 2.3.1 SIMS Analysis Procedure and Corrections Secondary Ion Mass Spectrometry (SIMS) has been performed with a very small portion of the sample (after conventional radiochemical determination the whole REE content of sample was found to be about 40 milligrams and the SIMS part of the sample was determined to have about 30 nanograms, derived as shown in Section 2.2). The platinum wire with small part of the original sample on its surface has been exposed to the 10 nA beam of negative 16-0 ions in IMS 4f Ion Microprobe (CAMECA) mass-spectrometer. In order to reduce the molecular ion interference the energy-filtering technique has been applied using sample HV offset (-100 V) and Small energy slit (10 eV). Nevertheless the difference in the evaporation efficiency for different elements (Nd, Sm, Eu, and Gd) had to be corrected for using the standard sample with known concentrations of the same elements. This standard had been prepared from natural isotope mixtures of these elements and certified by the State Institute “Mekhanobr” in St. Petersburg (see Section 2.4, below). Correction factors (i.e. ratios of true element concentration to one derived from the mass-spectrum) found this way were:
C(Nd) = 1. ; C(Sm) = 0.91; C(Eu) = 0. 88; C (Gd) = 0.94 2.3.2 Laser Luminescence Determination of Sm and Eu The total mass-spectrum received from IMS 4f spectrometer gave mass abundances for all (cumulative masses from 142 to 160. Those masses that were undoubtedly belonging to single isotope components of definite elements masses 142 - 147, 149, 153, 156 - 160) were corrected using the coefficients quoted above. Those mass peaks that in all probability belonged to several (mostly two) isotopes of different elements were corrected using the average of the corresponding coefficients (and the relative error quoted was increased by 17% - the typical difference in the coefficients). Later the masses for such doublets are quoted in the results as sums of all element components for this particular mass value. Final results obtained by SIMS method are presented in Section 2.5. Absolute measurement of Sm and Eu amount in the Sample was done by luminescent analysis. Lumines-cence was induced by UV light from a nitrogen laser in the sensibilizing solution of tenoiltrifluoracetone+
2.2

+TOPO. The measurement was done relatively to luminescence of standard solutions containing known quantities of Sm and Eu. Preparation of the standard and their characteristics are presented in Section 2.4, below. Standards were prepared using natural isotopic mixtures of Sm and Eu, containing 56.90 ng/g of Sm in standard solution and 5.34 ng/g of Eu in standard solution. Concentrations in the sample were derived from the ratios between number of PMT counts for equal volumes of solution analyzed and the standard. These results gave absolute (ng/sample) values for the most “difficult” pair Sm - Eu, which were later just multiplied by the isotope abundance figures derived from the mass-spectrometry data. 2.3.3 Radiochemical Separation/Mass-Spectrometry Procedure The dried sample was dissolved in concentrated nitric acid, evaporated to dryness and dissolved in 0.1 M nitric acid. Weight of the empty vial - 19.2938 g, with solution – 22.3936 g, solution weight – 3.0998 g. An aliquot of 0.19735 g was taken from that solution for laser luminescence analysis of Eu and Sm (see in Section 2.3.2.). The remaining solution has been divided into two parts. The first part weighting 1.6490 g, was used for preparation of isotopically spiked solution and quantitative analysis of Nd and Gd in the sample. For this a known quantity of isotope spikes Nd-142 and Gd-156 were added into this part. The second part, was used for isotope assay determinations. Rare earths in both parts were purified by means of successive co-precipitation on fluoride and hydroxide of lanthanum of high purity. After dissolution in 0.001 M EDTA having pH 1.7 the solution was separated by electrophoresis on Whatman-31 paper into pure fractions of individual elements (for subsequent mass-spectrometric investigation). Condition of electrophoretic separation: E=24 V/cm; t=7 (D minutes. Zone positions on the paper strip were located by scanning it with a collimated GM-counter. The following parts of the paper strip were cut off and used for the mass-spectrometric measurement of the isotopic composition of each element (from the start):
Nd – 29-30 cm, Sm – 16-16.5 cm, Eu – 13.5-14 cm, Gd – 10.5-11 cm. These sections were ashed, dissolved and deposited on the tantalum filament for TH-5, mass-spectrometer. The results of mass distribution determinations for Nd, Sm, Eu, and Gd fractions are presented in Section 2.5. For calculation of Nd and Gd amount the isotopic ratios relative to Nd-144 and Gd-156 were measured in unspiked and spiked parts of the sample. For calculation of element concentra-tions, the well-known equation of isotope dilution method was used. Results of determinations are given below in Tables 2.5.1 and 2.5.2. 2.4 Standards Used in the Analysis The calibration of laser fluorimeter and IDMS were made with use of working reference solutions pre-pared from pure oxides of Nd, Sm, Eu, and Gd in accordance with Russian standard GOST 23862.0-79. According to information obtained from producer all four oxides were of 99.97, 99.75, 99.94 and 99.9996% purity, respectively. After calcination till the constant weight was achieved all oxides were dissolved in nitric acid and final solutions were weighed. Those stock solutions were used for preparation of working reference solutions.
2.3
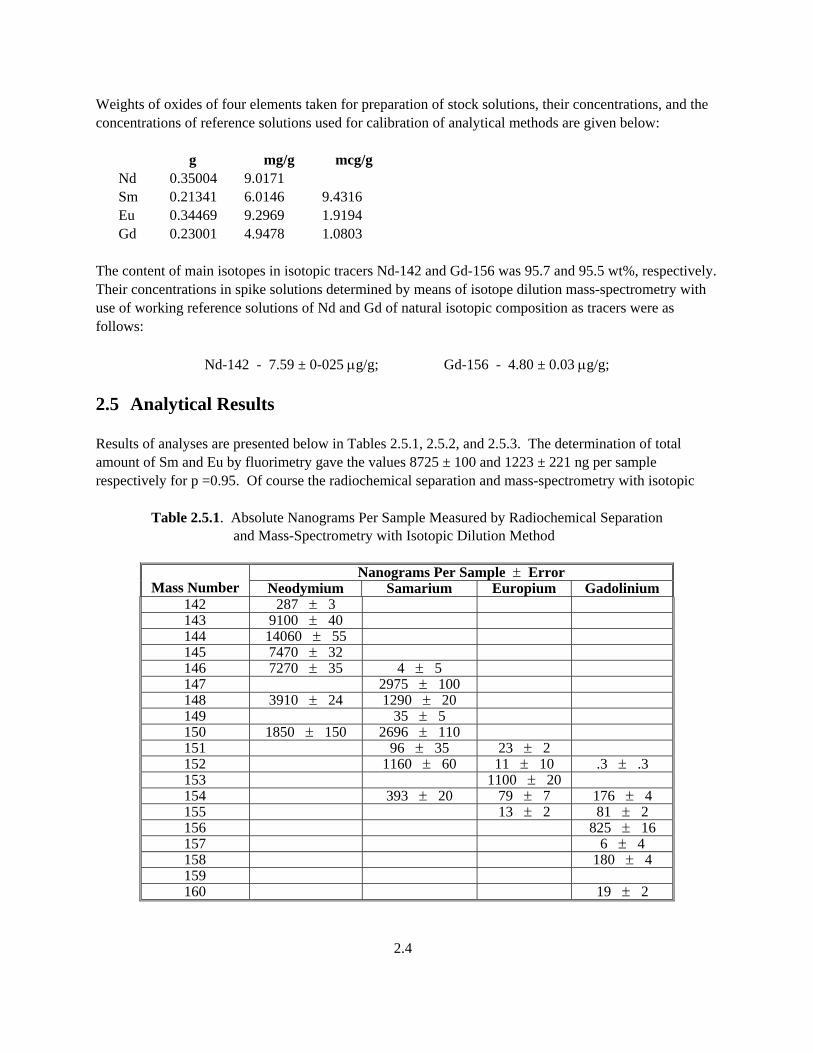
Weights of oxides of four elements taken for preparation of stock solutions, their concentrations, and the concentrations of reference solutions used for calibration of analytical methods are given below:
g mg/g mcg/g Nd 0.35004 9.0171 Sm 0.21341 6.0146 9.4316 Eu 0.34469 9.2969 1.9194 Gd 0.23001 4.9478 1.0803
The content of main isotopes in isotopic tracers Nd-142 and Gd-156 was 95.7 and 95.5 wt%, respectively. Their concentrations in spike solutions determined by means of isotope dilution mass-spectrometry with use of working reference solutions of Nd and Gd of natural isotopic composition as tracers were as follows:
Nd-142 - 7.59 ± 0-025 µg/g; Gd-156 - 4.80 ± 0.03 µg/g; 2.5 Analytical Results Results of analyses are presented below in Tables 2.5.1, 2.5.2, and 2.5.3. The determination of total amount of Sm and Eu by fluorimetry gave the values 8725 ± 100 and 1223 ± 221 ng per sample respectively for p =0.95. Of course the radiochemical separation and mass-spectrometry with isotopic
Table 2.5.1. Absolute Nanograms Per Sample Measured by Radiochemical Separation and Mass-Spectrometry with Isotopic Dilution Method
Nanograms Per Sample ± Error Mass Number Neodymium Samarium Europium Gadolinium
142 287 ± 3 143 9100 ± 40 144 14060 ± 55 145 7470 ± 32 146 7270 ± 35 4 ± 5 147 2975 ± 100 148 3910 ± 24 1290 ± 20 149 35 ± 5 150 1850 ± 150 2696 ± 110 151 96 ± 35 23 ± 2 152 1160 ± 60 11 ± 10 .3 ± .3 153 1100 ± 20 154 393 ± 20 79 ± 7 176 ± 4 155 13 ± 2 81 ± 2 156 825 ± 16 157 6 ± 4 158 180 ± 4 159 160 19 ± 2
2.4
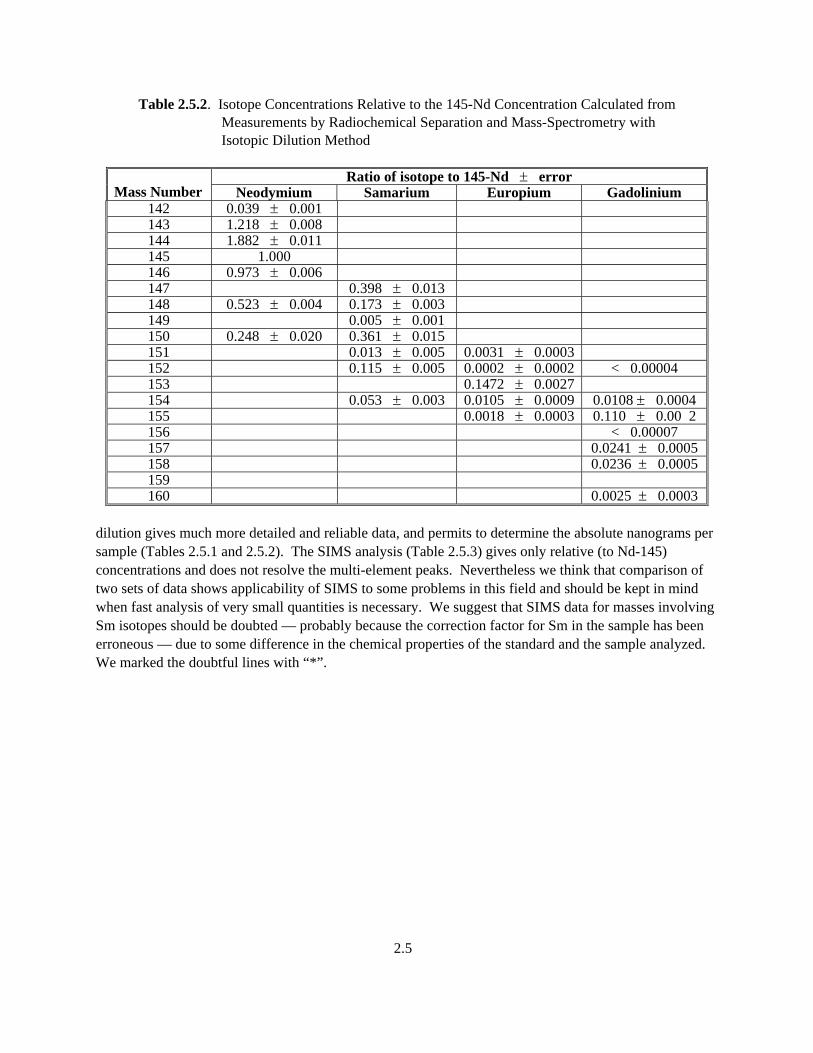
Table 2.5.2. Isotope Concentrations Relative to the 145-Nd Concentration Calculated from Measurements by Radiochemical Separation and Mass-Spectrometry with Isotopic Dilution Method
Ratio of isotope to 145-Nd ± error
Mass Number Neodymium Samarium Europium Gadolinium 142 0.039 ± 0.001 143 1.218 ± 0.008 144 1.882 ± 0.011 145 1.000 146 0.973 ± 0.006 147 0.398 ± 0.013 148 0.523 ± 0.004 0.173 ± 0.003 149 0.005 ± 0.001 150 0.248 ± 0.020 0.361 ± 0.015 151 0.013 ± 0.005 0.0031 ± 0.0003 152 0.115 ± 0.005 0.0002 ± 0.0002 < 0.00004 153 0.1472 ± 0.0027 154 0.053 ± 0.003 0.0105 ± 0.0009 0.0108 ± 0.0004 155 0.0018 ± 0.0003 0.110 ± 0.00 2 156 < 0.00007 157 0.0241 ± 0.0005 158 0.0236 ± 0.0005 159 160 0.0025 ± 0.0003
dilution gives much more detailed and reliable data, and permits to determine the absolute nanograms per sample (Tables 2.5.1 and 2.5.2). The SIMS analysis (Table 2.5.3) gives only relative (to Nd-145) concentrations and does not resolve the multi-element peaks. Nevertheless we think that comparison of two sets of data shows applicability of SIMS to some problems in this field and should be kept in mind when fast analysis of very small quantities is necessary. We suggest that SIMS data for masses involving Sm isotopes should be doubted — probably because the correction factor for Sm in the sample has been erroneous — due to some difference in the chemical properties of the standard and the sample analyzed. We marked the doubtful lines with “*”.
2.5

Table 2.5.3. Isotope Concentrations Relative to the 145-Nd Concentration Measured by Secondary Ion Mass-Spectrometry (SIMS) Method
Ratio of Isotope to 145-Nd ± Error Mass Number Neodymium Samarium Europium Gadolinium
142 0.024 ± 0.010 143 1.22 ± 0.03 144 1.87 ± 0.03 145 1.000 146 0.96 ± 0.03 147 0.46 ± 0.06 148 (Nd+Sm summed= 0.68 ± 0.08) 149 0.0008 ± 0.003 150 (Nd+Sm summed = 0.65 ± 0.08) 151 (Sm+Eu summed = 0.024 ± 0.005) 152 (Sm+Eu summed = 0.17 ± 0.03) 153 0.16 ± 0.02 154 (Sm + Eu + Gd total for 154 = 0.076 ± 0.08) 155 (Eu+Gd summed = 0.005 ± 0.003) 156 0.07 ± 0.03 157 < 0.002 158 < 0.002 159 160 < 0.002
2.6
3.0 Rare Earths Analysis of Sample 87-108 3.1 Background on Work Performed on Samples 87-108 Sample 87-108 was partitioned from an archived sample from ATM-106, Rod NBD-107, Section GG. This section was measured to have a burnup of 37.27 Mwd/KgU. Information on both the fuel rod, its irradiation history in a reactor, and information regarding the specific sample can be obtained in Reference 2. Battelle PNNL further divided the partitioned sample of spent fuel No 87-108 into 2 parts. One part was presented for the analysis of Rhodium, which is presented in Section 4. The second part was presented for the analysis of abundances of several rare earth nuclides. Sm – 147, 149, 150, 151, 152 Gd – 155 Eu – 155 Nd – 143, 145 Concentrations were to be measured either in grams of nuclide per sample or as the amount of nuclide relative to Nd-145. 3.2 Initial Sample Evaluation and Preparation The samples were sent in the form of dry residues, presumably, in the bottom of glass vials, packed in lead containers and in the shipping drum. This package was transported by air freight to St. Petersburg and received in the Institute in October 1995 being undamaged and sealed. Two different methods were chosen for the analysis of the samples: laser induced fluorimetry for direct determination of total Eu and Sm content in the sample and conventional isotope dilution mass spec-trometry (IDMS) with preliminary radiochemical isolation of pure Nd, Sm, Eu, and Gd for determination of isotope abundances of those elements and total amounts of Nd and Gd. 3.3 Analytical Methods Applied – Short Description 3.3.1 Standards Used in the Analysis The calibration of laser flurometer and IDMS were made with use of working reference solutions pre-pared from pure oxides of Nd, Sm, Eu, and Gd in accordance with Russian standard GOST 23862.0-79. According to information obtained from producer respectively. After calcination till constant weight was achieved, all oxides were dissolved in nitric acid and final solutions were weighed. Those stock solutions were prepared in the 1993 and since that time careful checking of their gross weight was carried out. This
3.1
procedure enabled us to correct the concentration of the stock solutions during the storage period. The concentration of the elements in the stock solutions and in the diluted solutions prepared from them was as follows (on October 1995):
In stock solution mg/g
In diluted solution mg/g
Nd 9.0171 0.04936 Sm 5.200 0.01164 Eu 8.067 0.00444 Gd 4.959 0.07585
Highly enriched Nd-142 and Gd-160 were used as isotopic spikes. The content of main isotopes in isotopic tracers Nd-142 and Gd-160 was 95.7 and 98.77 wt %, respectively. Their concentrations in spike solutions determined by means of isotope dilution mass spectrometry with use of working reference solutions of Nd and Gd of natural isotopic composition as tracers were as follows (on January 1996) :
Nd-142 - 7.75 +/- 0.05 mcg/g ; Gd-160 - 3.22 +/- 0.04 mcg/g. 3.3.2 Radiochemical Analysis
3.3.2.1 Dissolution of the Sample Part 1 of the dried sample 87-108 equivalent to 11 g of irradiated uranium dioxide was dissolved in concentrated nitric acid, then evaporated to dryness and dissolved in 1 M nitric acid. Weights of the vial and solution were the following: Vials as received 18.71930 g Vials with solution 26.25015 g Solutions for analysis 7.53085 g
3.3.2.2 Aliquoting of the Solution Solution of the sample was aliquoted as follows: For luminescence analysis 0.08469 g For isotopic analysis of Nd 2.2472 g For MS and IDMS of other elements 0.57503 g 3.3.3 Determination of Isotopic Composition Radiochemical analysis consisted of two stages. The first stage was the isolation of a fraction of rare earth and trans-plutonium elements by adsorption on a column with D2EHPA in 0.05 M nitric acid and elution with 4 M nitric acid. The second stage was the separation of the RE+TPE fraction by paper electrophoresis in the solution of EDTA on Whatman-31 paper strips with dimensions 1=50 cm, d=1 cm.
3.2

For this an aliquot of each sample solution was dried. After dissolution in 0.001 M EDTA solution having pH = 1.7 the sample was applied on the strip of Whatman-31 paper and separated into pure fractions of individual elements (for subsequent mass-spectrometric investigation). Conditions of electrophoretic separation: E=24 V/cm; t=70 minutes, temperature 60ºC. Zone positions of Pm and Eu on the paper strip were located by scanning it with a collimated GM-counter. The following parts of the paper strips were cut off and used for the mass-spectrometric measurement Nd – 28-32 cm, Sm – 17-19 cm, Eu – 15-16 cm, Gd – 11-13 cm. These sections were ashed, dissolved, and applied on the filaments of mass-spectrometer. The isotopic ratios were determined with use of mass-spectrometer TH-5 (Varian MAT) for Nd and Sm and MI 1201 (Russian) with position sensitive detector for Eu and Gd. The latter, gave the possibility to analyze the sample on subnanogram level. 3.3.4 Laser Luminescence Determination of Sm and Eu Absolute measurement of Sm and Eu amount in the samples was done by luminescent analysis. Luminescence was induced by UV light from a nitrogen laser in the sensibilizing solution of thenoyltrifluoroacetone++TOPO. The method did not demand any chemical treatment of the sample. Determination of Sm and Eu consisted of comparison between luminescence intensity of the sample and standard solutions containing known quantities of Sm and Eu. Measurements were carried out in the photon counting mode. For calculations, the following formula was used:
Q(x) = C(st) * N(x) / N(st) * k(x) where: Q(x) – mass of an element in the sample, C(x) – concentration of an element in standard solution, N(x) – sum of photon pulses for the sample, N(st) – sum of photon pulses for the standard, M – mass of diluted sample solution, k(x) – coefficient of dilution Each series of measurements consisted of 20 observations of the ratio N(x) / N(st). The random errors were derived as:
S = 2 * t * SD / SQR(20) where SD – standard deviation Isotope amounts of Eu and Sm were derived from data of isotope abundances and results of fluorimetry.
3.3

3.3.5 Determination of Nd and Gd by Isotope Dilution Method of isotope dilution was based on comparison of isotope ratios of Nd and Gd between unspiked and spiked samples. Experimentally procedure consisted of addition of known amount of isotope spikes Nd-142 and Gd-160 to the aliquots of both samples, electrophoretic separation of rare earth elements and measuring new isotopic ratios of Nd and Gd fraction relative to Nd-142 and Gd-160. For calculation of total amount of Nd and Gd the following formula was used:
))v(R/)m(R1(())s(R)m(R(*P*
)S(M)i(M*
)V(P)S(P*
)i(K)S(T)Gd,Nd(Q
−−
= ,
where: Q(Nd,Gd) – total amount of Nd or Gd in the sample
expressed in weight units, ng; T(S) – titre of the spike solution Nd-142 or Gd-160,
ng/g; K(i) – mass fraction of the base isotope in Nd or Gd. The bas isotope for Nd was chosen Nd-144, for Gd – Gd-158; P(S) and P(V) – weights of aliquots of spike and sample
solutions respectively taken for analysis; M(i) and M(S) – atomic weights of base and spike isotopes
respectively; P – total mass of the sample solution R(m), R(v), and R(S) – isotopic ratios of base isotope (Nd-144 or
Gd-158) relative to the spike isotope (Nd-142 or Gd-160 in the spiked aliquot of the sample solution, unspiked one and spiked solution respectively.
For error propagation all sources (both random and systematic) were taken into account. It was found that the main source of uncertainty was the error of the values of spike concentrations.
3.4

3.4 Analytical Results Results of determination of isotopic composition of Nd, Sm, Eu, and Gd measured by radiochemical separation and mass-spectrometry are presented in Tables 3.4.1-3.4.2. Total element amounts and isotope concentrations were calculated on the basis of data in Tables 3.4.1, results of IDMS (for Nd and Gd) and luminescent analysis (for Sm and Eu). Results of determination of total element amounts in part 1 of the sample 87-108 are given in the Table 3.4.2. Isotope concentrations relative to the 145-Nd concentration are presented in the Table 3.4.3.
Table 3.4.1. Isotopic Composition of Nd, Sm, Eu, and Gd in the Sample 87-108
Mass % Mass number Neodymium Samarium Europium Gadolinium 142 0.71 143 15. 96 144 35.64 145 16.08 146 17.64 147 29.14 148 9.32 18.78 149 0.22 150 4.65 32.84 151 0.86 0.84 152 13.26 0.08 153 93.90 154 4.90 4.48 11.46 155 0.71 6.35 156 66.26 157 1.92 158 13.56 160 0.46
Table 3.4.2. Total Amounts of Elements Found by IDMS and Luminescence
Element Total amount of Element, Microgram Per Sample
Nd 47.37 +- 0.05 Sm 9.59 +- 0.27 Eu 1.66 +- 0.04 Gd 1.15 +- 0.04
3.5

Table 3.4.3. Isotope Concentrations to the 145-Nd Concentration in the Sample 87-108
Ratio of Isotope to 145-Nd +/- Error (p=0.95) Mass number Neodymium Samarium Europium Gadolinium 142 0.99 +- 0.02 145 1.00 147 0.367 +- 0.009 149 0.0030 +- 0.0004 150 0.414 +- 0.006 151 0.0110 +- 0.0005 152 0.167 +- 0.004 155 0.00157 +- 0.00005 0.0097 +- 0.0004
3.6

4.0 Rhodium Analysis of Sample 87-108 4.1 Background on Rhodium Analysis Performed on Sample 87-108 Interest in rhodium produced from fission originated in a twofold manner: 1. Rhodium accumulated in the fission products has the only stable isotope – rhodium-103, which can
be used instead of natural rhodium providing its radiochemical purification from other fission products is satisfactory. So the spent fuel may be considered as a source material for rhodium production. This question is under consideration since early 80-th.
2. Rhodium-103 is a relatively effective neutron poison (cross-section = 160 barn) and its accumulation
should be taken into account both for calculation of reactor operation period and nuclear safety during the storage of spent fuel assemblies.
For the first time theoretical estimations of accumulation of rhodium and other platinum metals were made in 70-th [1]. Those estimations gave the values of rhodium content in fuel of 450 mg/kg U at burnup 33000 MWd/Mtu. Precise calculations are complicated by the necessity to take into account a series of (n, gamma) reactions and differences between rhodium yields for fission of uranium-235, plutonium-239, and plutonium-241. From the other hand, the absence of stable or long-lived rhodium isotopes other, than rhodium-103, makes any traditional technique of isotope dilution mass-spectrometry useless for rhodium determination in spent fuel by destructive analysis. Early experimental works on rhodium determination in spent fuel were carried out in 60-th. A sample of metallic uranium spent fuel with low burn-up was analyzed. Mass fraction of rhodium in uranium was found of 7,5-8 mg/kg U [2]. The chemical isolation of rhodium was carried by three-stage chromatogra-phy. The final spectrophotometric determination was made by comparative measurement of absorbance of rhodium complex with tin chloride. Slightly modified variant of the similar technique was used for analysis of some model compositions of fissile materials [3]. Results of determination of rhodium content in highly radioactive waste of reproc-essing plants were summarized in [4]. On the first stage of the studies on rhodium accumulation in spent fuel the spectrophotometric measure-ments of absorbance of Rh-Sn chloride complex (molar absorbance = 4000) was widely used. There are two drawbacks of the method: 1. Relatively low sensitivity makes it necessary to use rather large aliquots of highly radioactive
material; 2. There are some difficulties in determination of chemical yield of rhodium on the radiochemical stage
of analytical procedure.
4.1

At present some methods of both rhodium and other platinum metals determination based on ICP-mass spectrometry and x-ray fluorimetry are developing intensively. These methods are very sensitive and may be used with a minimum chemical pretreatment of the sample. Both methods were used in the present work for determination of rhodium amount in the sample of spent fuel solution obtained from U.S. Department of Energy. 4.2 Experimental Method The Radium Institute received ATM-106 Rod Section 87-108 Archive Sample for Laboratory Analysis. Approximately 0.022 g of oxide fuel equivalent as dried nitrate salts were divided equally into small screw caped vials by the customer. The shipment was received in the Radium Institute on October 1995. One of those two portions was intended for determination of rhodium, other – for analysis of abundance of several nuclides of rare earth elements. 4.2.1 Dissolution of the Sample One of two spent fuel portions of sample 87-108 as received was dissolved in the vial using mixture or nitric and hydrochloric acids at elevated temperature until the end of nitrogen oxide fuming. The solution was then quantitatively transferred from the vial to a flask weighed 5,5 M HCI under the control of completeness of transfer by radioactivity measurements of the vial. Main solution and portions of rinsing acid were merged and then 2 ml of 5,5 M HCI were added. The final solution was stirred carefully and heated. After cooling, the solution was weighed. Its weight –6,8235 g was used as a base for aliquoting. Determination of uranium in this solution was performed by laser induced fluorimetry in the solution of sodium polysilicate. Results are presented in Table 1. Data presented in the Table 4.2.1 gave the possibility to express the results of rhodium determination as a ration Rh/U in weight %. For ICP MS a gravimetric dilution of 2 aliquots of the sample solution with 0,01 M HCI was carried out in order to obtain the final concentration of HCI 0,5-0,6 M. To one of two diluted aliquots a standard addition of standard rhodium solution containing 375 ng of rhodium was made. For x-ray fluorimetry an anion exchange separation of rhodium from uranium was carried out (see Section 4.2.3). Table 4.2.1. Results of Uranium Determination in the Sample 87-108; Uncertainty – 6 rel.% for p=0.95
Aliquot, G Volume after Dilution, ml
Uranium in Aliquot, mg
Uranium Concentration in Initial Sample Solution, mg/g
Total U (UO2) in the Sample 87-108, mg
0.0445 50 0.065 1.46 9.96 (11.3)
4.2
4.2.2 Method of Inductively Coupled Plasma Mass Spectrometry. Inductively Coupled Plasma Mass-spectrometry (ICPMS) has become a widely acknowledged method of elemental analysis with very low detection limits (less than 100 ng/L). Two variants of this method are developed:
• ICPMS in combination with isotope dilution [5]. This variant is precise and reliable, but it cannot be used for rhodium determination
• ICPMS in combination with internal standard. The latter may be chosen among other elements with
negligible isobaric interferences. In that case, the ratio of ion currents of main isotopes of element to be analyzed and internal standard are measured rather than absolute ion intensity. The main sources of errors for ICPMS are:
Instrumental drift; Matrix effects induces by the presence of Ca, Al, Fe, Na, Mg, U in large quantities; Isobaric effects induced be the presence of some oxide ions. For rhodium-103, this effect may be
connected with the rubidium-87 oxide. There are several methods for reducing or suppression of the influences of those factors:
• An optimum choice of internal standard. For rhodium, the best internal standard is indium. • Using the standard addition technique.
In this work, the measurements were performed on a quadruple ICP mass-spectrometer Plasma Quad PQ2 – Turbo plus (VQ Instrumentation) with use both internal standardization technique (indium-115 as an internal standard) and combined internal standardization + standard addition technique. 4.2.3 x-Ray Fluorescent Analysis (xRFA). The variant of xRFA developed in the Radium Institute [6] was intended for determination of some fission products in liquid radioactive waste. The method has rather good sensitivity and selectivity even in the presence of gamma-ray background from the radioactive fission products. The instrument operates on the principle of wide-range xRFA in the band 15,5-25 keV that includes K-alpha peaks of light platinum group elements and some other metals peaks Zr, Nb, Mo, Tc, Ag, Cd, In, and Sn. The energy values for K-alpha peaks and sensitivity parameters of the instrument for some elements is given in Table 4.2.2. The preliminary energy selection was realized by Bregg’s cylinder reflector made of crystalline pyrographite. The counting rate was controlled by collimator. The semiconductor detector was protected from the influence of direct gamma-ray of fission products by tungsten shield. Bregg’s reflector was adjusted for transmittance at a maximum 19,5 keV in order to ensure the efficient detection in the band 17 - 23 keV. X-ray spectrum was induced by the braking radiation from the x-ray tube 3,5 BHV-7 with
4.3
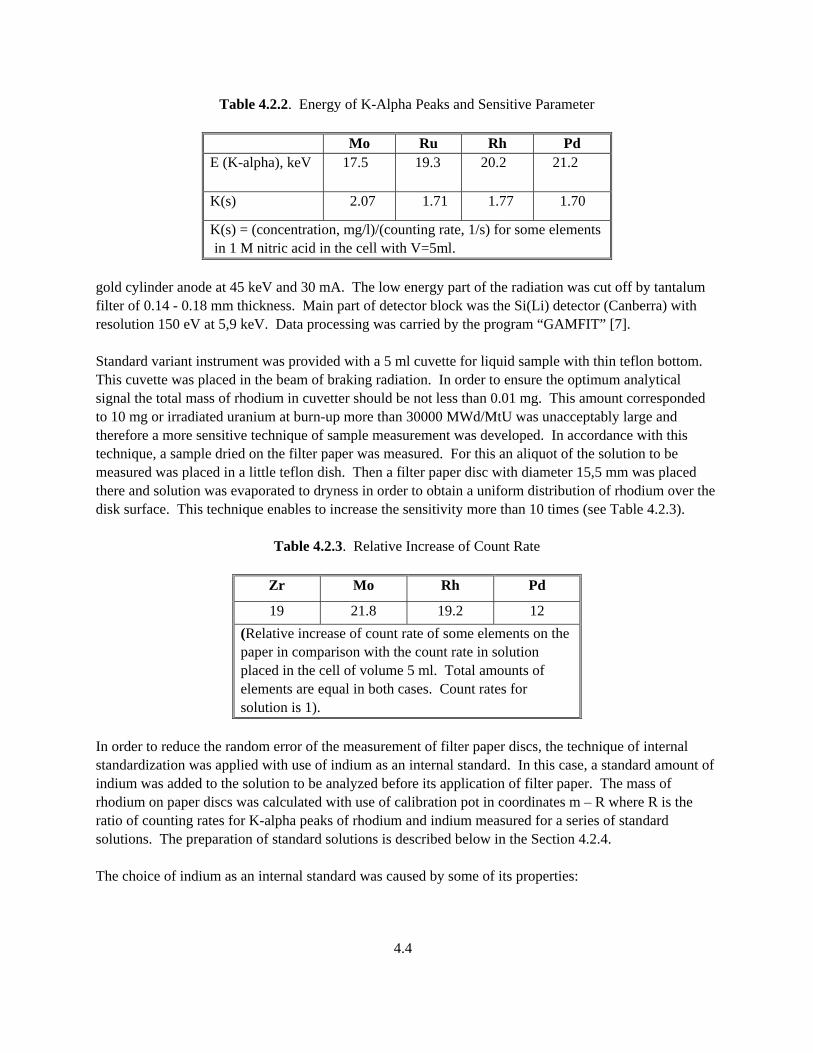
Table 4.2.2. Energy of K-Alpha Peaks and Sensitive Parameter
Mo Ru Rh Pd E (K-alpha), keV 17.5 19.3 20.2 21.2
K(s) 2.07 1.71 1.77 1.70
K(s) = (concentration, mg/l)/(counting rate, 1/s) for some elements in 1 M nitric acid in the cell with V=5ml.
gold cylinder anode at 45 keV and 30 mA. The low energy part of the radiation was cut off by tantalum filter of 0.14 - 0.18 mm thickness. Main part of detector block was the Si(Li) detector (Canberra) with resolution 150 eV at 5,9 keV. Data processing was carried by the program “GAMFIT” [7]. Standard variant instrument was provided with a 5 ml cuvette for liquid sample with thin teflon bottom. This cuvette was placed in the beam of braking radiation. In order to ensure the optimum analytical signal the total mass of rhodium in cuvetter should be not less than 0.01 mg. This amount corresponded to 10 mg or irradiated uranium at burn-up more than 30000 MWd/MtU was unacceptably large and therefore a more sensitive technique of sample measurement was developed. In accordance with this technique, a sample dried on the filter paper was measured. For this an aliquot of the solution to be measured was placed in a little teflon dish. Then a filter paper disc with diameter 15,5 mm was placed there and solution was evaporated to dryness in order to obtain a uniform distribution of rhodium over the disk surface. This technique enables to increase the sensitivity more than 10 times (see Table 4.2.3).
Table 4.2.3. Relative Increase of Count Rate
Zr Mo Rh Pd
19 21.8 19.2 12 (Relative increase of count rate of some elements on the paper in comparison with the count rate in solution placed in the cell of volume 5 ml. Total amounts of elements are equal in both cases. Count rates for solution is 1).
In order to reduce the random error of the measurement of filter paper discs, the technique of internal standardization was applied with use of indium as an internal standard. In this case, a standard amount of indium was added to the solution to be analyzed before its application of filter paper. The mass of rhodium on paper discs was calculated with use of calibration pot in coordinates m – R where R is the ratio of counting rates for K-alpha peaks of rhodium and indium measured for a series of standard solutions. The preparation of standard solutions is described below in the Section 4.2.4. The choice of indium as an internal standard was caused by some of its properties:
4.4

1. K-alpha peak of indium lies near the same peak for rhodium. 2. Fission yield of indium is negligible. 3. In 6M HCI, indium is in ion form. A special procedure of sample preparation for xRFA was developed. As L-peak of uranium and pluto-nium coincides with K-alpha peaks of rhodium the chemical procedure of sample preparation should have the purification factor from those elements not less than 1000 as it was found by preliminary examina-tions. Taking into account the recommendations of the work [3], an anion exchange separation on the resin Dowex 2 x 8 100/200 mesh in the medium 8M HCI was chosen. The resin was placed into a column with inner diameter 5,5 mm, height of resin layer was 50 mm, free volume –0,6ml. Before starting of the separation process, the column was washed with 4-5 free volumes of 8M HCI twice solved in two 0,5 ml portion of 8M HCI and put into the column. Elution of rhodium was carried out with 20 free volumes of 8M HCI. Effluent was evaporated to little volume with addition of 0.002 mg of indium as internal standard. Then the evaporated solution was transferred to the teflon dish with paper disc and evaporated to dryness under infra-red lamp. Preliminary experiments with model solutions containing 0.020 mg of rhodium and 1 mg of uranium, showed that the rhodium chemical yield was (80 +- 20)%. 4.2.4 Preparation of Reference Solutions Indium and Rhodium Indium. Initial calibration solution of indium was prepared by quantitive dissolution of metallic indium of high purity grad (99,99%) in HCI. The final concentration of indium in this solution was 17.5 mg/g in 0,1 M HCI. From this solution a diluted working solution of indium was prepared by gravimetric dilution of its aliquot with 0,2 M HCI. Concentration of indium in working solution was 0.104 mg/g. Rhodium. Initial calibration solution of rhodium was prepared by electrolytic dissolution of rhodium foil (thickness – 0,1 mm, chemical purity – 99,9%) in 6 M HCI. Dissolution was performed in electrolytic cell with two rhodium foil electrodes of 4 sq. cm each under alternating current of 0,2 A. The process was divided into 7 intervals with duration of 3,5 min. After each interval, the rhodium solution in elec-trolytic cell was taken off and new portion of 6 M HCI was put in. After the last interval, the electrodes and electrolytic cell was rinsed carefully with a portion of 6M HCI, which was added to the main rhodium solution. Details of calculation of rhodium concentration in calibration solution are given in the Table 4. An aliquot of this initial calibration solution was diluted by 6M HCI to the rhodium concentration 0,01875 mg/ml. The latter solution, was used as a working standard solution for calibration of ICPMS and xRFA. 4.3 Results of Analysis of the Sample 87-108 Results of determination of rhodium contents on one of two portions of the sample 87-108 obtained by ICP MS and xRFA are given in the Tables 4.5.2 and 4.3.3. 4.3.1 ICPMS Initial data and results of determination of rhodium in the sample 87-108 are given in the Table 4.3.2.
4.5
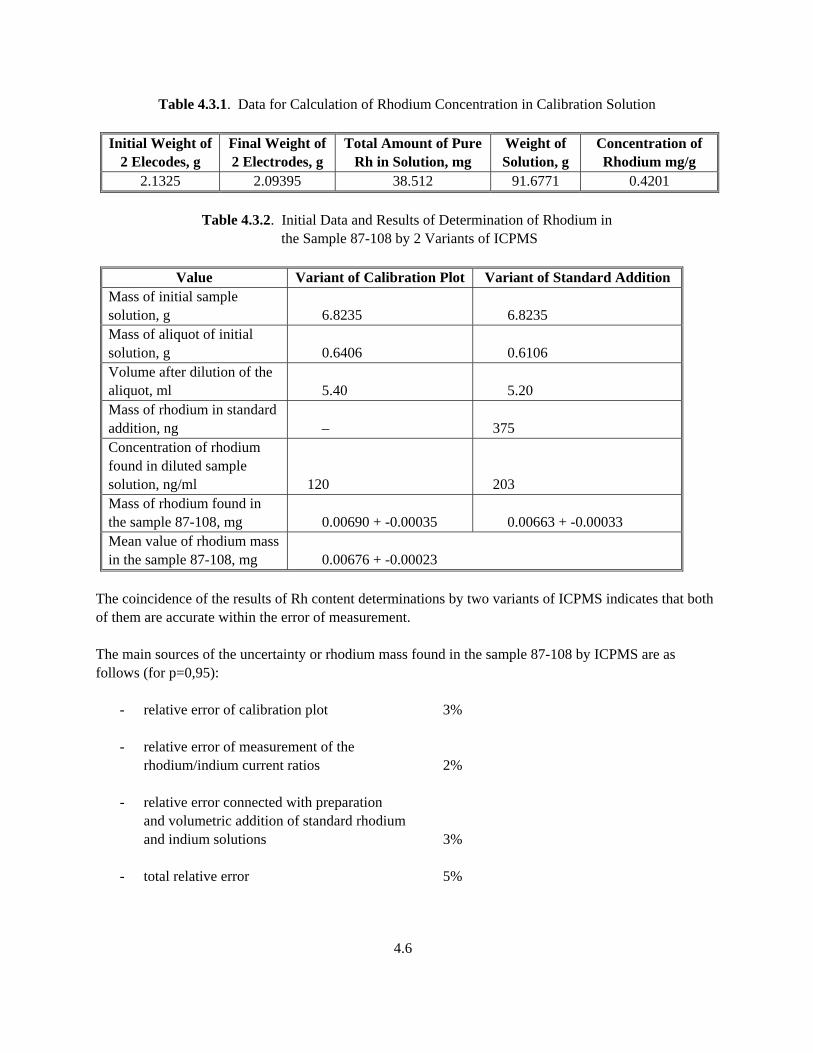
Table 4.3.1. Data for Calculation of Rhodium Concentration in Calibration Solution
Initial Weight of 2 Elecodes, g
Final Weight of 2 Electrodes, g
Total Amount of Pure Rh in Solution, mg
Weight of Solution, g
Concentration of Rhodium mg/g
2.1325 2.09395 38.512 91.6771 0.4201
Table 4.3.2. Initial Data and Results of Determination of Rhodium in the Sample 87-108 by 2 Variants of ICPMS
Value Variant of Calibration Plot Variant of Standard Addition Mass of initial sample solution, g 6.8235 6.8235 Mass of aliquot of initial solution, g 0.6406 0.6106 Volume after dilution of the aliquot, ml 5.40 5.20 Mass of rhodium in standard addition, ng – 375 Concentration of rhodium found in diluted sample solution, ng/ml 120 203 Mass of rhodium found in the sample 87-108, mg 0.00690 + -0.00035 0.00663 + -0.00033 Mean value of rhodium mass in the sample 87-108, mg 0.00676 + -0.00023
The coincidence of the results of Rh content determinations by two variants of ICPMS indicates that both of them are accurate within the error of measurement. The main sources of the uncertainty or rhodium mass found in the sample 87-108 by ICPMS are as follows (for p=0,95): - relative error of calibration plot 3% - relative error of measurement of the rhodium/indium current ratios 2% - relative error connected with preparation and volumetric addition of standard rhodium and indium solutions 3% - total relative error 5%
4.6

Using the data from the Table 4.2.3, the weight ratio of rhodium to uranium in the sample 87-108 may be estimated: rhodium/uranium = 0.000676 mg/9,96 mg = 0,068% 4.3.2 xRFA In order to validate the values of rhodium content found be ICPMS a series of determinations of rhodium in the sample 87-108 by xRFA was carried out. Mass of rhodium in the aliquot applied on the paper disc was measured using calibration equation:
R = 1.90 m - 0.05 where:
R – ratio of counts for rhodium and indium for constant mass of indium on the paper disc = Count = 0.002 mg; M – rhodium mass on the disc. Results are given in the Table 4.3.3. In present work, the data obtained by xRFA are considered as validation ones because the uncertainty of these data is rather large. It may be estimated of 20 rel. %. Nevertheless, the data obtained by xRFA confirm that there is not bias in ICPMS data. The main source of error in xRFA technique is the uncertainty of the chemical yield in purification process. 4.4 Conclusions The data on rhodium content in the sample 87-108 obtained in this work (0.0067 mg per one portion of the sample) are valid if there were no losses sample) of this element during the initial dissolution of irradiated uranium fuel. So the information about the dissolution technique is important.
Table 4.3.3. Results of Validation Analysis of the Sample 87-108 by xRFA
Aliquot of Initial Sample Solution, g
Indium Added to
Aliquot, mg Number of
Counts of Rh Number or
Counts of In R Mass of Rh in the
Sample 87-108, mg(a) 0.590 0.002 4800 5300 0.89 0.0073 1.1387 0.002 6950 4570 1.52 0.0062
(a) The value of chemical yield was determined of 80% (see Section 4.2.3). R-intensity ratio rhodium/indium. Exposure – 300 s; background – 100 counts.
4.7

For reducing the error connected with determination of chemical yield in the process of separation and purification of rhodium, the application of radioactive rhodium tracer is of great importance. In our opinion, the most prospective tracer is rhodium-102 with a half-life 210 day and analytical line in gamma-spectrum 0.46 MeV. This isotope may be easily obtained by the reaction (p,n) on ruthenium-102 using low energy cyclotron. 4.5 Supporting Literature for Section 4 1. V.I. Zemljanukhin, E.I. Iljenko, A.N. Kondratjev et al., Reprocessing of spent fuel of Atomic Energy
Stations, M., 1983, p. 16. 2. M.D. Ward et al., Talanta, 1963, v.10, No 7, p.779. 3. H. Evans, C. Bloomquist, J. Hughes, Anal. Chem., 1962, v.34, No 13, p.1692. 4. See [1], p.154. 5. D. Colodner, E. Boyle, J. Edmond, Anal. Chem., 1993, v.65, No 10, p. 1419. 6. P. Galtzev, V. Khorev, B. Iokin, Atomic Energy (Russian) 1990, v.69, No. 2, p. 117. 7. A. Dubinin, Geochemistry (Russian) 1993, No 11, p. 1605. 8. Methods of separation and determination of noble elements, M., Academy of Science of USSR, 1981,
p. 111. 9. N.M. Kuzmin et al., J. Anal. Chem. (Russain), 1989, v.44, No 10 p. 1793; 1990, v.45, No. 1 p. 46.
4.8

5.0 References 1. Characterization of Spent Fuel Approved Testing Material – ATM-104, PNL-5109-104, Guenther,
et al. 2. Characterization of Spent Fuel Approved Testing Material – ATM-106, PNL-5109-106, Guenther,
et al.
5.1
Appendix A
Additional Analyses Previously Performed

Appendix A
Additional Analyses Previously Performed
Table A.1. Irradiated Composition(a) of Fuel and Total Burnup - Fuel Assembly D047, Rod MKP109
Sample 87-81 87-72 87-63 Axial Location,(b) cm 13.20 27.70 165.22 Burnup,(c) GWd/MTU 27.35 37.12 44.34 234U, mg/g fuel 0.16 0.14 0.12 235U, mg/g fuel 8.47 5.17 3.54 236U, mg/g fuel 3.14 3.53 3.69 238U, mg/g fuel 842.50 832.70 824.86 238Pu, mg/g fuel 0.101 0.189 0.269 239Pu, mg/g fuel 4.264 4.357 4.357 240Pu, mg/g fuel 1.719 2.239 2.543 241Pu, mg/g fuel 0.681 0.903 1.020 242Pu, mg/g fuel 0.289 0.576 0.840 237Np, mg/g fuel 0.268 0.356 0.468 241Am, mg/g fuel 0.249 0.343 0.381 133Cs, mg/g fuel 0.85 1.09 1.24 135Cs, mg/g fuel 0.36 0.40 0.43 137Cs, mg/g fuel 0.77 1.04 1.25 143Nd, mg/g fuel 0.613 0.716 0.763 144Nd, mg/g fuel 0.943 1.338 1.643 145Nd, mg/g fuel 0.510 0.653 0.744 146Nd, mg/g fuel 0.490 0.682 0.830 148Nd, mg/g fuel 0.265 0.359 0.428 150Nd, mg/g fuel 0.124 0.172 0.208 147Sm, mg/g fuel 0.190 0.218 0.230 148Sm, mg/g fuel 0.106 0.164 0.222 149Sm, mg/g fuel 0.0029 0.0030 0.0047 150Sm, mg/g fuel 0.207 0.271 0.361 151Sm, mg/g fuel 0.0086 0.0086 0.0090 152Sm, mg/g fuel 0.087 0.104 0.121 151Eu, mg/g fuel 0.0007 0.0007 0.0008 153Eu, mg/g fuel 0.079 0.109 0.148 155Eu, mg/g fuel 0.0021 0.0033 0.0045 155Gd, mg/g fuel 0.0025 0.0039 0.0053 99Tc, mg/g fuel 0.56 0.72 0.78
(a) Radiochemical analyses performed during June 1987, or corrected for decay to June 1987.
(b) From bottom of fuel. (c) Burnup based on measured 148Nd concentration (ASTM 1985).
A.1

Table A.2. Irradiated Composition(a) of Fuel and Total Burnup - Fuel Assembly BT03, Rod NBD107.
Sample 87-108 Axial Location,(b) cm 28.83 Burnup,(c) GWd/MTU 37.27 234U, mg/g fuel 0.127 235U, mg/g fuel 2.71 236U, mg/g fuel 3.03 238U, mg/g fuel 843.8 238Pu, mg/g fuel 0.194 239Pu, mg/g fuel 3.835 240Pu, mg/g fuel 2.321 241Pu, mg/g fuel 0.813 242Pu, mg/g fuel 0.775 237Np, mg/g fuel .3207 241Am, mg/g fuel .4260 135Cs, mg/g fuel .3602 137Cs, mg/g fuel .9858 143Nd mg/g fuel .6337 144Nd mg/g fuel 1.4131 145Nd mg/g fuel 0.6387 146Nd mg/g fuel 0.6880 148Nd mg/g fuel 0.3635 79Se mg/g fuel 0.008078 90Sr mg/g fuel 0.3749 126Sn mg/g fuel 0.01409 99Tc, mg/g fuel 0.5280 (a) Radiochemical analyses performed during June 1987, or corrected for decay to
June 1987. (b) From bottom of fuel. (c) Burnup based on measured 148Nd concentration (ASTM 1985).
A.2