complementary collections in ligeti’s d...
TRANSCRIPT

Complementary Collections in Ligeti’s Desordre
Clifton Callender
Florida State [email protected]
Abstract. This paper examines one aspect of Ligeti’s approach to writing music that is nei-ther tonal nor atonal—the use of complementary collections to achieve what Richard Steinitzhas termed combinatorial tonality. After a brief introduction, the paper explores propertiesof the intervallic content both within and between complementary collections, which I termthe intra- and inter-harmonies. In particular, the inter-harmonies are useful in understandingharmonic control in works based on complementary collections, as demonstrated by revisitingLawrence Quinnett’s analysis of Ligeti’s first Piano Etude, Desordre.
Keywords: Ligeti, Desordre, complementary collections, combinatorial tonality
1 Introduction
Figure 1 shows the opening of Ligeti’s first Piano Etude, Desordre. A remarkable featureof this etude is that the right hand plays only the white keys while the left hand plays onlythe black keys. The etude thus systematically divides the aggregate into two quite famil-iar complementary collections—diatonic and pentatonic. Due to the overlapping registers(proximity) and similarity of contour in the ascending scalar fragments (common fate), itcan be difficulty to separate the two hands into independent psychological streams, thusmaking the diatonic and pentatonic collections difficult to hear separately. (See Bregman[3] for the importance of pitch proximity and common fate in the formation of independentauditory streams.) Instead, it is much easier to hear the between hand note-against-noteharmonic intervals, which we might term the inter-harmonies.
Fig. 1: Opening of Desordre
As the etude progresses, the hands gradually drift apart, the accents in the two handsbecome desynchronized, and the durations between accents in each hand are gradually

shortened, leading to a fragmentation of the scalar segments. Near the climax of the etude(see Figure 6b), both the lack of pitch proximity and common fate in the melodic contoursstrongly encourages the formation of two independent streams, making it difficult to hearthe harmonic relations between the hands, but relatively easy to hear the within streamintervallic relationships, which we might term the intra-harmonies. From the opening tothe climax of Desordre there is thus a change in focus from the inter-harmonies to the intra-harmonies. Richard Steinitz [12] has referred to this interplay of complementary collectionsas “combinatorial tonality.”
While there are clear precedents in the use of complementary collections, Ligeti’s ex-tensive use of opposed collections in his late works and, in particular, his exploration ofthe unfamiliar harmonic possibilities between collections and the ways in which a listener’sattention can be focused on the relations within (inter) and between (intra) collectionsis something very different. Indeed, the technique of complementary collections may rep-resent Ligeti’s most systematic approach to achieving his goal of creating music that isneither tonal not atonal in his late works. (See Ligeti’s own comments in [2].) As such, ourlack of understanding of the harmonic relations between complementary collections takeson greater significance. The current paper explores this aspect of Ligeti’s combinatorialtonality, focusing on the relevant mathematical properties of complementary collectionsand the first part of Desordre, as a preliminary step to a greater understanding of Ligeti’sexploration and realizations of the theoretical properties and corresponding possibilities ofcomplementary collections.1
2 Properties of intra- and inter-harmonies
We begin examining the harmonic relationship between complementary collections by look-ing at the interval content (IC) from one pitch-class set to another using Lewin’s [8] intervalfunction (IFUNC):
ICA,B(k) = IFUNC(A,B)(k) = |{(a, b) ∈ A×B, b− a = k}|.2
The interval function is a histogram of the pc intervals by which a member of one set canmove to a member of the other set, yielding a 12-valued vector of pc interval multiplicities.For example, the interval content from {C,D} to {C],D]} is (0, 2, 0, 1, 0, 0, 0, 0, 0, 0, 0, 1),indicating that there are two ways to move by pc interval 1 (C→C] and D→D]), one wayto move by pc interval 3 (C→D]), one way to move by pc interval 11 (D→C]), and noways to move by any other interval.3 In the special instance of the interval content from aset to itself, the interval content within a set, we will use the shorthand ICA,A = ICA.
1 My thanks to Nancy Rogers and an anonymous reviewer for comments that greatly improved this paper.2 The reader is strongly directed to Amiot [1] for an excellent and detailed presentation of the interval
function and its relation to recent applications of the discrete Fourier transform in music theory.3 Multiplicity of pc interval i is indicated by the ith component of the interval function, which begins with
pc interval 0.

For complementary collections A and A, the intra-harmonies are a combination of theinterval content within each collection separately:
Aintra = ICA + ICA.
For example, setting W to be the white-key diatonic collection (W = {0, 2, 4, 5, 7, 9, 11}),the intra-harmonies for the white-key/black-key complementary collections are given by
Wintra = ICW + ICW
= (7, 2, 5, 4, 3, 6, 2, 6, 3, 4, 5, 2) + (5, 0, 3, 2, 1, 4, 0, 4, 1, 2, 3, 0)
= (12, 2, 8, 6, 4, 10, 2, 10, 4, 6, 8, 2).
Similarly, for complementary collections, the inter-harmonies combine the interval con-tent that obtains exclusively between the two collections:
Ainter = ICA,A + ICA,A.
For complementary collections, A and A, ICA,A = ICA,A. Thus,
Ainter = 2 · ICA,A.
For example, again setting W to be the white-key diatonic collection, the inter-harmoniesfor the white-key/black-key complementary collections are given by
Winter = 2 · ICW,W
= 2 · (0, 5, 2, 3, 4, 1, 5, 1, 4, 3, 2, 5)
= (0, 10, 4, 6, 8, 2, 10, 2, 8, 6, 4, 10).
For a given pair of complementary collections, any pc interval must occur either withinor between the collections, and thus the intra- and inter-harmonies exhaust the set ofpossible pc intervals:
Aintra +Ainter = ICZn = (n, . . . , n).
Figure 2 shows graphs of the intra- and inter-harmonies for two different pairs of comple-mentary collections. Note that the distributions of intra- and inter-harmonies for Figure2a are fairly uneven, while the distribution in b is nearly flat. Collections in which theinterval content is highly uneven may be thought to be more distinctive, since the intervalcontent is dominated by only a few (and therefore salient) pc intervals. Contrarily, whenthe interval content is very flat, the corresponding collections cannot be typified by a lim-ited number of distinct pc intervals. In this sense, there is a strong correlation between the“distinctiveness” of a collection and the unevenness of its interval content.
We can measure the unevenness of a collection’s interval content by taking its standarddeviation. For example, the interval content of the “flat” hexachord from Figure 2b has a

(a) (b)
Fig. 2: Histograms of intra- and inter-harmonies for a) white key/black key collections and b) “flat” hexa-chord {C, D, D], E, F, G]} and its complement
standard deviation of σ(IC{0,2,3,4,5,8}) = 1.0, while that of the whole-tone collection (withits maximally uneven interval content of all even intervals and no odd intervals) has astandard deviation of σ(IC{0,2,4,6,8,10}) = 3.0. The standard deviation of the white-keyinterval content lies between these two extremes: σ(IC{0,2,4,5,7,9,11}) ≈ 1.66.4
As measured by the standard deviation of interval content, a collection and its comple-ment are equally distinctive:5
σ(ICA) = σ(ICA).
Moreover, the distinctiveness of the intra-harmonies is the same as the inter-harmonies:
σ(Aintra) = σ(Ainter).
Since Ligeti’s favorite complementary collections, including diatonic, pentatonic, whole-tone, Guidonian and similar collections, are all highly distinctive, this ensures that theinterval content between these collections and their complements will also be highly dis-tinctive.
This does not, however, guarantee that the intra- and inter-harmonies will also be highlydifferentiated. In order to measure this differentiation, we can take the magnitude of thedifference of the two vectors:
‖Ainter −Aintra‖2.
For example, let W be the white-key collection and X be the “flat” hexachord {0,2,3,4,5,8}.The Euclidean distance between the intra- and inter-harmonies for the diatonic collectionis nearly 24 (‖Winter − Wintra‖2 ≈ 23.98), while the corresponding distance for the flathexachord is nearly only 14 (‖Xinter −Xintra‖2 ≈ 13.86), reflecting the high differentiation
4 The distinctiveness of a collection, A, can also be measured in terms of the magnitude of its intervalcontent, ‖ICA‖2. (See Callender [4].) For the present purposes, the standard deviation is preferable.
5 This follows directly from the complement theorem. See Hanson [6] and Lewin [7].

of intra- and inter-harmony distributions in Figure 2a and relatively low differentiation in2b.6
More generally for complementary collections, there is a strong relationship betweenthe differentiation of intra- and inter-harmonies and the distinctiveness of the collections.If complementary collections A and A are the same cardinality, then
‖Ainter −Aintra‖2 ∝ σ(ICA).
(Specifically, for a chromatic universe of C pitch classes, ‖Ainter−Aintra‖2 = 4√C ·σ(ICA).)
If the cardinalities are nearly equal, then the relation is nearly, though not exactly, pro-portional. Thus, highly distinctive collections indeed posses highly differentiated intra- andinter-harmonies. By working with highly distinctive collections, Ligeti ensures that therewill be maximal variation between the melodic and harmonic components of the resultingcombinatorial tonality.
3 Desordre
Returning to the opening of Desordre (Figure 1), we would like to answer the followingquestion: To what extent does Ligeti exert control over the note-against-note harmonies inthe etude? The opening of Desordre consists of two layers that persist throughout the entireetude. The accented notes correspond to a highly complex isorhythmic structure, detailedin Kinzler [9], in which the left and right hands have very similar but non-identical colores(sequences of pitches) and taleae (sequences of durations). While the accents of the twohands are synchronized in the beginning of the etude, they quickly become misaligned, dueto the slight difference in their taleae. Unaccented notes are not a part of the isorhythmicstructure, but rather form a second layer consisting of generally ascending scalar fragmentsused to smoothly connect the accented notes. Perhaps the harmonic relations at any pointare simply the result of the particular and temporary configuration of the two hands withinthe overarching isorhythmic structure. If this is the case, then over a large enough spanof time the observed harmonies will be equivalent to the result of repeated random se-lection from the distribution of possible harmonies between the two collections. In otherwords, as the etude progresses, the distribution of observed harmonies will converge on thedistribution of the inter-harmonies.
In the opening line of Desordre (Figure 1), tritones and minor sixths predominate,while there are almost no minor second/major sevenths or perfect fourths/fifths. The lackof interval class (ic) 5 is easily explained by the relative lack of this interval in the inter-harmonies. However, the relative lack of ic 1 may indicate some degree of control on thepart of the composer, since there are plenty of minor seconds/major sevenths spanning the
6 Measuring the distance between intra- and inter-harmonies using other metrics, such as angular (orcosine) distance, yields similar relative distances. (See Rogers [11].) The Euclidean metric is sufficientand advantageous for the present purposes.

two collections. Does this favoring of tritones and minor sixths (major thirds) over minorseconds/major sevenths persist?
Figure 3 gives the normalized actual (observed) and expected interval distributions forthe first section of the etude, concluding with the climax on the first downbeat on thesixth page of the published score.7 (Intervals are reckoned between hands interpreted aspitch-class sets.) There is a noticeable emphasis on ic 6 and de-emphasis on ic 1. In hisdissertation on harmony and counterpoint in Ligeti’s Etudes, Quinnett [10] presents a com-parison of observed and expected interval counts of the first section of Desordre dividedinto two parts, with the second part beginning where the accents of the two hands tem-porarily become (mostly) realigned (t2, beginning just before the bottom system on page2 of the score). (See Figures 4 and 5.) Quinnett notes that the interval profile of the firstsection heavily favors tritones and minor sixths/major thirds over minor seconds/majorsevenths, while the interval content for the second section is much more similar to theexpected distribution.
Fig. 3: Histograms of observed and expected intervals in the first section of Desordre
Why are the observed and expected distributions of the second part much more similarthan in the first section? Quinnett suggests that this is due to the progressive rhythmicdiminution of the isorhythmic structure that begins in the second part. As the durations ofthe talea decrease, the density of accented notes from the color increases, and the freedomthat Ligeti had in his choice of pitches diminishes. Thus, as discussed above, we wouldexpect the interval content to become increasingly governed by the distribution of intervalsin the inter-harmonies. While the histograms of Figures 3 and 5 and Quinnett’s explanationsare suggestive, in what follows we will briefly consider the statistical significance and sizeof the differences between the observed and expected interval distributions, look at theprogression of the observed intervals at a finer level of detail, and consider alternative
7 Statistical analysis of Desordre was greatly aided by Cuthbert’s music21 [5], which is a Python toolkitfor computer-aided musicology.

Fig. 4: Passage before and after the realignment of accents, marked by the vertical bar at t2. Instances ofinterval class 1 are marked with asterisks.
(a) (b)
Fig. 5: Histograms of observed and expected intervals in the a) first and b) second part of the first sectionof Desordre (after Quinnett [10])
explanations for the convergence of observed and expected intervals toward the end of thefirst section.8
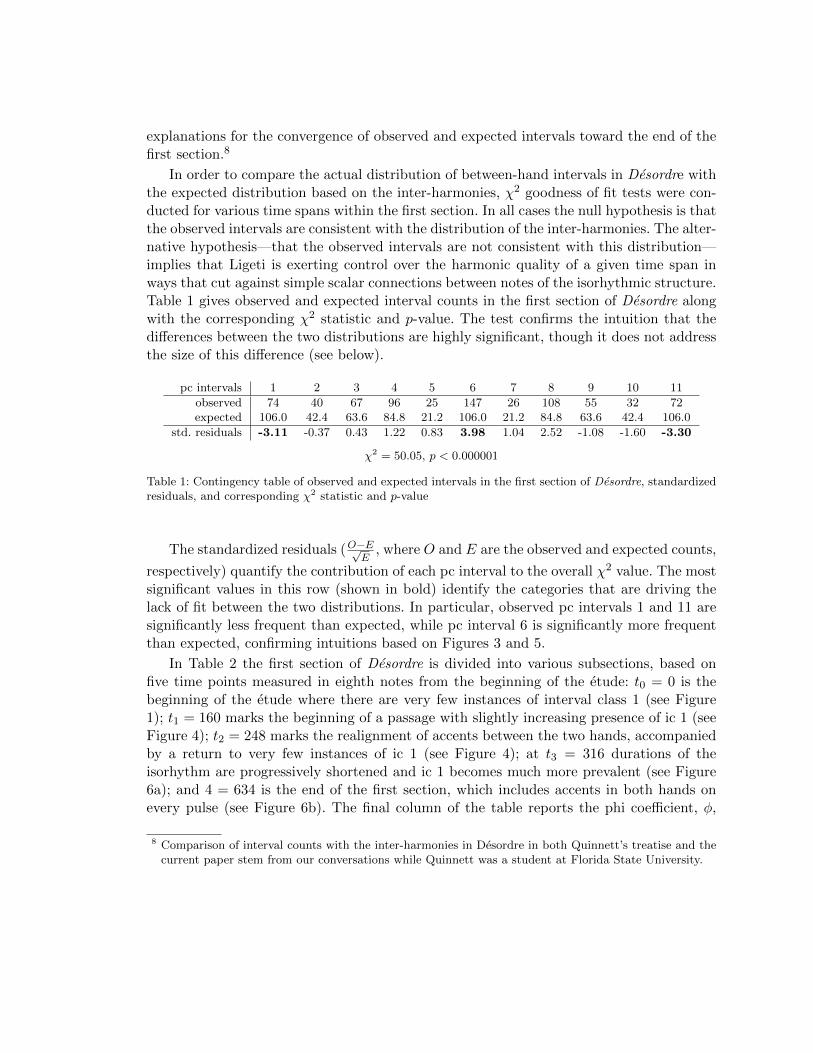
In order to compare the actual distribution of between-hand intervals in Desordre withthe expected distribution based on the inter-harmonies, χ2 goodness of fit tests were con-ducted for various time spans within the first section. In all cases the null hypothesis is thatthe observed intervals are consistent with the distribution of the inter-harmonies. The alter-native hypothesis—that the observed intervals are not consistent with this distribution—implies that Ligeti is exerting control over the harmonic quality of a given time span inways that cut against simple scalar connections between notes of the isorhythmic structure.Table 1 gives observed and expected interval counts in the first section of Desordre alongwith the corresponding χ2 statistic and p-value. The test confirms the intuition that thedifferences between the two distributions are highly significant, though it does not addressthe size of this difference (see below).
pc intervals 1 2 3 4 5 6 7 8 9 10 11
observed 74 40 67 96 25 147 26 108 55 32 72expected 106.0 42.4 63.6 84.8 21.2 106.0 21.2 84.8 63.6 42.4 106.0
std. residuals -3.11 -0.37 0.43 1.22 0.83 3.98 1.04 2.52 -1.08 -1.60 -3.30
χ2 = 50.05, p < 0.000001
Table 1: Contingency table of observed and expected intervals in the first section of Desordre, standardizedresiduals, and corresponding χ2 statistic and p-value
The standardized residuals (O−E√E
, where O and E are the observed and expected counts,
respectively) quantify the contribution of each pc interval to the overall χ2 value. The mostsignificant values in this row (shown in bold) identify the categories that are driving thelack of fit between the two distributions. In particular, observed pc intervals 1 and 11 aresignificantly less frequent than expected, while pc interval 6 is significantly more frequentthan expected, confirming intuitions based on Figures 3 and 5.
In Table 2 the first section of Desordre is divided into various subsections, based onfive time points measured in eighth notes from the beginning of the etude: t0 = 0 is thebeginning of the etude where there are very few instances of interval class 1 (see Figure1); t1 = 160 marks the beginning of a passage with slightly increasing presence of ic 1 (seeFigure 4); t2 = 248 marks the realignment of accents between the two hands, accompaniedby a return to very few instances of ic 1 (see Figure 4); at t3 = 316 durations of theisorhythm are progressively shortened and ic 1 becomes much more prevalent (see Figure6a); and 4 = 634 is the end of the first section, which includes accents in both hands onevery pulse (see Figure 6b). The final column of the table reports the phi coefficient, φ,
8 Comparison of interval counts with the inter-harmonies in Desordre in both Quinnett’s treatise and thecurrent paper stem from our conversations while Quinnett was a student at Florida State University.

which is a χ2-based measure of effect size: φ=
√χ2
n , where n is the number of samples in
the data. Larger values for φ indicate a greater difference between the two distributions.9
(a)
***** ********
(b)
Fig. 6: a) section before and after time point t3, b) section immediately before the end of the first section(t4). Asterisks indicate instances of interval class 1.
begin end p-value φ
t0 t4 < 0.0001 0.26
t0 t2 < 0.0001 0.60t2 t4 0.91 0.10
t0 t1 < 0.0001 0.72t1 t2 0.01 0.49
t2 t3 < 0.0001 0.79t3 t4 0.96 0.10
Table 2: Comparison of observed and expected intervals for various time spans in the first section of Desordrewith p-values and reduced phi coefficients (φν) for χ2 goodness of fit tests
The results of Table 2 suggest that perhaps Ligeti exerted a finer degree of intervalliccontrol than can be captured by dividing the opening section into two large parts as inFigure 5. Row 1 of the table repeats the test from Table 1 of the entirety of the first
9 Note that because there are more than a single degree of freedom in the data, φ is not normalized to amaximum of 1.

section. Rows two and three divide the section into two parts. In first part, from t0 tot2, the difference between observed and expected intervals is significant and also has alarger effect size than the entire section. In the second part, from t2 to t4, the differencesare not significant and the effect size is correspondingly very low. Time point t1 dividesthe time span from t0 to t2 into two subparts in rows four and five, and time point t3similarly divides the span from t2 to t4 in rows six and seven. In both pairs of rows thefirst subpart differs strongly from the expected interval distribution, while the effect sizeis lower in the second subpart due to the increase in the prevalence of interval class 1.This is particularly true in the time span beginning at t3. The upshot is that changes inthe interval distribution support a division of the opening section into two parts, with asignificant return to synchronized accents and avoidance of ic 1 at t2. This sense of returnis enhanced by the slight increase in ic 1 in the span from t1 to t2.
These changes in the intervallic distribution over the course of the first section canbe seen more clearly in Figure 7, which plots φ for a moving window of 65 eighth notes.Here, φ is based on a χ2 goodness of fit test consisting of only two categories of intervals:those that belong to interval class 1 and those that do not. This graph demonstrates thatthe changes in harmonic content noted in Table 2 happen abruptly rather than gradually.(This is evident even though the transitions between regions of higher and lower values forφ are smoothed by the moving-window analysis.) Regions of lower values for φ are eithermostly or almost entirely below the lines indicating various significance levels, whereasregions of higher values are almost entirely above these lines. These abrupt transitions aswell as the return at t2 of the intervallic content of the opening complicate the earlierexplanation of the changing harmonic distribution over the course of the section. If thesechanges were simply the result of the progressive rhythmic diminution of the isorhythmicstructure (beginning at t3) and the consequent lack of harmonic freedom, the values forφ in Figure 7 would remain consistently high until t3 and then gradually decrease. Ligetiappears to be exerting control in switching from one distribution to the other.
To the extent that the quickening of the isorhythms plays a role in the differing inter-vallic distributions of the two parts, might there be other factors involved? Perhaps as thehands drift apart toward the registral extremes of the piano, Ligeti became less concernedwith note-against-note harmonies, since the increased distance between the two hands en-courages the perception of two independent streams and makes it difficult to perceive thequality of the between-hand intervals. The challenge in assessing the relative strengths ofthese two explanations is that interval size and talea durations are strongly (inversely)correlated.
One approach to separating these factors is to divide intervals for each time point by sizeand whether or not an accent is present. (Recall that accents always and only accompanyelements of the isorhythm, so the presence of accents can be used as an indicator for thepresence of the isorhythm.) In Figure 8 intervals throughout the first section of Desordreare divided into categories based on small (S) or large (L) interval size and presence (T)or lack (F) of accents. (Small intervals are no larger than two octaves. Pitch intervals in-

Fig. 7: Moving-window analysis of observed vs. expected frequency of interval class 1 in the first section ofDesordre. Larger values for φ correspond to a greater difference between observed and expected frequencies.Window size is 65 eighth notes. Expected frequencies are based on the inter-harmonies. Time points t1, t2,and t3 are indicated with vertical lines. Lines running across the graph indicate values for φ correspondingto various levels of significance.
volving octaves are reckoned from the lower note of the octave.) For example, the intervalin the first eighth note of the etude belongs to the category ‘S-T’, since it is less than twooctaves and the time point contains at least one accent. The interval of 30 semitones onthe unaccented time point immediately before t3 (Figure 6a) belongs to the category ‘L-F’.
Fig. 8: Prevalence of interval classes 1 and 6 for intervals divided into categories of small or large intervalsize and with or without accent(s). (Small intervals are no larger than two octaves.)
The plot on the left of Figure 8 shows the ratio of interval class 1 for each category,while the plot on the right shows the ratio of interval class 6. (Recall that interval classes 1and 6 had the highest standardized residuals in Table 1 and were most responsible for the

divergence between observed and expected interval frequencies.) As the categories progressfrom ‘small intervals without accents’ to ‘large intervals with accents’ there is a clear trendin the ratios of both interval classes from their (de-)emphasis at the beginning of the etudetoward their expected ratios corresponding to the inter-harmonies, though not all of thedifferences between categories are significant. Table 3 summarizes the significance and effectsize for interval classes 1 and 6 when holding interval size constant while varying presenceof accents and vice versa. For both interval classes there is a significant and moderateeffect of the presence of accents when the interval size is small and of interval size whenno accents are present. There is a small and borderline significant effect of interval sizewhen accents are present and a notable lack of effect of the presence of accents when theinterval size is large. Taken together, the prevalence of these two interval classes differsnoticeably from the inter-harmonies when both the size of the interval is not greater thantwo octaves and no accents are present; when neither of these conditions is present, theprevalence of these interval classes does not differ strongly from the inter-harmonies. Thus,both explanations seem to be justified—the isorhythmic structure limited Ligeti’s freedomin controlling note-against-note harmonies and Ligeti exerted less control over harmonicintervals as the hands drifted apart, forming independent streams, and focusing the lis-tener’s attention on the intra- rather than inter-harmonies.
categories ic 1 ic 6
small size, accent varies p < .0001, φ = .23 p < .01, φ = .14large size, accent varies p = .34, φ = .05 p = .60, φ = .03no accent, size varies p < .001, φ = .24 p < .02, φ = .15
1 or 2 accents, size varies p = .07, φ = .08 p < .05, φ = .09
Table 3: Significance and effect size for prevalence of interval classes 1 and 6 depending on interval size andpresence of accents
References
1. Amiot, E. Music Through Fourier Space. Springer (2016)2. Bossin, J.: Gyorgy Ligeti’s New Lyricism and the Aesthetic of Currentness: The Berlin Festival’s Retro-
spective of the Composer’s Career. Current Musicology, 37(8) (1984)3. Bregman, A.: Auditory Scene Analysis: The Perceptual Organization of Sound. MIT Press (1994)4. Callender, C.: Continuous Harmonic Spaces. Journal of Music Theory, 51(2), 277–332 (2007)5. Cuthbert, M.: Music21: a toolkit for computer-aided musicology. http://web.mit.edu/music21/6. Hanson, H. The Harmonic Materials of Twentieth-Century Music. Appleton-Century-Crofts, New York
(1960)7. Lewin, D. Generalized Music Intervals and Transformations. Oxford University Press (1987)8. Lewin, D. Forte’s Interval Vector, My Interval Function, and Regener’s Common-Note Function. Journal
of Music Theory, 21(2), 194–237 (1977)9. Kinzler, H. Decision and Automatism in ‘Desordre’: 1re Etude, Premier Livre. Interface, 20(2), 89–124
(1991)10. Quinnett, L. Harmony and Counterpoint in Ligeti Etudes, Book I: An Analysis and Performance Guide.
Florida State University, doctoral treatise. (2014)11. Rogers, D. A Geometric Approach to Pcset Similarity. Perspectives of New Music, 37(1), 77–90 (1999)12. Steinitz, R.: The Dynamics of Disorder. The Musical Times, 137(1839), 7–14 (1996)