completion report - crystal blue · pdf filebhendi and tomato as test crops. ... adopting...
TRANSCRIPT


COMPLETION REPORT
on
Performance of Structured Water on Growth, Yield and Quality of Cotton and Vegetables
TAMIL NADU AGRICULTURAL UNIVERSITY
WATER TECHNOLOGY CENTRE
COIMBATORE-641 003
Sponsored by VWF Industries Pvt. Ltd, Mysore


ld
ch
the
on
t on
lity
ake
with


2
II. Materials and methods (First year 2013 – 2014)
To assess the effectiveness of structured water unit on plant growth, yield, soil properties
and nutrient uptake the field experiments were conducted during 2013 – 14 employing cotton,
bhendi and tomato as test crops. To ascertain its role in improving the irrigation water quality,
two separate field trials, one at Agricultural College and Research Institute (TNAU), Coimbatore
employing test crop as cotton and two more field trials at farmer’s field in Thondamuthur block
employing test crop as tomato and bhendi were carried out for confirmation of results. The
details of the experimental materials used and the methods adopted are presented below.
1. Crop: Cotton
Sowing of cotton was taken up with the Hybrid Bunny Bt (NCS 145) on 21.08.2013 by
adopting paired row system in drip irrigation method. The recommended fertilizer dose of
150:75:75 kg NPK ha-1 was given through fertigation and cotton picking was completed on
25.03.2014.
Treatments
T1 - Drip irrigation with ordinary water
T2 – Drip irrigation with 100% structured water
T3 - Drip irrigation with 75% structured water Design and layout
The layout plan of the experimental field is depicted in Fig.1.
Gross plot size: 12 m x 21 m = 252 m2
Outs
Normal water
Buffer
100% structured water
Buffer
75% structured water
Outs
Fig.1. Layout plan of the experimental field of cotton
2 m
2
m
2 m
4.
4 m
12 m
12
m
12 m
21 m
3
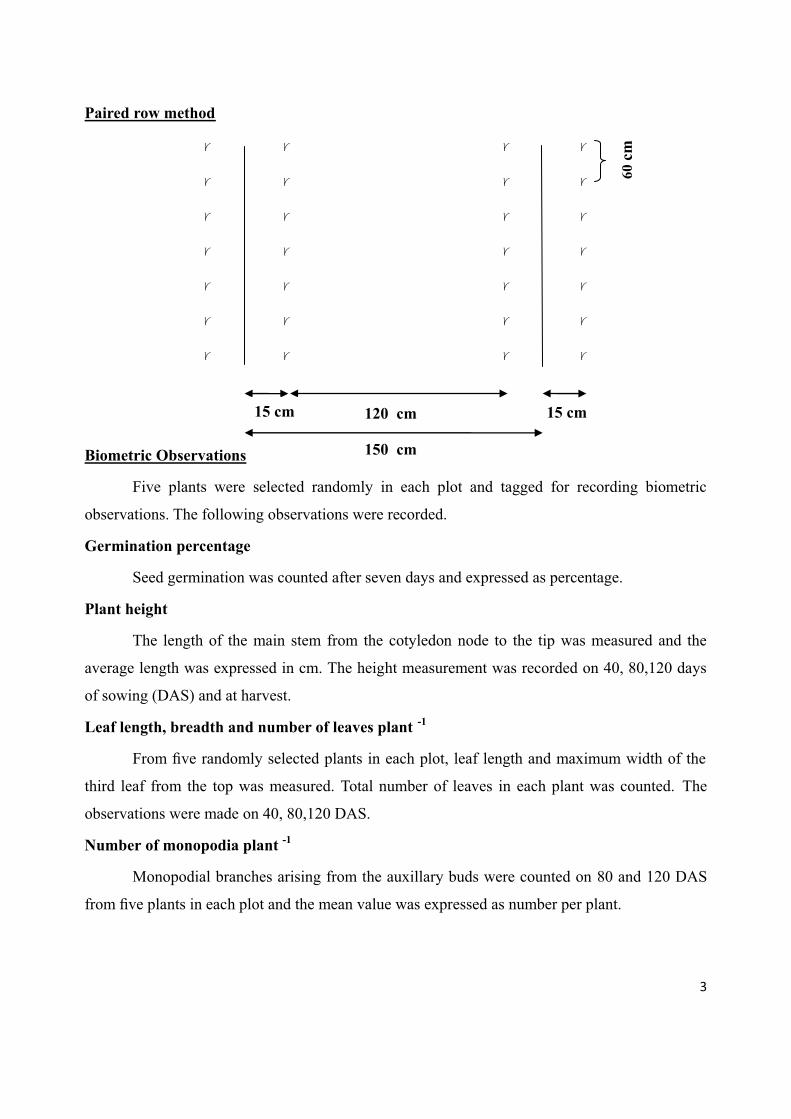
Paired row method
r
r
r
r
r r r r
r r r r
r r r r
r r r r
r r r r
r r r r
Biometric Observations
Five plants were selected randomly in each plot and tagged for recording biometric
observations. The following observations were recorded.
Germination percentage
Seed germination was counted after seven days and expressed as percentage.
Plant height
The length of the main stem from the cotyledon node to the tip was measured and the
average length was expressed in cm. The height measurement was recorded on 40, 80,120 days
of sowing (DAS) and at harvest.
Leaf length, breadth and number of leaves plant -1
From five randomly selected plants in each plot, leaf length and maximum width of the
third leaf from the top was measured. Total number of leaves in each plant was counted. The
observations were made on 40, 80,120 DAS.
Number of monopodia plant -1
Monopodial branches arising from the auxillary buds were counted on 80 and 120 DAS
from five plants in each plot and the mean value was expressed as number per plant.
60 c
m
120 cm 15 cm 15 cm
150 cm

4
Number of sympodia plant -1
The number of reproductive branches arising from extra auxillary buds was counted on
80 and 120 DAS from five plants in each plot and the mean value was expressed as number per
plant.
Root length
The depth of the root was measured and the average length was expressed in cm on 40
DAS.
Number of bolls plant -1
From five randomly selected plants in each plot, the number of bolls picked per plant was
totaled up for all the pickings and the average worked out to arrive at number of bolls plant -1.
Seed cotton yield
The seed cotton was gathered in each plot at fortnightly intervals and weighed. The seed
cotton yield was totaled up for all the pickings and expressed in kg ha-1.
Drip - uniformity co – efficient
The uniformity describes how evenly an drip irrigation system distributes water over a
field. It is regarded as one of the important features for selection, design and management of the
drip irrigation system.
In uniformity studies the water was collected from emitters in a container for 15
minutes. Ten samples were collected per treatment. The volume of collected sample was
measured by using measuring cylinder (ml/15 min) and converted to litre per hour. The
uniformity co-efficient was calculated by using the formula,
UC = { 1 - [1/nqa * ∑|qi -qa| }* 100
Where,
UC – Uniformity co-efficient
n = Number of observed emitters or cans
qi = Emitter flow rate L/hr
qa = Average Emitter flow rate L/hr
Quality Parameters in cotton
Ginning percentage
100 g of kapas was weighed and the lint and seed were separated, then the ratio of
weight of lint to weight of seed was expressed as percentage.

5
Lint index
From the weight of lint from 100g of seed cotton obtained as described above, the weight
of lint on 100 seed cotton was computed.
Seed index
The seeds obtained after assessing the ginning percentage were counted and weighed.
The average weight of 100 seeds was expressed as seed index.
2. Crop: Tomato
Transplanting of tomato was taken up with the variety of Bhagiyavan on 05.09.2013 by
adopting drip irrigation method with the spacing of 120 x 60 cm. Recommended fertilizer dose
of 200:150:150 kg NPK ha-1 was given through fertigation. Totally 7 irrigation was given to the
crop.
Treatments
T1 - Ordinary water
T2 - Structured water
Design and layout
The layout plan of the experimental field is depicted in Fig.2.
Gross plot size: 40 m x 29 m = 1160 m2
Structured water
Normal water
Fig.2. Layout plan of the experimental field of tomato
Bu
ffer
40 m
29 m 29 m 3 m

6
Biometric observation
Five plants were selected randomly in each plot and tagged for recording biometric
observations. The following observations were recorded.
Plant height
The distance between the cotyledonary node to the tip of the main stem was measured
using a meter scale at 30, 60 and 90 DAP and the mean value was expressed in centimeter (cm).
Number of Primary branches
The branches that arise from the main stem were reckoned as primary branches which
were counted at 30, 60 and 90 DAP and expressed in number per plant.
Number of Secondary branches
The branches that arise from the primary branches were reckoned as secondary branches
which were counted at 30, 60 and 90 DAP and expressed in number per plant.
Number of flowers plant-1
Numbers of flowers were counted at 60 and 90 DAP from lower, middle and upper parts
of the plant, the mean number of flowers per plant was computed.
Number of fruits plant-1
The fruits collected in each harvest were totaled and the mean was expressed as number
plant-1.
Yield plot-1 / Yield ha-1
The fruits at each harvest were weighed using an electronic balance and the cumulative
weights over all the harvests were recorded and the mean value was expressed as kg plot-1 and
then converted to kg ha-1.
Quality parameters in tomato
Acidity
Acidity as citric acid was estimated following the method of AOAC and expressed in
percentage.
Ascorbic acid
Ascorbic acid in tomato pulp was estimated following the procedure given in AOAC and
the same was expressed in mg/100g of fresh sample.

7
Total soluble solids
The total soluble solids of tomato pulp was found out through a hand refractrometer and
expressed as percentage.
Total sugars
The total sugars were estimated as per the procedure given by Somoigyi (1952) and
expressed in percentage.
3. Crop: Bhendi
Sowing of bhendi (var.102) was taken up on 07.10.2013 by adopting drip irrigation method
with the spacing of 45 x 30 cm. Recommended fertilizer dose of 200:100:100 kg NPK ha-1 was
given through fertigation. Totally five irrigation was given to the crop during the growth period.
Treatments
T1 - Ordinary water
T2 - Structured water
Design and layout
The layout plan of the experimental field is depicted in Fig.3.
Gross plot size: 40 m x 17.4 m = 696 m2
Structured water
Normal water
Fig.3. Layout plan of the experimental field of bhendi
Bu
ffer
40 m
17.4 m 3 m 17.4 m

8
Biometric observation
Five plants were selected randomly in each plot and tagged for recording biometric
observations. The following observations were recorded.
Germination percentage
Seed germination was counted after seven days and expressed as percentage.
Plant height
The height was measured from a fixed point (i.e.) just above soil surface level to the
growing tip of the main shoot at 30, 60 and 90 DAS and expressed in cm.
Number of leaves
Total number of leaves was counted at 30, 60 and 90 DAS and expressed in numbers.
Leaf length and breadth
The 3rd leaf length and breadth from the top was measured 30, 60 and 90 DAS and
expressed in cm.
Number of fruits
Total number of fruits harvested from the selected plants till the final harvest was
recorded and expressed as number of fruits per plant.
Fruit length and girth
The length and girth of the fruit was measured using a meter scale and expressed in cm.
Yield plot-1 / Yield ha-1
The fruits at each harvest were weighed using an electronic balance and the cumulative
weights over all the harvests were recorded and the mean expressed as kg plot-1 and then
converted to kg ha-1.

9
III. Materials and methods ( Second year 2014 – 2015)
The confirmation field experiments were conducted during 2014 – 15 employing
sorghum and onion as test crops at farmer’s field in Sulur, Coimbatore (Dt) and at farmer’s field
in Vellode , Erode (Dt). The details of the experimental materials used and the methods adopted
are presented below.
4. Crop: Sorghum
Sowing of sorghum was taken up with the local variety on 06.09.2014 by adopting surface
irrigation method. The recommended fertilizer dose of 90:45:45 kg NPK ha-1 was applied and
totally four irrigation was given to the crop.
Treatments
T1 - Ordinary water
T2 - Structured water
Design and layout
The layout plan of the experimental field is depicted in Fig.4.
Gross plot size: 9 m x 7.5 m = 67.5 m2
Structured water
Normal water
Fig.4. Layout plan of the experimental field of sorghum
Bu
ffer
9 m
7.5 m 6 m 7.5 m

10
Biometric observation
Ten plants were selected randomly in each plot and tagged for recording biometric
observations. The following observations were recorded.
Plant height
Plant height is measured from ground level to the tip of the top most leaf at 30, 60 and 90
DAS.
Leaf length, Leaf breadth and Number of leaves plant-1
Length and width (at the broadest part of lamina) of the fourth leaf from top and number
of leaves per plant were recorded at 30, 60 and 90 DAS.
Root length
Plants were uprooted with extra care to extract the maximum amount of roots. The
distance from the base to the tip of the longest root was measured in cm at 30, 60 and 90 DAS.
Root spread
Root spread was measured on 30, 60, 90 DAS and at harvest by brushing the roots
uniformly on a table and the maximum distance between two extreme ends was measured.
Dry matter production
Five plants were selected from the sample rows in each plot at 30, 60 and 90 DAS and
oven dry weight of samples were taken and dry matter production was expressed in kg ha -1.
Grain yield
Earheads from each net plot were dried, threshed and the weight of cleaned grain at 14%
moisture was recorded and grain yield was expressed in kg ha -1.
5. Crop: Onion
Planting of onion was taken up with the local variety as an intercrop in coconut on
12.10.2014 by adopting surface irrigation method. The recommended fertilizer dose of 60:60:30
kg NPK ha-1 was applied and totally four irrigation was given to the crop.
Treatments
T1 - Ordinary water
T2 - Structured water

11
Design and layout
The layout plan of the experimental field is depicted in Fig.5.
Gross plot size: 14 m x 4 m = 56 m2
Structured water
Normal water
Fig.5. Layout plan of the experimental field of onion
Plant height
The height of the plant from ground level to the tip of leaf was measured and recorded in
centimeter at the stage of 30, 60 and 90days after planting and at the time of harvest.
Number of leaves plant -1
Total number of leaves plant -1 was recorded at the stage of 30, 60 and 90 days after
planting and at the time of harvest.
Leaf length and breadth
The 3rd leaf length and breadth from the base of the leaf (viz.) neck of the bulb to the tip
of the leaf was measured and recorded in centimeter during vegetative stage.
Onion yield
Onion picked at harvest was weighed by using an electronic balance and expressed as kg
plot-1 and converted to kg ha-1.
Bu
ffer
14 m
4 m 3 m 4 m

12
6. Crop: Tapioca
Planting of tapioca was taken up with Vijaya variety on 02.03.2014. Crop was harvested on
12.02.2015 and recorded tuber yield starch content.
Treatments
T1 - Ordinary water
T2 - Structured water
Plot size
Gross plot size: 47 m x 21.5 m = 1010.5 m2 = 25 cents = 0.25 acre.
Chemical analysis of plant and soil
Name of the analysis Methodology Reference
A. Plant analysis (nutrient uptake)
Nitrogen Micro Kjeldahl method Humphries, 1956
Phosphorus Triple acid digestion method Jackson, 1973
Potassium Triple acid digestion method Jackson, 1973
B. Soil analysis (available soil nutrient)
Soil reaction (pH) pH meter with glass electrode (soil water ratio 1:2.5)
Jackson (1973)
Electrical Conductivity (EC)
Conductometry Jackson (1973)
Organic Carbon Chromic acid wet digestion Walkley and black (1934)
Nitrogen Alkaline permanganate method Subbiah and Asija, 1956
Phosphorus Olsens method Olsen et al., 1954
Potassium Neutral normal ammonium acetate method
Stanford and English, 1949

13
Water analysis method
Analysis Method adopted Reference
pH Potentiometry using combined electrode pH Meter
United states salinity laboratory staff (1968)
Electrical Conductivity
Conductometry using a Conductivity Bridge
United states salinity laboratory staff (1968)
Sodium Flame Photometric Method Stanford and English (1949)
Potassium Flame Photometry Stanford and English (1949)
Calcium Versanate titration Method Diehl et al. (1950)
Magnesium Versanate titration Method Diehl et al. (1950)
Chloride Mohr’s Method Association of Official Agricultural Chemist (1950)
Sulphate Turbidoi]ometric Method Tandon (1995)
Carbonates and bicarbonates
Titrimetric Method Association of Official Agricultural Chemist (1950)
Economic analysis
i. Gross return
Gross return was computed by multiplying the crop yield in respective treatments with
the unit market price of the produce and expressed as kg ha-1.
ii. Net return
The net return was worked out for all the treatment by subtracting the cost of cultivation
from the gross return and expressed as kg ha-1.
iii. Benefit cost ratio
Benefit cost ratio was computed using the formula given below.
�: Cratio =Grossreturn(Rs./ha)
Costofcultivation(Rs./ha)

14
IV. Results (2013 – 2014)
(i) Impact of structured water unit on water quality:
Irrigation Water samples for the proposed study was collected before and after treatment
with structured water unit. These samples were analysed for pH, Electrical Conductivity and
Total Dissolved Solids (TDS), Cations (Ca, mg, Na, K) and Anions (CO3, HCO3, Cl, SO4),
Biological Oxygen Demand (BOD) and Chemical Oxygen Demand (COD). The results are
furnished in Table.1 and Table.2.
Table 1. Characteristics of Structured and Ordinary Water (WTC - irrigation cafeteria)
Parameters Ordinary Water Structured Water
pH 7.15 7.52
EC (dS m-1) 1.03 1.05
TDS (mg l-1) 659 672
Calcium (cmol p+ kg-1) 3.96 4.54
Magnesium (cmol p+ kg-1) 1.24 1.76
Sodium (cmol p+ kg-1) 4.54 5.11
Potassium (cmol p+ kg-1) 0.39 0.52
Carbonates (cmol p+ kg-1) -- --
Bicarbonates (cmol p+ kg-1) 5.90 5.92
Chloride (cmol p+ kg-1) 1.84 1.60
Sulphate (cmol p+ kg-1) 1.95 2.01
BOD (mg l-1) 29.0 27.0
COD (mg l-1) 82.0 80.0

15
Table 2. Characteristics of Structured and Ordinary Water (Farmer’s field)
Parameters Ordinary Water Structured Water
pH 7.71 7.78
EC (dS m-1) 0.90 0.97
TDS (mg l-1) 576 621
Calcium (cmol p+ kg-1) 2.52 2.90
Magnesium (cmol p+ kg-1) 1.56 1.36
Sodium (cmol p+ kg-1) 4.35 3.73
Potassium (cmol p+ kg-1) 0.41 0.44
Carbonates (cmol p+ kg-1) 0.12 0.14
Bicarbonates(cmol p+ kg-1) 6.59 6.87
Chloride (cmol p+ kg-1) 1.46 1.28
Sulphate (cmol p+ kg-1) 0.23 0.57
Table 3. Initial soil characteristics of the experimental field
Parameters WTC - Irrigation Cafeteria Farmers field
pH 8.2 7.9
EC (dS m-1) 0.31 0.48
Organic Carbon (%) 0.65 0.52
Available N (kg ha -1) 225 233
Available P (kg ha -1) 16.1 14.6
Available K (kg ha -1) 525 496
The initial soil characteristics of the experimental field (Irrigation Cafeteria at
Agricultural College and Research Institute (TNAU), Coimbatore and farmer’s field in
Thondamuthur block is given in Table.3.

16
(ii) Studies on the field efficacy of structured water unit on growth, yield and quality of
cotton:
The results of the experiments on growth, yield parameters and economic returns of
cotton are presented below.
Table 4. Effect of structured water on germination and growth parameters of cotto n at
40 DAS
Ordinary Water
75% Structured
Water
100% Structured
Water
% increase over ordinary
water (For 100% SW)
Germination (%) 64.5 82.5 90.4 40.2
Plant height (cm) 23.7 35.5 39.4 66.2
No. of leaves plant-1 24.5 44.0 50.1 104.5
Leaf length (cm) 4.5 9.0 10.3 129.0
Leaf breath (cm) 4.4 8.7 9.9 125.5
No. of monopodial branches plant-1
1.8 1.4 1.3 - 27.8
No. of sympodial branches plant-1
4.1 6.2 6.4 56.1
Root length (cm) 19.4 23.5 26.0 34.0
The effects of treatments on germination and growth parameters of cotton were
presented in Table 4. The results showed that, 100% structured water irrigation practice
recorded higher germination percentage (90.4%) and plant height (39.4 cm) at 40 DAS.
Irrigation with ordinary water recorded the lowest germination percentage (64.5%) and plant
height (23.7 cm). Number of leaves plant-1, leaf length, leaf breadth, number of sympodial
branches plant-1 and root length were also highly influenced by 100% structured water
irrigation compared with 75% structured water irrigation and ordinary water application except
number of monopodial branches plant-1.
Parameter
s
Treatment
s

17
Table 5. Effect of structured water on growth of cotton at 80 DAS
Ordinary
Water
75% Structured
Water
100% Structured
Water
% increase over ordinary
water (For 100% SW)
Plant height (cm) 43.3 90.7 91.4 111.1
No. of leaves plant-1 63.0 142.3 153.6 143.8
Leaf length (cm) 8.9 12.7 12.9 44.9
Leaf breath (cm) 7.9 11.3 12.1 53.2
No. of monopodial branches plant-1
1.3 1.3 1.8 38.5
No. of sympodial branches plant-1
8.3 14.3 15.0 80.7
No. of bolls plant-1 14.4 24.2 30.3 52.1
Among the different irrigation treatments, 100% structured water irrigation recorded
higher growth parameters viz., plant height, number of leaves plant-1, leaf length and leaf
breadth at 80 DAS (Table 5). The lowest growth parameters were observed under ordinary
water irrigation. The yield attributes viz., number of sympodial branches plant-1 (15) and
number of bolls plant-1 (30.3) were higher in 100% structured water irrigation practice except
number of monopodial branches plant-1. This was followed by 75% structured water irrigation.
Table . Effect of structured water on growth of cotton at 120 DAS
Ordinary
Water
75% Structured
Water
100% Structured
Water
% increase over ordinary
water (For 100%
SW)
Plant height (cm) 47.5 99.3 99.9 110.3
No. of leaves plant-1 133.4 132.2 137.3 2.9
Leaf length (cm) 8.9 12.6 12.9 44.9
Leaf breath (cm) 7.9 11.3 12.1 53.2
No.of monopodial branches plant-1 1.8 1.3 1.3 38.5
No. of sympodial branches plant-1 9.8 16.9 16.4 67.4
No. of bolls plant-1 11.7 20.4 21.9 87.2
Parameters
Treatment
s
Parameters
Treatment
s

18
Regarding different treatments, 100% structured water irrigation practice recorded
maximum plant height (99.9 cm), number of leaves plant-1 (137.3), leaf length (12.9 cm) and
leaf breadth (12.1 cm) at 120 DAS (Table 6). Irrigation with ordinary water recorded the
lowest plant height, number of leaves plant-1, leaf length and leaf breadth compared to other
treatments. Number of sympodial branches plant-1 and bolls plant-1 was also higher under
100% structured water irrigation compared with 75% structured water and ordinary water
irrigation except in number of monopodial branches plant-1.
Table 7. Effect of structured water on seed cotton yield (kg ha -1 )
Ordinary Water
75% Structured
Water
100% Structured
Water
% increase over ordinary water (For 100% SW)
plot -1 ha-1 plot -1 ha-1 plot -1 ha-1
36.6
I st picking 6.5 258 7.5 298 10.5 417
II nd picking 16.5 655 16.0 635 12.0 476
III rd picking 10.0 397 16.5 655 18.0 714
IV th picking 58.5 389 23.0 913 29.0 1151
Total 42.8 1699 54.0 2144 58.5 2321
Seed cotton yield was highly influenced by different treatments (Table 7). Irrigation with
100% structured water recorded the highest seed cotton yield of 2321 kg ha-1 with an yield
increase of 36.6% over ordinary water and it was followed by 75% structured water irrigation.
The lowest seed cotton yield (1699 kg ha-1) was obtained under odinary water irrigation.
Table 8. Effect of structured water on drip - uniformity co - efficient
Parameters Ordinary
Water
75% Structured
Water
100% Structured
Water
% increase over ordinary water (For 100% SW)
Uniformity co-efficient 86.92 % 91.69 % 92.78 % 6.74
The results of the drip uniformity co-efficient indicated that 100% structured water
irrigation treatment recorded higher drip uniformity co-efficient (92.78%) than the other
irrigation management practices (Table 8).
Table 9. Effect of structured water on post harvest soil properties
Treatment
s
Parameters

19
Ordinary
Water
75% Structured
Water
100% Structured Water
pH 8.20 8.22 8.22
EC (dS m-1) 0.31 0.31 0.30
Organic Carbon (%) 0.67 0.68 0.69
Available N (kg ha -1) 236 230 228
Available P (kg ha -1) 17.3 17.1 17.0
Available K (kg ha -1) 529 527 524
With regard to soil fertility, higher NPK content was observed under ordinary water
irrigation and this was followed by 75% structured water irrigation. The lowest NPK content
was recorded in 100% structured water application. Regarding pH, EC and organic carbon,
higher pH and organic carbon were registered with application of 100% structured water
irrigation compared to other treatments. Among the treatments, the difference was not exsist in
EC (Table 9).
Table 10. Effect of structured water on quality parameters in cotton
Ordinary Water 100% Structured Water
Ginning percentage 32.30 32.65
Lint index 38.94 40.09
Seed index 84.58 85.39
The results on quality of cotton (Table 10) showed that structured water irrigation
practice recorded higher ginning percent (32.65), lint index (40.09) and seed index (86.39).
Structured water irrigation showed increased quality in cotton while compared to ordinary
water irrigation.
Table 11. Effect of structured water on nutrient uptake (kg ha-1) of cotton at harvest
Parameters
Treatment
s
Parameters
Treatment
s

20
Ordinary Water
75 % Structured Water
100% Structured Water
80 DAS
120 DAS
80 DAS
120 DAS
80 DAS
120 DAS
N 55.58 74.24 59.83 86.75 63.71 90.46
P 11.46 17.16 12.19 18.98 12.92 21.18
K 54.86 94.48 59.14 96.31 68.67 104.79
The effect of treatments on nutrient uptake of cotton at 80 DAS and harvest is
presented in Table 11. The results showed that 100 % structured water irrigation practice
recorded higher nutrient uptake in both the stages of observation when compared to all other
treatments.
(iii) Studies on the field efficacy of structured water unit on growth, yield and quality of
tomato:
The results of the experiments on growth, yield parameters and economic returns of
cotton are presented below.
Table 12. Effect of structured water on growth of tomato at 30 DAP
Ordinary Water
Structured Water
% increase over ordinary water
Plant height (cm) 20.1 28.4 41.85
No. of primary branches plant-1 2.7 3.3 22.22
No. of secondary branches plant-1 4.9 7.5 53.06
The effect of treatments on growth of tomato at 30 DAP is presented in Table 12. Among
the treatments, structured water irrigation recorded the highest plant height (28.4 cm), number
of primary branches plant-1 (3.3) and number of secondary branches plant-1 (7.5) compared to
ordinary water irrigation practice.
Table 13. Effect of structured water on growth and yield parameters of tomato at 60
Parameters
Treatment
s
Parameters
Treatment
s

21
DAP
Ordinary Water
Structured Water
% increase over ordinary water
Plant height (cm) 33.3 59.9 79.78
No. of primary branches plant-1 11.0 12.5 13.64
No. of secondary branches plant-1 11.3 14.2 25.66
No. of flowers plant-1 22.1 27.0 22.17
No. of fruits plant-1 8.7 14.4 65.52
The treatments favorably influenced the growth and yield parameters of tomato at 60
DAP (Table 13). Structured water irrigation recorded the highest plant height (59.9 cm),
number of primary branches plant-1 (12.5) and number of secondary branches plant-1 (14.2).
Number of flowers plant-1 (27.0) and number of fruits plant-1 (14.4) were also higher in 100%
structured water irrigation compared to ordinary water application.
Table 14. Effect of structured water on growth and yield parameters of tomato at 90
DAP
Ordinary Water
Structured Water
% increase over ordinary water
Plant height (cm) 69.3 80.7 16.45
No. of primary branches plant-1 12.9 15.0 16.28
No. of secondary branches plant-1 15.3 18.1 18.30
No. of flowers plant-1 24.8 30.9 24.60
No. of fruits plant-1 11.7 16.8 43.59
Among the treatments, structured water irrigation recorded the highest plant height
(80.7 cm), number of primary branches plant-1 (15.0) and number of secondary branches plant-
1 (18.1) at 90 DAP. Ordinary water irrigation recorded lower plant height, number of primary
branches plant-1 and number of secondary branches plant-1. Yield parameters viz., number of
flowers plant-1 (30.9) and number of fruits plant-1 (16.8) were higher in structured water
irrigation compared to ordinary water irrigation (Table 14).
Table 15. Effect of structured water on yield and economics of tomato (kg ha-1 )
Treatment
s Parameter
s
Treatment
s Parameter
s

22
Parameters
Treatments
Ordinary Water Structured Water
% yield increase
over ordinary
water
plot -1 ha-1 plot -1 ha-1
39.55
Total yield (kg) 1097 9457 1531 13198
Cost of cultivation (Rs) - 61000 - 100000
Gross return (Rs) - 141855 - 197970
Net return (Rs) - 80855 - 97970
BCR - 1:2.32 - 1:1.98
Tomato fruit yield was favourably influenced by the irrigation practices and among the
practices tested, structured water irrigation recorded the highest fruit yield of 13198 kg ha-1
with a yield increase of 39.55% over ordinary water irrigation. Ordinary water irrigation
registered fruit yield of 9457 ha-1 (Table 15).
The effect of treatments on economic returns of tomato is presented in Table 15. The
economic returns showed that structured water irrigation recorded the highest net return of Rs.
97970 per ha and ordinary water recorded Rs. 80855 per ha. The ordinary water irrigation
recorded higher BCR (2.32) than structured water irrigation owing to the lesser cost of
cultivation. The highest cost of cultivation in structured water irrigation treatment is due to
initial investment on structured water unit.
Table 16. Effect of structured water on post harvest soil properties
Ordinary Water Structured Water
pH 7.90 7.93
EC (dS m-1) 0.48 0.50
Organic Carbon (%) 0.54 0.55
Available N (kg ha -1) 248 246
Available P (kg ha -1) 16.2 15.9
Available K (kg ha -1) 489 484
Regarding post harvest soil properties, structured water irrigation practice recorded
Parameters
Treatment
s

23
higher pH (7.93), EC (0.50 dS m-1) and organic carbon (0.55 %) than ordinary water
application (Table 16). But higher NPK content of soil was observed under ordinary water
application compared to structured water irrigation.
Table 17. Effect of structured water on quality parameters in Tomato
Ordinary Water Structured Water
Acidity (%) 0.54 0.55
Ascorbic acid (mg 100mg -1) 29.20 30.38
Total soluble solids 3.32 3.44
Total sugars 2.80 3.02
The effect of treatments on quality of tomato is presented in Table 17 . The results
showed that structured water irrigation practice recorded higher acidity percentage (0.55%),
ascorbic acid (30.38mg 100g-1), total soluble solids (3.44) and total sugars (3.02). Thus the
structured water irrigation showed increased quality in tomato while compared to ordinary
water irrigation.
Table 18. Effect of structured water on nutrient uptake (kg ha-1) of tomato at harvest
Ordinary Water Structured Water
Vegetative Fruit Vegetative Fruit
N 62.11 101.26 70.09 120.76
P 8.08 11.00 10.92 13.14
K 69.43 121.65 79.28 152.97
The effect of treatments on nutrient uptake of tomato at harvest is presented in Table
18. The results showed that structured water irrigation practice recorded higher nutrient uptake
at the time of harvest in both vegetative part and tomato fruit when compared to ordinary water
application.
(iv) Studies on the field efficacy of structured water unit on growth and yield of bhendi:
Parameters
Treatment
s
Parameters
Treatment
s

24
Table 19. Effect of structured water on germination and growth of bhendi at 30 DAS
Parameters
Treatments
Ordinary Water
Structured Water
% increase over ordinary water
Germination (%) 70.4 84.8 20.5
Plant height (cm) 10.3 15.1 46.6
No. of leaves plant-1 4.0 5.8 45.0
Leaf length (cm) 8.5 9.8 15.3
Leaf breadth (cm) 3.8 4.9 29.0
Application of structured water irrigation recorded higher germination percentage of
84.8% (Table 19). Plant height (15.1 cm), number of leaves plant-1 (5.8), leaf length (9.8 cm)
and leaf breadth (4.9 cm) at 30 DAS were also higher under structured water irrigation
compared to ordinary water application.
Table 20. Effect of structured water on growth and yield attributes of bhendi at 60 DAS
Parameters
Treatments
Ordinary Water
Structured Water
% increase over ordinary water
Plant height (cm) 47.7 50.9 6.7
No. of leaves plant-1 13.0 14.6 12.3
Leaf length (cm) 10.7 11.3 6.0
Leaf breadth (cm) 5.2 5.3 1.1
No. of fruits plant-1 7.8 8.2 5.1
Fruit length (cm) 13.3 13.6 2.0
Fruit girth (cm) 4.1 4.5 7.7
The results revealed that structured water application recorded higher growth and yield
parameters viz., plant height (50.9 cm), number of leaves plant-1 (14.6), leaf length (11.3 cm),
leaf breadth (5.3 cm), number of fruits plant-1 (8.2), fruit length (13.6 cm) and fruit girth (4.5
cm) at 60 DAS. The lower growth and yield parameters of bhendi were observed under
ordinary water irrigation (Table 20).
Table 21. Effect of structured water on growth and yield attributes of bhendi at 90 DAS

25
Parameters
Treatments
Ordinary Water
Structured Water
% increase over ordinary water
Plant height (cm) 48.7 51.8 6.4
No. of leaves plant-1 11.8 14.0 18.6
Leaf length (cm) 10.4 11.2 7.7
Leaf breadth (cm) 4.8 5.0 4.2
No. of fruits plant-1 4.2 5.0 19.0
Fruit length (cm) 12.6 13.4 6.3
Fruit girth (cm) 3.4 3.8 11.8
Among the treatments, structured water irrigation recorded higher plant height (51.8
cm), number of leaves plant-1 (14.0), leaf length (11.2 cm), leaf breadth (5.0 cm), number of
fruits plant-1 (5.0), fruit length (13.4 cm) and fruit girth (3.8 cm) at 90 DAS. Ordinary water
irrigation recorded lower growth and yield parameters compared to structured water irrigation
(Table 21).
Table 22. Effect of structured water on yield and economics of bhendi (kg ha-1 )
Parameters
Treatments
Ordinary Water
Structured Water
% yield increase over ordinary water (For
100% SW)
plot -1 ha-1 plot -1 ha-1
35.84
Total yield (kg) 438 6293 595 8549
Cost of cultivation (Rs) - 40600 - 79600
Gross return (Rs) - 75516 - 102588
Net return (Rs) - 34916 - 22988
BCR - 1.86 - 1.29
The results of bhendi yield revealed that fruit yield was higher under structured water
irrigaion (8549 kg ha-1) with 35.84 % yield increased over ordinary water irrigation and
ordinary water application recorded the fruit yield of 6293 kg ha-1 (Table 22).
The effect of treatments on economic returns of bhendi is presented in Table 22.

26
Among the treatments, application of structured water irrigaion recorded the highest gross
return (Rs.102588/ha) but the net return (Rs. 34916/ha) and benefit cost ratio (1.86) were
higher under ordinary water application due to structured water irrigation incurred higher cost
of cultivation by installation of structured water unit.
Table 23. Effect of structured water on post harvest soil properties
Ordinary Water Structured Water
pH 7.91 7.93
EC (dS m-1) 0.48 0.49
Organic Carbon (%) 0.55 0.55
Available N (kg ha -1) 252 249
Available P (kg ha -1) 16.4 16.0
Available K (kg ha -1) 487 485
There was no difference in pH, EC and organic carbon content of post harvest soil
samples. Regarding soil fertility, higher NPK content was recorded under ordinary water
irrigation compared to structured water irrigation (Table 23).
Based on the results of first year field experiments, it is revealed that all the crops under
study viz., cotton, tomato and bhendi which were irrigated with structured water exhibited an
increase in germination percentage, vegetative growth, yield and yield attributes. However the
results to be confirmed in the second year.
Parameters
Treatment
s

27
V. Results (2014 – 2015)
Field experiments were conducted, employing sorghum and onion as test crops at farmer’s
field in Sulur, Coimbatore (Dt) and at farmer’s field in Vellode, Erode (Dt) for confirmation of
previous year results.
(v) Impact of structured water unit on water quality:
Irrigation Water samples for the proposed study was collected before and after treatment
with structured water unit. These samples were analysed for pH, Electrical Conductivity and
Total Dissolved Solids (TDS), Cations (Ca, Mg, Na, K) and Anions (CO3, HCO3, Cl, SO4),
Biological Oxygen Demand (BOD) and Chemical Oxygen Demand (COD). The results are
furnished in Table 24 and Table 25.
Table 24. Characteristics of Structured and Ordinary Water
(Location:Farmers field – (Sorghum) – Sulur)
Parameters Ordinary Water Structured Water
pH 6.97 7.13
EC (dS m-1) 7.10 7.12
TDS (mg l-1) 4544 4557
Calcium (cmol p+ kg-1) 9.3 9.7
Magnesium (cmol p+ kg-1) 4.1 4.4
Sodium (cmol p+ kg-1) 10.1 10.3
Potassium (cmol p+ kg-1) 0.6 0.8
Carbonates (cmol p+ kg-1) - -
Bicarbonates (cmol p+ kg-1) 7.8 7.7
Chloride (cmol p+ kg-1) 7.6 7.1
Sulphate (cmol p+ kg-1) 5.4 5.3
BOD (mg l-1) 29.2 28.6
COD (mg l-1) 88.6 88.2

28
Table 25. Characteristics of Structured and Ordinary Water (Location : Farmers field – (Onion) – Vellode)
Parameters Ordinary Water Structured Water
pH 8.30 8.56
EC (dS m-1) 2.20 2.24
TDS (mg l-1) 1408 1434
Calcium (cmol p+ kg-1) 8.2 8.9
Magnesium (cmol p+ kg-1) 4.0 4.6
Sodium (cmol p+ kg-1) 9.8 10.0
Potassium (cmol p+ kg-1) 0.5 0.6
Carbonates (cmol p+ kg-1) - -
Bicarbonates(cmol p+ kg-1) 8.2 8.2
Chloride (cmol p+ kg-1) 9.2 8.0
Sulphate (cmol p+ kg-1) 4.6 4.7
BOD (mgl-1) 28.2 27.6
COD(mgl-1) 87.5 83.1
Table 26. Initial soil characteristics of experimental field
Parameters Farmers field Sulur Farmers field Vellode
pH 7.94 8.30
EC (dS m-1) 0.50 0.62
Organic Carbon (%) 0.57 0.54
Available N (kg ha -1) 92 203
Available P (kg ha -1) 6.0 8.2
Available K (kg ha -1) 370 418
The initial soil characteristics of the experimental fields (farmer’s field at Sulur and
farmer’s field in Vellode village is given in Table.26.

29
vi. Studies on the field efficacy of structured water unit on growth and yield of sorghum:
Table 27. Effect of structured water on germination and growth parameters of sorghum at
30 DAS
Ordinary Water Structured Water
% increase over ordinary water
Germination (%) 74.50 85.80 15.17
Plant height (cm) 36.42 48.50 33.17
No. of leaves plant-1 6.40 8.10 26.56
Leaf length (cm) 18.08 26.08 44.25
Leaf breadth (cm) 0.84 1.23 46.43
Root length (cm) 5.90 8.65 46.61
Root spread (cm) 2.55 3.30 29.41
Dry matter (kg ha -1) 414.8 597.8 44.12
The effect of treatments on germination and growth of sorghum at 30 DAS is presented
in Table 27. Among the treatments, structured water irrigation recorded higher germination
percentage (85.80), plant height (48.5cm), number of leaves plant-1 (8.10), leaf length (26.08 cm)
and leaf breadth (1.23 cm), root length (8.65 cm), root spread (3.30 cm) and dry matter
production (597.8 kg ha -1) compared to ordinary water irrigation practice.
Table. 28. Effect of structured water on growth parameters of sorghum at 60 DAS
Ordinary Water Structured Water % increase over ordinary water
Plant height (cm) 197.82 250.14 26.45
No. of leaves plant-1 8.60 10.20 18.60
Leaf length (cm) 43.40 55.10 26.96
Leaf breadth (cm) 2.30 2.80 21.74
Root length (cm) 9.20 11.20 21.74
Root spread (cm) 5.30 6.70 26.42
Dry matter (kg ha -1) 5366.4 6338.5 18.11
Parameters
Treatment
s
Parameters
Treatment
s

30
The treatments favourably influenced the growth parameters of sorghum at 60 DAS
(Table 28). Structured water irrigation recorded the higher plant height, number of leaves plant-1,
leaf length, leaf breadth, root length, root spread and dry matter production in structured water
irrigation compared to ordinary water application.
Table 29. Effect of structured water on growth parameters of sorghum at 90 DAS
Ordinary Water Structured Water % increase over ordinary water
Plant height (cm) 247.80 300.10 21.11
No. of leaves plant-1 11.30 13.10 15.93
Leaf length (cm) 48.40 58.10 20.04
Leaf breadth (cm) 3.30 4.20 27.27
Root length (cm) 11.60 13.20 13.79
Root spread (cm) 7.40 8.90 20.27
Dry matter (kg ha -1) 6699.7 8116.3 21.14
Among the treatments structured water irrigation recorded the higher plant height (300.10
cm), number of leaves plant-1 (13.10 cm), leaf length (58.10 cm), leaf breadth (4.20 cm), root
length (13.20 cm), root spread (8.90 cm) and dry matter production (8116.3 kg ha -1) compared to
ordinary water application (Table 29).
Table 30. Effect of structured water on sorghum grain yield (kg ha-1)
Ordinary Water Structured Water
Grain Yield 3180 3274
The results of sorghum yield (Table 30) revealed that sorghum grain yield was higher
under structured water irrigation (3274 kg ha-1) over ordinary water irrigation (3180 kg ha-1).
Table 31. Effect of structured water on nutrient uptake (kg ha-1) of sorghum at harvest
Ordinary Water Structured Water
N 60.18 75.98
P 16.33 21.89
K 66.00 83.57
Parameters
Treatment
s
Parameters
Treatment
s
Parameters
Treatment
s

31
The effect of treatments on nutrient uptake of sorghum is presented in Table 31. The
results showed that the structured water irrigation practice recorded higher nutrient uptake at
harvest viz., N (75.98 kg ha-1), P (21.89 kg ha-1) and K (83.57 kg ha-1) when compared to
ordinary water irrigation.
Table 32. Effect of structured water on post harvest soil properties
Ordinary Water Structured Water
pH 7.94 7.94
EC (dS m-1) 0.50 0.50
Organic carbon (%) 0.57 0.59
Available N (kg ha -1 ) 98 92
Available P (kg ha -1 ) 6.5 6.0
Available K (kg ha -1 ) 380 370 With regard to post harvest soil properties there was no difference in pH, EC, organic
carbon and NPK content between treatments (Table 32).
vii. Studies on the field efficacy of structured water unit on growth and yield of onion:
Table 33. Effect of structured water on germination and growth parameters of onion at 30
DAP
Ordinary Water
Structured Water
% increase over
ordinary water
Plant height (cm) 30.44 30.99 1.81
No. of leaves/ plant 22.80 27.10 18.86
Leaf length (cm) 21.11 25.54 20.99
Leaf breadth (cm) 0.33 0.34 3.03
Leaf dry weight (kg ha-1) 337.3 408.7 21.17
The effect of treatments on growth of onion is presented in Table 33. The results showed
that structured water irrigation practice recorded higher plant height (30.99 cm) at 30 DAP.
Irrigation with ordinary water recorded the lowest plant height (30. 44 cm). Number of leaves
per plant, leaf length, leaf breadth and leaf dry weight were also highly influenced by structured
water irrigation compared with ordinary water application.
Parameter
s
Treatment
s Parameter
s
Treatment
s

32
Table 34. Effect of structured water on growth parameters of onion at 60 DAP
Ordinary Water
Structured Water
% increase over
ordinary water
Plant height (cm) 44.84 48.85 8.94
No. of leaves/ plant 37.7 41.2 9.28
Leaf length (cm) 29.64 29.98 1.15
Leaf breadth (cm) 0.44 0.46 4.55
Leaf dry weight (kg ha-1) 781.8 863.1 10.40
Among the different irrigation treatments structured water irrigation recorded higher
growth parameters viz., plant height, number of leaves per plant, leaf length and leaf breadth and
leaf dry weight at 60 DAP (Table 34). The lowest growth parameters were observed under
ordinary water irrigation.
Table 35. Effect of structured water on growth parameters of onion at 90 DAP
Ordinary Water
Structured Water
% increase over
ordinary water
Plant height (cm) 44.92 49.90 11.09
No. of leaves/ plant 39.10 44.10 12.79
Leaf length (cm) 30.53 30.79 0.85
Leaf breadth (cm) 0.44 0.46 4.55
Leaf dry weight (kg ha-1) 1125.2 1196.8 6.36
Regarding different treatments, irrigation with structured water recorded maximum plant
height (49.90 cm), number of leaves per plant (44.10), leaf length (30.79 cm), leaf breadth (0.46
cm) and leaf dry weight (1196 kg ha-1) when compared to ordinary water irrigation (Table 35).
Table 36. Effect of structured water on onion bulb yield
Treatments
Parameters
Ordinary Water Structured Water
kg plot -1 kg ha-1 kg plot -1 kg ha-1
Bulb yield 39 6964 30 5357
Parameter
s
Treatment
s
Parameter
s
Treatment
s

33
The effect of treatments on yield of onion is presented in Table 36. The onion bulb yield
recorded for ordinary and structured water irrigation was 6964 kg ha-1 and 5357 kg ha-1 which
might be due to crop damage and higher rainfall during later stage of crop growth.
Table 37. Effect of structured water on post harvest soil properties
Ordinary Water Structured Water
pH 8.30 8.32
EC (dS m-1) 0.62 0.63
Organic carbon (%) 0.54 0.56
Available N (kg ha -1 ) 203 214
Available P (kg ha-1 ) 8.2 7.8
Available K (kg ha -1 ) 418 425
Regarding pH, EC, organic carbon and NPK content of soil, higher values were
registered with application of structured water irrigation compared to ordinary water irrigation
(Table 37).
viii. Studies on the field efficacy of structured water unit on growth and yield of tapioca:
Table 38. Effect of structured water on yield and quality of tapioca
Treatments
Parameters
Ordinary Water
Structured Water
% yield increase over
Ordinary water
Tuber yield (t ha-1) 12.70 15.12 19.06
Starch content (Point) 24 27
The effect of treatments on yield and quality of tapioca is presented in Table 38. The
tuber yield recorded in structured water irrigation (15.12 t ha-1) was higher over ordinary water
irrigation (12.70 t ha-1) with 19.06% increased yield (Table 38).
The quality of tapioca results (Table 38) showed that structured water irrigation practice
recorded higher starch content (27 points) when compared to ordinary water irrigation (24
points).
Parameter
s
Treatment
s

34
VI. Salient Findings
Ø Irrigation Water samples were collected before and after treatment with structured water
unit and analysed for chemical properties viz., pH, Electrical Conductivity and Total
Dissolved Solids (TDS), Cations (Ca, mg, Na, K) and Anions (CO3, HCO3, Cl, SO4),
Biological Oxygen Demand (BOD) and Chemical Oxygen Demand (COD). There is no
difference in the chemical properties between structured water and ordinary water.
Ø Regarding the field experiment on cotton, the growth, yield attributes, yield and quality
was higher under application of 100% structured water with the seed cotton yield
increase of 36.6% over ordinary water irrigation.
Ø In tomato also the growth, yield, economics and quality was favourably influenced by the
irrigation practices. Among the practices, structured water irrigation recorded higher
growth and yield with the increase of 39.55% fruit yield over ordinary water irrigation.
The economic returns showed that structured water irrigation recorded the highest net
return but ordinary water irrigation recorded higher BCR (2.32) than structured water
irrigation because of lesser cost of cultivation. The highest cost of cultivation in
structured water irrigation is due to initial investment on structured water unit.
Ø With regard to bhendi, the growth, yield and economics was higher in structured water
irrigation with 35.84 % yield increase over ordinary water application. Economic return
showed similar trend as that of tomato crop with higher BCR of 1.86 in structured water
irrigation.
Ø In sorghum, the growth parameters and yield was higher in structured water irrigation
with 3.0 % yield increase over ordinary water application.
Ø Tapioca also showed higher yield under structured water irrigation with 19.06%
increased yield over ordinary water irrigation.
Ø Regarding the nutrient uptake of crops, the structured water irrigation practice recorded
higher nutrient uptake (NPK) when compared to ordinary water irrigation.
Ø Drip uniformity co-efficient indicated that 100% structured water irrigation recorded
higher drip uniformity co-efficient (92.78%) than the ordinary irrigation management
practices.
Based on the results of field experiments, it is revealed that the crops under study viz.,
cotton, tomato, bhendi, sorghum and tapioca which were irrigated with structured water
exhibited an increase in growth and yield.

Structured water unit installation

Field Photos – Structured Water Trial on Cotton

Field Photos – Structured Water Trial on Tomato

Field Photos – Structured Water Trial on Bhendi

Field Photos – Structured Water Trial on Sorghum and Onion

Field Photos – Structured Water Trial on Onion

Visit made by Company Persons