complex event processing (cep) why and howbiztalkusergroup.se/blogs/info/complex event processing...
TRANSCRIPT

Complex Event Processing (CEP)
Why and How
Richard Hallgren
BUGS 2013-05-30

• Objectives
– Understand why and how CEP is important for modern business processes
– Concepts within a CEP solution
– Overview of StreamInsight
– Understand how StreamInsight and BizTalk can work together
• Presentation Outline
– Why CEP
– CEP overview
– StreamInsight in detail
– StreamInsight + BizTalk

Understanding of data
Connect
Act
Understand
Anticipate
Val
ue
to b
usi
nes
s
Data isolated in seperate
systems

Data refinement process
Industry trends
•Data acquisition costs are negligible
•Raw storage costs are small and continue to decrease
•Processing costs are non-negligible
•Data loading costs continue to be significant
Manage business via KPI-triggered
actions
Mine historical dataDevise new KPIs
Monitor KPIsRecord raw
data (history)
CEP opportunities
•Process data incrementally, i.e., while it is in flight
•Avoid loading while still doing the processing you want
• Seamless querying for monitoring, managing and mining
•Close to real time
Faster loop – closer to real time!
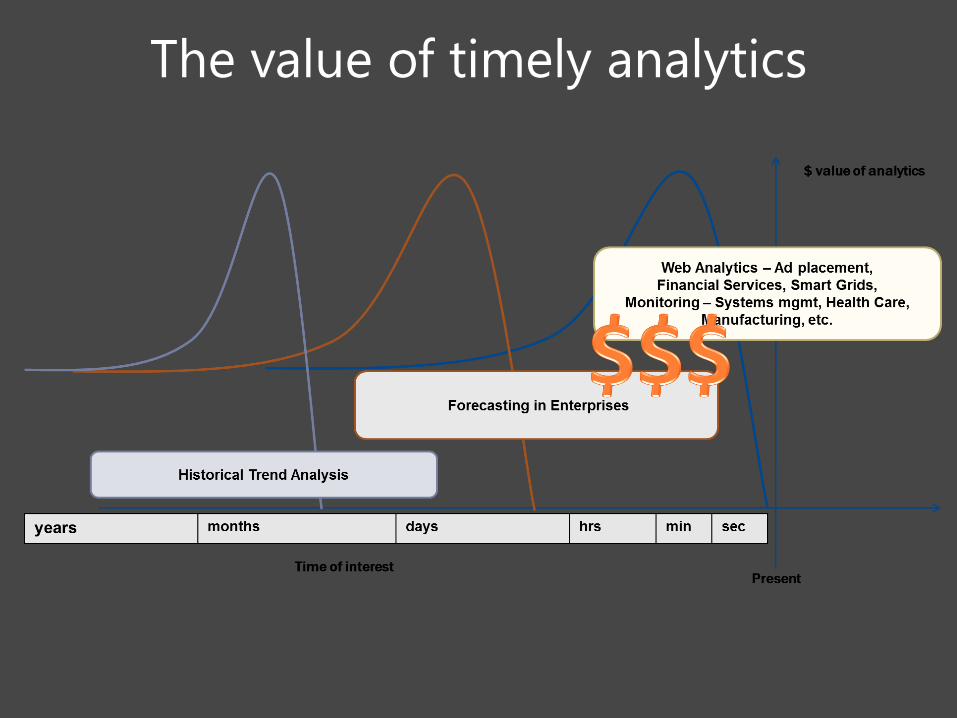
The value of timely analytics

Messages/Events
• Traditional messaging applications:– “High signal” – every message is
business relevant
– Rich data schemas – sets of related information
– Workflow centric and transactional
• Emerging data sources and trends:– Machine born data is growing at a
very rapid rate
– Not all of this data is business relevant (low signal/noise ratio)
• How do we, issues to solve:– Identify and extract business
relevant events from streaming data?
– Take action on these business insights (line of business, human workflow, etc)
LOB
WebServices
B22B SWIFT
RFID
Stock Feeds
Electrical Grids
Operational Data
Health Care
CRM
Large MessagesLow Volume
High VolumeSmall Events

Different approach of processing data
Traditional Data
Processing
• How many invalid credit
card authorization were
accepted yesterday?
Event Data Processing
• When 3 authorizations for
the same credit card occur
in any 60 second period,
deny the request and
require manual approval
Time
• Works in real time
• Analyze by pattern within time frames

Trends recap
- Vivek Ranadivé

CEP Overview

CEP applications generally have two primary
orientations: computing aggregates and
detecting event patterns over a time line
of events.
Complex Event Processing (CEP) is an
architecture style based on the principles
of Event Driven Architecture (EDA).

What is CEP and what does it do?
How?
1. Continuously processing a high-volume stream of
events from various event sources
2. Events are logically grouped in sequences (typically
known as streams) based on a time defined criteria
such as an interval.
3. Event streams are processed through a series of
queries
Why?
CEP is commonly used to detect and respond to
business anomalies, threats, and opportunities

Typical scenario
The utility sector requires an efficient infrastructure for managing electric grids and other utilities.
• Immediate response to variations in energy or water consumption, to minimize or avoid outages or other disruptions of service.
• Gaining operational and environmental efficiencies by moving to smart grids.
• Multiple levels of aggregation along the grid.
• Ability to handle up to 100,000 events per second from millions of data sources.

StreamInsight

Basics StreamInsight
• Highly optimized performance and data throughput
• .NET based
• Flexible deployment capability
• Manageability
• Premium version of StreamInsight event rates > 5000 events/sec. or latency requirements are < 5 sec.– Standard
• Sql Server 2012 Business Intelligence, Standard, Web
– Premium• Sql Server Enterprise
• Non persistent – works in-memory (no dependecy to Sql Server)
http://msdn.microsoft.com/en-us/library/ff518551.aspx

Standing Queries
Query Logic
Event sources Event targets
`
Devices, Sensors
Web servers
Event stores & Databases
Stock ticker, news feeds Event stores & Databases
Pagers &Monitoring devices
KPI Dashboards, SharePoint
Trading stations
InputAdapters
OutputAdapters
StreamInsight Engine
Query Logic
Query Logic
StreamInsight
Application Development
StreamInsight Application at Runtime

Development steps:
Hosting
• In-process
• Seperate service
• Own machine, cluster of machines

Development steps:
Sources & Sinks
• Event sources and Event Sinks
– StreamInsight 2.1 has support for IEnumerable
and IObservable
– Lots of helper methods to convert to
IEnumerable and create IObservable streams
• Adapters
– In 1.0, 1.1, 1.2 and 1.2
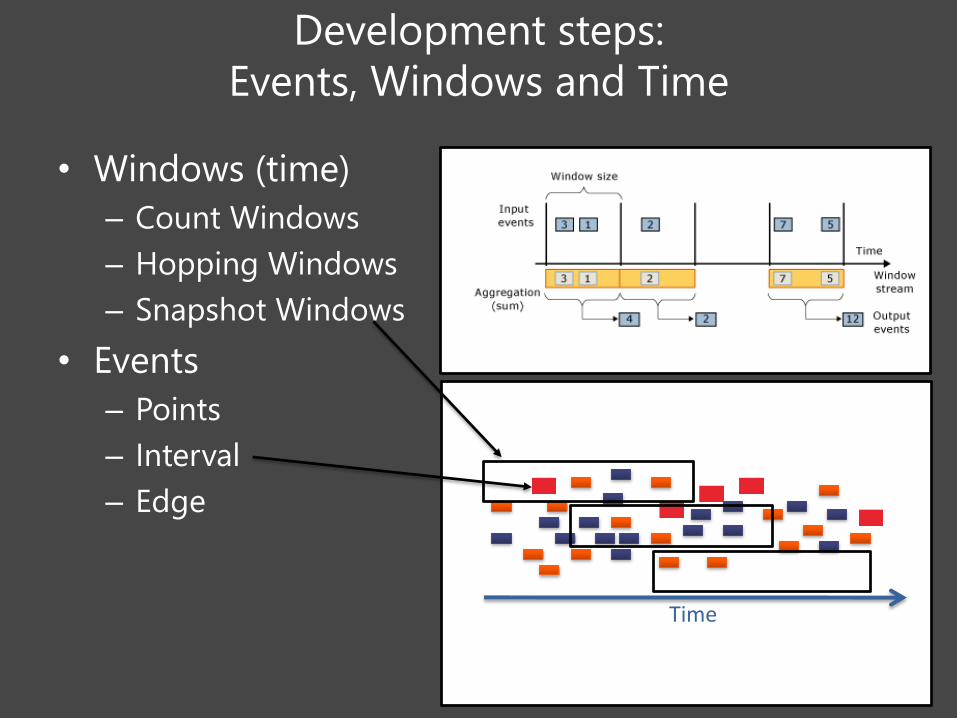
Development steps:
Events, Windows and Time
• Windows (time)
– Count Windows
– Hopping Windows
– Snapshot Windows
• Events
– Points
– Interval
– Edge
• Point
• Interval
• Edge
• Events
Time

Development steps:
Queries (Linq)
var tumblingAgg =
from w in inputStream.TumblingWindow(
TimeSpan.FromHours(1))
select new {
sum = w.Sum(e => e.i)
};

”Hello World”
server = Server.Create("Default");
var myApp = server.CreateApplication("serverApp");
var mySource = myApp.DefineObservable(() => Observable.Interval(TimeSpan.FromSeconds(1))).ToPointStreamable(x => PointEvent.CreateInsert(DateTimeOffset.Now, x), AdvanceTimeSettings.StrictlyIncreasingStartTime);
var myQuery = from e in mySource where e % 2 == 0 select e;
var mySink = myApp.DefineObserver(() => Observer.Create<long>(x => Console.WriteLine(“Hello World! : {0}", x)));
mySink.Deploy("serverSink");
var proc = myQuery.Bind(mySink).Run("serverProcess");

Demo Scenario 1
• Scenario:
– A public API based on ASP.NET MVC 4
– Throttle request to 30 req./10 sec.
• Issues:
– Keep a ”window” in memory of all web
request for the last 10 sec. relevant to the
current req. grouped by API key.
• Efficient memory management

Demo Scenario 1
• Shows StreamInsight hosted in-process

StreamInsight + BizTalk
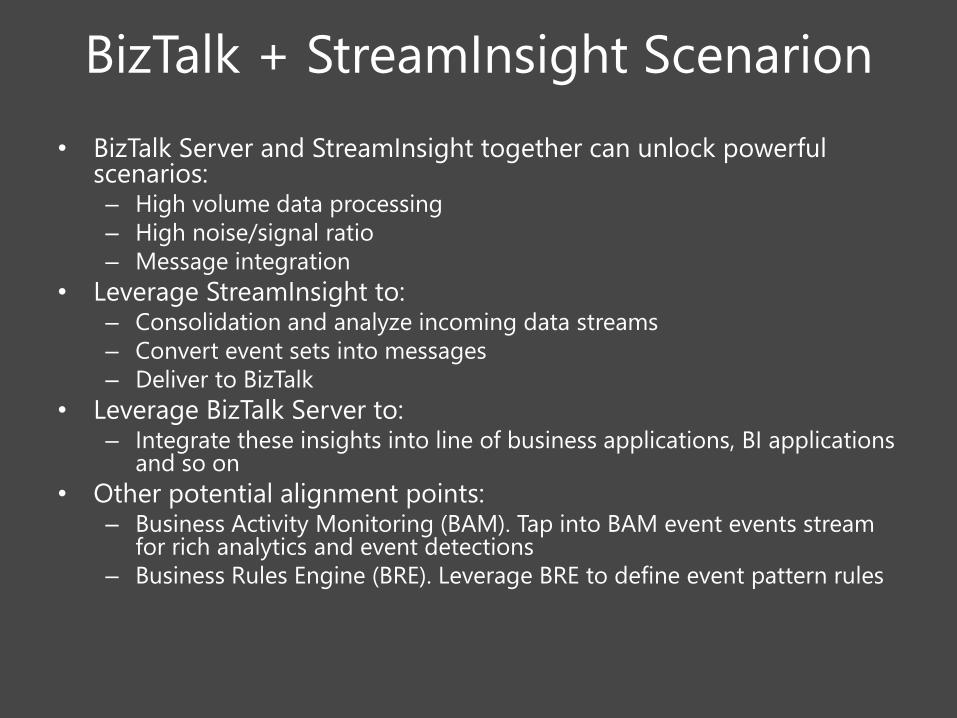
BizTalk + StreamInsight Scenarion
• BizTalk Server and StreamInsight together can unlock powerful scenarios:– High volume data processing
– High noise/signal ratio
– Message integration
• Leverage StreamInsight to:– Consolidation and analyze incoming data streams
– Convert event sets into messages
– Deliver to BizTalk
• Leverage BizTalk Server to:– Integrate these insights into line of business applications, BI applications
and so on
• Other potential alignment points:– Business Activity Monitoring (BAM). Tap into BAM event events stream
for rich analytics and event detections
– Business Rules Engine (BRE). Leverage BRE to define event pattern rules

Event Driven Processing
IntegrateInformatio
n
AutomateProcesses
SimplifyManageme
ntOrchestration
Messaging / ESB
Business Rules
Business Activity Monitoring
B2B Integration
Adapters
ESSO and UDDI
Monitor Process Act

Demo Scenario 2
• Scenario:– A number of meters report power usage at a “point in time”.
– Data is consolidated into a back end application used for billing and forecasting.
– The volume of data has forced them to only read values from meters every hour.
• They want to:– Monitor the data more closely, compressing the point stream to an interval stream before loading
into the back end application.• i.e. if the data does not change by more than 2% over a 10 sec. window, keep the average value.
– Capture spikes and threshold events, route to a process control application for further inspection.
• Issues:– To much traffic even for BizTalk Server
– Group data by meter id
– Keep data for last 10 seconds in memory to calculate average
– Keep single events if spike detected
Timestamp 3/5/2010 14:23
Power 1020
Meter ID 112322
Data consolidation
(point -> interval)
Anomaly Detection
Reference data (location, hierarchy)
Batch to Message
Batch to Message
Line of Business
Application
Smart Meters

Demo Scenario 2
• Possible solutions
– BizTalk Orchestrations with correlations?
– Cache framework and custom memory
management
– Custom in-memeory handling ….

Demo Scenario 2
Timestamp 3/5/2010 14:23
Power 1020
Meter ID 112322
Data consolidation
(point -> interval)
Anomaly Detection
Reference data (location, hierarchy)
Batch to Message
Batch to Message
Line of Business
Application
Smart Meters
StreamInsight
Meter Input Adapter
(StreamInsight)
ConsolidationQuery
Threshold Detection Query
MessageBuilderOutputAdapter
BizTalk Server
WCFMSMQAdapter
ReceivePort
OrchestrationSendPort
LOBAdapter
QueryResults (XML)
QueryResults (XML)
Query Result Format (XSD)
Query Result Format (XSD)
1
1
2
2
3
3
4
5
4
5

Microsoft
StreamInsight
Sources
Devices, Sensors
Web servers
Stock tickers & News feeds
Me
ssa
ge
Bu
sData Bus Caching Processing VisualizationDistribution
Static Reports
Mining, Validation, “What-If” Scenarios
Operational Dashboard(Ticking - Snapshot)
Reporting Dashboard(Refreshed)
Me
ssa
ge
Bu
s
Operational
Analytics
In-memory
Database
Intra-Day
Cubes
Historic
Cubes
ETL
ETL
Reference
Data
Cache
Refresh (Push)
Refresh (Push)
Re-compute (Pull)
Automated
Decisions
Data enrichment process MS
Business Processes

Recap - objectives
• Understand why and how CEP is important
for modern business processes
• Concepts within a CEP solution
• Overview of StreamInsight
• Understand how StreamInsight and BizTalk
can work together