component masses of young, wide, non-magnetic white dwarf ...ecite.utas.edu.au/97236/1/3184...
TRANSCRIPT

MNRAS 440, 3184–3201 (2014) doi:10.1093/mnras/stu464
Component masses of young, wide, non-magnetic white dwarf binaries inthe Sloan Digital Sky Survey Data Release 7
R. B. Baxter,1‹ P. D. Dobbie,2‹ Q. A. Parker,1,3,4 S. L. Casewell,5 N. Lodieu,6,7
M. R. Burleigh,5 K. A. Lawrie,5 B. Kulebi,8 D. Koester9 and B. R. Holland2
1Department of Physics & Astronomy, Macquarie University, NSW 2109, Australia2School of Physical Sciences, University of Tasmania, Hobart, TAS 7001, Australia3Macquarie Research Center for Astronomy, Astrophysics & Astrophotonics, Macquarie University, NSW 2109, Australia4Australian Astronomical Observatory, PO Box 296, Epping, NSW 1710, Australia5Department of Physics & Astronomy, University of Leicester, Leicester LE1 7RH, UK6Instituto de Astrofisica de Canarias, Via Lactea s/n, E-38200 La Laguna, Tenerife, Spain7Departamento de Astrofısica, Universidad de La Laguna (ULL), E-38206 La Laguna, Tenerife, Spain8Institut de Ciencies de l′Espai (CSIC-IEEC), Facultat de Ciencies, Campus UAB, Torre C5-parell, 2a planta, E-08193 Bellaterra, Spain9Institut fur Theoretische Physik und Astrophysik, Christian-Albrechts-Universitat, D-24098 Kiel, Germany
Accepted 2014 March 6. Received 2014 March 2; in original form 2014 January 24
ABSTRACTWe present a spectroscopic component analysis of 18 candidate young, wide, non-magnetic,double-degenerate binaries identified from a search of the Sloan Digital Sky Survey DataRelease 7 (DR7). All but two pairings are likely to be physical systems. We showSDSS J084952.47+471247.7 + SDSS J084952.87+471249.4 to be a wide DA + DB bi-nary, only the second identified to date. Combining our measurements for the components of16 new binaries with results for three similar, previously known systems within the DR7, wehave constructed a mass distribution for the largest sample to date (38) of white dwarfs inyoung, wide, non-magnetic, double-degenerate pairings. This is broadly similar in form to thatof the isolated field population with a substantial peak around M ∼ 0.6 M�. We identify anexcess of ultramassive white dwarfs and attribute this to the primordial separation distributionof their progenitor systems peaking at relatively larger values and the greater expansion oftheir binary orbits during the final stages of stellar evolution. We exploit this mass distributionto probe the origins of unusual types of degenerates, confirming a mild preference for theprogenitor systems of high-field-magnetic white dwarfs, at least within these binaries, to beassociated with early-type stars. Additionally, we consider the 19 systems in the context ofthe stellar initial mass–final mass relation. None appear to be strongly discordant with currentunderstanding of this relationship.
Key words: binaries: general – stars: magnetic field – white dwarfs.
1 I N T RO D U C T I O N
A substantial proportion of stars reside in binary or multiple stellarsystems (e.g. Duquennoy & Mayor 1991; Fischer & Marcy 1992;Kouwenhoven et al. 2005, 2007). Empirical determinations of thestellar binary fraction as a function of primary mass and of the binarymass ratio and orbital period distributions inform theories of the starformation process (e.g. Zinnecker 1984; Pinfield et al. 2003; Parker& Reggiani 2013). Moreover, studies of close systems, with orbitalperiods of a few days or less, can yield important dynamical deter-minations of masses and radii which lend themselves to arguably
� E-mail: [email protected]
the most stringent examinations of models of stellar structure (e.g.Huang & Struve 1956; Maxted et al. 2004; Clausen et al. 2008).Wide, spatially resolved, binary systems, where the components areseparated by 100–10 000 au and have generally evolved essentiallyas single stars (e.g. Andrews et al. 2012), are also of significant in-terest, since they are, in effect, miniature versions of open clusters,the traditional but often rather distant testbeds for refining our theo-ries of stellar evolution (e.g. Barbaro & Pigatto 1984; Nordstroem,Andersen & Andersen 1996; Casewell et al. 2009, 2012; Kalirai &Richer 2010).
By considering observational constraints on the stellar binaryfraction across a broad range of primary masses, from the late-F/Gstars (57 per cent; Duquennoy & Mayor 1991) to the numericallydominant low-mass M dwarfs (26 per cent; Delfosse et al. 2004),
C© 2014 The AuthorsPublished by Oxford University Press on behalf of the Royal Astronomical Society

Non-magnetic white dwarf binaries in SDSS DR7 3185
Lada (2006) has highlighted that the majority of stars reside in singlestellar systems. However, since only those stars of the Galactic discwith M � 1 M� have had sufficient time to evolve beyond the mainsequence, around half or more of the members of the field whitedwarf population presumably must have once been part of multiplesystems. Miszalski et al. (2009) determine that around at least 12–21per cent of planetary nebulae have close binary central stars, whileHolberg et al. (2008, 2013) have concluded that at least 25–30 percent of the white dwarfs within 20 pc of the Sun are presently part ofbinary systems, with around 6 per cent being double-degenerates.The systems at the short end of the double-degenerate period dis-tribution are of substantial astrophysical relevance since a subsetmay ultimately evolve to Type Ia supernovae (e.g. Yoon, Podsi-adlowski & Rosswog 2007). Widely separated double-degeneratesare also of interest for setting limits on the age of the Galactic discthrough the white dwarf luminosity function (Oswalt et al. 1996)and for investigating the late stages of stellar evolution, in particularthe heavy mass-loss experienced on the asymptotic giant branch,as manifest through the form of the stellar initial mass–final massrelation (IFMR; e.g. Finley & Koester 1997). Additionally, whena wide double-degenerate harbours an unusual or peculiar whitedwarf (e.g. a high-field-magnetic white dwarf), measurements ofthe parameters of the normal component can be used to investigateits fundamental parameters and origins, either directly or potentiallystatistically (e.g. Girven et al. 2010; Dobbie et al. 2012a, 2013).
Here, we begin to build the foundations for a statistical approachby presenting the mass distribution for what is by far the largest spec-troscopically observed sample (38) of non-magnetic white dwarfsresiding in young, wide, double-degenerate systems, to date. In sub-sequent sections, we describe our photometric identification of 53candidate young, wide, binary systems from a search of the SloanDigital Sky Survey (SDSS) data release 7 (DR7; Abazajian et al.2009) and discuss our new spectroscopic follow-up and analysisof the components of 18 of these systems and detail our assess-ment of their physical reality. We assemble a mass distribution forthe components of the systems we find to have a strong likeli-hood of being binaries and those of three previously identified widedouble-degenerates within the DR7 footprint. We compare this tothat of isolated field white dwarfs and discuss the similarities andthe differences. We demonstrate how this mass distribution can beused to probe the origins of unusual degenerates, in this case high-field-magnetic white dwarfs (HFMWDs). Finally, we explore the19 non-magnetic binary systems within the context of our currentunderstanding of the form of the stellar IFMR.
2 T H E I N I T I A L SE L E C T I O N O F C A N D I DAT EYO U N G , W I D E , D O U B L E - D E G E N E R AT E SF RO M T H E SD S S D R 7
An initial search for candidate, young, wide, white dwarf + whitedwarf binaries was conducted using photometry obtained from theSDSS DR7 data base (e.g. Baxter 2011). The SDSS is a deep, wide-area, five band [u (3551 Å), g (4686 Å), r (6165 Å), i (7481 Å) andz (8931 Å)] imaging survey of the night sky that is supplementedby fibre spectroscopic follow-up of select sources (e.g. quasars). Acomprehensive description of this impressively large project can befound in York et al. (2000), while full details of the DR7, whichis of particular relevance to this work, are provided by Abazajianet al. (2009). In brief, the 7th data release includes imaging for anarea of 11 663 square degrees (a substantial proportion of which iscentred on the northern Galactic cap) and catalogues 357 million
unique sources down to 5σ photometric limits at u, g, r and i of 22.3,23.3, 23.1 and 22.3 mag., respectively. The imaging was acquiredwith a drift scan technique in seeing of better than 1.5 arcsec, sothe median full width at half-maximum of the point spread functionis approximately 1.4 arcsec at r. The re-constructed SDSS imageshave pixels which are 0.396 arcsec on a side.
As is evident from fig. 1 of Harris et al. (2003), the photometricband passes of the SDSS and the colours which can be derivedfrom them are rather effective at discriminating hot (Teff > 8000–9000 K), generally young, white dwarfs from the bulk of the fieldmain-sequence stars which dominate colour–magnitude and colour–colour diagrams. We selected from DR7 (using an SQL query) allpoint sources flagged as photometrically clean with r ≤ 20.0,u − g > −0.7, u − g ≤ 0.5, g − r > −0.7, g − r ≤ 0.0 andr − i < 0.0, which have another object satisfying these colourand magnitude criteria within 30 arcsec. In drawing up these crite-ria, we crudely appraised the likely contribution of chance stellaralignments to our sample of candidate binaries. We compared thecumulative number of observed pairings with separations of lessthan 60 arcsec to that predicted for a random on-sky distribution ofobjects by equation (1) (Struve 1852), where N is the number ofsources satisfying the photometric selection criteria (N = 36 231)in area A (square degrees, A = 11 663) and ρ is the maximumprojected separation (degrees),
n(≤ρ) = N (N − 1)πρ2/2A. (1)
On this basis, we anticipate approximately 90 per cent of the pair-ings with separations of less than 30 arcsec to be physical systems(Fig. 1), although we note our estimate neglects the variations ofGalactic latitude within the sample and that a sizeable proportionof sources around u − g = 0.0–0.5, g − r = −0.2–0.0 are likelyto be quasars. Additionally, we considered that the atmospheres ofcooler white dwarfs (i.e. Teff � 8000 K) are significantly more dif-ficult to model reliably due to the emergence of more physicallycomplex sources of opacity (Koester 2010). Moreover, by restrict-ing our sample to relatively conservative faint magnitude limits, wemaintain the advantage that our sources can be followed-up spectro-scopically on an 8 m class telescope in reasonable integration times
Figure 1. A plot of the cumulative number of observed pairings that meetour photometric selection criteria (filled grey circles) and are expected for arandom on-sky distribution of objects (black line) as a function of angularseparation. A crude estimate of the proportion of physical systems as afunction of angular separation is also shown (dashed line). For angularseparations of 30 arcsec or less, roughly 90 per cent of candidates are likelyto be physical binaries.
MNRAS 440, 3184–3201 (2014)
3186 R. B. Baxter et al.
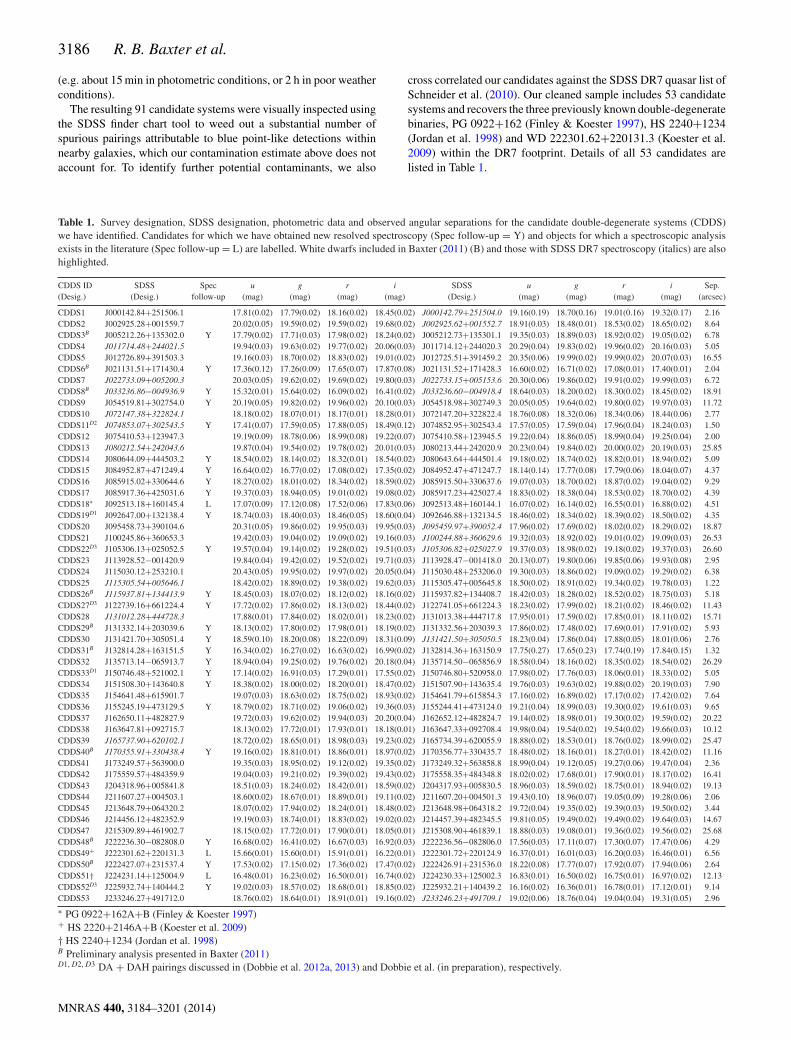
(e.g. about 15 min in photometric conditions, or 2 h in poor weatherconditions).
The resulting 91 candidate systems were visually inspected usingthe SDSS finder chart tool to weed out a substantial number ofspurious pairings attributable to blue point-like detections withinnearby galaxies, which our contamination estimate above does notaccount for. To identify further potential contaminants, we also
cross correlated our candidates against the SDSS DR7 quasar list ofSchneider et al. (2010). Our cleaned sample includes 53 candidatesystems and recovers the three previously known double-degeneratebinaries, PG 0922+162 (Finley & Koester 1997), HS 2240+1234(Jordan et al. 1998) and WD 222301.62+220131.3 (Koester et al.2009) within the DR7 footprint. Details of all 53 candidates arelisted in Table 1.
Table 1. Survey designation, SDSS designation, photometric data and observed angular separations for the candidate double-degenerate systems (CDDS)we have identified. Candidates for which we have obtained new resolved spectroscopy (Spec follow-up = Y) and objects for which a spectroscopic analysisexists in the literature (Spec follow-up = L) are labelled. White dwarfs included in Baxter (2011) (B) and those with SDSS DR7 spectroscopy (italics) are alsohighlighted.
CDDS ID SDSS Spec u g r i SDSS u g r i Sep.(Desig.) (Desig.) follow-up (mag) (mag) (mag) (mag) (Desig.) (mag) (mag) (mag) (mag) (arcsec)
CDDS1 J000142.84+251506.1 17.81(0.02) 17.79(0.02) 18.16(0.02) 18.45(0.02) J000142.79+251504.0 19.16(0.19) 18.70(0.16) 19.01(0.16) 19.32(0.17) 2.16CDDS2 J002925.28+001559.7 20.02(0.05) 19.59(0.02) 19.59(0.02) 19.68(0.02) J002925.62+001552.7 18.91(0.03) 18.48(0.01) 18.53(0.02) 18.65(0.02) 8.64CDDS3B J005212.26+135302.0 Y 17.79(0.02) 17.71(0.03) 17.98(0.02) 18.24(0.02) J005212.73+135301.1 19.35(0.03) 18.89(0.03) 18.92(0.02) 19.05(0.02) 6.78CDDS4 J011714.48+244021.5 19.94(0.03) 19.63(0.02) 19.77(0.02) 20.06(0.03) J011714.12+244020.3 20.29(0.04) 19.83(0.02) 19.96(0.02) 20.16(0.03) 5.05CDDS5 J012726.89+391503.3 19.16(0.03) 18.70(0.02) 18.83(0.02) 19.01(0.02) J012725.51+391459.2 20.35(0.06) 19.99(0.02) 19.99(0.02) 20.07(0.03) 16.55CDDS6B J021131.51+171430.4 Y 17.36(0.12) 17.26(0.09) 17.65(0.07) 17.87(0.08) J021131.52+171428.3 16.60(0.02) 16.71(0.02) 17.08(0.01) 17.40(0.01) 2.04CDDS7 J022733.09+005200.3 20.03(0.05) 19.62(0.02) 19.69(0.02) 19.80(0.03) J022733.15+005153.6 20.30(0.06) 19.86(0.02) 19.91(0.02) 19.99(0.03) 6.72CDDS8B J033236.86−004936.9 Y 15.32(0.01) 15.64(0.02) 16.09(0.02) 16.41(0.02) J033236.60−004918.4 18.64(0.03) 18.20(0.02) 18.30(0.02) 18.45(0.02) 18.91CDDS9 J054519.81+302754.0 Y 20.19(0.05) 19.82(0.02) 19.96(0.02) 20.10(0.03) J054518.98+302749.3 20.05(0.05) 19.64(0.02) 19.80(0.02) 19.97(0.03) 11.72CDDS10 J072147.38+322824.1 18.18(0.02) 18.07(0.01) 18.17(0.01) 18.28(0.01) J072147.20+322822.4 18.76(0.08) 18.32(0.06) 18.34(0.06) 18.44(0.06) 2.77CDDS11D2 J074853.07+302543.5 Y 17.41(0.07) 17.59(0.05) 17.88(0.05) 18.49(0.12) J074852.95+302543.4 17.57(0.05) 17.59(0.04) 17.96(0.04) 18.24(0.03) 1.50CDDS12 J075410.53+123947.3 19.19(0.09) 18.78(0.06) 18.99(0.08) 19.22(0.07) J075410.58+123945.5 19.22(0.04) 18.86(0.05) 18.99(0.04) 19.25(0.04) 2.00CDDS13 J080212.54+242043.6 19.87(0.04) 19.54(0.02) 19.78(0.02) 20.01(0.03) J080213.44+242020.9 20.23(0.04) 19.84(0.02) 20.00(0.02) 20.19(0.03) 25.85CDDS14 J080644.09+444503.2 Y 18.54(0.02) 18.14(0.02) 18.32(0.01) 18.54(0.02) J080643.64+444501.4 19.18(0.02) 18.74(0.02) 18.82(0.01) 18.94(0.02) 5.09CDDS15 J084952.87+471249.4 Y 16.64(0.02) 16.77(0.02) 17.08(0.02) 17.35(0.02) J084952.47+471247.7 18.14(0.14) 17.77(0.08) 17.79(0.06) 18.04(0.07) 4.37CDDS16 J085915.02+330644.6 Y 18.27(0.02) 18.01(0.02) 18.34(0.02) 18.59(0.02) J085915.50+330637.6 19.07(0.03) 18.70(0.02) 18.87(0.02) 19.04(0.02) 9.29CDDS17 J085917.36+425031.6 Y 19.37(0.03) 18.94(0.05) 19.01(0.02) 19.08(0.02) J085917.23+425027.4 18.83(0.02) 18.38(0.04) 18.53(0.02) 18.70(0.02) 4.39CDDS18∗ J092513.18+160145.4 L 17.07(0.09) 17.12(0.08) 17.52(0.06) 17.83(0.06) J092513.48+160144.1 16.07(0.02) 16.14(0.02) 16.55(0.01) 16.88(0.02) 4.51CDDS19D1 J092647.00+132138.4 Y 18.74(0.03) 18.40(0.03) 18.46(0.05) 18.60(0.04) J092646.88+132134.5 18.46(0.02) 18.34(0.02) 18.39(0.02) 18.50(0.02) 4.35CDDS20 J095458.73+390104.6 20.31(0.05) 19.86(0.02) 19.95(0.03) 19.95(0.03) J095459.97+390052.4 17.96(0.02) 17.69(0.02) 18.02(0.02) 18.29(0.02) 18.87CDDS21 J100245.86+360653.3 19.42(0.03) 19.04(0.02) 19.09(0.02) 19.16(0.03) J100244.88+360629.6 19.32(0.03) 18.92(0.02) 19.01(0.02) 19.09(0.03) 26.53CDDS22D3 J105306.13+025052.5 Y 19.57(0.04) 19.14(0.02) 19.28(0.02) 19.51(0.03) J105306.82+025027.9 19.37(0.03) 18.98(0.02) 19.18(0.02) 19.37(0.03) 26.60CDDS23 J113928.52−001420.9 19.84(0.04) 19.42(0.02) 19.52(0.02) 19.71(0.03) J113928.47−001418.0 20.13(0.07) 19.80(0.06) 19.85(0.06) 19.93(0.08) 2.95CDDS24 J115030.12+253210.1 20.43(0.05) 19.95(0.02) 19.97(0.02) 20.05(0.04) J115030.48+253206.0 19.30(0.03) 18.86(0.02) 19.09(0.02) 19.29(0.02) 6.38CDDS25 J115305.54+005646.1 18.42(0.02) 18.89(0.02) 19.38(0.02) 19.62(0.03) J115305.47+005645.8 18.50(0.02) 18.91(0.02) 19.34(0.02) 19.78(0.03) 1.22CDDS26B J115937.81+134413.9 Y 18.45(0.03) 18.07(0.02) 18.12(0.02) 18.16(0.02) J115937.82+134408.7 18.42(0.03) 18.28(0.02) 18.52(0.02) 18.75(0.03) 5.18CDDS27D3 J122739.16+661224.4 Y 17.72(0.02) 17.86(0.02) 18.13(0.02) 18.44(0.02) J122741.05+661224.3 18.23(0.02) 17.99(0.02) 18.21(0.02) 18.46(0.02) 11.43CDDS28 J131012.28+444728.3 17.88(0.01) 17.84(0.02) 18.02(0.01) 18.23(0.02) J131013.38+444717.8 17.95(0.01) 17.59(0.02) 17.85(0.01) 18.11(0.02) 15.71CDDS29B J131332.14+203039.6 Y 18.13(0.02) 17.80(0.02) 17.98(0.01) 18.19(0.02) J131332.56+203039.3 17.86(0.02) 17.48(0.02) 17.69(0.01) 17.91(0.02) 5.93CDDS30 J131421.70+305051.4 Y 18.59(0.10) 18.20(0.08) 18.22(0.09) 18.31(0.09) J131421.50+305050.5 18.23(0.04) 17.86(0.04) 17.88(0.05) 18.01(0.06) 2.76CDDS31B J132814.28+163151.5 Y 16.34(0.02) 16.27(0.02) 16.63(0.02) 16.99(0.02) J132814.36+163150.9 17.75(0.27) 17.65(0.23) 17.74(0.19) 17.84(0.15) 1.32CDDS32 J135713.14−065913.7 Y 18.94(0.04) 19.25(0.02) 19.76(0.02) 20.18(0.04) J135714.50−065856.9 18.58(0.04) 18.16(0.02) 18.35(0.02) 18.54(0.02) 26.29CDDS33D1 J150746.48+521002.1 Y 17.14(0.02) 16.91(0.03) 17.29(0.01) 17.55(0.02) J150746.80+520958.0 17.98(0.02) 17.76(0.03) 18.06(0.01) 18.33(0.02) 5.05CDDS34 J151508.30+143640.8 Y 18.38(0.02) 18.00(0.02) 18.20(0.01) 18.47(0.02) J151507.90+143635.4 19.76(0.03) 19.63(0.02) 19.88(0.02) 20.19(0.03) 7.90CDDS35 J154641.48+615901.7 19.07(0.03) 18.63(0.02) 18.75(0.02) 18.93(0.02) J154641.79+615854.3 17.16(0.02) 16.89(0.02) 17.17(0.02) 17.42(0.02) 7.64CDDS36 J155245.19+473129.5 Y 18.79(0.02) 18.71(0.02) 19.06(0.02) 19.36(0.03) J155244.41+473124.0 19.21(0.04) 18.99(0.03) 19.30(0.02) 19.61(0.03) 9.65CDDS37 J162650.11+482827.9 19.72(0.03) 19.62(0.02) 19.94(0.03) 20.20(0.04) J162652.12+482824.7 19.14(0.02) 18.98(0.01) 19.30(0.02) 19.59(0.02) 20.22CDDS38 J163647.81+092715.7 18.13(0.02) 17.72(0.01) 17.93(0.01) 18.18(0.01) J163647.33+092708.4 19.98(0.04) 19.54(0.02) 19.54(0.02) 19.66(0.03) 10.12CDDS39 J165737.90+620102.1 18.72(0.02) 18.65(0.01) 18.98(0.03) 19.23(0.02) J165734.39+620055.9 18.88(0.02) 18.53(0.01) 18.76(0.02) 18.99(0.02) 25.47CDDS40B J170355.91+330438.4 Y 19.16(0.02) 18.81(0.01) 18.86(0.01) 18.97(0.02) J170356.77+330435.7 18.48(0.02) 18.16(0.01) 18.27(0.01) 18.42(0.02) 11.16CDDS41 J173249.57+563900.0 19.35(0.03) 18.95(0.02) 19.12(0.02) 19.35(0.02) J173249.32+563858.8 18.99(0.04) 19.12(0.05) 19.27(0.06) 19.47(0.04) 2.36CDDS42 J175559.57+484359.9 19.04(0.03) 19.21(0.02) 19.39(0.02) 19.43(0.02) J175558.35+484348.8 18.02(0.02) 17.68(0.01) 17.90(0.01) 18.17(0.02) 16.41CDDS43 J204318.96+005841.8 18.51(0.03) 18.24(0.02) 18.42(0.01) 18.59(0.02) J204317.93+005830.5 18.96(0.03) 18.59(0.02) 18.75(0.01) 18.94(0.02) 19.13CDDS44 J211607.27+004503.1 18.60(0.02) 18.67(0.01) 18.89(0.01) 19.11(0.02) J211607.20+004501.3 19.43(0.10) 18.96(0.07) 19.05(0.09) 19.28(0.06) 2.06CDDS45 J213648.79+064320.2 18.07(0.02) 17.94(0.02) 18.24(0.01) 18.48(0.02) J213648.98+064318.2 19.72(0.04) 19.35(0.02) 19.39(0.03) 19.50(0.02) 3.44CDDS46 J214456.12+482352.9 19.19(0.03) 18.74(0.01) 18.83(0.02) 19.02(0.02) J214457.39+482345.5 19.81(0.05) 19.49(0.02) 19.49(0.02) 19.64(0.03) 14.67CDDS47 J215309.89+461902.7 18.15(0.02) 17.72(0.01) 17.90(0.01) 18.05(0.01) J215308.90+461839.1 18.88(0.03) 19.08(0.01) 19.36(0.02) 19.56(0.02) 25.68CDDS48B J222236.30−082808.0 Y 16.68(0.02) 16.41(0.02) 16.67(0.03) 16.92(0.03) J222236.56−082806.0 17.56(0.03) 17.11(0.07) 17.30(0.07) 17.47(0.06) 4.29CDDS49+ J222301.62+220131.3 L 15.66(0.01) 15.60(0.01) 15.91(0.01) 16.22(0.01) J222301.72+220124.9 16.37(0.01) 16.01(0.03) 16.20(0.03) 16.46(0.01) 6.56CDDS50B J222427.07+231537.4 Y 17.53(0.02) 17.15(0.02) 17.36(0.02) 17.47(0.02) J222426.91+231536.0 18.22(0.08) 17.77(0.07) 17.92(0.07) 17.94(0.06) 2.64CDDS51† J224231.14+125004.9 L 16.48(0.01) 16.23(0.02) 16.50(0.01) 16.74(0.02) J224230.33+125002.3 16.83(0.01) 16.50(0.02) 16.75(0.01) 16.97(0.02) 12.13CDDS52D3 J225932.74+140444.2 Y 19.02(0.03) 18.57(0.02) 18.68(0.01) 18.85(0.02) J225932.21+140439.2 16.16(0.02) 16.36(0.01) 16.78(0.01) 17.12(0.01) 9.14CDDS53 J233246.27+491712.0 18.76(0.02) 18.64(0.01) 18.91(0.01) 19.16(0.02) J233246.23+491709.1 19.02(0.06) 18.76(0.04) 19.04(0.04) 19.31(0.05) 2.96
∗ PG 0922+162A+B (Finley & Koester 1997)+ HS 2220+2146A+B (Koester et al. 2009)† HS 2240+1234 (Jordan et al. 1998)B Preliminary analysis presented in Baxter (2011)D1, D2, D3 DA + DAH pairings discussed in (Dobbie et al. 2012a, 2013) and Dobbie et al. (in preparation), respectively.
MNRAS 440, 3184–3201 (2014)

Non-magnetic white dwarf binaries in SDSS DR7 3187
3 SPEC TRO SC O PY
3.1 Observations and data reduction
While SDSS DR7 spectroscopy is available for objects in 18 ofour systems (highlighted in italics in Table 1), it often covers onlyone of the sources in a pairing (e.g. CDDS 40; Kleinman et al.2013), or, where the component angular separation is less than thediameter of the SDSS fibres (3 arcsec), it provides a blend of theenergy distributions of the two objects (e.g. CDDS 11; Dobbie et al.2013; Kepler et al. 2013). Therefore, to confirm or otherwise thedegenerate nature of both components of the candidate binaries inTable 1 and to determine their fundamental parameters, we haveacquired our own spatially resolved low-resolution optical spectro-scopic observations with a range of facilities, as described below. Asmuch of this spectroscopy was acquired in queue scheduling modeunder less than optimum sky conditions, many of the systems wehave followed up are from the brighter half of our sample and haveangular separations that are greater than 2 arcsec. There is some mi-nor overlap between our observations and the SDSS spectroscopy(CDDS 8-A + B, CDDS 26-B, CDDS 30-B and CDDS 40-A) andthe results of the Kleinman et al. (2013) analyses of these DR7 datasets can serve as a useful check on our work.
For bona fide degenerate objects, we have used our new spec-troscopic data to determine the dominant elemental component oftheir atmospheres and whether or not they harbour a substantialmagnetic field. In this work, we have focused on the non-magneticwhite dwarfs and have measured their effective temperatures andsurface gravities by comparing suitable absorption features withintheir spectra (e.g. H-Balmer lines) to the predictions of modernmodel atmospheres. Spectroscopically observed pairings with atleast one strongly magnetic component are analysed elsewhere(e.g. CDDS11, CDDS19, CDDS22, CDDS27, CDDS33, CDDS52;Dobbie et al. 2012a, 2013, Dobbie et al. in preparation). Thefive different telescopes we have sourced spectroscopy from are:the William Herschel Telescope (WHT) and the Gran TelescopioCanarias (GTC), both located at the Roche de las Muchachos Ob-servatory on La Palma, Gemini-North at the Mauna Kea Observa-tory on Hawaii, Gemini-South at Cerro Pachon in Chile and theVery Large Telescope (VLT) Antu located at the European South-ern Observatory’s (ESO) Cerro Paranal site in Chile. Details of theobservations obtained with each facility are provided below:
(i) Spectra of CDDS3, CDDS40 and CDDS50 were acquired invisitor mode with the WHT and the double-armed Intermediate dis-persion Spectrograph and Imaging System (ISIS) on the nights of2008 July 24–25 and 2011 September 5. These observations wereconducted when the sky was clear, with seeing ∼0.6–0.9 arcsec. Thespectrograph was configured with a 1.0 arcsec slit and the R300B(λ/δλ ≈ 1300) grating on the blue arm. The long exposures nec-essary to reach good signal-to-noise ratio were broken down intoseveral integrations of typically 1800 s (see Table 2), and were ac-quired using the 2 × 1 and 1 × 1 binning modes of the E2V CCDduring the 2008 and 2011 runs, respectively. The data frames weredebiased and flat fielded using the IRAF procedure CCDPROC. Cos-mic ray hits were removed using the routine LACOS SPEC (vanDokkum 2001). Subsequently, the spectra were extracted with theAPEXTRACT package and wavelength calibrated by comparison witha CuAr+CuNe arc spectrum taken immediately before and after thescience exposures. The removal of remaining instrument signaturefrom the science data was undertaken using observations of thebright DC white dwarfs WD 1918+386 and EG131.
(ii) Spectra of CDDS8, CDDS26, CDDS29, CDDS30, CDDS31and CDDS32 were obtained in visitor mode with VLT Antu andthe Focal Reducer and low dispersion Spectrograph (FORS2). Afull description of the FORS2 instrument may be found on theESO webpages.1 These observations were conducted on the nightsof 2010 February 6–7 and 2013 February 10–11. The sky condi-tions were fair to good at the time of these observations. All datawere acquired using the 2 × 2 binning mode of the E2V CCDand the 600B+24 grism. A 1.3 arcsec wide and a 1.0 arcsec wideslit were used for the 2010 and 2013 observations, respectively,providing notional spectral resolutions of λ/δλ ∼ 600 and λ/δλ ∼800. The data were reduced and extracted with IRAF routines, as perthe ISIS spectra, and wavelength calibrated by comparison with aHe+HgCd arc spectrum obtained within a few hours of the sci-ence frames. Remaining instrument signature was removed fromthe science data using observations of the bright DC white dwarfLHS2333.
(iii) Spectra of CDDS6 and CDDS48 were obtained in ser-vice mode with the Gemini Multi-Object Spectrograph (GMOS)mounted on the Gemini-North and Gemini-South telescopes dur-ing semesters 2009B (July 25) and 2010A (May 11), respectively.These observations were conducted when the sky conditions wererelatively poor (image quality 85 per cent and cloud cover 90 percent). The data were acquired using the 4 × 4 binning mode ofthe EEV CCD, a 2.0 arcsec wide slit and the B600 grating tunedto a central wavelength of 4100 Å. The notional resolution of thesespectra is λ/δλ ∼ 600. The data were reduced and extracted usingroutines in the GEMINI IRAF software package. A wavelength solu-tion for these data was obtained with a CuAr arc spectrum obtainedwithin hours of the science frames, while residual instrument sig-nature in the science data was removed using observations of thebright DC white dwarfs WD 1918+386 (north) and WD 0000-345(south).
(iv) Spectra of CDDS9, CDDS14, CDDS15, CDDS16, CDDS17,CDDS34 and CDDS36 were acquired in service mode with theGTC and the Optical System for Imaging and low ResolutionIntegrated Spectroscopy (OSIRIS) during semester 2013A.A detailed description of the OSIRIS instrument is provided onthe GTC webpages.2 Our observations were performed when skyconditions were less favourable (seeing≈1.2–1.5 arcsec and spec-troscopic transparency), using the 2 × 2 binning mode of the EEVCCD. With the R1000B grating, in conjunction with a 1.2 arcsecwide slit, we achieved a notional spectral resolution of λ/δλ ≈ 500.The data were reduced and extracted with IRAF routines as per theISIS spectra. Wavelength calibration was performed by comparingthese to a Hg + Ne arc spectrum acquired within a few hours of thescience frames. Particular care was taken to include the 3650.1 ÅHg I line at the very blue limit of our spectral coverage in our arcwavelength solution. Remaining instrument signature from the sci-ence data was removed using observations of the bright DC whitedwarf WD 1918+386.
The spectroscopic observations are summarized in Table 2. Wenoted above that three of our CDDS have been the subjects ofprevious spectroscopic studies, PG 0922+162 (Finley & Koester1997), HS 2220+2146 (Koester et al. 2009) and HS 2240+1234(Jordan et al. 1998). Throughout the rest of this work we adopt theparameters measured from a high-spectral resolution Koester et al.(2009) investigation of the components of these three pairings. We
1 http://www.eso.org/instruments/fors2/2 http://www.gtc.iac.es/instruments/osiris/osiris.php
MNRAS 440, 3184–3201 (2014)

3188 R. B. Baxter et al.
Table 2. Summary of our spectroscopic observations, including telescope/instrument combi-nation and exposure times, of the candidate young, wide, double-degenerates within the SDSSDR7 imaging (RA = 0–12h).
ID SpT SDSS Telescope/Instrument Exposure Nexp
CDDS3-A DA J005212.73+135301.1WHT + ISIS 2400 s 5
CDDS3-B DA J005212.26+135302.0
CDDS6-A DA J021131.52+171428.3GEM-N + GMOS 2000 s 3
CDDS6-B DA J021131.51+171430.4
CDDS8-A DA J033236.86-004936.9VLT + FORS 600 s 2
CDDS8-B DA J033236.60−004918.4
CDDS9-A DA J054519.81+302754.0GTC + OSIRIS 2400 s 3
CDDS9-B DA J054518.98+302749.3
CDDS14-A DA J080644.09+444503.2 >GTC + OSIRIS 600 s 3
CDDS14-B DA J080643.64+444501.4
CDDS15-A DB J084952.87+471249.4GTC + OSIRIS 240 s 3
CDDS15-B DA J084952.47+471247.7
CDDS16-A DA J085915.50+330637.6GTC + OSIRIS 600 s 3
CDDS16-B DA J085915.02+330644.6
CDDS17-A DA J085917.36+425031.6GTC + OSIRIS 900 s 3
CDDS17-B DA J085917.23+425027.4
CDDS18-A∗ DA J092513.48+160144.1Koester et al. (2009)
CDDS18-B∗ DA J092513.18+160145.4
CDDS26-A DA J115937.82+134408.7VLT + FORS 600 s 2
CDDS26-B DA J115937.81+134413.9
CDDS29-A DA J131332.56+203039.3VLT + FORS 300 s 2
CDDS29-B DA J131332.14+203039.6
CDDS30-A DA J131421.70+305051.4VLT + FORS 600 s 2
CDDS30-B DA J131421.50+305050.5
CDDS31-A DA J132814.36+163150.9VLT + FORS 300 s 2
CDDS31-B DA J132814.28+163151.5
CDDS32-A DA J135714.50−065856.9VLT + FORS 600 s 1
CDDS32-B sdO J135713.14−065913.7
CDDS34-A DA J151508.30+143640.8GTC + OSIRIS 1800 s 3
CDDS34-B DA J151507.90+143635.4
CDDS36-A DA J155245.19+473129.5GTC + OSIRIS 900 s 3
CDDS36-B DA J155244.41+473124.0
CDDS40-A DA J170356.77+330435.7WHT + ISIS 1800 s 7
CDDS40-B DA J170355.91+330438.4
CDDS48-A DA J222236.56−082806.0GEM-S + GMOS 1800 s 3
CDDS48-B DA J222236.30−082808.0
CDDS49-A+ DA J222301.72+220124.9Koester et al. (2009)
CDDS49-B+ DA J222301.62+220131.3
CDDS50-A DA J222427.07+231537.4WHT + ISIS 1200 s 2
CDDS50-B DA J222426.91+231536.0
CDDS51-A† DA J224231.14+125004.9Koester et al. (2009)
CDDS51-B† DA J224230.33+125002.3
∗ PG 0922+162A+B (Finley & Koester 1997).+ HS 2220+2146A+B (Koester et al. 2009)† HS 2240+1234 (Jordan et al. 1998)
MNRAS 440, 3184–3201 (2014)

Non-magnetic white dwarf binaries in SDSS DR7 3189
Figure 2. Low-resolution optical spectroscopy for the components of candidate binary systems in the range (a) RA = 0–12 h and (b) RA = 12–24 h. Thesedata have been normalized by dividing by the median flux in the interval λ = 4180–4220 Å.
re-affirm their results for HS 2220+2146 from our measurements ofa low-resolution Gemini-N/GMOS spectrum (Teff = 19 020 ± 438,log g = 8.37 ± 0.07 and Teff = 13 950 ± 321, log g = 8.07 ± 0.07 forSDSS J222301.62+220131.3 and SDSS J222301.72+220124.9,respectively).
4 DATA A NA LY SIS
4.1 White dwarfs, effective temperatures, surface gravitiesand distances
Our optical spectroscopy (Fig. 2) reveals through the presence ofbroad H-Balmer line series, that the overwhelming majority of the
objects we have followed up are white dwarfs with hydrogen-rich atmospheres (DAs). As discussed in companion papers, allthe non-magnetic white dwarfs in six additional spectroscopicallyobserved pairings harbouring a strongly magnetic component, alsoappear to have hydrogen-dominated atmospheres (e.g. Dobbie et al.2012a, 2013). The spectrum of one object in our sample, CDDS15-A (SDSS J084952.87+471249.4), features strong, pressure broad-ened, He I lines, consistent with if being a degenerate with a helium-dominated atmosphere (DB). The energy distribution of CDDS32-B (SDSS J135713.14−065913.7) appears to be that of an evolvedsubdwarf star (sdO) which is likely to be located at a distance ofseveral kiloparsec (compared to only several hundred parsec for thewhite dwarf CDDS32-A). Consequently, the CDDS32 pairing is notconsidered further.
MNRAS 440, 3184–3201 (2014)

3190 R. B. Baxter et al.
Figure 2 – continued
We have measured the effective temperatures and surface grav-ities of the DAs by comparing the observed lines, H-8 to H-β, toa grid of synthetic profiles based on recent versions of the plane-parallel, hydrostatic, local thermodynamic equilibrium atmosphereand spectral synthesis codes ATM and SYN (e.g. Koester 2010). Thesemodels include an updated physical treatment of Stark broadeningof H I lines (Tremblay & Bergeron 2009). The effective temperatureand surface gravity of the DB (CDDS15-A) has been measured bycomparing the normalized observed energy distribution within thewavelength range 3750–5150 Å, to a grid of similarly normalizedsynthetic spectra. These were also generated using ATM and SYN, inthis case tuned for the treatment of helium rich atmospheres. Ourmodel fitting was undertaken with the spectral analysis package
XSPEC (Shafer 1991) as described in previous work (e.g. Dobbieet al. 2009). The errors in our parameters determinations have beencalculated by stepping that in question away from its optimumvalue until the difference between the two values of the fit statis-tic (�χ2), corresponds to 1σ for a given number of free modelparameters (e.g. Lampton, Margon & Bowyer 1976). However, asthese are only formal (internal) estimates of the errors on effec-tive temperature and surface gravity, and may underestimate thetrue uncertainties, we have assumed their magnitudes to be at least2.3 per cent and 0.07 dex, respectively, for the DA stars (Napi-wotzki, Green & Saffer 1999) and at least 2.3 per cent and 0.05 dex,respectively, for the DB-type objects (Bergeron et al. 2011). Incases where the fitting provided two solutions for the effective
MNRAS 440, 3184–3201 (2014)

Non-magnetic white dwarf binaries in SDSS DR7 3191
Figure 3. Plot of our estimates of effective temperature and surface gravityagainst the SDSS DR7 spectroscopic-based measurements of Kleinman et al.(2013) for five white dwarfs in common to our spectroscopic sample andthe DR7 white dwarf catalogue.
temperature of a star, we compared its observed photometry to syn-thetic colours (e.g. Bergeron, Wesemael & Beauchamp 1995) tobreak the degeneracy.
The results of our analysis procedure are listed in Table 3. Ascan be seen from Fig. 3, our measurements of these parametersfor the five objects that are common to both the DR7 white dwarfcatalogue and our spectroscopic follow-up are generally accordantwith those of Kleinman et al. (2013). The surface gravity estimatesfor CDDS 8-A and CDDS 40-B deviate at around 2σ from theone-to-one relation. It is conceivable that these differences are sta-tistical in nature but, considering our observations for both theseobjects have provided data of excellent signal-to-noise ratio for thegravity sensitive spectral features, systematic error could also be thecause. The former object is the hottest white dwarf in our spectro-scopic sample and has relatively weak high order Balmer lines in thewavelength regime (λ < 4000 Å) where the response of the SDSSspectrographs changes shape (decreases) rapidly. The effective tem-perature we measure for CDDS 8-B is also lower by around 500 Kthan the Kleinman et al. (2013) determination, yet both the SDSSdata and our spectrum for this object provide strong signal-to-noisecoverage of the potent temperature diagnostic Balmer lines e.g. Hγ
and Hβ. We discuss this object in more detail in Section 7.3, but fornow note that it is a pulsating white dwarf.
Subsequently, we have derived the absolute r magnitudes of eachwhite dwarf by interpolating (using cubic-splines) within grids ofmodern synthetic photometry3 to the measured effective tempera-ture and surface gravity. The He-rich grids, relevant to CDDS15-A,originate from the work of Bergeron et al. (2011). The H-rich grids,appropriate to the DAs, are based on the work of Bergeron et al.(1995) but revised to include updates from Holberg & Bergeron(2006), Kowalski & Saumon (2006) and Tremblay et al. (2011).Spectroscopically derived effective temperatures and surface grav-ities are known to lead to systematic overestimates of DA whitedwarf masses at Teff < 12 500 K (e.g. Bergeron et al. 1995; Ke-pler et al. 2007). We have adjusted the derived parameters of ouraffected objects by subtracting mass offsets, which have been de-termined from the data points shown in fig. 19 of Tremblay et al.(2011). These data points have been verified to provide a fair rep-resentation of the systematic overestimate through examining themwith respect to the departures between the two mass estimates wehave made for the subset of our cool degenerates that are pairedwith a white dwarf with Teff > 12 500 K, i.e. the wholly spectro-scopic mass estimate and the mass derived from the spectroscopic
3 http://www.astro.umontreal.ca/bergeron/CoolingModels
Figure 4. Plot of the departures between the wholly spectroscopically de-rived mass and that derived from the spectroscopic effective temperature andthe SDSS photometry under the assumption that the components lie at thesame distance, for five white dwarfs with Teff < 12 500 K in wide double-degenerate pairings where the companion stars have Teff > 12 500 K and thecomponents have highly significant and consistent proper motions (filledsquares, from left to right, CDDS26-B, CDDS8-B, CDDS50-B, CDDS3-A and CDDS48-A). The increase in the mean spectroscopic mass belowTeff < 12 500 K, with respect to the value at Teff > 13 000 K, found byTremblay, Bergeron & Gianninas (2011) in their study of the SDSS DR4white dwarf sample is also shown (filled hexagons and dashed line).
effective temperature and the SDSS photometry under the assump-tion that the components lie at the same distance (Fig. 4 and nextsection). Finally, to help appraise the physical reality of our pairs wehave calculated the distance moduli of the white dwarfs, neglectingforeground extinction (Table 3 and Fig. 5). Dust maps suggest thatthis is very low along the majority of these Galactic lines of sight(Schlegel, Finkbeiner & Davis 1998). Moreover, our conclusionsare primarily sensitive to differential reddening and given the angu-lar proximity of our targets, for physical systems this is likely to bevery small.
4.2 Astrometry
To assess further the physical reality of our candidate binaries, wehave performed astrometry on their components. In the majorityof cases, we have conducted these measurements with the posi-tions of sources from the full United States Naval Observatory B1.0(USNO-B) catalogue (Monet et al. 2003) and from the SDSS. Wehave followed a methodology similar to that adopted by Kraus& Hillenbrand (2007) and the PPMXL survey (Roeser, Demleit-ner & Schilbach 2010) to shift the former on to the InternationalCelestial Reference System (ICRS). In brief, we determined thetangent plane coordinates, ξ and η, corresponding to each photo-graphic epoch, for all sources within several degrees of our pairsfrom their catalogued year 2000.0 positions, their tangent planeproper motions, their fit residuals and the dates of their photo-graphic imaging. We next calculated for each object the celestialcoordinates at the mean USNO epoch and at all photographic epochs(J2000.0) with the catalogued positions, the tangent plane coordi-nates for epoch 2000.0 and routines in STARLINK SLALIB. Subse-quently, we cross-correlated sources brighter than R2 = 16.5 mag.with objects listed in the Fourth United States Naval ObservatoryCCD Astrograph Catalog (UCAC4; Zacharias et al. 2013) that havelow proper motions (μ < 5 mas yr−1) and small proper motion
MNRAS 440, 3184–3201 (2014)

3192 R. B. Baxter et al.
Table 3. Our effective temperature and surface gravity measurements for the components of the wide white dwarf + white dwarf candidate binary systems.The predicted absolute r magnitudes, distance modulii, masses and proper motions for these objects are also listed. Where deemed necessary, parameters havebeen modified to account for the spectroscopic overestimate of mass which occurs at Teff < 12 500 K (column 4; see text for further details). An assessment ofthe physical nature of each pairing has been made by considering a Bayes factor estimated from the distances and the astrometry of the components.
ID Teff log g �M Mr r − Mr M μαcos δ, μδP (data|C)P (data|F ) DD?
(K) (log10(cm s−2)) (M�) (mag) (mag) (M�) (mas yr−1)
CDDS3-A 10 828 ± 249 8.16 ± 0.07 −0.16 11.87+0.16−0.16 7.05 ± 0.17 0.54 ± 0.06 4.7 ± 4.4, −41.6 ± 4.4 345
√CDDS3-B 19 116 ± 440 7.94 ± 0.07 – 10.96+0.12
−0.12 7.02 ± 0.11 0.59 ± 0.04 8.6 ± 4.4, −41.8 ± 4.4
CDDS6-A 24 788 ± 570 8.06 ± 0.07 – 10.69+0.11−0.12 6.39 ± 0.12 0.67 ± 0.04 −50.9 ± 18.3, −2.6 ± 10.7 91
√CDDS6-B 18 502 ± 426 8.06 ± 0.07 – 11.19+0.11
−0.11 6.46 ± 0.14 0.65 ± 0.04 −34.7 ± 18.3, 3.6 ± 10.7
CDDS8-A 33 725 ± 776 7.97 ± 0.07 – 9.90+0.13−0.12 6.19 ± 0.13 0.64 ± 0.04 −31.2 ± 3.2, −23.6 ± 3.2 1395
√CDDS8-B 10 442 ± 240 8.31 ± 0.07 −0.17 12.18+0.17
−0.16 6.12 ± 0.17 0.63 ± 0.06 −28.4 ± 3.2, −23.9 ± 3.2
CDDS9-A 11 636 ± 410 7.95 ± 0.13 −0.11 11.51+0.24−0.25 8.45 ± 0.25 0.47 ± 0.04 −4.0 ± 3.9, −9.8 ± 3.9 11
√
CDDS9-B 16 410 ± 524 7.96 ± 0.11 – 11.25+0.17−0.17 8.55 ± 0.17 0.59 ± 0.05 2.6 ± 4.1, −14.2 ± 3.9
CDDS14-A 12 185 ± 280 8.11 ± 0.07 −0.07 11.76+0.15−0.14 6.56 ± 0.15 0.60 ± 0.06 4.0 ± 3.2, −2.1 ± 3.2 130
√CDDS14-B 10 140 ± 233 8.23 ± 0.08 −0.18 12.12+0.18
−0.18 6.70 ± 0.18 0.56 ± 0.06 5.6 ± 3.2, −0.4 ± 3.2
CDDS15-A 16 992 ± 391 7.84 ± 0.07 – 10.92+0.11−0.11 6.16 ± 0.12 0.51 ± 0.04 −88.0 ± 3.0, −76.9 ± 3.0 >10000
√CDDS15-B 11 127 ± 256 8.08 ± 0.07 −0.14 11.72+0.16
−0.16 6.07 ± 0.17 0.51 ± 0.06 −82.3 ± 3.0, −76.5 ± 3.0
CDDS16-A 11 032 ± 872 7.94 ± 0.39 −0.15 11.48+0.70−0.90 7.39 ± 0.81 0.42 ± 0.22 3.0 ± 4.1, 3.4 ± 4.1 10
√
CDDS16-B 11 837 ± 824 8.21 ± 0.18 −0.10 11.89+0.35−0.40 6.45 ± 0.35 0.63 ± 0.12 −0.8 ± 4.1, −0.3 ± 4.1
CDDS17-A 10 074 ± 232 8.46 ± 0.13 −0.18 12.51+0.25−0.24 6.50 ± 0.25 0.71 ± 0.09 15.3 ± 2.9, −15.1 ± 2.9 119
√CDDS17-B 11 083 ± 254 8.23 ± 0.08 −0.15 11.95+0.17
−0.17 6.58 ± 0.18 0.60 ± 0.06 14.3 ± 2.9, −9.2 ± 2.9
CDDS26-A 16 401 ± 377 8.94 ± 0.07 – 12.93+0.15−0.14 5.59 ± 0.15 1.17 ± 0.03 −19.9 ± 3.0, −42.8 ± 3.0 1266
√CDDS26-B 9504 ± 219 8.20 ± 0.07 −0.20 12.24+0.18
−0.18 5.88 ± 0.18 0.52 ± 0.06 −21.1 ± 3.0, −45.2 ± 3.0
CDDS29-A 12 758 ± 293 8.18 ± 0.07 – 11.96+0.11−0.10 5.73 ± 0.11 0.72 ± 0.04 −31.6 ± 2.9, 26.4 ± 2.9 1992
√CDDS29-B 13 072 ± 301 8.41 ± 0.07 – 12.28+0.12
−0.11 5.70 ± 0.12 0.87 ± 0.05 −26.8 ± 2.9, 27.8 ± 2.9
CDDS30-A∗ 9203 ± 212 8.14 ± 0.07 −0.18 12.30+0.17−0.18 5.92 ± 0.20 0.50 ± 0.06 −45.3 ± 14.9, 33.5 ± 14.8 125
√CDDS30-B 10 293 ± 237 8.21 ± 0.07 −0.18 12.04+0.17
−0.18 5.84 ± 0.18 0.55 ± 0.06 −43.1 ± 14.9, 32.5 ± 14.8
CDDS31-A 14 037 ± 323 8.45 ± 0.07 – 12.25+0.12−0.12 5.49 ± 0.22 0.89 ± 0.05 −26.3 ± 27.3, 20.0 ± 12.7 54
√CDDS31-B 20 000 ± 460 8.19 ± 0.07 – 11.27+0.12
−0.12 5.36 ± 0.12 0.74 ± 0.04 −50.8 ± 27.3, 22.8 ± 12.7
CDDS34-A 14 100 ± 398 7.86 ± 0.07 – 11.37+0.11−0.11 6.83 ± 0.11 0.53 ± 0.04 0.2 ± 3.5, −22.2 ± 3.5 1 ×
CDDS34-B 18 261 ± 598 7.90 ± 0.12 – 10.98+0.18−0.18 9.00 ± 0.19 0.56 ± 0.07 0.1 ± 3.5, −0.2 ± 3.5
CDDS36-A 18 769 ± 432 7.94 ± 0.07 – 10.99+0.11−0.11 8.06 ± 0.11 0.59 ± 0.04 −5.7 ± 4.2, −12.5 ± 4.2 72
√CDDS36-B 16 542 ± 380 7.91 ± 0.07 – 11.16+0.11
−0.11 8.14 ± 0.11 0.57 ± 0.04 −7.7 ± 4.2, −7.7 ± 4.2
CDDS40-A 11 207 ± 258 8.22 ± 0.07 −0.14 11.93+0.16−0.16 6.34 ± 0.16 0.60 ± 0.06 2.5 ± 3.1, −50.8 ± 3.1 2418
√CDDS40-B 9888 ± 227 8.42 ± 0.07 −0.19 12.48+0.17
−0.16 6.38 ± 0.17 0.68 ± 0.06 1.3 ± 3.1, −50.6 ± 3.1
CDDS48-A 11 453 ± 263 8.35 ± 0.07 −0.13 12.11+0.16−0.15 5.19 ± 0.17 0.69 ± 0.06 −2.3 ± 8.4, −29.2 ± 7.4 2530
√CDDS48-B 15 834 ± 364 8.02 ± 0.07 – 11.40+0.11
−0.11 5.27 ± 0.11 0.63 ± 0.04 −0.0 ± 8.4, −28.0 ± 7.4
CDDS50-A 12 739 ± 293 8.04 ± 0.07 – 11.76+0.10−0.10 5.60 ± 0.11 0.63 ± 0.04 38.3 ± 10.8, −0.9 ± 8.8 126
√CDDS50-B 10 718 ± 247 8.26 ± 0.07 −0.16 12.06+0.16
−0.16 5.86 ± 0.18 0.60 ± 0.06 32.8 ± 10.8, −0.9 ± 8.8
†Proper motion measurements are obtained with respect to nearby stars.∗Possible triple system, dK + WD + WD.
uncertainties (�μ < 5 mas yr−1). We derived the ICRS positionsof the matched objects at each photographic epoch and finally, esti-mated any offsets between these and the USNO-B coordinates usinga maximum-likelihood technique.
We calculated absolute proper motions by performing a least-squares linear fit in each axis to the USNO-B coordinates on theICRS and the SDSS positions as a function of date, weighting ac-cording to crude uncertainty estimates of 50 and 230 mas for SDSS
and photographic epochs, respectively (e.g. Kraus & Hillenbrand2007; Roeser et al. 2010). In this final step, we used only astrometryfrom photographic images where a visual inspection revealed thecomponents to be clearly resolved. In cases where there was mildblending we relied on SEXTRACTOR (Bertin & Arnouts 1996) and aMexican hat filter for a more robust discrimination of the compo-nents and their photocentres. However, several of our pairings werefound to be sufficiently blended in all photographic epochs that we
MNRAS 440, 3184–3201 (2014)

Non-magnetic white dwarf binaries in SDSS DR7 3193
Figure 5. The derived distance modulii of the white dwarfs in our candidate binaries. The components of all but one system have consistent distances, asexpected for physical binary systems.
had to adopt a different approach. In these cases we generally reliedon the SDSS DR7 r-band coordinates as a first epoch and posi-tions from additional electronic imaging for the second epoch. Weobtained i-band frames for CDDS6A and CDDS31 on 2011 Febru-ary 12 using the Isaac Newton Telescope and Wide Field Camera.We extracted positions from J-band United Kingdon Infrared tele-scope Deep Sky Survey (UKIDSS; Hewett et al. 2006; Casali et al.2007; Lawrence et al. 2007; Hambly et al. 2008; Hodgkin et al.2009; 2010 February 22) and Y-band Visible and Infrared Survey
Telescope for Astronomy (VISTA; McMahon 2012; 2012 Septem-ber 9) imaging for CDDS30 and CDDS48, respectively. Positionsfor the components of CDDS50 were obtained from two epochsof SDSS r-band imaging separated by approximately 5 yr (2004September 17 and 2009 October 17). We employed routines in theSTARLINK SLALIB library to construct six coefficient linear trans-forms between the two sets of coordinates for each putative system,iteratively clipping 3σ outliers from the fits (e.g. Dobbie et al. 2002).Subsequently, we determined relative proper motions by taking the
MNRAS 440, 3184–3201 (2014)

3194 R. B. Baxter et al.
differences between the observed and calculated locations of candi-dates in the second epoch imaging and dividing by the time baselinebetween the two observations. Astrometric measurements for thecomponents of all spectroscopically observed pairs are displayed inTable 3.
4.3 Physical system or chance alignment?
A casual inspection of Fig. 5 reveals that our distance moduliiestimates for the components in most pairings overlap with oneand other. Moreover, the white dwarfs in 10 out of the 17 newcandidate binaries have proper motions that are both significant(μ/δμ � 3) and internally consistent, supporting the notion that asizeable majority of our pairs are physical systems. Only one system,CDDS 34, displays a large and statistically significant (greater than5σ ) disparity between the distance modulii of its components. Ourastrometric measurements also appear strongly discordant (by 4σ
on the declination axis) for the components of this system. While wecould simply dismiss this one candidate out of hand and accept theothers as bona fide binary systems, we have attempted to assess thephysical reality of all 17 pairs more quantitatively within a ‘Naive’Bayesian scheme (e.g. Zheng 1998).
In this approach, we adopted the brightest object (at r) in eachpair as a putative primary star and estimated a Bayes factor for twocompeting models that can account for the secondary component.We assumed that it could be either a physical companion (C) or afield white dwarf (F) such that the sum of the probabilities, P(C), itis a companion and P(F), it is a field star, P(C) + P(F) = 1. Con-sidering each candidate binary in turn, we first defined a probabilitydistribution function for the distance of the secondary star, in case itis a field white dwarf, P (dist | F ). We divided the visibility cone inthe direction of the pair into a series of thin slices (out to 1250 pc)and integrated the luminosity function of De Gennaro et al. (2008)over the bolometric magnitude range that is consistent with our sur-vey limits and the mean distance of each slice (adopting log g = 8.0white dwarfs and using the synthetic photometry of the Montrealgroup to translate between Mbol and Mr) to obtain estimates ofthe number of white dwarfs per cubic parsec. After factoring inthe 300 pc Galactic scaleheight of the white dwarf population (e.g.Vennes et al. 2002), we multiplied the resulting values by the slicevolumes to obtain the number of objects within each region alongthe visibility cone. This distribution function was normalized overthe range 0–1250 pc, outwith of which it is effectively zero (due tothe magnitude limit of our survey).
Next, we defined a probability distribution function for the propermotion of the secondary star in case it is a field white dwarf,P (pm | F ). We obtained absolute proper motions from the Super-COSMOS Sky Survey data base (Hambly et al. 2001) for all whitedwarfs listed in the SDSS DR7 spectroscopic catalogue (Kleinmanet al. 2013), meeting our photometric selection criteria and lyingwithin 20◦ of a candidate binary. We modelled the distribution ofthese proper motions with an asymmetric pseudo-Voigt profile,4
normalizing this function over the range −150 to +150 mas yr−1 oneach axis (the distributions are effectively zero beyond these limits).For the probability distributions of the distance and proper motion ofthe secondary star, in case it is a companion white dwarf, P (dist | C)and P (pm | C), respectively, we adopted normalized Gaussian func-tions centred on the values observed for the primary component
4 www.xray.cz/xrdmlread/PseudoVoigtAsym-m
and with widths corresponding to the uncertainties in these mea-surements. Similarly, for the conditional probabilities of the ob-served secondary star distances and proper motions, P (data | dist)and P (data | pm), we adopted normalized Gaussian functions cen-tred on the observed values for the secondary component and withwidths matching the uncertainties in those measurements
P (data | C) =∫ 1250
0P (data | dist)P (dist | C)d dist
×∫ 150
−150P (data | pm)P (pm | C)d pm (2)
P (data | F ) =∫ 1250
0P (data | dist)P (dist | F )d dist
×∫ 150
−150P (data | pm)P (pm | F )d pm (3)
Subsequently, we used equations (2) and (3) to calculate P (data |C) and P (data | F ), respectively (e.g. Kass & Raftery 1995), foreach candidate binary, where the integrals were evaluated by sam-pling the functions at several thousand points across their respectiveranges. The ratios of these parameters, as listed in the final columnof Table 3, are the approximate Bayes factors of our models. For un-informative priors (i.e. P(C) = P(F) = 0.5), they equate to the ratiosof the posterior probabilities of the two models for the secondary,P(C|data) and P(F|data). An inspection of the Bayes factors inTable 3 reveals that physical association of the components isstrongly and very strongly favoured in 2 and 14 pairings, respec-tively, (Jeffreys 1961). Only the pair we suspected above to benon-physical, CDDS 34, is rated as more likely to be a chancealignment. Consequently, we do not consider it further in this work.
5 WI DE BI NARY WHI TE DWARF MASSES
5.1 The young, wide, double-degenerate mass distribution
We have expanded our sample of 16 binaries by folding in three pre-viously known hot, wide, non-magnetic, double-degenerates that liewithin the footprint of SDSS DR7. We have confirmed these to bephysical systems by subjecting their components to the same anal-ysis we performed on our new candidate binaries (see Table 4).Subsequently, we have built a mass distribution from the 38 whitedwarfs of this enlarged sample (Fig. 6). This distribution is of im-portance because it conveys information relating to the initial massfunction of the progenitor stellar population and the stellar IFMR(e.g. Ferrario et al. 2005).
While the white dwarf mass distribution has been determinedseveral times previously, these efforts have been based on samplesdominated by isolated field objects e.g. from the SDSS DR4 (Kepleret al. 2007) and from the Palomar-Green (PG; Liebert, Bergeron &Holberg 2005) surveys. These distributions are loosely describedin terms of three peaks, a main one located around M = 0.6 M�which arises from the progeny of the numerous F dwarfs of theGalactic disc, a high-mass one centred at M = 0.8–0.9 M�, oftenattributed to binary mergers (e.g. Yuan 1992) but which more recentkinematic work links to early-type stars that naturally lead to largerremnants (Wegg & Phinney 2012), and a low-mass one stationedaround M = 0.4 M�, associated with close binary evolution andthe non-conservative transfer of mass (e.g. Marsh, Dhillon & Duck1995). It is important to note that in magnitude-limited samples
MNRAS 440, 3184–3201 (2014)

Non-magnetic white dwarf binaries in SDSS DR7 3195
Table 4. Effective temperatures and surface gravities obtained from Koester et al. (2009) for the components of three previously identified wide DA + DAbinary systems. We also list the theoretical absolute r magnitudes, the distance modulii, the masses and the proper motions for these white dwarfs.
ID Teff log g �M Mr r − Mr M μαcos δ, μδP (data|C)P (data|F ) DD?
(K) (log10(cm s−2)) (M�) (mag) (mag) (M�) (mas yr−1)
CDDS18-A 23 537 ± 541 8.23 ± 0.07 – 11.05+0.12−0.12 5.50 ± 0.12 0.77 ± 0.04 −49.9 ± 9.9, −30.3 ± 9.9 61
√CDDS18-B 25 783 ± 593 9.04 ± 0.07 – 12.39+0.16
−0.16 5.12 ± 0.18 1.22 ± 0.03 −33.5 ± 9.9, −34.0 ± 9.9
CDDS49-A 14 601 ± 336 8.08 ± 0.07 – 11.62+0.11−0.12 4.58 ± 0.12 0.66 ± 0.04 53.0 ± 3.6, −71.1 ± 3.6 �10 000
√CDDS49-B 18 743 ± 431 8.24 ± 0.07 – 11.45+0.12
−0.12 4.46 ± 0.12 0.77 ± 0.04 54.0 ± 3.6, −75.5 ± 3.6
CDDS51-A 15 636 ± 360 7.86 ± 0.07 – 11.19+0.11−0.10 6.24 ± 0.11 0.54 ± 0.04 −32.8 ± 3.1, −69.7 ± 3.1 >10000
√CDDS51-B 13 935 ± 321 7.99 ± 0.07 – 11.57+0.11
−0.11 6.35 ± 0.13 0.60 ± 0.04 −31.3 ± 3.1, −74.4 ± 3.1
Figure 6. Normalized mass distribution for our binary white dwarf sample(heavy dashed line). The normalized mass distribution for the 303 whitedwarfs with Teff > 12 000 K in the Palomar-Green survey is overplotted(thin solid line).
such as those from the PG and the SDSS DR4 surveys, low- andhigh-mass white dwarfs are over- and underrepresented due to theirgreater and lesser than average intrinsic luminosities, respectively(e.g. see Liebert et al. 2005, for discussion).
It is apparent from Fig. 6 that the mass distribution of our largelymagnitude-limited sample of young, wide double-degenerates, alsodisplays a strong peak around 0.6 M�. Indeed, we find the meanmasses of the 300 PG white dwarfs with Teff > 12 500 K (we excludePG0922+162 and do not attempt to apply our mass corrections atlower temperatures since Liebert et al. used a previous generationof synthetic spectra) and ours, 0.60 M� and 0.65 M�, respectively,to be comparable. Some of the small difference in these meansis likely attributable to our use of more modern synthetic H-lineprofiles (see e.g. Tremblay et al. 2011) although unlike the massdistribution of the PG white dwarfs, where there is a prominentpeak around 0.4 M� and 37 objects with M < 0.5 M�, our binarysample harbours only two objects with masses that are likely tobe M < 0.5 M�. From drawing 10 000 random subsamples of 38white dwarfs from the PG sample, we estimate the likelihood of
there being two or fewer objects with M < 0.5 M� in our sampleas P ∼ 0.2, suggesting that, for now, the observed shortfall is notsignificant. A relative deficit of low-mass objects might becomeapparent in a larger wide, double-degenerate sample because it islikely that low-mass products of close binary evolution located intriple-degenerate systems will generally be partnered in wider orbitsby white dwarfs of canonical mass. These have smaller radii and areintrinsically fainter, reducing the influence of the luminosity biasthat operates in favour of the detection of low-mass white dwarfs inisolated samples.
Following the same Monte Carlo approach applied above, wefind the presence of two white dwarfs amongst our 19 binaries(CDDS 18-B and CDDS 26-A), which sit well above recent theo-retical predictions for the minimum mass of ONe core degenerates(e.g. M ∼ 1.05–1.1 M�; Gil-Pons et al. 2003; Siess 2007) to repre-sent a significant excess (P ∼ 0.05). In the PG sample, only 3 out of300 objects have masses this large. The formation of ultramassivewhite dwarfs remains a matter of some debate since it is unclearif the putative single super-AGB progenitor stars (Minit > 6 M�;e.g. Eldridge & Tout 2004; Bertelli et al. 2009) lose their envelopessufficiently rapidly to prevent their degenerate cores growing untilthey detonate as electron capture supernovae. Although the ultra-massive field degenerate GD 50 has been linked with the recentPleiades star formation event (Dobbie et al. 2006b), it is intrigu-ing that no white dwarfs with masses as large as these two objectshave yet been unearthed within open clusters (Dobbie et al. 2012b;Williams, Bolte & Koester 2009). Considering their masses are dis-tinctly similar to the sum of the masses of two objects from the mainpeak in the mass distribution, alternatively, these white dwarfs mighthave formed through double-degenerate merging (e.g. Vennes et al.1997). While this putative merging process would likely lead todiscord between the cooling times of the components of these twosystems (e.g. see the discussion relating to RE J0317-853; Barstowet al. 1995; Ferrario et al. 1997; Burleigh, Jordan & Schweizer 1999;Kulebi et al. 2010), the fundamental parameters of PG 0922+162Aand PG 0922+162B (CDDS 18) appear to fit entirely within theframework of standard stellar evolution (see Section 6). In the caseof CDDS26, coherence between the component cooling times isless satisfactory but there is no overwhelming disparity which flagsa more exotic evolutionary history for CDDS26-A.
More broadly, it is of interest that the majority of the higher massstars in our binary sample are paired with each other. The simplestexplanation for this favours these objects being the progeny of early-type stars. The white dwarfs within the peak of the mass distributionare typically the end points of stars which have reasonably long liveson the main sequence (at least several Gyr). The bulk of companion(higher mass) white dwarfs originating from early-type stars with
MNRAS 440, 3184–3201 (2014)

3196 R. B. Baxter et al.
relatively short main-sequence lifetimes will have cooled belowTeff ≈ 8000–9000 K (e.g. 2.5 Gyr for 0.9 M�) and moved out withour colour selection region prior to the formation of a double-degenerate system. It is widely documented that stars of greatermass are more likely to reside in multiple systems than those oflower mass. The binary fraction for the lowest mass M dwarfsis estimated to be only 25–35 per cent (e.g. Reid & Gizis 1997;Delfosse et al. 2004), while it is found to be around 70 per centfor the O and B stars (e.g. Mason et al. 1998; Sana et al. 2008).However, as the binary fraction of the F- and G-type stars (theprogeny of which dominate the white dwarf mass distribution) isonly slightly lower than this at 50–60 per cent (Abt & Levy 1976;Duquennoy & Mayor 1991), it seems unlikely that gross variationsin the binary fraction with stellar mass can account for the excess ofvery high mass degenerates in our study. Alternatively, it could havearisen because the projected separation distribution of companionsto early-type stars like the progenitors of these white dwarfs ispeaked at several hundred au compared to a few tens of au, as forstars of later spectral type (Patience et al. 2002; De Rosa et al. 2014).During the final stages of stellar evolution, when the orbits widened,following Jean’s theorem (e.g. Iben 2000), those of the intermediate-mass stars expanded by around a factor 5–10 while those of the F/Gstars grew significantly less, leaving the peak of the latter systemsat or below the resolution limit of the SDSS imaging data. This mayhave been further compounded by the bulk of the near-equal-massprogenitor systems, where both components can evolve beyond themain sequence within a Hubble time, populating the lower half ofthe projected separation distribution (De Rosa et al. 2014).
5.2 Applying the non-magentic binary sample to probe theorigins of unusual white dwarfs: the HFMWDs
Around 10 per cent of white dwarfs have a magnetic field withB > 1 mG, the HFMWDs. Those with H-rich atmospheres (the ma-jority) are identified from Zeeman splitting of the pressure broad-ened Balmer lines in their optical spectrum. However, the standardspectral technique applied to determine non-magnetic white dwarfmasses (e.g. Bergeron, Saffer & Liebert 1992) does not work wellfor HFMWDs due to poor understanding of the broadening fromthe interaction of the electric and magnetic fields at the atomicscale. Consequently, mass estimates are available for relatively fewHFMWDs and often have large uncertainties. They reveal these ob-jects to be generally more massive (�M ∼ 40 per cent) than theirnon-magnetic cousins (e.g. Wickramasinghe & Ferrario 2005; Ke-pler et al. 2013). The difficulties in determining the parameters ofHFMWDs, in particular their ages, also mean that assessing theirorigins is problematic.
Short of a detailed statistical analysis of the kinematics of a largesample of hot white dwarfs, age information can only be readilyaccessed for HFMWDs that are members of open clusters or specifictypes of wide binary systems. During the course of this work, wehave unearthed several new hot, wide, magnetic + non-magneticdouble-degenerate systems (Dobbie et al. 2012a, 2013, Dobbie et al.in preparation). For each system, we have compared our estimate ofthe mass of the non-magnetic component to recent determinations ofthe stellar IFMR to infer a progenitor mass. This has been matched toa grid of solar metallicity stellar evolutionary models to determinethe stellar lifetime (Girardi et al. 2000). Subsequently, we havelinearly combined this with the cooling time of the white dwarf toobtain a limit on the total age of the binary and ultimately a lowerlimit on the mass of the companion HFMWD’s progenitor.
However, any selection effects imprinted on our young, wide,double-degenerate sample, as discussed above, could potentiallylead to biased conclusions about the progenitors of HFMWDs, ifthese systems are examined only in isolation. The two main com-peting hypothetical pathways to the formation of HFMWDs shouldsynthesize them on different time-scales since stellar lifetimes arestrongly mass dependent. For example, if they descend primarilyfrom magnetic Ap/Bp stars (Minit � 2 M�; e.g. Angel, Borra &Landstreet 1981), then most will be formed within only a few hun-dred Myr (i.e. lifetimes of early-F, A and B stars) after the birth oftheir host population. Alternatively, if their magnetism is generatedby differential rotation within gas which envelopes primordial closebinaries, either when their primary stars (Minit ≥ 0.8 M�) expandto giant scale and overfill their Roche lobes (Tout et al. 2008; Nord-haus et al. 2011) or during merging of two degenerate remnants(Garcıa-Berro et al. 2012), the majority of HFMWDs, like fieldwhite dwarfs, will be created several Gyr after the birth of theirprogenitor stars (i.e. form mainly from the numerically dominantF and G stars). The mass distribution of any wide degenerate com-panions to HFMWDs, when compared to that of the non-magnetic+ non-magnetic white dwarf systems, could provide insight on thelifetimes of the progenitor stars and thus clues as to which of theseformation pathways is more dominant.
An examination of the component masses in our 19 systems re-veals that in 13 cases both are M < 0.7 M�. In contrast, out of sevenknown hot, wide, magnetic + non-magnetic double-degenerates,only one harbours a non-magnetic white dwarf with M < 0.7 M�(that is the five systems discussed in Dobbie et al. 2013, andtwo more reported in Dobbie et al. in preparation, in which thenon-magnetic DA components have masses of 0.76 ± 0.06 M�,CDDS 22-A, and 0.56 ± 0.04 M�, CDDS 27-A). While the massesof the HFMWDs in these seven binaries may well have been modi-fied through stellar interactions, the masses of the non-magnetic DAcompanions are presumably reflective of the spectral types of theirprogenitor stars. Unless some factor has dictated otherwise (e.g. theevolutionary time-scales for the formation of the HFMWDs), theprogenitor stars of these white dwarfs should have had the samebroad distribution in mass as those of the components of the 19non-magnetic + non-magnetic double-degenerate binaries studiedhere. Adopting this as a null hypothesis, we have drawn thousandsof subsets of seven degenerates randomly from the 19 non-magneticbinary systems. We find that only approximately 10 (100) subsam-ples per 10 000 contain six (five) white dwarfs with M ≥ 0.7 M�.We have also applied a two-sample Kolmogorov–Smirnov test tothe mass distributions of the seven non-magnetic companions andthe more massive white dwarf components in each of our 19 bina-ries. For n1 = 7 and n2 = 19, the critical Dcrit values are 0.54 and0.60 for P = 0.1 and P = 0.05, respectively. From the cumulativedistributions shown in Fig. 7, we determine D = 0.54, which rejectsat marginal significance the null hypothesis. These findings suggestthese two groups of white dwarfs may have different progenitormass distributions.
This disparity in these two mass distributions favours a forma-tion model in which the origins of HFMWDs preferentially involveearly-type stars, although it does not categorically rule out the hy-pothesis that they form as a result of stellar interaction. For example,it is possible they are born from higher order stellar systems. Stud-ies of main-sequence stars reveal a non-negligible proportion ofbinaries are in fact higher order systems, principally triples (∼25per cent; Raghavan et al. 2010). For reasons of dynamical stabil-ity, the majority of these systems are structured hierarchically, suchthat they consist of a relatively close (and potentially interacting)
MNRAS 440, 3184–3201 (2014)

Non-magnetic white dwarf binaries in SDSS DR7 3197
Figure 7. Normalized cumulative mass distribution for our binary whitedwarf sample (black line). The normalized cumulative mass distributionfor the seven DA white dwarfs in magnetic + non-magnetic systems isoverplotted (grey line).
pair with a tertiary companion in a much wider orbit (e.g. Black1982; Tokovinin 1997). Our result would, however, require starsof earlier spectral type to occur more frequently in higher ordermultiple systems. Moreover, as current understanding of the IFMRindicates that stars of earlier spectral-type naturally lead to moremassive white dwarfs, there is less need in this case to invoke merg-ing to account for the larger than average masses of HFMWDs.Admittedly, our findings appear difficult to reconcile with the al-most complete absence of HFMWDs in the more than 2000 close,detached white dwarf + main-sequence binaries known to date (e.g.Rebassa-Mansergas et al. 2012; Parsons et al. 2013), particularlyconsidering the existence of a healthy population of magnetic cat-aclysmic variables. Precision kinematics for large numbers of hot,recently formed, field white dwarfs from Gaia (Jordan 2008) willprovide a crucial complementary view on the origins of HFMWDs.For now, spectroscopic studies of additional young, wide, double-degenerate systems would be useful to strengthen or refute the trenddiscussed above. For example, our initial work could be extendedto include objects from the most recent SDSS coverage and regionsof sky explored by the SkyMapper (Keller et al. 2007) and VSTATLAS (Shanks & Metcalfe 2012) surveys.
6 T H E N O N - M AG E N T I C B I NA RY S A M P L EA N D T H E I F M R
Our current knowledge about the form of the fundamentally im-portant stellar IFMR is derived predominantly from observations ofwhite dwarfs that are members of open clusters. Most open clusterstudies of the IFMR are consistent with a monotonic relation witha mild degree of scatter (e.g. Kalirai et al. 2008; Casewell et al.2009; Williams et al. 2009). Only a modest number of these ob-jects are known to deviate substantially from the general trend (e.g.LB 5893, LB 390 in nearby Praesepe cluster; Reid 1996; Casewellet al. 2009). However, potentially the open cluster data could havefurnished us with a biased perspective on the form of the relation.While these data now span a comparatively broad range of ini-tial mass (Minit ≈ 1.5–6 M�), they are still heavily concentrated
between Minit = 2.8–5 M�. Moreover, faint candidate white dwarfmembers of these populations are generally identified from theirlocation towards the blue side of colour–magnitude diagrams. Dueto the premium on 8 m class telescope time any photometrically out-lying cluster white dwarfs e.g. cooler, redder objects located closerto the field star population, are arguably less likely to be targetedfor follow-up spectroscopic observations. Studies of white dwarfsin wide binary systems with subgiant and main-sequence stars sug-gest that there may be more scatter in the IFMR than indicated bythe cluster work (Catalan et al. 2008; Zhao et al. 2012; Liebert et al.2013).
Although our investigation of wide double-degenerate systemscannot provide data points with the absolute age calibration neces-sary for investigating the IFMR in the style of studies of open clus-ter white dwarfs or white dwarf + subgiant binaries, they can stillserve as a useful test of its relative form. Hence, we have derived thecooling time for each of our binary white dwarfs, including the DB,with the mixed CO core composition ‘thick H-layer’evolutionarycalculations of the Montreal Group (Fontaine, Brassard & Bergeron2001, the cooling time of the DB is largely insensitive to our choiceof H-layer mass). The errors on our estimates are derived by propa-gating the uncertainties in effective temperature and surface gravity.We have applied three relatively recent, linear model estimates ofthe IFMR and grids of solar metallicity stellar evolutionary models(Girardi et al. 2000) to infer both the masses and the stellar lifetimesof the white dwarfs’ progenitor stars. These IFMRs have been de-rived by different research teams (Dobbie et al. 2006a; Kalirai et al.2008; Williams et al. 2009) and do not include white dwarfs withTeff < 12 500 K, the masses of which can be systematically over-estimated (e.g. see Kepler et al. 2007). Next, we have combinedthese lifetimes with the degenerate cooling times to obtain two in-dependent determinations of the total age of each system for eachassumed IFMR. Finally, we have calculated the differences betweenthese pairs of age estimates. For negligible measurement errors anda perfect model of a monotonic IFMR with no intrinsic scatter, theseshould be zero. The uncertainties associated with these values havebeen determined following a Monte Carlo approach.
Examination of the age discrepancies in Table 5 reveals that im-portantly, none of the 19 systems is strongly discordant with ourcurrent understanding of the form of the IFMR. The deviations fromzero or no age difference are within 1σ for 11 out of the 19 systemsand less than about 2.1σ for the remaining binaries, suggesting thatthe dominant contributors to the non-zero values are the uncertain-ties on our parameter estimates. Unfortunately, these are generallylarge, especially at lower initial masses. This is where the inferredmain-sequence lifetime is, in an absolute sense, a strong functionof mass, curbing the usefulness of these systems for this work. Forinitial masses Minit � 2.5 M�, the uncertainties are typically only afew 100 Myr and the parameters of the bulk of systems here can becomfortably reconciled with any of the three model IFMRs. This isperhaps not surprising as the data around which these models areconstructed is drawn primarily from Minit � 2.5 M�. Third dredge-up is also anticipated to be rather efficient in this mass regime atpreventing further growth of the degenerate core during thermallypulsing asymptotic giant branch evolution (e.g. see discussion inWeidemann 2000). Any factor that can substantially interfere withthe mass-loss process at this time, when the radius of a star reachesits maximum (e.g. the presence of a close companion) is likely tohave a relatively minor impact on the final remnant mass. In compar-ison, at lower initial mass, third dredge-up is anticipated to be lessefficient, potentially allowing the core to grow significantly duringthis phase. Differences in third dredge-up efficiency, as a function on
MNRAS 440, 3184–3201 (2014)

3198 R. B. Baxter et al.
Table 5. Progenitor masses for the white dwarfs, determined from three recent estimates of the form of the IFMR, 1. Dobbie et al.(2006a), 2. Kalirai et al. (2008) and 3. Williams et al. (2009). Stellar lifetimes have been derived from the solar metallicity evolutionarymodels of Girardi et al. (2000). We have calculated the difference between the system age derived from component A and the systemage derived from component B. This should be zero for negligible measurement errors and a perfect representation of a monotonicIFMR with no intrinsic scatter. Where an uncertainty is listed as HT, the calculated error bound extends to or lies beyond a Hubble time.When both bounds are larger than a Hubble time, we flag the estimate as providing no meaningful constraint (NMC). The projectedseparation of the components of each system are also shown (rounded to 25 au).
Component IFMR 1 IFMR 2 IFMR 3 SeparationMinit/M� �System age/Myr Minit/M� �System age/Myr Minit/M� �System age/Myr /au
CDDS3-A 2.25+0.59−0.52 −901+689
−2446 1.78+0.46−0.41 −2733+3095
−HT 1.93+0.34−0.31 −1419+1369
−5973 1725
CDDS3-B 1.89+0.67−0.60 1.34+0.63
−0.59 1.56+0.50−0.47
CDDS6-A 2.87+0.63−0.55 −155+236
−276 2.54+0.48−0.46 −216+463
−546 2.57+0.35−0.34 −188+368
−412 400
CDDS6-B 2.74+0.63−0.54 2.39+0.48
−0.45 2.44+0.36−0.34
CDDS8-A 2.62+0.61−0.52 −630+291
−515 2.23+0.45−0.42 −736+711
−1330 2.31+0.33−0.30 −682+513
−755 3225
CDDS8-B 2.53+0.71−0.62 2.13+0.63
−0.60 2.22+0.50−0.48
CDDS9-A 1.33+0.79−0.73 3380+HT
−3157 <1.49 NMC 0.99+0.68−0.65 11605+HT
−12393 5875
CDDS9-B 2.29+0.70−0.62 1.83+0.64
−0.60 1.97+0.51−0.48
CDDS14-A 2.35+0.69−0.61 −618+769
−1478 1.91+0.62−0.58 −1250+2485
−11131 2.04+0.49−0.47 −671+1143
−3637 1075
CDDS14-B 2.06+0.70−0.64 1.55+0.66
−0.63 1.74+0.53−0.51
CDDS15-A 1.67+0.64−0.59 245+3872
−2081 1.08+0.59−0.58 NMC 1.34+0.47
−0.47 180+HT−5726 725
CDDS15-B 1.66+0.53−0.48 1.06+0.42
−0.39 1.33+0.31−0.30
CDDS16-A <2.86 NMC <2.45 NMC <2.52 NMC 1850
CDDS16-B 1.60+0.85−0.72 0.99+0.92
−0.78 1.26+0.75−0.65
CDDS17-A 3.19+0.92−0.85 −273+508
−809 2.93+1.02−0.99 −834+1043
−3731 2.90+0.73−0.74 −639+830
−1377 900
CDDS17-B 2.30+0.71−0.64 1.85+0.67
−0.65 1.99+0.53−0.52
CDDS18-A 3.60+0.70−0.60 46+172
−98 3.42+0.52−0.49 96+167
−100 3.32+0.37−0.36 114+128
−87 525
CDDS18-B 7.00+1.01−0.84 7.58+0.61
−0.58 6.83+0.31−0.33
CDDS26-A 6.65+0.98−0.81 −1535+914
−5286 7.15+0.62−0.57 −6256+4920
−HT 6.47+0.34−0.34 −3163+1842
−HT 725
CDDS26-B 1.76+0.66−0.61 1.18+0.62
−0.60 1.42+0.49−0.47
CDDS29-A 4.34+0.78−0.66 −72+107
−204 4.33+0.57−0.53 −176+142
−250 4.08+0.40−0.38 −164+120
−180 825
CDDS29-B 3.22+0.68−0.58 2.96+0.53
−0.48 2.93+0.37−0.36
CDDS30-A 1.61+0.66−0.60 946+6381
−1472 1.01+0.61−0.59 NMC 1.28+0.48
−0.47 5495+HT−3009 425
CDDS30-B 1.97+0.67−0.61 1.44+0.62
−0.59 1.64+0.49−0.47
CDDS31-A 4.52+0.78−0.68 192+101
−179 4.55+0.57−0.54 116+129
−213 4.27+0.39−0.39 118+116
−165 150
CDDS31-B 3.37+0.68−0.59 3.15+0.53
−0.48 3.09+0.38−0.36
CDDS36-A 2.24+0.59−0.51 −313+574
−663 1.77+0.46−0.42 −775+1756
−3328 1.93+0.34−0.31 −331+820
−1343 4025
CDDS36-B 2.08+0.58−0.50 1.57+0.45
−0.41 1.76+0.33−0.31
CDDS40-A 2.33+0.68−0.62 138+724
−393 1.88+0.61−0.60 592+2770
−869 2.02+0.49−0.48 437+1123
−695 2100
CDDS40-B 2.92+0.72−0.65 2.60+0.64
−0.61 2.62+0.49−0.49
CDDS48-A 3.05+0.73−0.66 36+293
−397 2.75+0.64−0.62 −294+640
−633 2.75+0.49−0.50 −135+470
−467 475
CDDS48-B 2.54+0.61−0.53 2.13+0.48
−0.44 2.23+0.35−0.34
CDDS49-A 2.78+0.64−0.55 401+337
−194 2.43+0.50−0.46 623+554
−325 2.48+0.36−0.35 550+381
−255 525
CDDS49-B 3.58+0.70−0.61 3.41+0.53
−0.50 3.31+0.38−0.38
CDDS50-A 2.57+0.62−0.54 −347+360
−663 2.17+0.49−0.45 −551+876
−2327 2.26+0.36−0.34 −509+687
−1017 375
CDDS50-B 2.37+0.70−0.62 1.93+0.63
−0.59 2.06+0.50−0.48
CDDS51-A 1.86+0.55−0.48 618+1561
−594 1.31+0.43−0.41 2800+HT
−2540 1.54+0.32−0.31 1265+2768
−1119 2200
CDDS51-B 2.37+0.60−0.51 1.93+0.47
−0.43 2.06+0.35−0.33
MNRAS 440, 3184–3201 (2014)

Non-magnetic white dwarf binaries in SDSS DR7 3199
main-sequence mass, might explain some of the additional scatterreported in previous wide binary studies of the IFMR. These tend tosample lower initial masses. However, some of the extra dispersionin the results of these studies undoubtedly stems from the neglectof the spectroscopic overestimate of mass at Teff < 12 000 K.
7 A D D I T I O NA L N OT E S O N S O M E S P E C I F I CSYSTEMS
7.1 CDDS15
All new white dwarfs presented here have hydrogen dominatedatmospheres, except CDDS15-A which is a DB. Following L151-81A/B (Oswalt, Hintzen & Luyten 1988), CDDS15 is only thesecond wide DA + DB system identified to date. However, a num-ber of unresolved, presumably close, DA + DB systems are alsoknown or suspected, including MCT 0128-3846, MCT 0453-2933(Wesemael et al. 1994), PG 1115+166 (Bergeron & Leggett 2002;Maxted et al. 2002) and KUV 02196+2816 (Limoges, Bergeron &Dufour 2009). The latter two systems have total system masses closeto the Chandrasekar limit (1.4 M�) but although PG 1115+166 isalso known to be a post-common-envelope binary its componentsare too widely separated (a ∼ 0.2 au) for it to merge within a Hub-ble time. CDDS15-A and CDDS15-B are both located on the lowerside of the peak in the field white dwarf mass distribution and haverelatively large tangential velocities (vtan ≈ 90 km s−1). D’Antona& Mazzitelli (1991) have suggested that DBs preferentially formfor lower mass progenitors (Minit < 2 M�) where the very highmass-loss rates experienced at the peak of the last thermal pulsecycle can remove the entire hydrogen surface envelope in a veryshort time. However, at least one helium-rich white dwarf is knownwhich must, because of its membership of the 625 Myr Hyades clus-ter, have descended from a star with Minit > 2 M�. L151-81A alsoappears likely to be the progeny of a moderately early-type star sincefrom its higher than average mass (M = 0.71 M�) hydrogen-richdegenerate companion, L151-81B (Teff = 10 460 K, log g = 8.43;Gianninas, Bergeron & Ruiz 2011), we infer an upper limit of τ �2 Gyr on the age of this system. This corresponds to the lifetimeof a Minit � 1.7 M� star. Interestingly, spectroscopic surveys oflarge samples of field white dwarfs have also found the mean massof the DBs to be significantly larger than that of the DA popula-tion (e.g. MDB = 0.67 M� and MDA = 0.63 M�; Bergeron et al.2011; Gianninas et al. 2011). In a spectroscopic analysis of 140DBs (Teff > 16 000 K) drawn from the SDSS DR7, Kleinman et al.(2013) found only one with M < 0.55 M�. Similarly, in a studyof 108 relatively bright DBs, Bergeron et al. (2011) also foundonly one with a mass this low. It seems that CDDS15-A is perhapsslightly unusual for its rather low mass. The construction and theinvestigation of the properties (e.g. separation and companion massdistributions) of a sample of wide DA + DB binaries would likelyprovide additional insight on the evolutionary pathway that leads tothe formation of hydrogen-deficient degenerates.
7.2 CDDS30
The components of CDDS30 are separated by approximately2.8 arcsec, which translates to around 400 au at the distance we cal-culate for this system. It is unlikely that these two objects have everexchanged mass via Roche lobe overflow, so their masses, whichare consistent with the lower side of the peak in the field whitedwarf mass distribution, suggest that they are the progeny of main-sequence stars that had comparatively modest masses (M < 2 M�).
We note that this pairing is only 16 arcsec (2400 au at 150 pc) froma relatively bright (B = 13.17, V = 12.12, J = 10.37 ± 0.02,H = 9.94 ± 0.03, Ks = 9.82 ± 0.02), late-type star, TYC 2535-524-1, which the Tycho-2 catalogue (Høg et al. 2000) revealshas a similar proper motion (μαcos δ = −44.3 ± 3.5 mas yr−1,μδ = 30.6 ± 3.5 mas yr−1). Motivated by this, we have performeda crude estimate of the distance to this star. The optical coloursdrawn from the American Association of Variable Star ObserversPhotometric All Sky Survey (http://www.aavso.org/apass) appearto be consistent with a spectral type of K3–K4 (e.g. HD 219134,TW Piscis Austri). The near-IR colours from 2MASS are indica-tive of spectral types K2–K3 (e.g. ε-Eridani, HD 219134). We areled to conclude that TYC 2535-524-1 is approximately K2–4V,which according to a recently published relation between absoluteH-band magnitude and spectral type (Kirkpatrick et al. 2012), cor-responds to MH ≈ 4.0-4.6 mag. From the observed H magnitude ofH = 9.94 ± 0.03, we derive a distance modulus of 5.3–5.9, which isin accord with that we infer for CDDS30-A and CDDS30-B. Con-sidering the similarities between these distance estimates and thestatistically significant proper motion measurements, we are led toconclude that there is a reasonable likelihood that these two whitedwarfs and TYC 2535-524-1 form a triple stellar system. The massof the main-sequence star sets a lower limit on the mass of the whitedwarfs’ progenitors of M > 0.6 M�. However, a detailed spectro-scopic study of the early-K dwarf, including activity indicators,may provide limits on the total age of this system (e.g. Mamajek &Hillenbrand 2008) that can lead to better constraints on the progen-itor masses.
7.3 CDDS 8-A and other possible ZZ Ceti stars
At least one system in our survey harbours a white dwarf that hasbeen confirmed previously as a pulsating ZZ Ceti star. CDDS 8-A(SDSS J033236.61−004918.4) was first reported as a DA in the cat-alogue of spectroscopically identified white dwarfs compiled fromthe first release of the SDSS data (Kleinman et al. 2004). It was sub-sequently shown to be lying within the instability strip and pulsatingwith an amplitude of 15.1 mma on a period of 767.5 s (Mukadamet al. 2004). As referred to in Section 4.1, we find a discrepancy ofseveral hundred K between the effective temperature we measurefor this object and that reported by Kleinman et al. (2013). It isknown that systematic uncertainties of this magnitude in spectro-scopic estimates of the atmospheric parameters of ZZ Ceti whitedwarfs can arise if the data are not averaged over several pulsationcycles (e.g. see Gianninas et al. 2011). Our VLT observations ofthis object spanned only 1200 s, corresponding to less than two cy-cles of the presumably most prominent pulsation mode reported byMukadam et al. (2004). The two distinct SDSS spectra of this staralso hint at variability in the shape and location of the Hα line core.This effect is likely due to velocity fields within the photospherethat result from the pulsational motion (Koester & Kompa 2007).
Considering CDDS 8-A lies on the red edge of the instability stripand has an extremely bright, hot, white dwarf companion, SDSSJ033236.86−004936.9 (Noguchi, Maehara & Kondo 1980; Wegner,McMahan & Boley 1987; McCook & Sion 1999), from whichthe distance to and kinematics of this system can be stringentlyconstrained, it represents a particularly interesting system for furtherstudy. Aficionados of pulsating white dwarfs may be interested ina further 10 components within our spectroscopic subsample thatwe have flagged here on the basis of their effective temperatures aseither possible (CDDS 3-A, CDDS 15-B, CDDS 16-A, CDDS 17-B,CDDS 34-B, CDDS 40-A), probable (CDDS 29-A, CDDS 48-A,
MNRAS 440, 3184–3201 (2014)

3200 R. B. Baxter et al.
CDDS 50-A) or highly probable (CDDS 14-A) ZZ Ceti stars. Asignificant proportion of these objects are brighter than g = 18 socould be studied in more detail on telescopes of relatively modestaperture.
8 SU M M A RY
We have presented spectroscopy for the components of 18 candidateyoung, wide, double-degenerates photometrically identified withinthe footprint of the SDSS DR7. On the basis of our distance es-timates and our astrometry, we have concluded that 16 candidatesprobably form physical systems. One of these is a wide DA + DBbinary, only the second such system identified to date. We have de-termined the effective temperatures, surface gravities, masses andcooling times of the components of our 16 binaries. We have com-bined the sample with three similar systems previously known fromthe literature to lie within the DR7 footprint to construct a massdistribution for 38 white dwarfs in young, wide double-degeneratebinaries. A comparison between this and the mass distribution of theisolated field white dwarf population reveals them to have broadlysimilar forms, each with a substantial peak around M ∼ 0.6 M�.However, there is a slight excess of the most massive white dwarfsin the binary sample which could be related to the primordial sep-aration distribution of the progenitor systems and the expansion ofbinary orbits during the late stages of stellar evolution. We haveshown how our sample can be exploited to probe the origins ofunusual white dwarfs and found at marginal significance that theprogenitor systems HFMWDs are preferentially associated withearly-type stars, at least within these pairings. Finally, we have usedthe 19 young, wide double-degenerate systems to test the stellarIFMR. Within the relatively large uncertainties, no system appearsto be strongly discordant with our current understanding of therelation.
AC K N OW L E D G E M E N T S
This work is based in part on observations made with the GranTelescopio Canarias (GTC), operated on the island of La Palmain the Spanish Observatorio del Roque de los Muchachos of theInstituto de Astrofisica de Canarias. The INT and the WHT areoperated by the Isaac Newton Group in the Spanish Observatoriodel Roque de los Muchachos of the Instituto de Astrofisica de Ca-narias. Based in part on observations made with ESO Telescopes atthe La Silla Paranal Observatory under programme numbers 084.D-1097 and 090.D-0140. Based in part on observations obtained aspart of the VISTA Hemisphere Survey, ESO Program, 179.A-2010(PI: McMahon). This research was made possible through the useof the AAVSO Photometric All-Sky Survey (APASS), funded bythe Robert Martin Ayers Sciences Fund. This research has madeuse of the SIMBAD data base, operated at the Centre de DonneesAstronomiques de Strasbourg (CDS), and of NASA’s AstrophysicsData System Bibliographic Services (ADS). Funding for the SDSSand SDSS-II was provided by the Alfred P. Sloan Foundation, withParticipating Institutions, the National Science Foundation, the USDepartment of Energy, the National Aeronautics and Space Admin-istration, the Japanese Monbukagakusho, the Max Planck Society,and the Higher Education Funding Council for England. The SDSSwebsite is http://www.sdss.org/. SDSS is managed by the Astro-physical Research Consortium for the Participating Institutions.NL acknowledges support from the national programme numberAYA2010-19136 funded by the Spanish Ministry of Science and
Innovation. NL is a Ramon y Cajal fellow at the IAC (number 08-303-01-02). Balmer/Lyman lines in the DA models were calculatedwith the modified Stark broadening profiles of Tremblay & Berg-eron (2009), kindly made available by the authors. We thank thereferee for a constructive report which has improved this paper.
R E F E R E N C E S
Abazajian K. N. et al., 2009, ApJS, 182, 543Abt H. A., Levy S. G., 1976, ApJS, 30, 273Andrews J. J., Agueros M. A., Belczynski K., Dhital S., Kleinman S. J.,
West A. A., 2012, ApJ, 757, 170Angel J. R. P., Borra E. F., Landstreet J. D., 1981, ApJS, 45, 457Barbaro G., Pigatto L., 1984, A&A, 136, 355Barstow M. A., Jordan S., O’Donoghue D., Burleigh M. R., Napiwotzki R.,
Harrop-Allin M. K., 1995, MNRAS, 277, 971Baxter R., 2011, PhD thesis, Macquarie Univ.Bergeron P., Leggett S. K., 2002, ApJ, 580, 1070Bergeron P., Saffer R. A., Liebert J., 1992, ApJ, 394, 228Bergeron P., Wesemael F., Beauchamp A., 1995, PASP, 107, 1047Bergeron P. et al., 2011, ApJ, 737, 28Bertelli G., Nasi E., Girardi L., Marigo P., 2009, A&A, 508, 355Bertin E., Arnouts S., 1996, A&AS, 117, 393Black D. C., 1982, AJ, 87, 1333Burleigh M. R., Jordan S., Schweizer W., 1999, ApJ, 510, L37Casali M. et al., 2007, A&A, 467, 777Casewell S. L., Dobbie P. D., Napiwotzki R., Burleigh M. R., Barstow M.
A., Jameson R. F., 2009, MNRAS, 395, 1795Casewell S. L. et al., 2012, ApJ, 759, L34Catalan S., Isern J., Garcıa-Berro E., Ribas I., Allende Prieto C., Bonanos
A. Z., 2008, A&A, 477, 213Clausen J. V., Torres G., Bruntt H., Andersen J., Nordstrom B., Stefanik R.
P., Latham D. W., Southworth J., 2008, A&A, 487, 1095D’Antona F., Mazzitelli I., 1991, in Michaud G., Tutukov A. V., eds, Proc.
IAU Symp. Vol. 145, Evolution of Stars: the Photospheric AbundanceConnection. Kluwer, Dordrecht, p. 399
De Gennaro S., von Hippel T., Winget D. E., Kepler S. O., Nitta A., KoesterD., Althaus L., 2008, AJ, 135, 1
De Rosa R. J. et al., 2014, MNRAS, 437, 1216Delfosse X. et al., 2004, in Hilditch R. W., Hensberge H., Pavlovski K., eds,
ASP Conf. Ser. Vol. 318, Spectroscopically and Spatially Resolving theComponents of the Close Binary Stars. Astron. Soc. Pac., San Francisco,p. 166
Dobbie P. D., Kenyon F., Jameson R. F., Hodgkin S. T., Hambly N. C.,Hawkins M. R. S., 2002, MNRAS, 329, 543
Dobbie P. D. et al., 2006a, MNRAS, 369, 383Dobbie P. D., Napiwotzki R., Lodieu N., Burleigh M. R., Barstow M. A.,
Jameson R. F., 2006b, MNRAS, 373, L45Dobbie P. D., Napiwotzki R., Burleigh M. R., Williams K. A., Sharp R.,
Barstow M. A., Casewell S. L., Hubeny I., 2009, MNRAS, 395, 2248Dobbie P. D., Baxter R., Kulebi B., Parker Q. A., Koester D., Jordan S.,
Lodieu N., Euchner F., 2012a, MNRAS, 421, 202Dobbie P. D., Day-Jones A., Williams K. A., Casewell S. L., Burleigh M.
R., Lodieu N., Parker Q. A., Baxter R., 2012b, MNRAS, 423, 2815Dobbie P. D. et al., 2013, MNRAS, 428, L16Duquennoy A., Mayor M., 1991, A&A, 248, 485Eldridge J. J., Tout C. A., 2004, Mem. Soc. Astron. Ital., 75, 694Ferrario L., Vennes S., Wickramasinghe D. T., Bailey J. A., Christian D. J.,
1997, MNRAS, 292, 205Ferrario L., Wickramasinghe D., Liebert J., Williams K. A., 2005, MNRAS,
361, 1131Finley D. S., Koester D., 1997, ApJ, 489, L79Fischer D. A., Marcy G. W., 1992, ApJ, 396, 178Fontaine G., Brassard P., Bergeron P., 2001, PASP, 113, 409Garcıa-Berro E. et al., 2012, ApJ, 749, 25Gianninas A., Bergeron P., Ruiz M. T., 2011, ApJ, 743, 138
MNRAS 440, 3184–3201 (2014)

Non-magnetic white dwarf binaries in SDSS DR7 3201
Gil-Pons P., Garcıa-Berro E., Jose J., Hernanz M., Truran J. W., 2003, A&A,407, 1021
Girardi L., Bressan A., Bertelli G., Chiosi C., 2000, A&AS, 141, 371Girven J., Gansicke B. T., Kulebi B., Steeghs D., Jordan S., Marsh T. R.,
Koester D., 2010, MNRAS, 404, 159Hambly N. C., Davenhall A. C., Irwin M. J., MacGillivray H. T., 2001,
MNRAS, 326, 1315Hambly N. C. et al., 2008, MNRAS, 384, 637Harris H. C. et al., 2003, AJ, 126, 1023Hewett P. C., Warren S. J., Leggett S. K., Hodgkin S. T., 2006, MNRAS,
367, 454Hodgkin S. T., Irwin M. J., Hewett P. C., Warren S. J., 2009, MNRAS, 394,
675Høg E. et al., 2000, A&A, 355, L27Holberg J. B., Bergeron P., 2006, AJ, 132, 1221Holberg J. B., Sion E. M., Oswalt T., McCook G. P., Foran S., Subasavage
J. P., 2008, AJ, 135, 1225Holberg J. B., Oswalt T. D., Sion E. M., Barstow M. A., Burleigh M. R.,
2013, MNRAS, 435, 2077Huang S. S., Struve O., 1956, AJ, 61, 300Iben I., Jr, 2000, in Kastner J. H., Soker N., Rappaport S., eds, ASP Conf.
Ser. Vol. 199, Asymmetrical Planetary Nebulae II: From Origins toMicrostructures. Astron. Soc. Pac., San Francisco, p. 107
Jeffreys H., 1961, Theory of Probability, 3rd edn. Oxford Univ. Press, OxfordJordan S., 2008, Astron. Nachr., 329, 875Jordan S. et al., 1998, A&A, 330, 277Kalirai J. S., Richer H. B., 2010, Phil. Trans. R. Soc. A, 368, 755Kalirai J. S., Hansen B. M. S., Kelson D. D., Reitzel D. B., Rich R. M.,
Richer H. B., 2008, ApJ, 676, 594Kass R. E., Raftery A. E., 1995, J. Am. Stat. Assoc., 90, 773Keller S. C. et al., 2007, Proc. Astron. Soc. Aust., 24, 1Kepler S. O., Kleinman S. J., Nitta A., Koester D., Castanheira B. G.,
Giovannini O., Costa A. F. M., Althaus L., 2007, MNRAS, 375,1315
Kepler S. O. et al., 2013, MNRAS, 429, 2934Kirkpatrick J. D. et al., 2012, ApJ, 753, 156Kleinman S. J. et al., 2004, ApJ, 607, 426Kleinman S. J. et al., 2013, ApJS, 204, 5Koester D., 2010, Mem. Soc. Astron. Ital., 81, 921Koester D., Kompa E., 2007, A&A, 473, 239Koester D., Voss B., Napiwotzki R., Christlieb N., Homeier D., Lisker T.,
Reimers D., Heber U., 2009, A&A, 505, 441Kouwenhoven M. B. N., Brown A. G. A., Zinnecker H., Kaper L., Portegies
Zwart S. F., 2005, A&A, 430, 137Kouwenhoven M. B. N., Brown A. G. A., Portegies Zwart S. F., Kaper L.,
2007, A&A, 474, 77Kowalski P. M., Saumon D., 2006, ApJ, 651, L137Kraus A. L., Hillenbrand L. A., 2007, AJ, 134, 2340Kulebi B., Jordan S., Nelan E., Bastian U., Altmann M., 2010, A&A, 524,
A36Lada C. J., 2006, ApJ, 640, L63Lampton M., Margon B., Bowyer S., 1976, ApJ, 208, 177Lawrence A. et al., 2007, MNRAS, 379, 1599Liebert J., Bergeron P., Holberg J. B., 2005, ApJS, 156, 47Liebert J., Fontaine G., Young P. A., Williams K. A., Arnett D., 2013, ApJ,
769, 7Limoges M.-M., Bergeron P., Dufour P., 2009, ApJ, 696, 1461McCook G. P., Sion E. M., 1999, ApJS, 121, 1McMahon R., 2012, in Science from the Next Generation Imaging and
Spectroscopic Surveys: The VISTA Hemisphere Survey (VHS) Sci-ence Goals and Status, available at: http://www.eso.org/sci/meetings/2012/surveys2012/program.html
Mamajek E. E., Hillenbrand L. A., 2008, ApJ, 687, 1264Marsh T. R., Dhillon V. S., Duck S. R., 1995, MNRAS, 275, 828Mason B. D., Gies D. R., Hartkopf W. I., Bagnuolo W. G., Jr, ten Brummelaar
T., McAlister H. A., 1998, AJ, 115, 821Maxted P. F. L., Burleigh M. R., Marsh T. R., Bannister N. P., 2002, MNRAS,
334, 833
Maxted P. F. L., Marsh T. R., Morales-Rueda L., Barstow M. A., Dobbie P.D., Schreiber M. R., Dhillon V. S., Brinkworth C. S., 2004, MNRAS,355, 1143
Miszalski B., Acker A., Moffat A. F. J., Parker Q. A., Udalski A., 2009,A&A, 496, 813
Monet D. G. et al., 2003, AJ, 125, 984Mukadam A. S. et al., 2004, ApJ, 607, 982Napiwotzki R., Green P. J., Saffer R. A., 1999, ApJ, 517, 399Noguchi T., Maehara H., Kondo M., 1980, Ann. Tokyo Astron. Obs., 18, 55Nordhaus J., Wellons S., Spiegel D. S., Metzger B. D., Blackman E. G.,
2011, Proc. Natl. Acad. Sci., 108, 3135Nordstroem B., Andersen J., Andersen M. I., 1996, A&AS, 118, 407Oswalt T. D., Hintzen P. M., Luyten W. J., 1988, ApJS, 66, 391Oswalt T. D., Smith J. A., Wood M. A., Hintzen P., 1996, Nature, 382, 692Parker R. J., Reggiani M. M., 2013, MNRAS, 432, 2378Parsons S. G., Marsh T. R., Gansicke B. T., Schreiber M. R., Bours M. C.
P., Dhillon V. S., Littlefair S. P., 2013, MNRAS, 436, 241Patience J., Ghez A. M., Reid I. N., Matthews K., 2002, AJ, 123, 1570Pinfield D. J., Dobbie P. D., Jameson R. F., Steele I. A., Jones H. R. A.,
Katsiyannis A. C., 2003, MNRAS, 342, 1241Raghavan D. et al., 2010, ApJS, 190, 1Rebassa-Mansergas A., Nebot Gomez-Moran A., Schreiber M. R., Gansicke
B. T., Schwope A., Gallardo J., Koester D., 2012, MNRAS, 419, 806Reid I. N., 1996, AJ, 111, 2000Reid I. N., Gizis J. E., 1997, AJ, 113, 2246Roeser S., Demleitner M., Schilbach E., 2010, AJ, 139, 2440Sana H., Gosset E., Naze Y., Rauw G., Linder N., 2008, MNRAS, 386, 447Schlegel D. J., Finkbeiner D. P., Davis M., 1998, ApJ, 500, 525Schneider D. P. et al., 2010, AJ, 139, 2360Shafer R. A., 1991, XSPEC, An X-ray Spectral Fitting Package, User’s
Guide, Version 2, ESA TM-09. ESA, NoordwijkShanks T., Metcalfe N., 2012, in Science from the Next Generation
Imaging and Spectroscopic Surveys: VST ATLAS: Science Goals andStatus, available at: http://www.eso.org/sci/meetings/2012/surveys2012/program.html
Siess L., 2007, A&A, 476, 893Struve F. G. W., 1852, Stellarum fixarum imprimis duplicium et multipli-
cium positiones mediae pro epocha 1830, 0. Typ. Academica, Petropoli,CCLIII, 380 pp.; in folio; DCCC.fe.7
Tokovinin A. A., 1997, A&AS, 124, 75Tout C. A., Wickramasinghe D. T., Liebert J., Ferrario L., Pringle J. E.,
2008, MNRAS, 387, 897Tremblay P., Bergeron P., 2009, ApJ, 696, 1755Tremblay P., Bergeron P., Gianninas A., 2011, ApJ, 730, 128van Dokkum P. G., 2001, PASP, 113, 1420Vennes S., Thejll P. A., Galvan R. G., Dupuis J., 1997, ApJ, 480, 714Vennes S., Smith R. J., Boyle B. J., Croom S. M., Kawka A., Shanks T.,
Miller L., Loaring N., 2002, MNRAS, 335, 673Wegg C., Phinney E. S., 2012, MNRAS, 426, 427Wegner G., McMahan R. K., Boley F. I., 1987, AJ, 94, 1271Weidemann V., 2000, A&A, 363, 647Wesemael F. et al., 1994, ApJ, 429, 369Wickramasinghe D. T., Ferrario L., 2005, MNRAS, 356, 1576Williams K. A., Bolte M., Koester D., 2009, ApJ, 693, 355Yoon S.-C., Podsiadlowski P., Rosswog S., 2007, MNRAS, 380, 933York D. G. et al., 2000, AJ, 120, 1579Yuan J. W., 1992, A&A, 261, 105Zacharias N., Finch C. T., Girard T. M., Henden A., Bartlett J. L., Monet D.
G., Zacharias M. I., 2013, AJ, 145, 44Zhao J. K., Oswalt T. D., Willson L. A., Wang Q., Zhao G., 2012, ApJ, 746,
144Zheng Z., 1998, in Nedellec C., Rouveirol C., eds, Proc10th European Con-
ference on Machine Learning, Naive Bayesian Classifier Committees.Springer, Chemnitz, p. 196
Zinnecker H., 1984, Ap&SS, 99, 41
This paper has been typeset from a TEX/LATEX file prepared by the author.
MNRAS 440, 3184–3201 (2014)