components of effective teacher induction programs and the
TRANSCRIPT

University of Arkansas, FayettevilleScholarWorks@UARK
Theses and Dissertations
5-2012
Components of Effective Teacher InductionPrograms and the Impact of Experienced MentorsCraig P. McBrideUniversity of Arkansas, Fayetteville
Follow this and additional works at: http://scholarworks.uark.edu/etd
Part of the Educational Leadership Commons, and the Teacher Education and ProfessionalDevelopment Commons
This Dissertation is brought to you for free and open access by ScholarWorks@UARK. It has been accepted for inclusion in Theses and Dissertations byan authorized administrator of ScholarWorks@UARK. For more information, please contact [email protected], [email protected].
Recommended CitationMcBride, Craig P., "Components of Effective Teacher Induction Programs and the Impact of Experienced Mentors" (2012). Theses andDissertations. 278.http://scholarworks.uark.edu/etd/278

COMPONENTS OF EFFECTIVE TEACHER INDUCTION PROGRAMS AND THE IMPACT
OF EXPERIENCED MENTORS

COMPONENTS OF EFFECTIVE TEACHER INDUCTION PROGRAMS AND THE IMPACT
OF EXPERIENCED MENTORS
A dissertation submitted in partial fulfillment
of the requirements for the degree of
Doctor of Philosophy in Curriculum and Instruction
By
Craig McBride
University of Colorado, Boulder
Bachelor of Arts in Mathematics, 1995
University of Colorado, Boulder
Master of Arts in Mathematics, 2002
May 2012
University of Arkansas

Abstract
Based on data from the 2007-08 Schools and Staffing Survey (SASS), 2008-09 Teacher
Follow-up Survey (TFS) and 2009-10 Beginning Teacher Longitudinal Study (BTLS) datasets,
this study examined a prediction model for new teacher retention that combined variables from
both the presence of induction program components and mentoring traits. New teacher retention
was selected as an important criterion because attrition causes a large financial burden on already
budget-limited districts, and teacher turnover impacts teacher effectiveness and student learning.
Results of a logistic regression analysis indicated that the presence of an induction program
(W1T0220), the presence of a mentor (W2MNTYN), the use of seminars or classes for
beginning teachers (W1T0223), and regular supportive communication with a principal or other
administrator (W1T0225) during the first year of teaching were significant predictors for teacher
retention in a sample of N = 1992 new teachers. Two-way frequencies revealed that new teachers
who did not participate in an induction program left teaching in years two and three at nearly
twice the rate of those who had induction. Similarly, teachers who had seminars or classes for
beginning teachers and regular supportive communication with their principals, department
chairs, or other administrators left teaching in years two and three at half the rate of those new
teachers who did not have either of those induction components. Additionally, teachers who
worked with a mentor during their first year of teaching left teaching in years two and three at
half the rate of those teachers who did not have a mentor. Generalized induction programs
utilizing each of the significant predictors are presented with the expectation that their use could
decrease teacher attrition and result in greater overall teacher effectiveness and student learning.
This dissertation is approved for
Recommendation to the
Graduate Council
Dissertation Director:
____________________________________
Dr. Laura Kent
Dissertation Committee:
____________________________________
Dr. Thomas Smith
____________________________________
Dr. Ronna Turner
____________________________________
Dr. Michael Wavering

DISSERTATION DUPLICATION RELEASE
I hereby authorize the University of Arkansas Libraries to duplicate this dissertation when needed for
research and/or scholarship.
Agreed ____________________________________________
Craig McBride
Refused ____________________________________________
Craig McBride

Acknowledgements
I never would have done this without the love and support of the best wife in the world,
Susan McDevitt. You always knew when to use the carrot and when to use the stick, and I love
you so much for everything you do. Thank you to my dissertation committee: Dr. Laura Kent,
Dr. Tom Smith, Dr. Ronna Turner, and Dr. Mike Wavering for getting me through this and for
putting up with all of my international emails! A special thanks to Dr. Turner for all of her hard
work, patience, and guidance during my entire dissertation process – I could not have done it
without you. Thanks to Dr. Ryan Walker (I assume you will have your PhD by the time anyone
reads this) for being my best friend and sounding board in graduate school. Thank you to the
Friday racquetball group for giving me a good way to stay in shape, laugh, relieve stress, and
forget about school for a few hours each week. Thank you to Janet Johnson-Mertz, the title
“secretary” is not grand enough to describe all of the things you do for every graduate student in
our department. Thank you to my family for your eternal patience and support during this
process. If there is anybody I forgot to acknowledge, your support did not go unnoticed nor
unappreciated, just unacknowledged here, and I apologize for the oversight.

Contents
Chapter 1 Introduction.......................................................................................................................... 1
Introduction ..................................................................................................................................... 1 Statement of the Problem ............................................................................................................... 3 Is There Really a Problem? ............................................................................................................ 5
Purpose and Significance of the Study.......................................................................................... 6 Research Questions ........................................................................................................................ 9 Paradigmatic Underpinnings........................................................................................................ 12
Definition of Terms ...................................................................................................................... 12 Induction versus Mentoring Programs. .......................................................................... 12 Mentors. ............................................................................................................................ 13
New Teachers. .................................................................................................................. 13 Stayers, Movers, Leavers and Returners. ....................................................................... 14 Cumulative versus Yearly Attrition/Retention Rates. ................................................... 14
Cohort/Cohort Year. ........................................................................................................ 15 Summary ....................................................................................................................................... 15
Chapter 2 Review of the Literature ................................................................................................... 16
Introduction ................................................................................................................................... 16 Attrition Rates - Causes and Costs .............................................................................................. 16
Causes. .............................................................................................................................. 16 Costs.................................................................................................................................. 17
Retention Rates ............................................................................................................................. 19 Comparison Problems...................................................................................................... 19 Assumptions. .................................................................................................................... 21
Designations and Calculations. ....................................................................................... 22 Conversion Procedures. ................................................................................................... 23
Effective Induction Programs ...................................................................................................... 24
California Beginning Teacher Support and Assessment (BTSA)................................. 25 California Mathematics Project Supporting Teachers to Increase Retention
(CMP STIR). .............................................................................................................. 27
Connecticut Beginning Educator Support and Training (CT BEST). .......................... 29 Flowing Wells Teacher Induction Program for Success (TIPS). .................................. 31 Glendale Union High School District. ............................................................................ 36
Islip New Teacher Induction Program (INTIP). ............................................................ 38 Lafourche Parish Public Schools (FIRST) Program. ..................................................... 40 Montana Beginning Teacher Support Program (BTSP). ............................................... 43
Oconee County Teacher Induction Program (TIP). ....................................................... 44 Rochester Career in Teaching Plan. ................................................................................ 45 South Texas School Districts. ......................................................................................... 47
Common Components of Effective Programs ............................................................................ 49 Knowledgeable Mentors in the Same Subject Area and/or Grade. .............................. 49 Collaboration/Sense of Community................................................................................ 50
Individualized Professional Development...................................................................... 51 Support from Principal/Administration. ......................................................................... 52 Observations. .................................................................................................................... 53
Release Time/Reduced Teaching Load. ......................................................................... 53 Networking. ...................................................................................................................... 54
The Right Mentor is Key ............................................................................................................. 55 Summary ....................................................................................................................................... 59
Chapter 3 Methodology ...................................................................................................................... 61
Introduction ................................................................................................................................... 61 IRB Approval................................................................................................................................ 61 Research Design ........................................................................................................................... 62
Instrument ..................................................................................................................................... 62 Schools and Staffing Survey (SASS). ............................................................................ 63 Teacher Follow-up Survey (TFS). .................................................................................. 64
Beginning Teacher Longitudinal Study (BTLS). ........................................................... 64 Sampling Frames and Sample Selection ..................................................................................... 65
SASS Public Schools. ...................................................................................................... 66
SASS Teachers. ................................................................................................................ 67 BTLS Teachers................................................................................................................. 68
Data Collection Procedures.......................................................................................................... 68
Data Processing and Imputation .................................................................................................. 69 Response Rates ............................................................................................................................. 72
Unit Response Rate. ......................................................................................................... 72
Overall Response Rate..................................................................................................... 73 Unit Nonresponse Bias Analysis..................................................................................... 73 Item Response Rates. ....................................................................................................... 74
Weighting ...................................................................................................................................... 74 Variance Estimation ..................................................................................................................... 75 Reliability of Data ........................................................................................................................ 76
Description of Variables .............................................................................................................. 77 Research Questions ...................................................................................................................... 77 Research Question 1: What are Essential Components of Effective New Teacher
Induction Programs? .............................................................................................................. 78 Research Question 1a: What are the Teacher Induction Components Cited in the
Literature as being Effective? ................................................................................... 78
Research Question 1b: How do Induction Program Retention Rates Compare?......... 79 Research Question 1c: Do Induction Programs Identified as Being Effective
Include the Induction Program Components Most Often Cited in the
Literature? .................................................................................................................. 79 Research Question 2. Does Participation in a Teacher Induction Program and
Associated Program Components (e.g., Seminars and Common Planning Time)
Correlate with Higher Teacher Retention Rates for a National Sample of Teachers? ...... 80 Research Question 2a: Does Participation in a New Teacher Induction Program
Correlate with Higher Retention Rates?................................................................... 80
Research Question 2b: Do Induction Programs that Provide New Teachers with
Reduced Teaching Schedules or Fewer Preparations Correlate with Higher
Retention Rates? ........................................................................................................ 81
Research Question 2c: Do Induction Programs that Provide New Teachers with
Common Planning Time with Teachers in Their Same Subject Correlate
with Higher Retention Rates? ................................................................................... 81 Research Question 2d: Do Induction Programs that Provide New Teachers with
Ongoing Seminars and Professional Development Correlate with Higher
Retention Rates? ........................................................................................................ 82 Research Question 2e: Do Induction Programs that Provide New Teachers with
Extra Classroom Assistance such as a Teacher Aide Correlate with Higher
Retention Rates? ........................................................................................................ 82 Research Question 2f: Do Induction Programs that Provide New Teachers with
Regular Supportive Communication with Their Administrators Correlate
with Higher Retention Rates? ................................................................................... 82 Research Question 2g: Do Induction Programs that Provide New Teachers with
Ongoing Guidance or Feedback from a Mentor or Master Teacher Correlate
with Higher Retention Rates? ................................................................................... 83 Research Question 2h: Do Induction Programs that Provide New Teachers with
Various Combinations of the Previously Tested Components Correlate with
Higher Retention Rates?............................................................................................ 83 Research Question 3: Does Participation in a New Teacher Induction Program with
Mentoring and Associated Mentoring Components (e.g., Mentor in Same Subject
and/or Grade, Conducting Observations) Correlate with Higher Teacher Retention
Rates for a National Sample of Teachers? ............................................................................ 84 Research Question 3a: Does Having a Mentor During the First Year of
Induction Correlate with Higher Retention Rates?.................................................. 84 Research Question 3b: Does Having a Mentor with Experience Teaching Either
the Same Subject or the Same Grade Level Correlate with Higher Retention
Rates? ......................................................................................................................... 85 Research Question 3c: Does the Frequency with which New Teachers Meet
with Their Mentors During the First Year of Induction Correlate with
Higher Retention Rates?............................................................................................ 85 Research Question 3d: Does the Frequency with which Mentors Observe New
Teachers Present Lessons During the First Year of Induction Correlate with
Higher Retention Rates?............................................................................................ 86 Research Question 3e: Does the Extent to which New Teachers Feel a Mentor
Improved Their Overall Teaching During the First Year of Induction
Correlate with Higher Retention Rates?................................................................... 86 Research Question 4: Can a Statistical Model be Developed to Predict the Likelihood of
Retaining a Teacher After Their First and Second Year of Teaching Based on
Selected Induction Program Components?........................................................................... 87 Summary ....................................................................................................................................... 87
Chapter 4 Results ................................................................................................................................ 88
Research Question 1: What are Essential Components of Effective New Teacher
Induction Programs? .............................................................................................................. 88 Research Question 1a: What are the Teacher Induction Components Cited in the
Literature as Being Effective? .................................................................................. 88 Research Question 1b: How do Induction Program Retention Rates Compare?......... 90

Research Question 1c: Do Induction Programs Identified as Being Effective
Include the Induction Program Components Most Often Cited in the
Literature. ................................................................................................................... 91 Research Question 2: Does Participation in a Teacher Induction Program and
Associated Program Components (e.g., Seminars and Common Planning Time)
Correlate with Higher Teacher Retention Rates for a National Sample of Teachers? ...... 92 Research Question 2a: Does Participation in a New Teacher Induction Program
Correlate with Higher Teacher Retention Rates? .................................................... 93
Research Question 2b: Do Induction Programs that Provide New Teachers with
Reduced Teaching Schedules or Fewer Preparations Correlate with Higher
Retention Rates? ........................................................................................................ 94
Research Question 2c: Do Induction Programs that Provide New Teachers with
Common Planning Time with Teachers in Their Same Subject Correlate
with Higher Retention Rates? ................................................................................... 95
Research Question 2d: Do Induction Programs that Provide New Teachers with
Ongoing Seminars and Professional Development Correlate with Higher
Retention Rates? ........................................................................................................ 96
Research Question 2e: Do Induction Programs that Provide New Teachers with
Extra Classroom Assistance such as a Teacher Aide Correlate with Higher
Retention Rates? ........................................................................................................ 97
Research Question 2f: Do Induction Programs that Provide New Teachers with
Regular Supportive Communication with Their Administrators Correlate
with Higher Retention Rates? ................................................................................... 98
Research Question 2g: Do Induction Programs that Provide New Teachers with
Ongoing Guidance or Feedback from a Mentor or Master Teacher Correlate
with Higher Retention Rates? ................................................................................... 99
Research Question 2h: Do Induction Programs that Provide New Teachers with
Various Combinations of the Previously Tested Components Correlate with
Higher Retention Rates?.......................................................................................... 100
Research Question 3: Does Participation in a New Teacher Induction Programs with
Mentoring and Associated Mentoring Components (e.g., Mentor in Same Subject
and/or Grade, Conducting Observations) Correlate with Higher Teacher Retention
Rates for a National Sample of Teachers? .......................................................................... 102 Research Question 3a: Does Having a Mentor during the First Year of Induction
Correlate with Higher Retention Rates?................................................................. 103
Research Question 3b: Does Having a Mentor with Experience Teaching Either
the Same Subject or the Same Grade Level Correlate with Higher Retention
Rates? ....................................................................................................................... 105
Research Question 3c: Does the Frequency with which New Teachers Meet
with Their Mentors during the First Year of Induction Correlate with Higher
Retention Rates? ...................................................................................................... 107
Research Question 3d: Does the Frequency with which Mentors Observe New
Teachers Present Lessons during the First Year of Induction Correlate with
Higher Retention Rates?.......................................................................................... 108

Research Question 3e: Does the Extent to which New Teachers Feel a Mentor
Improved their Overall Teaching during the First Year of Induction
Correlate with Higher Retention Rates?................................................................. 109 Research Question 4: Can a Statistical Model be Developed to Predict the Likelihood of
Retaining a Teacher After Their First and Second Year of Teaching Based on
Selected Induction Program Components?......................................................................... 111 Year Two New Teacher Employment Status. .............................................................. 113 Year Three New Teacher Employment Status. ............................................................ 115
Summary ..................................................................................................................................... 117 Chapter 5 Discussion ........................................................................................................................ 119
Summary ..................................................................................................................................... 119
Implications for Practice ............................................................................................................ 124 Limitations .................................................................................................................................. 125 Recommendations for Further Research ................................................................................... 126
Conclusion .................................................................................................................................. 128 References ......................................................................................................................................... 131 Tables ................................................................................................................................................ 139
Figures ............................................................................................................................................... 162 Appendix A ....................................................................................................................................... 165

1
Chapter 1
Introduction
Introduction
The next time you are sitting on a plane getting ready to land in bad weather, ask yourself
if you prefer a pilot with years of experience or one fresh out of flight school. Now imagine you
are the parent of a school-age child. Would you prefer that they learn from a veteran teacher or
one with very little experience? With the current attrition rates, chances are good that your child's
teacher has relatively little experience since 10-20% of new teachers quit in the first year and
50% of all new teachers quit the profession within the first five years (National Commission on
Teaching and America's Future, 2007). According to the U.S. Department of Education, National
Center for Education Statistics (Snyder & Dillow, 2011, p. 110), 13.4% of K-12 teachers have
fewer than three years of experience and an additional 33.6% have between three to nine years of
experience. This means that 47% of all grade school teachers have fewer than 10 years of
teaching experience. This represents a 4.2% increase over the 2004 numbers, and most experts
predict that the numbers will increase substantially with the impending retirement of the “Baby
Boom” generation teachers.
Although some teachers are born great, most have to develop their skills over years of
practice before they become truly effective educators. Most experts agree that it takes between 3-
7 years on average for a teacher to learn their craft well. “A body of research has conclusively
shown that teachers improve dramatically between their first and second years of teaching,
considerably so between their second and third, and relatively little in subsequent years”
(National Council on Teacher Quality, 2009, p. 5). “Teacher quality matters. In fact, it is the
most important school-related factor influencing student achievement” (King Rice, 2003, p. v).

2
Numerous other research studies agree that the number one factor affecting student achievement
is a quality teacher in the classroom (Darling-Hammond (Ed.), 1994; Hanusheck, 1992;
Hanusheck & Rivkin, 2004; Porter & Brophy, 1988; Rivkin, Hanusheck & Kain, 2005; Sanders
& Rivers 1996; Schalock & Schalock, 1993; Shakrani, 2008; Wright, Horn & Sanders, 1997).
With so many teachers leaving the profession early, too many students never get the benefit of
learning from experienced teachers.
Politicians and activists like to state that education is a civil rights issue when they try to
highlight the achievement gap that exists between schools in low-income neighborhoods and
private schools or those schools that reside in neighborhoods that are more affluent. However, on
a national level teacher attrition rates and teacher experience levels are two areas where most
school types are approximately equal. Private schools suffer slightly higher attrition rates than
public schools, while schools in low-income areas have attrition rates on par with the rest of
public schools (Tables 1 and 2). Additionally, attrition rates do not differ significantly across
salary range, gender, race/ethnicity or subject taught. Hence, high attrition rates are common and
relatively equal in all types of schools and districts all across the United States (Tables 1 and 2).
The nationwide average yearly retention rate for new public school teachers was 93% for the six
years for which the U.S. Department of Education collected data. The average yearly retention
rate for new private school teachers was only 87%, and the weighted average of the entire group
of all teachers was 92% for those six years. These retention results count both those teachers still
teaching at the same school (Stayers) and those who moved to another school (Movers). Since
Movers still cost the school money and time by necessitating the recruiting and training of a new
teacher to replace them, it is good to look at retention rates for only the Stayers as well. Counting
only Stayers, the national average drops to 84.7% (85.4% Public, 80% Private). Fortunately, only

3
7.8% of new hires leave teaching for other professions in the first year. However, there still
exists a 15% total nationwide turnover rate of new teachers that schools must replace each year,
without taking into account retirements. That 15% turnover costs schools both financially and
academically, so anything that can lower new teacher attrition is worth investigating.
Statement of the Problem
Teachers who receive insufficient support experience higher levels of stress and job
dissatisfaction (Arnold-Rogers et al., 2008; CCTC, 1992; Darling-Hammond & Berry, Summer,
1999; Metropolitan Life, 2005). A lack of professionalism and the “isolation” of teaching are just
two of the many factors that can contribute to stress and dissatisfaction. New teachers need more
support dealing with student discipline, classroom management, creating/teaching lessons and
curriculum issues - among other things (Huling-Austin & Murphy, 1987, April; Karge &
Freiberg, 1992, April; Metropolitan Life 1991, 2006, 2008; Odell & Ferraro, 1992; Wilkinson,
1994). One of the first-year teachers participating in the Winstead Fry study “craved more
support from her administrator and wished student teaching had provided her with experience
interacting with administration” (2007, p. 218). Odell and Ferraro (1992) found that new teachers
most valued emotional support and guidance in using instructional strategies and obtaining
resources for the classroom, while they placed less importance on help with disciplining students
and working with parents. Since the needs of new teachers vary so drastically, a “one-size-fits-
all” attitude towards induction is not effective. Instead of prescriptive induction programs,
Wilkinson suggests programs designed to “accommodate beginning teachers who are
developmentally at different stages, who have different needs and require various types of
assistance” (1994, p. 59). After studying 150 mentor-mentee pairings, Wildman, Magliaro, and

4
Niles came to a similar conclusion, stating that “mentoring, like good teaching, should be
defined by those who carry it out” (1992, p. 212).
The reasons why teachers leave can vary as drastically as the types of support that they
desire. However, new teachers often have additional reasons to leave the profession early
because “they are often placed in the most disadvantaged schools and assigned the most difficult-
to-teach students, with the greatest number of class preparations (many of them outside their
field of expertise) and a slew of extracurricular duties” (NCTAF, 1996, p. 39). The U. S.
Department of Education and other research institutions frequently collect data concerning the
causes of teacher attrition. Some of the more common reasons cited in these studies are: a lack of
planning time (65%), two heavy of a workload (60%), problematic student behavior (53%), and
a lack of influence over school policy (52%). Beginning teachers are even more vulnerable to
attrition because they often receive the low performing students and the less desirable classes.
First year teachers often report feelings of isolation and abandonment. They want a mentor or
guide whom they can observe modeling good teaching practices, and who can in return observe
them teach and provide constructive feedback. They also want a support group of new teachers
where they can discuss the trials and tribulations of being a new teacher. On average, new
teachers report not receiving enough professional support, feedback, encouragement, or live
demonstrations of what it takes to help their students succeed.
High attrition rates cause various problems for schools and societies. Recent studies show
a strong link between high teacher attrition rates and the teacher shortages that plague most
school districts. “It is widely concluded that one of the pivotal causes of inadequate school
academic performance is a teacher shortage and the resulting inability of schools to adequately
staff classrooms with qualified teachers” (Shakrani, 2008, p. 1). The recurring costs of recruiting,

5
hiring, and training new teachers in high attrition rate environments also affect school budgets.
The National Commission on Teaching and America’s Future (NCTAF) “estimates that the
national cost of public school teacher turnover could be over $7.3 billion a year” (2007, p. 1).
Other sources put the cost at anywhere between $4.9 billion (AEE, 2005) and $6 billion
(Shakrani, 2008) annually. The NCTAF also reports that low performing schools have difficulty
closing the achievement gap because they are constantly rebuilding their staff due to attrition and
turnover. Large amounts of both human and financial capital “is consumed by a constant process
of hiring and replacing beginning teachers who leave before they have mastered the ability to
create a successful learning culture for their students” (Shakrani, 2008, p. 2).
Is There Really a Problem?
Some experts argue that teacher attrition rates are no higher than attrition rates in other
similar fields like nursing. Current Department of Labor statistics support this viewpoint.
According to data from the Job Openings and Labor Turnover Survey (JOLTS), the attrition rate
in the education sector is one of the lowest in the private sector; averaging 12.9% over the last 10
years (see Table 3). However, the lack of more detailed statistics makes it difficult to know if
these attrition rates are truly representative of teaching and nursing. The categories are too broad
and may contain other subgroups that skew the data. For instance, nursing may have an average
attrition rate much lower than 20.6%, but other larger subgroups within the “healthcare” category
such as medical assistants and clerks, might have exceptionally high attrition rates. Similarly, the
“education” category contains administrators that may have extremely low attrition rates that
would lower the overall rate to something that is lower than the attrition rate of teachers.
According to the U.S. Department of Education statistics, the attrition rate for teachers is roughly

6
15% on average per year, which is higher than the Department of Labor statistics, but still lower
than any other category.
Although attrition rates for the educational sector may be lower than nurses and other
comparable careers, teacher attrition is still significant to our society because it concerns the
achievement of students, and the unfortunate truth is that the most promising teachers are the
ones most prone to leave the profession first (Konanc, 1996). Teachers with the highest scores on
certification tests are twice as likely to leave as those with the lowest scores (Henke, Chen, &
Geis, 2000). Attrition rates are high enough to cause a financial and intellectual strain on most
districts, and a good induction program will help to lower the rates and keep the best and the
brightest doing the job. If students are to benefit from teachers who have perfected their craft,
society must do whatever it can to minimize the premature loss of teachers.
Purpose and Significance of the Study
New teachers join the profession after investing years of schooling and tens of thousands
of dollars in the hopes of making a difference in the lives of young people. Placing a first year
teacher in a classroom without adequate support benefits no one. “With no mentoring or support
for these teachers, …many give up before they have really learned to teach. Alone in their
classrooms, without access to colleagues for problem solving or role modeling, discouragement
can easily set in” (NCTAF, 1996, p. 39). Many states and school districts now use innovative
induction programs to assist new teachers with the transition into their own classrooms. In
addition to improving their feelings of efficacy and their range of instructional strategies,
research suggests that teacher induction programs reduce new teacher attrition rates (Breaux &
Wong, 2003; CCTC, 1992; Colbert &Wolff, 1992; Darling-Hammond & Berry, Summer, 1999;
Huling-Austin & Murphy, 1987, April; Ingersoll & Kralik, 2004; Kaiser, 2011; Karge &

7
Freiberg, 1992, April; Odell & Ferraro, 1992; Shakrani, 2008). The goal of any induction
program is better preparation, support, and retention of new teachers. In addition to serving the
needs of new teachers, an effective induction program must address the needs of the
administration as well. Unfortunately, not all induction programs are equal or effective.
However, an effective induction program might include such components as:
New teacher orientation that informs teachers about their school, the district, and even the
neighborhood and student body. Answers to simple questions like, “Where is the break
room?” and “How do I use the copy machine?” (Moir & Gless, Winter, 2001; Morgan &
Kritsonis, 2008; Wong, 2001)
Establishing learned mentors so that each beginning teacher can work closely with a
veteran teacher in the same subject and grade level (Ciriza, 2005; Feiman-Nemser &
Parker, Spring, 1992; Looney, 1997, February).
Support teams that connect new teachers with groups of veteran teachers either currently
teaching or retired who can assist and guide them in addition to their mentors (Cherubini,
2007; Ingersoll & Smith, 2004, Wong, 2003).
Provide ample workshops, training, and professional development for beginning teachers
that continues beyond the first year. These opportunities give new teachers vital
information on topics relevant to their first year in the classroom (Curran & Goldrick,
2002; Robinson, 1998, October; Wong, 2005).
Mentor training. Prior to becoming a mentor, each veteran must learn the skills necessary
for effective mentoring (National Foundation for the Improvement of Education, Fall,
1999; Quinn & D’Amato Andrews, 2004; Scott, 1999).

8
Release time and/or reduced class preparations for both the new teacher and their mentor.
This affords them the time necessary to meet on a regular basis and discuss pertinent
issues. It also allows them time to observe each other teach (Ganser, 1995, April;
McConney & Maor, 2009; Winstead Fry 2007).
Establish a peer support network where new teachers have the time to meet regularly with
other new teachers to discuss relevant issues (Davis & Field Waite, Fall, 2006; Glassford
& Salinitri, 2007; Rockoff, 2008).
Mirrored schedules for new teachers and their mentors. Having the same daily free
periods or regularly scheduled meeting times gives the new teacher easy access to their
mentor (DeBolt, 1991, April; Marso & Pigge, 1990, February; Wood & Stanulis, 2009).
Continued monitoring and support from the principal or administrators through the first
three to five years of teaching where attrition rates are highest (Brewer, 2004; Ingersoll &
Kralik, 2004; Wood, Fall, 2001).
An effective induction program may not need all of these components, but most
successful induction programs have most or all of these components in some form or another.
Current research suggests that implementation of a good induction program for new teachers
lowers attrition rates, and one of the most important aspects of an effective induction program is
mentoring. However, very little research has evaluated the direct impact of mentoring and
induction on retention rates.
Before l990, the literature on mentoring consisted mainly of program descriptions,
survey-based evaluations, definitions of mentoring, and general discussions of mentors
roles and responsibilities… [with] few comprehensive studies well-informed by theory
9
and designed to examine in depth the context, content and consequences of mentoring.
(Feiman-Nemser, 1996, p. 3)
This study plans to fill this gap in the literature by determining what aspects of induction
programs are most effective, how can programs best utilize mentors, and what are the
generalized components of an effective teacher induction program?
Before attempting to look for components of an effective program, this study needs to
define what it means to be effective. For this study, an effective induction program is one that
contributes to higher retention rates. Similarly, effective aspects of mentoring are those
components that are associated with higher retention rates as well. If pre and post attrition data
are not available, a comparison of the current program attrition rate to the current national
average of 12.9% will determine a program’s effectiveness.
Research Questions
This study hypothesizes that the implementation of an induction program will result in
higher retention rates of newly hired teachers. Further, it is hypothesized that select components
of an induction program such as mentoring will be more highly correlated with teacher retention.
There are numerous publications on the components of induction programs (e.g., Brock &
Grady, 1996, August; Curran & Goldrick, 2002; Davis & Field Waite, Fall, 2006; Ingersoll &
Kralik, 2004; Wong, 2004). However, there is little published empirical data testing the
effectiveness of these programs on teacher retention, and “the content, duration and delivery of
programs are so varied from one site to another that it is not clear to what extent general
conclusions about mentoring and induction can be drawn from the extant research” (Ingersoll &
Kralik, 2004, p. 3). In this study, a nationally representative sample of teacher data from the

10
NCES 2009-10 Beginning Teacher Longitudinal Study will be used to investigate the association
between induction programs and their components with teacher attrition rates.
In order to test the hypotheses that induction programs and specific components of
induction programs will be associated with higher retention rates of newly hired teachers, the
following research questions were investigated.
1. What are essential components of effective new teacher induction programs?
a. What are the teacher induction components cited in the literature as being effective?
b. How do induction program retention rates compare?
c. Do induction programs identified as being effective include the induction program
components most often cited in the literature?
2. Does participation in a teacher induction program and associated program components (e.g.,
seminars and common planning time) correlate with higher teacher retention rates for a
national sample of teachers?
a. Does participation in a new teacher induction program correlate with higher retention
rates?
b. Do induction programs that provide new teachers with reduced teaching schedules or
fewer preparations correlate with higher retention rates?
c. Do induction programs that provide new teachers with common planning time with
teachers in their same subject correlate with higher retention rates?
d. Do induction programs that provide new teachers with ongoing seminars and
professional development correlate with higher retention rates?
e. Do induction programs that provide new teachers with extra classroom assistance
such as a teacher aide correlate with higher retention rates?

11
f. Do induction programs that provide new teachers with regular supportive
communication with their administrators correlate with higher retention rates?
g. Do induction programs that provide new teachers with ongoing guidance or feedback
from a mentor or master teacher correlate with higher retention rates?
h. Do induction programs that provide new teachers with various combinations of the
previously tested components correlate with higher retention rates?
3. Does participation in a teacher induction program with mentoring and associated mentoring
components (e.g., mentor in same subject and/or grade, conducting observations) correlate
with higher teacher retention rates for a national sample of teachers?
a. Does having a mentor during the first year of induction correlate with higher retention
rates?
b. Does having a mentor with experience teaching either the same subject or the same
grade level correlate with higher retention rates?
c. Does the frequency with which new teachers meet with their mentors during the first
year of induction correlate with higher retention rates?
d. Does the frequency with which mentors observe new teachers present lessons during
the first year of induction correlate with higher retention rates?
e. Does the extent to which new teachers feel a mentor improved their overall teaching
during the first year of induction correlate with higher retention rates?
4. Can a statistical model be developed to predict the likelihood of retaining a teacher after their
first and second year of teaching based on selected induction program components?
Based on the literature review and national database comparison outcomes, a recommendation
will be given of what an effective induction program should incorporate. Ideally, school

12
administrators could use the recommendations from this study to design a simple and cost-
effective induction program that would help lower their new teacher attrition rates.
Paradigmatic Underpinnings
Morgan (2007) defines paradigms “as systems of beliefs and practices that influence how
researchers select both the questions they study and the methods that they use to study them” (p.
49). According to Reichardt and Cook (1979), all of the attributes that make up the paradigms
are logically independent, and the attributes are not logically linked to one another. Therefore,
“there is nothing to stop the researcher, except perhaps tradition, from mixing and matching the
attributes from the two paradigms to achieve that combination which is most appropriate for the
research problem and setting at hand” (p. 18). This study utilizes attributes from the
constructivist and post-positivist paradigms. As a mathematician, I want to believe in the
positivist view that reality is out there to be studied, captured, and understood. However, as an
educator, I have seen firsthand the constructivist theory that each student constructs his or her
own reality. Therefore, the ontological viewpoint of this study mixes both paradigms.
Epistemologically, this study follows the constructivist belief that the knower and the known are
interactive and inseparable. The methodology is mostly post-positivist in nature using qualitative
methods, frequency counts, and low-level statistics as well as chi square analyses and logistic
regression analysis. All of this should result in a post-positivist study with good generalizations,
descriptions, patterns, and grounded theory conclusions. For a more complete description of
these paradigm attributes, see (Hatch, 2002, pp. 11-20).
Definition of Terms
Induction versus Mentoring Programs. This study is concerned with teacher induction;
it is not just about mentoring. Various sources in the literature use the terms “induction

13
programs” and “mentoring programs” interchangeably. However, there is a difference between
the two terms. A mentor is a component, albeit an important component, of an induction
program. Induction is a comprehensive training and support process that continues for 2 or 3
years and fosters the lifelong professional development of new teachers in order to improve their
effectiveness.
There is much confusion and misuse of the words mentoring and induction. The two
terms are not synonymous. A mentor is a single person, whose basic function is to help a new
teacher. Mentoring and induction are not equivalent. Mentoring is only one component of an
effective induction program. For this reason, this study will use the more accurate term
“induction program” when referring to any program designed to help new teachers transition into
their first years of teaching.
Mentors. Some sources refer to mentor teachers as “guides”, “coaches”, “sponsors” or
various other similar terms and phrases. Some programs give mentors other names like “Buddy”
or “facilitator”, and some programs split up the mentoring duties among several individuals. In
this study, a “mentor” is defined to be any teacher (either currently employed or retired) who has
years of teaching experience and helps guide a new teacher through their first years on the job by
providing examples of good teaching, lesson design, classroom management, and any other
necessary teaching related skills.
New Teachers. Most programs classify any teacher new to their school or district as a
new teacher regardless of previous teaching experience. Most programs also require all new
teachers to attend their induction programs even if the teacher has several years of K-12 teaching
experience. The philosophy is that the teachers are still “new” to that particular school
community, and the induction program helps them transition into a potentially new set of

14
customs and values. Unless stated otherwise, any program mentioned in this study characterizes
all teachers new to their school or district as new teachers, and they require all of them to attend
their induction programs regardless of previous teaching experience. However, the Beginning
Teacher Longitudinal Study (BTLS) dataset only contains teachers that are new to teaching.
Stayers, Movers, Leavers and Returners. Stayers are teachers still teaching in the same
school where they went through an induction program. Movers are teachers that are teaching in a
different school, but still teaching. Leavers are teachers who are no longer teaching anywhere.
Returners left the profession for a length of time and then came back to it later. Some programs
only count Stayers in their retention rates, while most programs count both Stayers and Movers
in their rates. Unless stated otherwise, any program discussed in this study counts both Stayers
and Movers in their retention rates.
Cumulative versus Yearly Attrition/Retention Rates. Some programs list their
retention rates yearly. This means that they only look at each cohort of teachers for one year after
their induction year. For example, at the end of the 2004-05 school year, they see how many of
the new teachers from the 2003-04 induction cohort are still teaching in their school or district.
They might also do this for a multi-year time span as well and report how many of the 2003-04
teachers are still teaching after two years or five years. Some programs prefer more longitudinal
data. They keep track of every cohort over a number of years, and their retention rates reflect
how many teachers are still teaching after a cumulative number of years. For example, imagine a
program that started in 2001-02. They might publish their retention rates in 2008 by showing
how many teachers from each cohort year are still teaching in 2008, or they might just report the
total rate. Either way, they are reporting how many are still teaching in 2008 rather than how
many were still teaching at some fixed duration of time after each year.

15
Cohort/Cohort Year. A cohort or cohort year is the group of new teachers hired into a
particular induction program in one academic year. If the Mt. Pleasant school district hires 57
teachers for the 2000-01 school year, then those 57 teachers are one cohort. When discussing
how many of them are still teaching three years later, one would refer to them as the 2000-01
cohort or cohort year.
Summary
This research study adds to the minimal amount of research that exists on the quantifiable
impact of induction programs and the associated components on new teacher attrition rates. The
findings will help public school administrators design new teacher induction programs with
components associated with higher probabilities of new teacher retention in the first three years.

16
Chapter 2
Review of the Literature
Introduction
In this chapter, a thorough examination of the background literature related to induction
programs will provide grounding related to the research questions of this study. The review of
the literature has four sections. The first section examines attrition rates and their causes and
costs. The second section lists some of the induction programs from the United States that the
literature references as being effective at reducing attrition rates. The third section compares the
success rates of various induction programs, while the fourth section looks for common
components in those programs that are successful at reducing new teacher attrition rates.
Attrition Rates - Causes and Costs
Not only does high teacher attrition cost schools fiscally, but it also costs them
academically. “When assigned to a first-year teacher, the average student gains .06 to .08
standard deviations of achievement less than observably similar students assigned to experienced
teachers” (Staiger & Rockoff, 2010, p. 102). Students assigned to second-year teachers saw gains
only .01 to .04 standard deviations below students assigned to veteran teachers, and students of
third year teachers saw gains on par with those of veteran teachers. Most teachers need three to
five years of teaching experience before they become competent and confident in their abilities,
and 50% of new teachers quit within their first five years. As a result, our students suffer from a
lack of veteran teachers, while already financially burdened schools suffer further budgetary
constraints by having to find, hire, and train a new work force every year.
Causes. According to research, there are several different factors contributing to high
teacher attrition rates. “The National Commission on Teaching and America's Future (2003)

17
found that a lack of opportunity for continued preparation and guidance in teachers' formative
teaching years was a primary reason for teacher job dissatisfaction” (McNeil, Wood, Kurtz,
Thousand, & Nevin, 2006, November, p. 1). Various sources cite low pay as a possible cause
(Andrews & Carr, 2004; Ingersoll & Rossi, 1995; Morgan & Kritsonis, 2008; Shakrani, 2008).
Additional research cites causes such as unpreparedness, feelings of not belonging or isolation,
classroom management, poor leadership, and a general lack of support (Arends & Rigazio-
DiGilio, 2000, July; Arnold-Rogers et al., 2008; Cherubini, 2007; Ingersoll & Rossi, 1995;
Metropolitan Life, 1991, 2005, 2006, 2008; Morgan & Kritsonis, 2008; Quinn & D’Amato
Andrews, 2004; Shakrani, 2008; Winstead Fry, 2007; Wong, 2001, 2003, 2004). Of course, some
teachers leave the profession to start a family, to retire, or for other personal reasons. However,
too many teachers are leaving for reasons that an effective induction program could potentially
alleviate.
Costs. The cost of high teacher turnover is both academic and economic. Academically,
it is difficult to provide students with quality teachers if the teachers leave before they are able to
develop their skills. “It is widely concluded that one of the pivotal causes of inadequate school
academic performance is a teacher shortage and the resulting inability of schools to adequately
staff classrooms with qualified teachers” (Shakrani, 2008, p. 1). According to the National
Commission on Teaching and America's Future (2007, p. 3), “a caring, competent, and qualified
teacher for every child” is the most important ingredient in education reform. “Based on research
in Texas, the importance of having an effective teacher instead of an average teacher for four or
five years in a row could essentially close the gap in math performance between students from
low income and high income households” (Wong, 2004, p. 41).

18
Based on the gains that teachers make in their first few years of experience, every time a
school district loses an experienced teacher with two or more years of experience and is
forced to hire a novice teacher, the students assigned to the novice teacher over the first
two years of their career lose roughly .10 standard deviations in student achievement.
(Staiger & Rockoff, 2010, p. 103)
Some researchers argue that an average annual attrition rate of 13% (US Department of Labor
Bureau of Labor Statistics, 2010) over the last 10 years is not that bad when compared to other
professions. However, numerous studies show that the “best and the brightest” appear to be the
ones most likely to leave the profession (Henke et al., 2000; Ingersoll & Kralik, 2004; Murnane,
Singer, Willett, Kemple, & Olsen (Eds.), 1991; Schlechty & Vance, 1981), which makes any
level of teacher attrition a costly problem for society.
In addition to the academic costs, there is a high financial cost associated with teacher
turnover. The US Department of Education National Center for Education Statistics (2011b)
estimated that teacher attrition cost schools nearly $4.9 billion per year in 2000, and their
estimate rose to $7 billion annually in 2010. The Department of Labor conservatively estimates
that attrition costs the school 30% of the leaving employee's salary. The Alliance for Excellent
Education (2005) gave a conservative national estimate of $2.2 billion per year to replace just the
public school teachers who left the profession. This estimate did not include those teachers who
transferred to another school or those that left private schools. When the estimate includes the
cost of replacing teachers who transfer to other schools, the estimate reaches $6 billion annually
for public schools alone. When estimating the approximate dollar value of student achievement
over the course of a student’s lifetime, Staiger and Rockoff estimate that “a .10 standard
deviation gain in math scores has a value of roughly $10,000 to $25,000 per student” (2010, p.

19
103). With an average class size of 20 to 24 students, the cost of lower academic achievement
due to the loss of an experienced teacher can be as high as $500,000 per class. Whether you
measure the cost in dollars or academic performance, the cost of teacher attrition is too high to
continue at its current rate.
Retention Rates
There are dozens of new teacher induction programs cited in the literature as being
successful. Unfortunately, many of these programs do not report empirical data results or any
form of statistics indicating a reduction in attrition rates. However, it was possible to find
retention rates for the 11 programs cited most frequently in the review of the literature as well as
another dozen or so lesser-known programs. Discussions of the 11 better-known programs are in
the next section, and an additional 11 of the lesser-known programs are included in Table 4.
Comparison Problems. A problem arises when trying to compare retention rate results
from more than one induction program. Some programs only count Stayers in their retention
rates, while other programs count both Stayers and Movers. Sometimes it is logically sound to
include Movers in retention rates. For instance, if an induction program is district-wide or
statewide, teachers moving within the district or state should not count as Movers since their
movement does not cause an employment vacancy for the agency running the induction program.
They would have to “move” outside of the area serviced by the induction program before there
would be a need to hire another new teacher. However, if an induction program exists at the
school level, any teacher who moves to another school, district, or state would have to be
replaced and newly mentored. Therefore, only Stayers would be applicable for retention rate
calculations in this situation. In order to avoid underestimating the proportion of teachers
needing induction programs, the national average is computed using only Stayers. Unfortunately,

20
most programs fail to mention whether or not their results include Movers. In order to compare
the rates with the national average retention rate of Stayers (85%), this study will assume results
only include Stayers whenever the source fails to state explicitly whether the rate includes
Movers. Whenever possible, this study will let the reader know when a result includes Movers in
the retention rate.
A separate problem arises when comparing results because of the different ways in which
programs calculate their results. As defined earlier, the two different ways of calculating results
are yearly and cumulative. Yearly results simply list the percentage of teachers still teaching
after one year, while cumulative results list the percentage of teachers still teaching after a
number of years. For instance, one program might collect retention rates at the end of each
academic year from 2000-01 to 2004 -05, and report those five yearly rates separately. Even
though the oldest cohort in this example is from five years ago, this study does not consider this
a five-year retention rate. It is merely a one-year retention rate that happens to be from five years
ago. It only represents the percentage of teachers who continued to teach after one year ( i.e., still
teaching in 2001-02). These are merely five separate individual one-year or yearly retention
rates.
Some programs might report the average of these five yearly rates. This of course brings
up the question of whether or not they weighted the averages based upon the sizes of each cohort
year. Unless all of the cohort years have the same number of new teachers, an average of those
yearly rates is mathematically inaccurate. For a simple example, consider a school district that
hires 100 new teachers the first year. They have a great induction program, and only 10 of them
leave the district by the end of the year for a 90% retention rate. Now, the second year, they hire
10 teachers to replace those who left, and all 10 leave at the end of that year for a 0% retention

21
rate. So, is the average yearly retention rate really just 45% (the average of 90% and 0%)? The
weighted average is (how many total people remained for a year) over (the total hired) =
(90+0)/(100+10) = 90/110 = 81.8%. Thus, each person receives equal weight, and 81.8% is a
more accurate average yearly retention rate. Since the chances of a school or district hiring the
same number of teachers each year is very low, any average yearly rate that is not weighted may
be inaccurate. Unless stated otherwise, it is assumed that the results stated are NOT weighted.
Alternatively, a program might present a single retention rate for this five-year time-span
cumulatively. In this case, they would keep track of how many teachers from all five cohorts are
still teaching at the end of the 2004 -05 academic year, and report that overall percentage as a
five-year cumulative retention rate. Again, this study does not consider this a five-year retention
rate because only one cohort (2000-01) has been teaching for five years, while the rest of the
cohorts have not. The 2001-02 cohort only has four years of teaching experience, and it goes
down from there. If they wanted to present a five-year retention rate for all five cohorts, they
would need to calculate it five times over five years. They would not know the five-year
retention rate of the 2004-05 cohort until the end of the 2009-10 school year.
Assumptions. So, how does someone compare a yearly retention rate to a three-year rate
and a five-year cumulative rate? Simple, they don't! Instead, one must convert each rate into a
yearly rate. In order to convert the rates, one would need to make two assumptions about the
cohorts from each program. First, one must assume that cohorts from a particular program are
the same size in order to allow for the unweighted average of their rates. Second, one must
assume that each program has a constant rate of attrition from year to year in order to do
logarithmic regression on the rates. The assumption of a constant rate of attrition also makes it
possible to project a yearly rate out to a two-year and five-year rate. Most likely, these two

22
assumptions are not true, but they are necessary for the computations. Therefore, readers must
use caution when interpreting computed retention rates.
Designations and Calculations. Some programs were thorough enough to list yearly,
two-year, and five-year retention rates, and those appear as reported in Table 4 without any
asterisks or markings. If a program provided multiple rates for any of the three categories, a
mean of the rates is displayed and designated with an “a” for averaged. Because retention rates
can fluctuate drastically from one year to the next, average rates are used whenever possible.
Even with the problem of not being able to weight each rate properly, the author believes that an
average rate more closely represents the program’s success. Whenever possible, this study
computed a weighted mean, and designated it with a “w” in Table 4. When programs only
provided off year rates like three-year or ten-year rates, exponential regression was used to
calculate any missing rates. An “r” designates rates in Table 4 that were calculated with
regression techniques. A “p” represents any rate obtained by raising a different rate to a power.
Column seven “%∆” in Table 4 presents the percent change in yearly attrition rates.
Some sources provided preprogram retention rate data for the school or district. In other cases,
either a control group or comparable school or district rate was available. Whenever such rates
were available, percent change in attrition was calculated and provided in column seven of Table
4. Since these values represent a percent drop in attrition rates, higher values indicate a more
effective program. Thus, all of the percentage data in Table 4 are consistent in that higher values
denote higher levels of effectiveness. In every instance except one (BTSA Statewide), the
percent change is calculated by taking the difference between the two yearly rates (pre and post,
or program and control) and dividing it by the original or control rate. The BTSA rates were two-

23
year rates, so they were first converted to yearly rates by taking their square roots before
computing the percent change.
The last column in Table 4 “Norm” represents the calculated yearly rate for each program
normalized to the national average. Since some programs took place in schools or districts with
attrition rates far higher than the national average, it is not fair to compare them to the national
average when assessing their effectiveness at lowering attrition. If an induction program results
in a retention rate of 84%, it might be considered ineffective since the national average is 85%,
but that school or district may have had a retention rate of 70% or even 50% before the start of
the program. Therefore, when the data were available, the author computed the percent change in
attrition rates and a corresponding “normalized” yearly retention rate. This normalized rate
represents what the retention rate would be if the program were applied to a school or district
that started at the national average of 85%. Take the MUSE results for example. This program
reported a yearly retention rate of only 89%. However, the National Center for Education
Statistics (NCES) mobility report from the 2008-09 Teacher Follow-up Survey (TFS) data
reported on page 9 that 27.5% of special education teachers leave in the first year nationally.
Thus, this program theoretically reduced the attrition rate from 27.5% to only 11% or a (27.5 –
11)/27.5 = 60% reduction. Therefore, if the same percent change were applied to a school or
district that began with the national average attrition rate of 15%, in theory, it would expect the
same 60% reduction in attrition. This means the program would theoretically normalize
nationally to a 94% retention rate.
Conversion Procedures. All of the rates denoted with an “r” in Table 4 were computed
using the GROWTH function in Microsoft Excel 2007. It performs a simple exponential
regression on a set of known independent and dependent values. If a program supplied the

24
retention rates for one-year (85%), two-year (70%), and three-year (82%), the GROWTH
function would use (0, 1, 2, 3) as the independent variables and (1, .85, .7, .82) as the dependent
variables. The GROWTH function regresses an exponential function of best fit onto those data
points and returns calculated values for any requested year’s rate. Additionally, this study
utilized the LOGEST function to return a full array of statistics associated with the regression
function. The GROWTH function provided an easy way to compute yearly, two-year, and five-
year rates from any set of rates, while the LOGEST function provided a check for the goodness
of fit with the returned correlation coefficient r and other statistics.
Every rate in Table 4 designated with a “p” was calculated by simply raising a given rate
to a power in order to calculate the other rates. Since this is a far less robust method than
exponential regression and therefore more likely to lead to inaccurate estimates, it was only used
when necessary. If only one rate was available for a program, it was not enough data to run an
exponential regression with an acceptable level of accuracy. So, in those few cases where only
one rate was available, the other rates were calculated as powers of the given rate. For instance,
the Clark County program in Nevada only provided its yearly retention rate of 92.5% (Breaux &
Wong, 2003, p. 110), so the two year and five years rates were obtained by raising the yearly rate
to the powers of two and five respectively. Like all other calculations, this assumes a constant
rate of attrition from year to year.
Effective Induction Programs
Various studies point out effective induction programs. Some provide empirical data to
support their claim that their program reduces attrition rates, but most only offer anecdotal
evidence such as rave reviews from outside experts who believe the program is effective.
Ingersoll and Kralik (2004) list six programs that show positive results. Programs such as the

25
California Mentor Teacher Induction Program (MTIP) and the New York City Retired-Teachers-
as-Mentors Program showed only slight positive effects on retention rates. However, other
programs such as the Toronto Teacher Peer Support Program, Montana Beginning Teacher
Support Program (BTSP), Flowing Wells, Connecticut Beginning Educator Support and Training
(CT BEST), California Beginning Teacher Support and Assessment (BTSA) and Lafourche
Parish Public Schools all showed strong results. This study chose to discuss in detail the six
programs cited most often in the literature (BTSA, CMP STIR, CT BEST, Flowing Wells, Islip,
and Lafourche), as well as five other notable programs of interest (Glendale, Montana BTSP,
Oconee, Rochester, and South TX).
California Beginning Teacher Support and Assessment (BTSA). According to the
California Education Code, Section 44279.2 (b), the purpose of the BTSA is to “improve student
educational performance through improved training, support, information and assistance for new
teachers.” The BTSA is a two-year program started in 1997 that includes collaboration, a
structured individualized induction plan, experienced mentors, and the creation of a community
of learners. According to a report by Curran and Goldrick (2002), 129 of the 133 statewide
programs reported average 1-year and 2-year retention rates of 96% and 94% respectively in
1999-2000. “Over five years, the program resulted in an attrition rate of 9% for beginning
teachers. In contrast, the attrition rate among new teachers in California who did not participate
in BTSA or a similar induction program was 37%” (Curran & Goldrick, 2002, p. 5). Other
sources cited similar statistics. “Outcome data for the first two years of implementation revealed
retention rates for first and second-year beginning teachers were extremely high in the 145
statewide induction programs - approximately 93% regardless of size of school district” (McNeil
et al., 2006, November, p. 2). Additionally, follow-up data from 2004 showed 84% of

26
participants from all three years continued to teach, and many beginning teachers had become
mentors themselves. “It seems that the induction program provided the necessary support that
empowered new teachers to transition from their role as inexperienced teachers into competent
and confident practicing teachers” (McNeil et al., 2006, November, p. 2).
The BTSA program is mandatory for all new teachers as part of their licensure and
credentialing, so there is no control group to compare results. However, a comparison of their
results to the national average, and long-term data collected by the Commission on Teacher
Credentialing (CTC) shows attrition rates far lower than the national averages. In December of
2008, the first set of BTSA results showed that 93.8% of the 2007-08 teachers were still teaching
after two years, and 92.1% of the 2006-07 teachers were still teaching after three years. After
four years, 89.7% of their teachers were still teaching, and 87.2% were still teaching after five
years. The CTC released their results again in February of 2011, and the BTSA retention rates
had dropped. Only 85.8% were still teaching after two years and 75.9% were still teaching after
five years. Although the retention rates had decreased, the BTSA program still showed enormous
improvements over the national average of only 50% still teaching after five years.
The BTSA Statewide rates presented in Table 4 are exponentially regressed aggregates
from numerous data points. The data came from the CTC Statistic of the Month December 2008
and February 2011 reports available at their website (http://www.ctc.ca.gov/educator-
prep/statistics-archive.html). Figures 1 and 2 present the data. This study used the data from
2008 as presented, but the 2011 data needed a small adjustment. Since the CTC collected the
data for their second set of results during the spring semester of 2011, it was assumed that the
rates would not change by the end of the school year. Thus, the 2009-10 result is a two-year
result since it is assumed that the rates should be the same at the end of the 2010-11 year. The

27
author regressed the data with half years for the 2011 data (i.e., 1.5 years for 2009-10), but the
goodness of fit dropped. By rounding to the next highest integer year, the regression coefficient
was only moderate (r = -.65), however it was stronger than when half-years were used (r = -.55).
Additionally, the percentages of teachers who moved into administration and pupil personnel
services were added into the rates for each year since their movement resulted in a vacancy but
also filled a vacancy and was not representative of a net loss of staff in the school or district. The
regression analysis resulted in rates of 93%, 89.3%, and 79% for one-year, two-year, and five-
year time spans. According to Strong’s book (2009, p. 40), 77.6% of BTSA teachers were still
teaching after two years compared to only 46.3% on non-BTSA participants. Assuming a
constant attrition rate over those two years, this equates to one-year retention rates of 88.1% and
68% respectively. This represents a 62.8% reduction in attrition, which normalizes to a 94.4%
one year retention rate when compared to the national average.
California Mathematics Project Supporting Teachers to Increase Retention (CMP
STIR). The California Postsecondary Education Commission Improving Teacher Quality (ITQ)
grant funded CMP STIR with the goal of increasing the retention of teachers of mathematics in
the profession and within the school. Several state and national reports cite that neither the state
nor the nation has enough qualified mathematics and science teachers. “In fact, a report from the
California Commission on Teacher Credentialing (CCTC) shows that California's demand for
qualified STEM (Science, Technology, Engineering, and Mathematics) teachers exceeds the
supply by many thousands of teachers each year” (California Mathematics Project Supporting
Teachers to Increase Retention (CMP STIR), 2006). One solution was the California's Science-
Mathematics Initiative, which charged the University of California and California State
University with the training of 1,500 new STEM teachers annually. The ITQ Science and

28
Mathematics Teacher Retention Initiative (Winter, 2006) sought to increase STEM teacher
numbers by reducing new teacher attrition through the use of quality professional development
programs.
In the fall of 2006, CMP STIR awarded 10 out its 19 regional sites with grants to provide
a comprehensive induction program for new teachers or teachers in hard-to-staff schools. Each
CMP STIR site provided intensive professional development and sustained support for the
teachers at the school site (e.g., administrative support, mentoring and coaching, Lesson Study,
school site networking, data reflection, or access to resources). Each site had at least 27 teachers
per retention cohort in the first three project years. In 2010-11, the sites provided professional
development for 10 additional teachers while focusing on education advancement and/or
increasing the leadership roles of the retention cohort. In 2011-12, each site will provide another
10 teachers with professional development focusing on teacher retention. On March 22-24, 2012,
CMP STIR plans to hold the Mathematics Teacher Retention Symposium to address the teacher
retention issue on a national scale and to disseminate the findings of CMP STIR. The findings
from this study will be among those discussed.
According to data received directly from CMP STIR via email correspondence on
7/27/2011, new teacher retention rose after the implementation of the program. Before 2006, the
data showed yearly attrition at 20% consistently across 5 years and a five-year cumulative rate to
be about 54%. The three years of the study produced varying results, but the average attrition for
the first year was 14.9%, the second year was 9.3%, and the third year was 6.0% with a three-
year cumulative rate of 22.5%. The trend implies that the program is becoming more successful
as it adjusts each year, and if it continues at this pace, it could achieve a 100% retention rate
within the next few years. The program achieved an average yearly retention rate of 89.9% over

29
the first three years of the new program, which represents a 49.5% reduction in the attrition rate
prior to the implementation of the program. When compared to the national average, the
normalized yearly rate is 92.4%.
Connecticut Beginning Educator Support and Training (CT BEST). The BEST
program began in 1989 as a one-year program of mentoring and classroom-based observations
utilizing the Connecticut Competency Instrument. Soon, it transitioned to a two-year program of
school and state-based support requiring the completion of a content-specific portfolio in year
two, with a third year of support available if necessary. The central mission of BEST was to
ensure that a highly qualified and competent teacher teaches every Connecticut student. During
the first year, new teachers met periodically with an assigned mentor teacher and attended
regularly scheduled workshops and seminars throughout the year. The culminating activity of the
entire program was a portfolio project due at the end of the second year. A teacher had to receive
a passing score on the portfolio project in order to receive full certification.
To help teachers earn certification and remain in education, Connecticut kept a pool of
about 12 teachers-in-residence from various disciplines. Each teacher-in-residence took a two-
year leave of absence from their school district in order to work with the state's BEST program to
conduct seminars and workshops for new teachers, prepare manuals, and score portfolios. The
portfolios included documentation of between five and eight days of instruction in the same
class, examples of student work, videotapes of two lessons, and a self-analysis of the teacher's
performance. Each summer, teachers-in-residence at the Connecticut Department of Education
would evaluate more than 2,000 portfolios with approximately 85% receiving passing grades on
average. Only about 2% do not pass their second attempt at the end of the third year of teaching,
either by not submitting a portfolio or by not meeting the standard. Portfolios are graded on a

30
scale of one to four, with a two or higher being a passing score. Those who score below two may
resubmit a portfolio in their third year. If that portfolio also scores below two, they are no longer
candidates for certification and their contracts are not renewed. “Among the factors considered in
the portfolio assessment are teachers' abilities to plan and implement instruction, to evaluate
student learning and analyze their own teaching, to know their students, and to adapt instruction
for individual students” (Delisio, 2011, p. 1).
In May 2008, the Connecticut Legislature passed Public Act 08-107, which called for the
replacement of the BEST Program with a new beginning teacher program, effective July 1, 2009.
As a result, the program went through a transitional period beginning with the 2008-09 school
year. During the 2008-09 school year, teachers continued to submit portfolios but they were not
required to submit videos as part of their portfolio. As always, teachers-in-residence evaluated all
portfolios and provided feedback to each beginning teacher. In 2009, the Teacher Education and
Mentoring (TEAM) program replaced BEST. Where BEST was originally a state-based
assessment and certification program, the new TEAM program focused more heavily on guided
teacher support, coaching, and the completion of learning modules over the first two years of
teaching. “Both programs define clear linkages to teacher certification, but [TEAM] places
greater responsibility on districts to embed mentoring within a comprehensive system of teacher
evaluation and professional development, while maintaining the independence and
confidentiality of the mentor-beginning teacher relationship” (Connecticut State Department of
Education, 2008, p. 1). The major difference was a shift from a state-based program to a district-
based program. See (http://www.ctteam.org/ ?page_id=2) for more information on the new
TEAM program.

31
Data acquisition was difficult because the TEAM program already replaced the BEST
program. However, Barbara Canzonetti, an education consultant with the Connecticut State
Department of Education was able to provide detailed data on the 2005 cohort (N = 2826) of
teachers. According to the data 479 (16.9%) did not complete the BEST program and therefore
should not count towards total participants. Of the 2,347 teachers who did complete the program,
only 210 (8.9%) left after one year. Additionally, 1249 (53.2%) were still teaching in the same
school continuously for five years, and 1536 (65.4%) taught in the same district for five years.
Since this is a statewide program, districts do not need to replace Movers within a district, and
therefore Movers should not count as attrition from the program. Regression analysis resulted in
an approximated two-year rate of 84.1%, r = -0.9998. Interestingly, counting Returners as well
as those who moved out of state, results in 2105 (89.7%) teaching somewhere during the 2010-
11 school year when the national average is less than 50% over the same time span.
Flowing Wells Teacher Induction Program for Success (TIPS). The Flowing Wells
School District is a small suburban district in Tucson, Arizona. Over 50% of the students are
eligible for free or reduced-rate lunches, yet they still give education top priority with an
induction program that some experts believe to be the best that exists (Breaux & Wong, 2003).
The district began (TIPS) in 1985, and it has continued to receive national recognition and
awards. According to their website (2011), the Flowing Wells Induction Program emphasizes
five critical attributes that are the cornerstones of the vision:
Effective instructional practices
Effective classroom management procedures and routines
A sensitivity and understanding of the unique community we serve
Teaching is a reflection of lifelong learning and professional growth

32
Unity of teamwork among administration, teachers, support staff and community
members is essential
The program offers differentiated staff development matched to the level of teaching expertise
for all teachers new to the district. The TIPS program offers ongoing professional development
throughout the entire career of each teacher. “This is the way induction should be and it is one of
the main reasons that Flowing Wells is one of the most effective districts in the United States”
(Breaux & Wong, 2003, p. 86).The program begins with a four-day intensive training seminar
before school begins in August that focuses on classroom management and instructional
strategies. Four more days of induction occur in September, November, January, and March that
include on-site demonstration classrooms in instruction as well as an awards ceremony on the
last day.
Throughout the year, a staff development coordinator serves as a “mentor” and observes
each new teacher five times with the purpose of helping the new teachers to focus on their
strengths, weaknesses, and professional development. The instructional coordinators continue to
mentor the new teachers during their second year of teaching as well. The coordinators are
master teachers who receive stipends and release time to work with each teacher. Each mentor is
in the same grade level or subject of each new teacher, and they continue to emphasize
instructional strategies, professional skills, classroom management techniques, assessment
techniques, and policies and procedures. In the third and fourth years, the instructional
coordinators continue to observe and support the teachers by providing advanced training in
areas such as instructional strategies, cooperative learning, and higher-level thinking. This
ongoing staff professional development offers personalized training for each teacher along with
formative and summative observations and evaluations at each level of progression.

33
The success of the Flowing Wells program goes far beyond retention rate data. Countless
other districts have copied the program. In fact, the program is so popular that the Flowing Wells
district holds a two-day national induction-training seminar each year where educators learn how
to implement the program in their own schools. According to Breaux and Wong (2003), the
following outcomes are typical of the TIPS program or any other program using their model:
Reduced anxiety of first-year teachers
A higher-quality teaching force
A reduced attrition rate for new teachers
Increased student achievement
A common culture throughout the district
A common mission and set of goals
A common professional dialogue among teachers, staff, and the community
A willingness to participate in career-long staff development
The Flowing Wells website (2011) lists these program outcomes in their Induction & and
Mentoring Brochure:
One hundred percent of all new teachers to Flowing Wells attend the induction program
during their first year in the district.
Approximately 70% of all Flowing Wells teachers attend staff development training each
year on a voluntary basis.
Based on feedback from school principals, the quality of teaching performance has
improved significantly.

34
“Proficient” and “Expert” teachers design individual growth plans based on increased
awareness of teaching research and methodology. These teachers are the
Mentor/Instructional Coordinators that provide the new teacher support.
An increased ability for teachers to reflect on their instructional practices has promoted
professional dialogue among teachers, support staff, and community.
An attitude that “professional growth” is the norm for a Flowing Wells educator is
evidenced by participation in after school and summer workshops.
Both lists paint a picture of a highly effective induction program. Unfortunately, the only
available retention data does not support that claim on the surface. See Table 5 for a listing of the
cumulative retention rates for the last 11 years of the program. With retention rates ranging from
9% to 65%, it would seem that this program would not be considered effective at lowering
attrition rates. However, there are three key things to remember about these results. First, the
numbers represent only Stayers. Second, Arizona and particularly the Flowing Wells area
traditionally experienced attrition rates much higher than the national average. Third, and most
importantly, these are cumulative rates. Most programs count both Stayers and Movers while
providing yearly instead of cumulative rates because both practices result in the reporting of
larger retention rates.
Had Flowing Wells counted both Stayers and Movers, their numbers would be far more
impressive. Email correspondence from the current Director of Staff Development at Flowing
Wells, Dr. Kevin Stoltzfus, acknowledged that the rates did not seem impressive when compared
to other programs. However, Dr. Stoltzfus did confirm the theory that approximately two-thirds
of the “lost” teachers are Movers and not Leavers. Since this is a district-wide program, Movers
should not count towards attrition. Even with a more conservative guess of only half being

35
Movers (which is what the national data suggests); the rates are above national averages.
Regressing the original 11 years worth of data results in retention rates of (78.0, 67.4, and 43.6).
Using the data with half of the missing teachers added back as Movers resulted in retention rates
of (87.2, 83.9, 74.8), r = -0.86, which are all on par with other effective programs. Results cited
in the Breaux and Wong book (2003, p. 93) claim a yearly retention rate of 89%, which matches
the results obtained when adding back half of the lost teachers as Movers.
Another more accurate way to assess the impact of the induction program on retention is
to compare it to pre-program or control group data. There is no control group for most programs
(this one included); however, there is comparable statewide attrition rate data for districts
without induction programs. According to various sources, similar districts in Arizona typically
suffer from retention rates as low as 47%. Without adding back the “lost” Movers, Flowing
Wells still reduces attrition by 70.8%.
Instead of reporting the yearly retention rate for each of the 11 cohorts listed, Table 5
reports each cohort’s cumulative retention rate at the end of the 2010-11 school year. Another
conversion to aid with comparing program rates is to take the cumulative rates and convert to
yearly rates by assuming a constant yearly attrition rate. This does not mean that a 30% attrition
rate over three years equates to a 30/3 = 10% per year attrition. Cumulative rates are similar to
compound interest, so you have to solve for an exponential . This example
would yield a retention rate of 88.8% or roughly 89%. The third column in Table 5 “Estimated
yearly rate” lists each cumulative rate converted to a yearly rate assuming a constant yearly
attrition rate for each cohort. For the sake of comparisons, these estimates result in an average
yearly retention rate of 84.5%. Assuming a constant yearly attrition rate is a large assumption to
make, but it is the only way to compare cumulative rates to yearly rates. Because so many

36
programs report their statistics differently, it is impossible to accurately compare and rank
programs based upon their reported retention rates, but that is not the intension of this study.
Instead, this study strives to identify those programs that are effective based upon their results,
and the Flowing Wells program appears to be one of the oldest and most effective long-term
induction programs in the United States.
Glendale Union High School District. The GUHSD has nine comprehensive and two
alternative campuses serving over 15,000 students in Glendale and North Phoenix, Arizona. The
GUHSD developed a new induction program in 1991 that assigned one teacher in each of their
nine schools to mentor all new teachers in their building during their first three years of teaching.
The mentors would teach two classes per day and then be released from teaching for the other
three periods to support the new teachers in their school. They felt that keeping them in the
classroom would strengthen their bond with classroom teachers, and it allowed the teachers
union to support their positions as still being academic. Participation in the program is
mandatory for all new teachers, and experienced mentors train new mentors while they
themselves obtain ongoing staff development through the National Staff Development Council,
district curriculum coordinators, district administrators, and the New Teacher Center at the
University of California, Santa Cruz. “Mentors train each other, by sharing different areas of
expertise. They meet at the district office every Friday to support each other, plan together, and
train each other” (Villani, 2009, p. 42). According to Villani (2009, p. 40), the goals of the
program are to:
Accelerate good teacher decision-making in the classroom
Retain quality first, second, and third year teachers for a lifetime career in GUHSD
Provide support and improvement in instructional skills

37
Provide a solid grounding in the district learning system
Assist teachers in developing a collegial network for support
As with other successful programs, this one has similar goals and components that include some
sense of community and a support network along with experienced mentors that will likely lead
to higher retention levels of new teachers.
Since the implementation of the induction program in 1991, the retention rates in the
GUHSD have surpassed the national averages. However, the data available make it difficult to
determine the exact yearly rates, and some of the authors interpret the results in odd ways. Susan
Villani (2009, p. 37) claims the “retention of teachers hired between 2005 and 2008 averaged
79% in 2008,” which appears incorrect. GUHSD provided their retention rates as the percentage
of “teachers remaining in the district as of August 2008.” This means that the rate of 85% from
the 2007 cohort is a yearly rate, but the results from cohort years 2006 (70%) and 2005 (82%)
are both cumulative. Villani merely averaged the three percentages when reporting the 79%
statistic. In order to compare these two vastly different types of retention rate statistics and
compute an average yearly retention rate, one would have to assume a constant yearly rate of
attrition and convert the two cumulative rates into yearly rates. Assuming a constant yearly
attrition rate, the yearly retention rates are 94% and 84% respectively for cohort years 2005 and
2006. The average of these three yearly rates (which is also inappropriate since that assumes
equal cohort sizes for each year) is 88%. Recall that the national average is 85% for one year.
Table 4 reports the yearly and two-year rates from the data since they are reported rates rather
than extrapolated or computed rates. The five-year rate (63.4%, r = -0.70) came from the
regression of the three rates given. Even though 85% is the same as the national average, this
program can claim success when compared to the pre-program rate of 47%. This implies that the

38
induction program contributed to a 71.1% reduction in attrition, which normalizes to a 95.8%
yearly rate.
Islip New Teacher Induction Program (INTIP). The Islip School district, located on
Long Island, New York, created a three-year induction program in 1996. Prior to the beginning
of the school year, all probationary teachers are required to attend a three-day orientation
program facilitated by the Assistant Superintendent. It covers basic procedural information,
introductions, a bus tour of the area, and team building exercises. All probationary teachers are
also required to participate in monthly induction meetings facilitated by the Assistant
Superintendent. “Induction is theme oriented and defined as ongoing professional development
throughout the school year” (Lippman, 2003, p. 1). In order to build relationships and support
groups, each group of new teachers proceeds through their three-year tenure track program as a
cohort, and collaboration is continually encouraged.
The theme of the first year is classroom management techniques and interventions for
encouraging appropriate student behavior. They learn that discipline is a part of teaching, and
they learn ways of dealing with students who chose to misbehave. The Effective Teacher DVD
series and the book, The First Days of School, by Harry and Rosemary Wong are jumping off
points for discussions, while Linda Albert’s Cooperative Discipline is the focus of monthly
meetings. Other workshop topics include Parent Teacher Conferencing Strategies, and Open
School Night suggestions.
Year two teachers have a two-day orientation facilitated by the Assistant Superintendent.
The theme of the second year is instructional strategies. Both The Art and Science of Teaching
and Classroom Instruction that Works by Robert Marzano are part of year-two professional
development sessions that focus on instructional strategies. Sessions cover topics including

39
learning goals, assessment techniques, and the ability to monitor and adjust instruction. Teachers
define instructional strategies and team-building activities are included within their professional
learning-community to promote a sense of cohesion and belonging. The instructional strategies
foster student learning, growth, and achievement.
Year three teachers have a two -day orientation facilitated by the Assistant
Superintendent that focuses on differentiation and big picture ideas. The Differentiated
Classroom by Carol Ann Tomlinson and Understanding by Design by McTighe and Wiggins are
essential tools during this year while teachers design instruction for the needs of each student. In
the third year of the induction program, workshops on multiple intelligences, cooperative
learning, differentiated instruction, positive expectations and more offer teachers the opportunity
for continued professional growth. Each monthly meeting topic comes from the specific needs of
the cohort. Past workshops have included Cooperative Learning strategies, Multiple Learning
Styles, Stress Management, Time Management, Study Skill Techniques, and Self-Esteem for
Educators.
The induction process fosters a strong sense of community throughout. New staff
members receive the TIPS (Teacher Induction Program Stuff) newsletter three times each year
with information about teaching strategies, cooperative learning, district information, and a bio
highlighting a new teacher each issue. Similar to the CT BEST program, recommendation for
tenure is conditional upon successful completion of the three-year program that also includes a
required portfolio component. Each portfolio must include evidence of professional growth and
student exemplars. At the end of the year, after the Board of Education has approved tenure for
eligible teachers, a multi media celebration occurs. Members of the Board of Education,

40
administrators, and staff attend. Each newly tenured teacher is showcased and receives a copy of
the poster “That Noble Title Teacher” and each becomes a valued member of the Islip family.
Data obtained via email from the current Assistant Superintendent supports the claims in
the literature that Islip is an effective induction program. A New York City Council Investigation
Division report from 2004 (p. 2) cited attrition rates in New York City at 18% on average. Only
slightly higher than the national average, but still 42% higher than the weighted average attrition
rate of the Islip program over the last 10 years. The ability to lower attrition rates by 30% or
more each year over the last ten years is a substantial accomplishment. Assuming a constant rate
of attrition enables the computation of two year (76.2%) and five year (50.7%) retention rates
with simple exponential projection. These rates might not seem impressive on the surface, but
they are an improvement over the non-induction rates (67.2% and 37.1% respectively) in the
area.
Lafourche Parish Public Schools (FIRST) Program. Located in South Louisiana, the
Lafourche (pronounced la-FOOSH) Parish Public Schools serve about 15,000 students in 30
schools, with approximately 2,300 employees. The Lafourche Parish Public Schools instituted
the Framework for Inducting, Retaining, and Supporting Teachers (FIRST) program in 1996
with three simple goals:
Reducing the intensity of the transition into teaching
Improving teacher effectiveness
Increasing the retention rate of highly qualified teachers
Lafourche hires roughly 40 new teachers every August to fill positions in its 27 schools. The
FIRST program is three years long and consists of a highly structured four-day training session
in early August before school starts and a one-day induction review seminar in April where the

41
new teachers can share their experiences and receive additional training. Each school site pairs a
new teacher with a mentor teacher who can offer guidance and assistance during the first two
years of teaching. The mentoring component is state-funded, and mentors receive payment for
their services. They also receive three days of intensive training conducted by the curriculum
coordinators and they continue to receive ongoing training throughout their tenure. Each school
selects their mentor teachers for their excellence in teaching, and they consider the particular
needs, grade level, assignment, and classroom location of each new teacher when matching
mentors with new teachers. As with most effective programs, the mentor component is a large
part of the FIRST program's success.
The mentors conduct informal observations of the new teachers as a way to provide
specific, immediate, and nonthreatening feedback on their teaching skills. The mentors, district
curriculum coordinators, and site-based instructional facilitators all collaborate together with the
new teacher to develop individualized improvement plans based upon the new teachers' current
teaching skills. The instructional facilitators provide many of the necessary aspects of the
induction program that other programs relegate to their mentors, but the mentors in this program
have classrooms of their own and they cannot always provide immediate assistance and
feedback. The instructional facilitators receive training from the school system, and they “spend
their days in classrooms conducting demonstration lessons, observing and providing feedback,
assisting teachers in setting up classroom management plans, and lending their ears, shoulders,
and expertise to new teachers” (Breaux & Wong, 2003, p. 83). The facilitators attend monthly
support group meetings conducted by the district. Afterwards, they return to their schools and
host monthly meetings for the new teachers as well as providing ongoing training for their entire

42
staff. New teachers also attend monthly district-level group meetings where they can share their
experiences, voice concerns, and cooperatively seek solutions to problems.
The curriculum coordinators and instructional facilitators continue to work closely with
the new teachers during the second and third years of the induction process. The informal
classroom observations continue while second and third year teachers receive further training in
classroom management, authentic assessment, Louisiana components of effective teaching, high-
stakes testing, instructional strategies, positive discipline techniques, and instructional decision-
making during four half-day sessions. Participants receive stipends to attend the seminars where
they can pose questions, voice concerns, seek solutions to common classroom problems, and
share personal classroom experiences. The Prescriptive In-service Program is another means of
support for the new teachers where veteran teachers provide monthly in-service training for
participants while conducting ongoing, informal prescriptive observations with feedback. The
FIRST program provides new teachers with experienced mentors and other guides that provide
them with the things that most new teachers desire: a collaborative and supportive atmosphere, a
chance to observe good teaching practices and be observed with feedback, a support group of
other new teachers that provides a sense of community, and individualized, long-term
professional development.
Before the inception of the program, the Lafourche Parish school system typically
suffered from a 51% average annual attrition rate. They based their program on the highly
successful Flowing Wells School District Teacher Induction Program (TIPS), and their results
are even better than the TIPS program. Immediately after the implementation of the induction
program, the average attrition rate fell to 15%. The average retention rate over the first six years
of the induction program was 9%. That represents an 81.7% reduction in attrition and a

43
normalized yearly retention rate of 97.3%. Figure 4 shows the new teacher attrition rates in the
Lafourche Parish public schools from 1993 to 2002. Simple exponential projection provided the
two year (82.8%) and five year (62.4%) retention rates.
Montana Beginning Teacher Support Program (BTSP). The purpose of the pilot
program was to study the effects of mentoring first year teachers by looking closely at the
relationships between the mentors and mentees. The three-year study occurred from July 1992
through July 1995 with a model that “views the mentor as the most significant facilitator in the
new teacher's first year of growth…Because of mentoring, the speed and quality of beginning
teacher's professional development are hypothesized to be superior to that of 'sink or swim'
induction” (Spuhler & Zetler, 1995, p. 5). The study had the benefit of a control group for two of
the three years, but it had the deficit of very small sample sizes, which severely limits the ability
to generalize the results. Even though the results might not be statistically significant due to the
small sample sizes, there does seem to be noticeable differences between the attrition rates of
those who received mentoring and those who did not. Ten of the 11 original mentees (91%) were
still teaching after three years, which is far better than the national average of 66%. Their
average retention rate after one year (N = 35) was 94%, and it was 83% (N = 23) after two years
if you do not count the two mentees who were unemployed and looking for teaching work. In
fact, if you count those who were trying to find teaching work (N = 2) and those who went to
graduate school (N = 2), the program had a 100% retention rate for all three cohorts over the
entire three-year span. See Table 6 for a complete description of the retention rates. The results
reported in Table 4 only counted those who were still teaching in the same district as Stayers.
Those teaching in other districts or not teaching at all counted towards attrition. It seemed fair to
ignore those who were seeking employment because it was unclear why they were unemployed

44
and if they intended to return to the same district or not. Similarly, this study ignored those
attending graduate school because it was unclear why they chose to leave (i.e., did a bad
experience force them to make a change, or did their experience inspire them to make a change?)
With those individuals factored out of the numbers, 30 out of 33 mentees remained after one year
while only 14 out of 17 of the control group remained. After two years, 13 of 19 mentees
remained and six of nine control group teachers. There was no control group for the third year
stats, but seven of the 10 mentees remained in teaching after three years. Using these values, the
computed weighted averages for years one through three were 90.9%, 68.4%, and 70%
respectively. After regression, the year five rate was 50.6%. By looking at the control group’s
yearly retention rate of 82.4%, it was possible to calculate a 48.3% reduction in attrition rates for
the mentee groups. This translates to a normalized yearly rate of 92.2% when compared to the
national average.
Oconee County Teacher Induction Program (TIP). The Oconee County School
system, located in central Georgia, serves approximately 6,500 students in 10 schools. The TIP
program began in 2001 when first and second year teachers working in the district received
direct assistance from mentors and one induction specialist. The program now provides “support
services to beginning teachers and their mentors through many activities such as TIP Week,
model classrooms, demonstration classrooms, seminars, collaborative planning, and peer
observations” (Villani, 2009, p. 45). Like so many other programs, the goals of the Oconee TIP
program are to:
Develop quality teachers to increase student achievement
Increase the retention of promising beginning teachers
Transmit the culture of the school system to newly hired teachers
45
Provide support for inductees, their mentors, and the principals
New teachers attend a five-day program before school begins that includes model classrooms,
training on differentiated instruction, classroom management, and information on legal
mandates. Coaches conduct practice teacher evaluations to prepare new teachers for their formal
observations, and schools provide monthly seminars on important classroom issues. A classroom
management seminar occurs in October, and coaches visit classrooms regularly. Unlike other
programs, experienced teachers (two or more years) who are new to the district are not eligible
for this program.
Even though the program is limited to just those teachers new to the district with less than
two years of teaching experience, it still services approximately a dozen teachers annually. Like
so many other programs, the smaller group sizes and lack of control group makes it difficult to
generalize the retention rate results or attribute all of the success to the program. Regardless of
the limitations of the results, the retention rates are impressive. Over an eight-year span from
2001 to 2008, the program retained 99 of the 118 new hires (84%) in their district. Only four
teachers (3%) left teaching altogether. See Table 7 for a more detailed description of the TIP
program retention rates. Since the data were gathered in the middle of the 2007-08 school year,
they were regressed using half-year designations for each cohort. This resulted in rates of 96.3%,
89.7%, and 72.6% with r = -0.8539.
Rochester Career in Teaching Plan. The Rochester City School District, located
midway between Syracuse and Buffalo in Western New York, serves 32,000 students in 58
schools. The district created an induction plan in 1987 that they modeled after the Peer
Assistance and Review (PAR) program in Toledo, Ohio. The goals of the program are to:
Cultivate good teaching

46
Create the best possible teaching staff
Retain good quality teachers
They classify each new teacher as an “intern” on the Rochester City School District career level
chart, and they assign them a mentor. The mentor works closely with the intern throughout the
first year providing coaching and demonstration lessons. A major difference in this program is
the use of mentors as evaluators. Mentors observe the interns, write reports on their performance,
and ultimately make recommendations to the Career in Teaching (CIT) panel about their
continued employment. Most experts believe that evaluation should be separate from the mentors
in order to allow the mentors to bond more closely with their mentees and allow for open and
honest dialogue between them. “Districts like Rochester…have incorporated National Board
standards and processes, including teacher portfolios and peer coaching, as part of their teacher
evaluation systems. All these strategies help to create a coherent continuum of professional
learning based on common professional standards” (NCTAF, 1996, p. 74).
The program appears to have a positive impact on teacher retention rates. Prior to the
inception of the program in 1987, only 65% of new teachers remained in the district. The first
year after the program started, the retention rate dramatically increased to 91%. The average
retention rate has been 88% over the last 24 years. That size of an increase over that long of a
time span provides evidence to support the effectiveness of this program, and implies a 65.7%
reduction in attrition potentially attributed to the induction program. This equates to a retention
rate of 94.9% when normalized against the national average. A simple exponential projection
yields two and five year rates of 77.4% and 52.8% respectively. A similar program in Cincinnati
has a retention rate that is close to 95% annually. Since one of the program goals is to retain
good quality teachers, it is no surprise that Rochester now asks more probationary teachers

47
(roughly 8%) to leave. “The career steps—intern, resident, career teacher, and lead teacher—
provide supports for learning, evaluation based on professional standards, and salary incentives”
(NCTAF, 1996, p. 97). This type of PAR program links career and salary advancement to
performance, which has become more popular in the last decade.
South Texas School Districts. A study published in 2000 by Joseph Eberhard, Patricia
Reinhardt-Mondragon, and Bobbi Stottlemyer investigated the effects of mentoring on the
likelihood of retention of teachers in their first three years of teaching. They examined the
effectiveness of campus-based mentor programs as well as the availability of pre-service training
and university-based induction programs in Region 2 of South Texas, an area with historically
high attrition rates. Of the 42 school districts in Region 2, only 25 participated. Each school
received surveys to disseminate to any teacher with three or fewer years of experience. They did
not provide details on how many teachers fit this category, but 228 teachers returned the surveys
anonymously. The short 15-question survey asked participants for details on their demographics,
certification, career choices, and job satisfaction. Additionally, the survey asked if they had a
mentor teacher during induction and if so how much time they spent per week working with
them. Lastly, the participants had three response choices to the question “How long do you plan
to remain in teaching?” The researchers coded both the response “I definitely plan to leave
teaching as soon as I can” and the response “I will probably continue teaching unless something
better comes along” as an intention to leave teaching because they felt that if a respondent was
waiting for something better to come along, then they were likely to leave the teaching
profession. They coded “I plan to continue teaching” as the only response indicating an intention
to continue teaching.
48
The study found a positive relationship with mentoring programs, but the effects
diminished as the teachers' years of experience increased. Of the first-year teachers with a
mentor, 90% expressed an intention to continue teaching while only 61% of the first-year
teachers without a mentor expressed an intention to continue teaching. By the third year of
teaching, the responses were almost identical. Their results suggest that having a mentor helps
get teachers through the first two years of teaching, but after that, other factors may influence
their decisions to stay or leave. See Table 8 for the details on the effectiveness of the mentor
program broken down by years of teaching experience. Overall, 83% of all teachers having a
mentor program intended to continue teaching while only 66% of those without a mentor
program intended to stay. Additionally, if they met with their mentors for more than one hour per
week, their retention rate rose to 90%. See Table 9 for the details on the effects of hours spent
per week with their mentor. The researchers concluded that a critical component of the induction
program is the use of a mentor teacher. “The research indicates that mentors are important to
facilitating the integration of the new teacher into the school culture as well as developing coping
strategies in response to the stresses related to the problematic aspects of teaching” (Eberhard,
Reinhardt-Mondragon, & Stottlemyer, 2000, p. 37).
In order to calculate the retention rates for Table 4, the raw numbers of respondents in
Tables 8 and 9 on pages 49 and 50 of the Eberhard paper were used. According to the data, 113
of the 127 participants (89%) that had a mentor or model teacher planned to continue teaching
while only 41 of the 69 teachers (59.4%) who did not have mentors or model teachers stated that
they planned to continue teaching. After two years it was 47 out of 63 (74.6%) versus 28 out of
46 (60.9%), and for three years it was 53 of 72 (73.6%) versus 41 of 57 (71.9%).By comparison,
the new teachers with mentors or model teachers stated they planned to leave teaching 72.9%

49
less than those who did not have a mentor or model teacher. This would equate to a yearly
retention rate of 95.9% when compared to the national average.
Common Components of Effective Programs
A majority of the sources reviewed listed components of effective induction programs.
Some themes have emerged from the literature about which components may matter most or are
most common to include in induction programs. Of the 52 sources that recommended induction
components, all 52 suggested the use of experienced mentors, and most also explicitly stated that
the mentor should be in the same subject and/or grade level as the mentee. Sixty percent of the
sources suggested providing new teachers with common planning time with their mentor and/or
other new teachers. Sometimes, sources cited this theme more generally as “collaboration with
other teachers.” Another theme on most lists (58%) was sustained, structured, self-guided
professional development. Half of the sources listed support from the administration or principal.
Observing good teaching (23%) and being observed while teaching (22%) appeared separately in
lists, but not surprisingly in almost perfect pairs. Similarly, release time and reduced teaching
loads were paired up on many lists (31% and 29%, respectively). The nine most commonly listed
components with frequencies and percentages are in Table 10.
Knowledgeable Mentors in the Same Subject Area and/or Grade. The most common
theme among the literature was the use of an experienced mentor in the teacher's own subject
area or grade. All of the sources reviewed cited it as an essential characteristic in any effective
induction program. “Mentoring is the most common element of induction programs and has been
shown to be a major contributing factor in keeping new teachers in the profession” (Arnold-
Rogers et al., 2008, p. 19). Winstead Fry suggests “assign[ing] new teachers caring and capable
mentors who have a common planning period, and teach at the same grade level and content

50
area” (2007, p. 233). The Berry et al. report also suggests that an effective program should
“focus on [new teachers] learning alongside an experienced, trained mentor” (2008, p. 5). Not
every source stipulated that the mentor needed to be in the same subject area and grade level as
the mentee, but many mentioned it as being vital. Due to its perceived importance, the U.S.
Department of Education added new and expanded items starting on the 1999-2000 Schools and
Staffing Survey (SASS) asking if beginning teachers had a mentor, and whether the mentor was
in their same subject area or not. According to a study by Ingersoll and Kralik, “having a mentor
in the same field reduced the risk of leaving at the end of the first year by about 30%” (2004, p.
12). Having a mentor outside of their subject area only reduced the risk of leaving by 18%. Some
form of mentoring was present in every one of the effective programs listed in this study, and
they all indicated that having the mentor in the same subject area and/or grade level was a key
component. Additionally, most programs kept their mentees in rooms close to the mentors to
facilitate easy access and frequent visits.
Collaboration/Sense of Community. Collaboration with other teachers involved
activities like common planning times or meetings with colleagues to discuss lesson plans and
other classroom topics. A report by Berry et al. for the Aspen Institute and the Center for
Teacher Quality recommends that induction programs should “group candidates in cohorts to
cultivate a professional learning community and foster collaboration” (2008, p. 5). Winstead Fry
suggests, “assign[ing] new teachers to classrooms that keep them near their teaching teammates
to facilitate collaboration and support” (2007, p. 233). According to Smith and Ingersoll's
findings, collaboration had a strong impact on reducing attrition rates.
Having common planning time with other teachers in their subject area or participating in
regularly scheduled collaboration with other teachers on issues of instruction (Model 4)
51
reduced the risk of leaving, as opposed to staying, by about 43% (r = 0.572, p < 0.000)
and the risk of moving, as opposed to staying, by 25% (r = 0.749, p = 0.108). (2004, p.
703)
Even though the effect of moving was not significant at the 90% confidence level, it was quite
close. A similar characteristic that a number of sources listed was a sense of community or
making sure that the new teacher felt like they belonged. “A major role of the trainers is to
immerse the new teachers in the district’s culture and to unite them with everyone in the district
in order to form a cohesive, supportive instructional team” (Wong, 2001, p. 2). Morgan and
Kritsonis suggest, “new teachers should always be given a great amount of fanfare upon arrival
to a campus” (2008, p. 3). There was a strong correlation between collaboration and a sense of
community in Smith and Ingersoll's results, so this could make collaboration even more effective
than their initial statistics would indicate. Sixty percent of the sources cited collaboration as
being essential.
Individualized Professional Development. Fifty eight percent of the sources reviewed
agree that some form of regular professional development was helpful for new teachers and had
positive effects on reducing attrition rates.
What keeps good teachers teaching is structured, sustained, intensive professional
development programs that allow new teachers to observe others, to be observed by
others, and to be part of networks or study groups where all teachers share together, grow
together, and learn to respect each other’s work. (Wong, 2004, p. 52)
Most sources also agreed on an addendum that the teachers have some say in the content of the
seminars and classes. The teachers needed to feel in charge of their learning and they needed the

52
ability to tailor the subjects to areas that helped them most. Some of the more common topics
that new teachers expressed as ones they wanted in their professional development courses were:
• Teaching methods
• Curriculum content
• Classroom management
• Advice to students
• School policies
A report by (Smith & Ingersoll, 2004) found that having seminars or classes for beginning
teachers was associated with a small and statistically insignificant reduction in attrition. In
addition to mentoring and professional development, every effective program examined in this
study contained a strong commitment to collaboration and teamwork among its teachers.
Support from Principal/Administration. Half of the sources that listed induction
components suggested the need for strong support from the principal or administration. “More
than any other person in a school, the principal is the one who sets the tone of how easily or
difficult it is for novice teachers to be accepted into the school learning community” (Wood &
Stanulis, 2009, p. 12). Ingersoll and Kralik (2004, p. 12) found that new teachers who
experienced an induction package that included regular or supportive communication with their
principal or other administrators had a statistically lower probability of leaving the teaching
profession. “Beginning teachers reported that the principal is a key source of support and
guidance” (Brock & Grady, 1996, August, p. 14). New teachers often express a desire for more
support from their administrators in surveys, and numerous research studies have acknowledged
the importance of support from those supervising the new teachers.
53
Observations. Another major theme from the literature is the need for more
opportunities for new teachers to observe good teaching as well as being observed and evaluated
by others. “Mentors should be allowed time to observe the novice, [and] it is also beneficial to
arrange for the novice teacher to observe his or her mentor as well as other teachers throughout
the school” (Arnold-Rogers et al., 2008, p. 19). Hollander and Scharff found that “new teachers
at Hunter [College High School] want support, specifically, the opportunities to observe other
teachers and to be observed” (2002, p. 12). When new teachers responded to surveys about what
they desire most out of an induction program, a desire to observe and be observed was cited in
every survey found in the review of the literature. New teachers yearn for the opportunity to
watch mentors or other veteran teachers in a classroom presenting a lesson. Some programs even
have “demonstration rooms” specifically suited for this opportunity. These classrooms also allow
new teachers to present a lesson themselves while having the mentors or coaches evaluate their
performance and offer feedback and suggestions for improvement. Almost half (42-44%) of the
sources reviewed cited this characteristic.
Release Time/Reduced Teaching Load. Originally, this study evaluated these two
components independently of one another by keeping track of when each one was mentioned in
the literature. It turns out that the two ideas were listed concurrently in almost every one of the
sources that cited one of them, so it would appear that they are considered very similar in the
literature. As shown in Table 10, reduced teaching load was in 15 sources while release time was
in 16 sources with an overlap of 12 sources. Figure 3 presents the overlap between release time
and reduced teaching load in a Venn diagram. Seventy five percent of the release time sources
overlapped and 80% of the reduced teaching load sources overlapped. Overall, there were 19
distinct sources citing one or both of these components with 12 (63%) mentioning both

54
explicitly. Upon closer examination, four of the remaining seven sources had language broad
enough to imply the other characteristic as well. For instance, the following quote from Ganser
was coded as release time. “At a minimum, beginning teachers and mentors need time together,
both to be in one another’s classroom and to meet together. Being able to attend a professional
development activity or workshop together is also a plus” (1995, April, p. 4). However, a new
teacher with a reduced teaching load would also have more time to attend workshops and meet
with their mentor. Similarly, “time to participate in activities” was coded as release time, but one
could easily make the argument for reduced teaching load as well. After combining the two
components, there are 19 distinct citations in the 52 sources, which would keep it in 7th
place
with 37%.
Networking. Networking with outside sources had mixed results in Smith and Ingersoll's
study, and only 25% of the sources reviewed listed it as a necessary characteristic. According to
Smith and Ingersoll, it reduced the likelihood of leaving, but it increased the risk of moving.
They theorized that the teachers' exposure to people outside their school increases their chances
of hearing about other job opportunities, but moving is better than leaving since they are still
teaching. According to one study, “Participation in an external network of teachers (e.g., one
organized by an outside agency or over the Internet) reduced the likelihood of leaving by about
44%, at a statistically significant level” (Ingersoll & Kralik, 2004, p. 12). Examples of
networking included informal things like internet forums as well as more formal ideas like
seminars and university coursework.
According to Smith and Ingersoll (2004), the rest of the components in Table 10 were
either statistically insignificant in their effect on lowering attrition rates, or Ingersoll and Smith
failed to analyze them at all in their study. Those that Smith and Ingersoll did analyze showed

55
effects in the proper direction, and some were close to being significant at the 90% confidence
level. Since so many induction programs offer different combinations of these components,
Smith and Ingersoll analyzed combinations of components. The study found that the most cost-
effective combination was an experienced mentor in their subject area, common planning time
with their mentor, and collaboration with other teachers on topics of instruction. This simple set
of three items lowered the probability of leaving after the first year from 20% to 11.8%. A more
complex package of six components only lowered the predicted probability of leaving to 11.6%,
and the most comprehensive package of eight components lowered it to 7.1% (Smith &
Ingersoll, 2004). If a school district can afford to implement all nine of the components on my
list, it would likely reduce their attrition rate to around 7%, but it would be costly. By
comparison, implementing the simple set of three components should cut attrition rates almost in
half, and would cost almost nothing.
The Right Mentor is Key
Numerous studies have looked at the needs of new teachers, and although the needs of
teachers can vary greatly from person to person, some trends have emerged. Gratch (1998,
January) conducted a survey of beginning teachers and their mentor relationships, and
participants in this study cited problems and concerns commonly found in studies of this kind.
During the first two months of school, the teachers had concerns with classroom discipline and
management, getting sufficient materials, organizing the classroom, dealing with parents, daily
scheduling and planning, paperwork, motivating students, and meeting the needs of individual
students. Arnold-Rogers et al. states that “new teachers report concerns over grading procedures,
student behavior, lesson planning, isolation, time constraints, evaluation stresses, and
instructional strategies” (2008, p. 19). The list of concerns is lengthy, but the literature agrees on
56
one thing: most problems can be alleviated or lessened with an induction program that includes a
supportive and experienced mentor.
Researchers, administrators, policy makers, and teachers of all experience levels can
agree on the importance of supervised induction programs for new teachers. “Well-designed
induction programs can provide beginning teachers with support that helps them survive the
classroom management challenges, seemingly endless curriculum and instruction questions, and
feelings of isolation that contribute to the nationwide attrition problem” (Winstead Fry, 2007, p.
217). In a Metropolitan Life (1991) survey of teachers, when asked to reflect back on their first
year of teaching and determine what would have helped them most, 46% felt that a skilled,
experienced teacher assigned to provide advice and assistance would have been most helpful. A
similar question was in the MetLife Survey of the American Teacher, 2004-2005: Transitions and
the Role of Supportive Relationships. The survey asked teachers with five years or less
experience, which one of the three components (more practical training, assigning a more
experienced teacher as a mentor, or better training in working with students and families from
diverse ethnic backgrounds) would have helped them the most during their first year. The new
teachers ranked being assigned a more experienced teacher as a mentor (38%) the highest with
more practical training, such as a year’s internship (34%) a close second (Metropolitan Life,
2005). Administrators also believe in the power of mentoring. According to a 2006 Metropolitan
Life survey, 83% of education deans/chairpersons believe that assigning mentors to new teachers
is very important in fostering teachers who are satisfied with their careers. Administrators realize
that teachers are important resources for each other, and they realize this by how often new
teachers meet with mentors or experienced teachers to discuss issues. According to a 2008
57
MetLife survey, nearly two-thirds (63%) of teachers meet with a more experienced teacher at
least once a month to discuss classroom issues.
Effective induction programs that include mentoring can reduce feelings of isolation and
confusion for new teachers. Numerous studies have shown possible links between mentoring and
a reduction in attrition rates (AEE, 2005; Arends & Rigazio-DiGilio, 2000, July; Arnold-Rogers
et al., 2008; Berry et al., 2008; Breaux & Wong, 2003; Brock & Grady, 1996, August; CCTC,
1992; Colbert & Wolff, 1992; CSDE, 2008; Curran & Goldrick, 2002; Darling-Hammond (ed.),
1994; Davis & Field Waite, Fall, 2006; Eberhard et al., 2000; Ganser, 1995, April; Gratch, 1998,
January; Hollander & Scharff, 2002; Huling-Austin & Murphy, 1987, April; Ingersoll & Kralik,
2004; Kaiser, 2011; McNeil et al., 2006, November; Metropolitan Life, 1991, 2005, 2006, 2008;
NCTAF, 1996, 2007; Odell & Ferraro, 1992; Quinn & D-Amato Andrews, 2004; Smith &
Ingersoll, 2004; Smylie, 1994; Spuhler & Zetler, 1995; Strong, 2009; Villani, 2009; Wong, 2001,
2004; Wood & Stanulis, 2009). Ingersoll and Kralik conducted one of the most thorough reviews
of the literature on the effects of induction on retention rates. After looking at over 150 empirical
studies, they chose 10 that all had quantitative data, evaluations of effects based upon well-
defined and verifiable outcomes, and a comparison or control group. Even though the impact of
the induction and mentoring differed significantly among the 10 studies reviewed, they
concluded that “collectively the studies do provide empirical support for the claim that assistance
for new teachers and, in particular, mentoring programs have a positive impact on teachers and
their retention” (2004, p. 2). MetLife ran logistical regression on their 2006 survey data and
determined that having a mentor in the first year of teaching significantly increases the likelihood
that a teacher will remain in the profession. According to their data, 50% of the teachers who
planned to stay in teaching had a mentor during their first year, compared to only 29% of those

58
who planned to leave. Although it is difficult to control for so many other factors when analyzing
the effects of mentoring on retention, the research does support the claim that well-designed
induction programs that include a mentor in the same subject area or grade level contribute to
higher retention rates.
Many of the same researchers have found links between teachers who are mentored and
increases in teacher effectiveness in their early years (Darling-Hammond, Gendler, & Wise,
1990; Darling-Hammond (ed.), 1994; Davis & Field Waite, Fall, 2006; Huling-Austin (Ed.),
1989; Metropolitan Life, 2005, 2006, 2008; NCTAF, 1996, 2003, 2007; Smylie, 1994; U.S.
Department of Education, 1999; Wong, 2001, 2004). According to a report completed by the
NCTAF, “beginning teachers who receive mentoring focus on student learning much sooner;
they become more effective as teachers because they are learning from guided practice rather
than trial-and-error; and they leave teaching at much lower rates” (1996, p. 40). According to the
MetLife survey in 2006, 89% of teachers surveyed agreed that mentor teacher programs help to
improve the teaching skills of new teachers. Conversely, those who did not have mentors, or
those having ineffective mentors felt disadvantaged and unsupported. “I was not assigned a
mentor…I did not get any assistance from the other teachers at school. This made my first year
teaching very confusing, isolating, and exhausting” (Jenny C., Former Teacher, as cited in
Metropolitan Life, 2006, p. 38). A report by the U.S. Department of Education National Center
for Educational Statistics (1999) stated that 70% of teachers who were mentored at least once a
week reported that it improved their teaching “a lot.”
Since teacher effectiveness is determined to be an important predictor of student success,
and induction has been shown to help improve teaching practice, the need to continue the
59
education of novice teachers in the first years of teaching through comprehensive
induction programs is greater than ever. (Davis & Field Waite, Fall, 2006, p. 1)
Summary
The literature cites numerous different programs and program components as being
effective at lowering new teacher attrition rates. Some of these components are skilled mentors
with experience in the same subject and grade level as the new teacher, ongoing professional
development beyond the first year of teaching, collaborating with other teachers in the same
subject and grade level, a strong sense of support from the school administrators, and
opportunities to observe good teaching practices and in turn be observed teaching. A study by
Odell and Ferraro found mentoring to be the most common element of induction programs, and
their study made “plausible the suggestion that teacher mentoring can reduce the early attrition of
beginning teachers from the profession” (1992, p. 203).
The content, duration, and delivery of induction vary so much from one program to
another that it is not possible to make general conclusions about the impact of mentoring and
induction on new teacher retention rates from any given study. A majority of studies are program
evaluations that collected data on outcomes solely from those who had participated in the
particular programs being assessed (e.g., Arnold-Rogers et al., 2008; Berry et al., 2008; Breaux
& Wong, 2003; Brock & Grady, 1996, August; Cherubini, 2007; Colbert & Wolff, 1992; Davis
& Field Waite, Fall, 2006; Glassford & Salinitri, 2007; Huling-Austin & Murphy, 1987, April;
Odell & Ferraro, 1992; Quinn & D’Amato Andrews, 2004; Spuhler & Zetler, 1995; Strong,
2009; Villani, 2009; Winstead Fry, 2007; Wong, 2003, 2004). Such studies can provide valuable
feedback to both program designers and providers, but unless a study collects empirical data
from both participants and nonparticipants in a program, it cannot provide unambiguous

60
conclusions about the effectiveness (or ineffectiveness) of that induction program to lower new
teacher attrition rates.
“What is not needed, however, are more studies that do not involve the kind of careful
control that would allow unambiguous conclusions about the particular value added by the
program component being considered” (Ingersoll & Kralik, 2004, p. 15). Instead, this study will
utilize data from a representative national sample of nearly 2000 new public school teachers to
analyze the impacts of various induction program components when compared to those teachers
who did not have said induction components.

61
Chapter 3
Methodology
Introduction
In order to create a rich and multidimensional understanding of what makes a new
teacher induction program effective, this study first determined what components are common
among effective new teacher induction programs by looking at existing programs and their
success rates at reducing new teacher attrition (Tables 4 and 10). Research questions were
answered with a mixed methods design. Ridenour and Newman say, “One can mix methods to
address different components of the same study” (2004, October, p. 11). This will allow one
method to inform the other. A mixed methods design was appropriate because of the various
aspects (both qualitative and quantitative) of the various research questions answered. This type
of design allowed for analyses of the effects of various induction programs on teacher attrition
rates as well as the “perceived effectiveness” of various program components based upon the
opinions of the teachers and administrators. The data were both quantitative and qualitative in
nature.
IRB Approval
IRB approval for obtainment and usage of the National Center for Education Statistics'
Teacher Follow-Up Survey, Schools and Staffing Survey, and Beginning Teacher Longitudinal
Study datasets was obtained from both the University of Arkansas and NCES for use in this
study. After datasets were extracted and merged, all identifying details were removed in order to
protect the identities of all respondents.

62
Research Design
This study is an ex post facto quantitative study using data from various surveys
conducted by the NCES. According to Kirk (1995),
The term ex post facto study (after-the-fact study) refers to any nonexperimental research
strategy in which subjects are singled out because they have already been exposed to a
particular condition or because they exhibit a particular characteristic. In such studies, the
researcher does not manipulate the independent variable or assign the subjects to the
experimental conditions. (p. 9)
Since a third party organization (NCES) gathered the data, it was not possible to randomize
subjects nor was it possible to control for any of the independent variables. Nor did the
researcher have control over which teachers participated in induction programs and which did
not. In addition, there was no control over what components the induction programs contained or
how they were implemented. This overall lack of ability to manipulate the independent variables
is why this study is classified as an ex post facto research design.
Instrument
The data used to analyze the hypotheses came from three NCES databases. NCES is the
primary federal entity mandated by Congress to collect, collate, analyze, and report full and
complete statistics related to education in the United States. In the mid-1980's, NCES conducted
various surveys concerning schools and school personnel. The data used for analysis in this study
came from the 2007-08 Schools and Staffing Survey (SASS), the 2008-09 Teacher Follow-up
Survey (TFS), and the first three waves of the 2007-08 Beginning Teacher Longitudinal Study
(BTLS).

63
Schools and Staffing Survey (SASS). In order to fulfill an increasing need for studies
that would provide national data on public and private schools and their programs, teachers, and
staffing levels, the NCES began developing and administering a number of separate surveys
concerning schools and school personnel in 1983. In 1986, after identifying gaps in content and
design, they redesigned the SASS survey system to emphasize teacher demand and shortages
along with the components of the schools, administrators, and teachers. After the 1987–88
administration of SASS, the survey was conducted again in 1990–91, 1993–94, 1999– 2000,
2003–04, and 2007-08. “From its inception, SASS has had four core components: the School
Questionnaire, the Teacher Questionnaire, the Principal Questionnaire, and the School District
Questionnaire, which was known as the Teacher Demand and Shortage Questionnaire until the
1999–2000 SASS administration” (U.S. Department of Education, National Center for Education
Statistics, 2011b, p. 1). Respondents in public, private, and Bureau of Indian Education/tribal
schools receive these surveys. Public charter schools were added to the sample in 1999-2000. For
the 2003–04 and 2007–08 SASS, the public charter schools no longer received their own
separate surveys due to lack of funds. Instead, a sample of public charter schools is included in
the sample as part of the public school questionnaire (Tourkin, et al., 2010). In order to allow
researchers to investigate trends over time, many of the same survey questions are in each cross-
sectional cycle of the survey. “SASS is the largest, most extensive survey of K–12 school
districts, schools, teachers, and administrators in the United States today” (Graham, Parmer,
Chambers, Tourkin, & Lyter, 2011, p. 1). It provides valuable and extensive data on the
components and qualifications of teachers and principals, teacher hiring practices and
professional development, and other conditions in schools across the nation.

64
Teacher Follow-up Survey (TFS). The TFS is a database of follow-up survey questions
that provided further insight into induction program successes and failures. The purpose of the
TFS is to determine how many teachers stayed at the same school (Stayers), moved to another
school (Movers), or left the profession (Leavers) the year after each SASS administration. Thus,
the 2008-09 TFS was administered to a sample of teachers who completed the 2007-08 SASS.
The 2008-09 TFS is different from any previous TFS administration in that it also serves as the
second wave of the Beginning Teacher Longitudinal Study. Because of this, the 2008-09 TFS
consisted of two questionnaires for respondents who were first-year public school teachers in the
2007-08 SASS and two other questionnaires for the remainder of the sample. Stayers and
Movers receive the Current Teacher questionnaire with topics that include “teaching status and
assignments, ratings of various aspects of teaching, information on decisions to change schools,
and ratings of various strategies for retaining more teachers” (U.S. Department of Education,
National Center for Education Statistics, 2011c, p. 1). The Leavers receive the Former Teacher
questionnaire with topics that include “employment status, ratings of various aspects of teaching
and their current jobs, and information on decisions to leave teaching” (U.S. Department of
Education, National Center for Education Statistics, 2011c, p. 1). The major objectives of the
2008–09 TFS were to measure teacher attrition rates, examine the characteristics of Stayers,
Movers, Leavers and retirees, obtain activity or occupational data for Leavers, obtain reasons for
moving to a new school or leaving the K–12 teaching profession, and collect data on job
satisfaction (Graham et al., 2011).
Beginning Teacher Longitudinal Study (BTLS). The BTLS follows a cohort of
beginning public school teachers initially interviewed as part of the 2007-08 schools and staffing
65
survey. According to the NCES (Beginning Teacher Longitudinal Study (BTLS), 2011a)
website, the BTLS strives to answer questions such as:
Are beginning teachers who received formal mentoring from their school or district less
likely to leave the profession or change schools in the first few years of their teaching
career?
Why do teachers leave the teaching profession and which factors have a greater
importance at various stages in teachers' careers and lives?
Data were collected in the 2007–08, 2008–09, and 2009–10 school years and were released as
the BTLS First through Third Wave Preliminary Data File. The BTLS is expected to continue for
at least five waves. The first wave of BTLS data came from select questions in the 2007–08
SASS, which began in August 2007 and ended in June 2008. The approximately 1,990
(unweighted) first-year public school teachers who completed the 2007–08 SASS comprise the
cohort being followed in the BTLS. Data for the second wave was gathered from the 2008–09
TFS, which began in February 2009 and ended in August 2009. Data collection for the third
wave began in January 2010 and ended in June 2010. “Although each collection contained a
telephone follow-up, the information was collected primarily through a mailed paper
questionnaire for the first wave and a web instrument for the second and third waves” (Kaiser,
2011, p. 1).
Sampling Frames and Sample Selection
Other than basic descriptive statistics, all of the data used for this study came from the
BTLS database. Teachers sampled for the BTLS are part of the SASS teacher sample, which is
based on the SASS school sample. Because SASS and BTLS are so interrelated, it is logical to
describe the sampling frames and sample selection of both SASS and BTLS.

66
SASS Public Schools. The 2007–08 SASS public school frame was based upon the
preliminary 2005–06 Common Core of Data (CCD) Nonfiscal School Universe Data File. The
CCD includes standard and non-standard schools (special education, alternative, vocational, or
technical), public charter schools, and Bureau of Indian Education (BIE) schools. Due to
concerns over loss of anonymity due to their small sample size, teachers from BIE schools were
not included in the BTLS. In order to fit the definition of a school that was eligible for SASS, the
sampling frame was adjusted from the CCD. For SASS, a school was defined as an institution, or
part of an institution, that provides classroom instruction to students; has one or more teachers to
provide instruction; serves students in one or more of grades 1–12 or the ungraded equivalent;
and is located in one or more buildings apart from a private home (Kaiser, 2011). The SASS
public school sampling frame consisted of 90,410 traditional public schools and 3,850 public
charter schools.
The SASS sample is a stratified probability proportionate to size (PPS) sample. All
schools underwent multiple levels of stratification so that national, regional, and state-level
elementary and secondary school estimates and national-level combined public school estimates
could be made. The sample was allocated to each state by school type (traditional public, public
charter, BIE-funded, and schools with high–American Indian enrollment) and grade range
(elementary, secondary, and combined). For a full description of the allocation procedure, see
Tourkin et al. (2010). NCES used a PPS algorithm to systematically select schools within each
stratum. The square root of the number of full-time-equivalent teachers reported or imputed for
each school during the sampling frame creation was used for the measure of size for the schools.
Schools with an unusually high number of teachers relative to other schools in the same stratum
were automatically included in the sample. The school with the highest probability of selection

67
was included in the sample by default whenever the sum of the probabilities of schools within a
school district and grade level did not guarantee a sampled school for that school district. This
guaranteed that all school districts would have at least one school in the sample. This produced a
public school sample of 9,810 schools in the 2007–08 SASS (450 American Indian enrollment
schools, 370 public charter schools, 20 career technical centers, and 8,970 other traditional
public schools) (Kaiser, 2011).
SASS Teachers. SASS defines teachers as any staff member who teaches regularly
scheduled classes to students in any of the grades K–12. The Census Bureau collected and
compiled teacher rosters (i.e., Teacher Listing Forms) from sampled schools, primarily by mail,
on an ongoing basis throughout the roster collection period. Along with the names of teachers,
respondents at the sampled schools provided information about each teacher’s teaching
experience (1–3 years, 4–19 years, and 20 or more years), teaching status (full or part time), and
subject matter taught (special education, general elementary, math, science, English/language
arts, social studies, vocational/technical, or other), as well as whether the teacher planned to be
teaching at the same school in the following year (Kaiser, 2011). This information was also
gathered on an ongoing basis throughout the roster collection period.
Schools were first allocated an overall number of teachers to be selected within each
school stratum. The Census Bureau then stratified teachers into five teacher types within
each sampled school: (1) new teachers expected to stay at their current school, (2) mid-
career and highly experienced teachers expected to stay at their current school, (3) new
teachers expected to leave their current school, (4) mid-career teachers expected to leave
their current school, and (5) highly experienced teachers expected to leave their current
school. (Kaiser, 2011, p. B4)

68
Sampling rates for teachers varied among the strata listed above, with all teachers in categories
3–5 oversampled at different rates. To avoid overburdening a school by sampling too large a
proportion of its teachers, the maximum number of teachers per school was set at 20. About 13
percent of the eligible public schools did not provide teacher lists. No teachers were selected
from the roughly 13% of eligible public schools that did not provide teacher lists. Teachers were
selected systematically with equal probability within each teacher stratum in each school.
BTLS Teachers. All teachers from traditional public or public charter schools who
reported their first year of teaching as being 2007 or 2008 on the SASS Teacher Questionnaire
were included in the BTLS sample. The sample initially included about 2,100 teachers (rounded
and unweighted). The sample was reduced to N = 1992 after subsequent survey responses
indicated that some teachers were mistakenly categorized as new teachers.
Data Collection Procedures
The first wave of the BTLS data came from the 2007–08 SASS data for teachers who
began teaching in 2007 or 2008. The first wave of data collection came primarily from mail-
based questionnaires with telephone and field follow-ups used for nonrespondents. The Census
Bureau attempted to establish a survey coordinator at each school. “The 2007–08 SASS included
several questionnaire components, which collected data from schools, school districts, principals,
library media centers (public and BIE-funded schools only), and teachers” (Kaiser, 2011, p. B5).
The SASS teacher data collection began in August 2007 and ended in June 2008. For complete
details regarding the SASS, refer to Tourkin et al. (2010).
During the 2008-09 school year, the Census Bureau conducted the second wave of BTLS
together with the TFS. The BTLS teachers used the longitudinal versions (TFS-2L and TFS-3L)
of the questionnaires, which contained more questions than the standard TFS questionnaires. The
69
second wave data primarily came from an internet instrument with paper questionnaires mailed
out upon request. During the second wave data collection, it was discovered that 101 teachers
mistakenly reported their first year of teaching as 2007–08 when they had actually begun
teaching earlier than that. These cases were removed from the BTLS sample. Telephone follow-
ups resolved the cases with this discrepancy, collected any missing data, and encouraged
participation or collected data from nonrespondents. Paper questionnaires were mailed in June
2009 to all teachers having not yet completed the survey. The TFS data collection began in
February 2009 and ended in August 2009. For more details regarding the TFS, refer to Graham
et al. (2011).
The Census Bureau conducted the third wave of the BTLS during the 2009–10 school
year. Current teachers (Stayers, Movers, and Returners) and former teachers (Leavers) all
responded to the same internet questionnaire for the third wave of BTLS data collection. Skip
patterns built into the internet instrument determined both their current/former and
Stayer/Mover/Leaver/Returner statuses. Telephone follow-up efforts encouraged participation or
collected BTLS data from nonrespondents. The Census Bureau later removed five additional
cases after they determined the five cases had been misclassified as beginning teachers.
Ultimately, the BTLS sample included 1,992 teachers (unweighted). The data collection period
for the third wave began in January 2010 and ended in June 2010. All BTLS questionnaires are
available on the BTLS website: (http://nces.ed.gov/surveys/btls/). For more details on data
collection for the BTLS, refer to Tourkin et al. (forthcoming).
Data Processing and Imputation
The BTLS first wave data came from the Teacher Questionnaire (Form SASS-4A) during
the 2007–08 SASS. The census Bureau captured the data from the completed questionnaires after
70
the completion of the BTLS first wave data collection. All BTLS first wave data processing
occurred within the single SASS Teacher Questionnaire Data File. “The Census Bureau applied a
series of computer edits to identify and fix inconsistencies and impute items that were still ‘not
answered’ after taking into account item responses that were blank due to a questionnaire skip
pattern” (Kaiser, 2011, p. B6). The Census Bureau created the BTLS First Wave Data File after
the data underwent all stages of computer edits, imputation, and review.
Once the Census Bureau completed the second wave of the BTLS data collection, they
electronically captured the data from completed paper questionnaires and combined them with
data from the internet instrument. They conducted the data processing separately within each of
the nine separate SASS questionnaires. Even though the SASS collected data from private, BIE
and nonstandard school, the BTLS includes only teachers who taught in a public school
(traditional or charter) in the 2007–08 school year; therefore, the only SASS questionnaire type
of interest here is the Teacher Questionnaire. The census Bureau ran a series of computer edits
on the data to “identify and correct inconsistencies, delete extraneous entries in situations where
skip patterns were not followed correctly, or assign the ‘not answered’ code to items that should
have been answered but were not” (Kaiser, 2011, p. B6). A final interview status code was then
assigned to each case. Once the Census Bureau analysts reviewed all the data, they assigned a
final interview status code to each case and created the edited BTLS Second Wave Data File in
preparation for the next stage of data processing and imputation. For further details about the
TFS, refer to Graham et al. (2011).
The Census Bureau processed the third wave of the BTLS data from completed internet
instruments separately within each survey respondent type. A series of computer edits identified
and corrected inconsistencies and deleted extraneous entries in situations where skip patterns

71
were not followed correctly or assigned the “not answered” code to items that should have been
answered but were not. The Census Bureau created the edited BTLS Third Wave Data File in
preparation for the next stage of data processing and imputation after it reviewed all of the data.
The Census Bureau retrospectively added any missing data into the second wave data file
whenever possible. “As a result, these retrospective respondents represent 8.1% of the weighted
total of 2008–09 current teachers (11.3% of the Movers) and 8.6% of the weighted total of 2008–
09 former teachers” (Kaiser, 2011, p. B7).
Once processing of the three waves was complete, the data from the first, second, and
third waves of BTLS were put in one data file called the BTLS First Through Third Wave
Preliminary Data File. This allowed for a cross-wave imputation as a final stage of data
processing. Only a select set of items were imputed because they were identified as key or
important for reporting or analysis. All other items are subject to missing data.
The imputed data for selected items were removed from the first wave and then re-
imputed on the basis of the case’s responses to items from subsequent waves of the
BTLS, whenever possible. If data were not available from subsequent waves, then the
existing imputed value remained. For further details about the SASS, refer to Tourkin et
al. (2010). Several variables in each BTLS wave were identified as “key variables,” or
important reporting or analytical variables, and were imputed (or re-imputed, in the case
of the BTLS First Wave data) once the edited BTLS Second and Third Wave Data Files
were created and fully reviewed. (Kaiser, 2011, p. B7)
The Census Bureau used two main approaches to fill “not answered” items with data during the
imputation stage of processing on all three waves of the BTLS data. In one approach, called
72
“cross-wave imputation,” they imputed data from the same case from either the preceding or the
subsequent BTLS wave whenever possible.
The second method of imputation is known as “weighted sequential hot deck
imputation,” during which data were imputed using items from other cases that had
certain predetermined characteristics in common, while also keeping the means and
distributions of the full set of data, including imputed values, consistent with those of the
unimputed respondent data. Weighted sequential hot deck imputation was used for only
the BTLS second and third wave data. (Kaiser, 2011, p. B7)
After the Census Bureau completed the imputation of the key variables, they combined the data
from the three waves into one three-wave BTLS file for release. The data file is considered
preliminary because they will weight it again after the data collection of the fourth wave is
complete. For more details regarding data processing for BTLS, refer to Tourkin et al.
(forthcoming).
Response Rates
Unit Response Rate. The unit response rate is defined as the rate at which the sampled
units responded, and it can be calculated as unweighted or weighted. It was not known if a
teacher was a first-year teacher prior to the collection of the SASS teacher data, only whether
each teacher reported having 1 to 3 years of experience, 4 to 19 years, or 20 or more years of
teaching experience. The response rates presented in this section represent those of the 2007–08
SASS public school teachers who reported having 1 to 3 years of experience, not just the first-
year teachers included in the BTLS.
The unweighted response rates are the number of 2007–08 SASS public school teachers
reported to have 1 to 3 years of experience who substantially completed the questionnaire

73
divided by the number of eligible (in-scope) sampled units, which include respondents
plus nonrespondents but excludes ineligible (out-of-scope) units. The weighted response
rates are the base-weighted number of cases that substantially completed the
questionnaire divided by the base-weighted number of eligible cases. The base weight for
each sampled unit is the initial basic weight multiplied by the sampling adjustment factor
(Kaiser, 2011, p. B8).
Overall Response Rate. The overall response rate is the response rate to the survey after
taking into consideration each stage of data collection. A teacher was eligible for the SASS only
if the school completed the Teacher Listing Form during the 2007–08 SASS data collection. This
form provided a sampling frame for teachers at that school.
The overall response rate for the BTLS first wave is the product of the survey response
rates: (SASS Teacher Listing Form response rate) x (SASS public school teachers with 1
to 3 years of experience response rate). The overall response rate(s) for the second and
third waves are the product of three factors: (SASS Teacher Listing Form response rate) x
(SASS public school teachers with 1 to 3 years of experience response rate) x (BTLS
wave response rate). (Kaiser, 2011, p. B8)
Table 11 summarizes the unweighted and base-weighted unit response and overall response rates
for the BTLS.
Unit Nonresponse Bias Analysis. The NCES analyzes the unit nonresponse bias for any
survey stage with a base-weighted response rate of less than 85%. Even though the BTLS
achieved or almost achieved an 85% base-weighted response rate in all stages, the NCES
evaluated all waves of BTLS data files for potential bias. In order to evaluate the extent to which
the adjustments reduced or eliminated nonresponse bias, comparisons between the eligible

74
respondents (respondents plus non-respondents) and the respondents were made before and after
the NCES applied the noninterview weighting adjustments. For a complete description of how
the NCES estimated the relative bias for respondents and nonrespondents, refer to (Kaiser,
2011).
Item Response Rates. Item response rates are the percentage of participants who
answered a given survey question or item. Weighted item response rates are the number of
sampled cases responding to an item divided by the number of sampled cases eligible to answer
the item after adjusting by either the base or final weight. Each sampled unit’s base weight is
computed by multiplying the initial basic weight by the sampling adjustment factor. The final
weight for each sampled unit is the base weight adjusted for unit nonresponse and then ratio
adjusted to the frame total. Table 12 shows the base weighted and final weighted item response
rates for BTLS public school teachers in the first, second, and third waves. The nonresponse bias
analysis revealed no substantial evidence of item bias in the data files at the item level. For
further information on the nonresponse bias analysis and item response rates for BTLS, see
(Kaiser, 2011).
Weighting
Data weighting is done to scale up sample estimates to values that represent the target
survey population. Since all interviewed beginning teachers in SASS were eligible for BTLS,
weights for the BTLS first wave came directly from the 2007–08 SASS. TFNLWGT is the final
weight variable for the first wave in SASS. It is called W1TFNLWGT in the BTLS data set. An
initial basic weight (the inverse of the sampled teacher’s probability of selection) is used as the
starting point for the second and third waves of BTLS, and a weighting adjustment that reflects
the impact of the SASS teacher weighting procedure is applied. Using data that are known about
75
the respondents and nonrespondents from the sampling frame, a nonresponse adjustment factor is
calculated and applied next. Lastly, a ratio adjustment factor (which adjusts the sample totals to
frame totals in order to reduce sampling variability) is calculated and applied. The final cross-
sectional weights for the second and third waves of BTLS are the product of the factors listed
above, and they appear in the data file as W2AFWT (applies to second wave respondents) and
W2RAFWT (applies to respondents and retrospective respondents) for the second wave, and
W3AFWT for the third wave. W3LWGT is provided for longitudinal analysis over the 3-year
collection period. Longitudinal weights should be used whenever more than one wave of data is
used to examine change over time within a single population. For further information on
weighting, see Tourkin et al. (forthcoming).
Variance Estimation
Direct estimates of sampling errors that assume a simple random sample will typically
underestimate the variability in the estimates in surveys with complex sampling designs like
SASS and BTLS. “The SASS sample design and estimation include procedures that deviate from
the assumption of simple random sampling, such as stratifying the school sample, oversampling
new teachers, and sampling with differential probabilities” (Kaiser, 2011, p. B14). Therefore,
users must employ more advanced calculations to estimate the variance accurately in the SASS
and BTLS samples.
One such method of calculating sampling errors is replication. There are several ways to
create replicate weights, but they are all based on a similar underlying logic. The sample is
divided up into numerous subsamples (replicates), and the estimate of interest is calculated from
both the full sample and from each replicate. The mean square error of the replicate estimates
around the full sample estimate provides an estimate of the variance of the statistic.

76
The BTLS data file includes one set of 88 replicate weights for each cross-sectional and
longitudinal weight designed to produce variance estimates. The replicate weights for
cross-sectional analysis are W1TREPWT1–W1TREPWT88 for the first wave,
W2ARWT1–W2ARWT88 and W2RARWT1–W2RARWT88 (includes retrospective
respondents) for the second wave, and W3ARWT1–W3ARWT88 for the third wave. For
longitudinal analysis over the 3-year collection period, the replicate weights are
W3LRWGT1–W3LRWGT88. (Kaiser, 2011, p. B15)
Reliability of Data
The BTLS First Through Third Wave Preliminary Data File is considered a preliminary
data file for two reasons. First, due to the ongoing data collection, data are retroactively added
whenever subsequent waves can provide previously missing, imputed, or inaccurately recorded
data. Thus, data collected in the next wave may lead to changes in any of the previously
collected waves. Second, NCES computed first wave weights before learning that seven
members of the sample did not meet the definition of a beginning teacher. New information
obtained during third wave processing revealed that five of them did not start teaching in 2007 or
2008, and two were not teachers of regularly scheduled classes. Therefore, these cases
(representing 0.27% of the first wave weighted population) were removed. NCES is waiting until
the release of the next preliminary data set in 2012 to reweight the subsequent waves. The 2012
release will also include data from the fourth wave, and the final dataset due out in 2013 will
include the fifth wave. The final dataset will replace all other preliminary datasets and will be
accompanied by expanded documentation. For more information about the data collection and
processing, please see Tourkin et al. (forthcoming).
77
BTLS estimates are based on samples, and samples always have the possibility of
differing substantially from the population being examined. Differences in the sample may occur
whenever there are errors. Sample errors occur whenever the sample does not accurately
represent the population. Nonsampling errors are caused by human errors such as, data entry
errors, biased questions or processing, inappropriate analysis conclusions and false information
provided by respondents. It is possible to estimate sampling errors, but not nonsampling errors.
NCES utilized quality control and edit procedures in order to minimize errors made by
respondents, coders, and interviewers.
Description of Variables
Appendix A lists all of the variables used in this report. Except for those variables created by
the researcher, each variable originated in the Beginning Teacher Longitudinal Study (BTLS)
Questionnaire, the 2007−08 Schools and Staffing Survey (SASS) Teacher Questionnaire, or the
2008−09 Teacher Follow-up Survey (TFS) Current and Former Questionnaires for First-Year
Teachers. Additionally, this report includes “created variables” computed using survey variables,
sampling frame variables, other NCES created variables, or a combination of these. In order to
facilitate easier analysis of some of the more commonly used variables, NCES provides some created
variables in their datasets. Unless otherwise noted, all variables in Appendix A can be found in the
BTLS First Through Third Wave Preliminary Data File. The definitions for all BTLS variables used
in this report are also included in Appendix A.
Research Questions
In order to test the hypotheses that induction programs and specific components of
induction programs will be associated with higher retention rates of newly hired teachers, the
following research questions were investigated. There are four main questions, three of which
containing sub questions. Research Question 1 investigates the components of effective new

78
teacher induction programs, while Research Question 2 analyzes the impact of various induction
program components on new teacher attrition rates. Research Question 3 analyzes the impact of
various mentoring components of induction on new teacher attrition rates, while Research
Question 4 uses a statistical model to predict the likelihood of retaining new teachers in the
profession based on selected induction components.
Research Question 1: What are Essential Components of Effective New Teacher Induction
Programs?
Research Question 1 required a review of the literature to identify studies citing effective
induction programs and/or effective aspects of such programs. The search began on the internet
with online databases such as JSTOR and ERIC with phrases like, “new teacher induction” and
“new teacher mentoring.” After limiting the search to sources published after 1980, there were
nearly 2000 results. After further limiting of the search results to peer-reviewed sources and
using quick scans of titles and abstracts, there were approximately 100 sources for initial review.
During the review process, sources that were identified in multiple sources (either within the text
or within the references) were added to the list or given precedence in the review process.
Approximately 250 sources were reviewed.
Research Question 1a: What are the Teacher Induction Components Cited in the
Literature as being Effective? During the review of the literature, any mention of components
of effective programs or lists of recommended traits were recorded and tallied. While several
studies looked at specific programs to determine what they were doing correctly, other sources
offered opinions of what they felt were effective components. Initially, components were
collected with no pre-determined themes in an effort to minimize biased interpretations. The
researcher continued to record components in their original text until it came time to collate and

79
tabulate the results. At that point, themes were created for descriptions that were similar enough
in wording to be grouped. For instance, “A structure for modeling effective teaching during in-
services and mentoring” as suggested by Wong (2001, p. 2) was coded into the opportunities to
“observe” theme. Likewise, Morgan and Kritsonis’ suggestion that “the principal must set aside
time regularly (weekly is ideal) to debrief and interact with new teachers” (2008, p. 5) was coded
into the “supportive administration” theme.
Research Question 1b: How do Induction Program Retention Rates Compare?
During the review of the literature, the researcher kept track of any programs listed as examples
of effective induction programs as well as their frequency of mention. Even sources intended to
study a specific program often listed examples of other well-known effective induction programs
as examples or comparisons. Ultimately, the review of the literature resulted in roughly 50
distinct programs cited as being effective programs with nearly two-dozen listed by more than
one author in more than one source. Of the programs cited as effective, retention rate data was
gathered from 22 distinct programs.
Research Question 1c: Do Induction Programs Identified as Being Effective Include
the Induction Program Components Most Often Cited in the Literature? This search began
with the compilation of the approximately 50 programs found during the research for question
two. Some citations such as “a successful program in Illinois” or a “South Texas Induction
program” were too vague to investigate further. Programs that were cited by name (27) and those
that could be inferred by their descriptions (4) comprised the final list of effective programs to
investigate. Whenever possible, descriptions of the programs came directly from the source
(either via their website or via email correspondence with directors and administrators). If direct
descriptions were not available, this study utilized secondary sources such as the descriptions

80
offered in the source citing it as being effective. In these instances, the researcher always
endeavored to find corroboration with a separate source from another author. A simple check to
see if the list of components collated from the effective programs in research question three
matched up with the consensus given by the literature and collected in research question one.
Research Question 2. Does Participation in a Teacher Induction Program and Associated
Program Components (e.g., Seminars and Common Planning Time) Correlate with Higher
Teacher Retention Rates for a National Sample of Teachers?
Based upon survey responses, NCES created variables W2STTUS and W3STTUS to
classify teacher’s employment status in years two and three. W2STTUS classifies teachers into
the three categories of Leaver, Stayer, and Mover, while W3STTUS also includes the fourth
category of Returner. Since work with teacher status is so prevalent, NCES also created the
variables W2FCSTS and W3FCSTS to collapse each of the multi-category employment status
variables into the two categories of “former” and “current,” and included them in the BTLS data
set to make analyses easier. W2STTUS and W3STTUS were the criterion variables for the
various chi-square tests of association for this research question, while W2FCSTS and
W3FCSTS were the criterion variables for the logistical regression analysis in Research Question
4. Any analysis of the wave-two status variables (W2FCSTS and W2STTUS) involved
weighting with the W2RAFWT variable, while the wave-three variables (W3FCSTS and
W3STTUS) used W3AFWT as a weight. NCES calculated all weights and included them with
the datasets.
Research Question 2a: Does Participation in a New Teacher Induction Program
Correlate with Higher Retention Rates? The predictor variable for this question was
W1T0220 (In your FIRST year of teaching, did you participate in a teacher induction program?).

81
Respondents answered this question as part of the 2007-08 Schools and Staffing Survey (item
38), and only those responses from teachers who began their teaching careers in 2007 were
included in the BTLS dataset. Both status variables (W2STTUS and W3STTUS) were used as
the criterion variables when determining whether participation in a new teacher induction
program correlates with new teacher attrition rates.
Research Question 2b: Do Induction Programs that Provide New Teachers with
Reduced Teaching Schedules or Fewer Preparations Correlate with Higher Retention
Rates? The predictor variable for this question was W1T0221 (In your FIRST year of teaching,
did you receive a reduced teaching schedule or number of preparations?). Respondents answered
this question as part of the 2007-08 Schools and Staffing Survey (item 39a), and only those
responses from teachers who began their teaching careers in 2007 were included in the BTLS
dataset. Both status variables (W2STTUS and W3STTUS) were used as the criterion variables
when determining whether receiving a reduced teaching schedule or number of preparations
correlates with new teacher attrition rates.
Research Question 2c: Do Induction Programs that Provide New Teachers with
Common Planning Time with Teachers in Their Same Subject Correlate with Higher
Retention Rates? The predictor variable for this question was W1T0222 (In your FIRST year of
teaching, did you receive common planning time with teachers in your subject?). Respondents
answered this question as part of the 2007-08 Schools and Staffing Survey (item 39b), and only
those responses from teachers who began their teaching careers in 2007 were included in the
BTLS dataset. Both status variables (W2STTUS and W3STTUS) were used as the criterion
variables when determining whether receiving common planning time with teachers in your
subject correlates with new teacher attrition rates.

82
Research Question 2d: Do Induction Programs that Provide New Teachers with
Ongoing Seminars and Professional Development Correlate with Higher Retention Rates?
The predictor variable for this question was W1T0223 (In your FIRST year of teaching, did you
receive seminars or classes for beginning teachers?). Respondents answered this question as part
of the 2007-08 Schools and Staffing Survey (item 39c), and only those responses from teachers
who began their teaching careers in 2007 were included in the BTLS dataset. Both status
variables (W2STTUS and W3STTUS) were used as the criterion variables when determining
whether receiving seminars or classes for beginning teachers correlates with new teacher attrition
rates.
Research Question 2e: Do Induction Programs that Provide New Teachers with
Extra Classroom Assistance such as a Teacher Aide Correlate with Higher Retention
Rates? The predictor variable for this question was W1T0224 (In your FIRST year of teaching,
did you receive extra classroom assistance such as a teacher aide?). Respondents answered this
question as part of the 2007-08 Schools and Staffing Survey (item 39d), and only those responses
from teachers who began their teaching careers in 2007 were included in the BTLS dataset. Both
status variables (W2STTUS and W3STTUS) were used as the criterion variables when
determining whether receiving extra classroom assistance such as a teacher aide correlates with
new teacher attrition rates.
Research Question 2f: Do Induction Programs that Provide New Teachers with
Regular Supportive Communication with Their Administrators Correlate with Higher
Retention Rates? The predictor variable for this question was W1T0225 (In your FIRST year of
teaching, did you receive regular supportive communication with your principal, other
administrators, or department chair?). Respondents answered this question as part of the 2007-08

83
Schools and Staffing Survey (item 39e), and only those responses from teachers who began their
teaching careers in 2007 were included in the BTLS dataset. Both status variables (W2STTUS
and W3STTUS) were used as the criterion variables when determining whether receiving regular
supportive communication with your principal, other administrators, or department chair
correlates with new teacher attrition rates.
Research Question 2g: Do Induction Programs that Provide New Teachers with
Ongoing Guidance or Feedback from a Mentor or Master Teacher Correlate with Higher
Retention Rates? The predictor variable for this question was W1T0226 (In your FIRST year of
teaching, did you receive ongoing guidance or feedback from a master or mentor teacher?).
Respondents answered this question as part of the 2007-08 Schools and Staffing Survey (item
39f), and only those responses from teachers who began their teaching careers in 2007 were
included in the BTLS dataset. Both status variables (W2STTUS and W3STTUS) were used as
the criterion variables when determining whether receiving ongoing guidance or feedback from a
master or mentor teacher correlates with new teacher attrition rates.
Research Question 2h: Do Induction Programs that Provide New Teachers with
Various Combinations of the Previously Tested Components Correlate with Higher
Retention Rates? The predictor variables for this question were the researcher created variables
INDUCT and INDUCT2 that were created from the variables W1T0221-W1T0226 to measure
various combinations of induction traits. INDUCT and INDUCT2 are ordinal with six and two
categories respectively. Both status variables (W2STTUS and W3STTUS) were used as the
criterion variables when determining whether participation in a new teacher induction program
comprised of various combinations of components correlates with new teacher attrition rates.
84
Research Question 3: Does Participation in a New Teacher Induction Program with
Mentoring and Associated Mentoring Components (e.g., Mentor in Same Subject and/or
Grade, Conducting Observations) Correlate with Higher Teacher Retention Rates for a
National Sample of Teachers?
The Teacher Follow-Up Survey 2008-2009 obtained information on the type of
mentoring new teachers had in their first year of teaching. The questions were separate from
those concerning induction (Research Question 2), so it was possible that respondents had
mentoring and mentoring components without having an induction program. W2STTUS and
W3STTUS were the criterion variables for the various chi-square tests of association for this
research question, while W2FCSTS and W3FCSTS were the criterion variables for the logistical
regression analysis in Research Question 4. Any analysis of the wave-two status variables
(W2FCSTS and W2STTUS) involved weighting with the W2RAFWT variable, while the wave-
three variables (W3FCSTS and W3STTUS) used W3AFWT as a weight. NCES calculated all
weights and included them with the datasets.
Research Question 3a: Does Having a Mentor During the First Year of Induction
Correlate with Higher Retention Rates? The predictor variables for this question were
W2MNTYN and MENTIND. W2MNTYN (question 18a from TFS-2L and 8a from TFS-3L),
asked if respondents had a mentor assigned to them in their first year of teaching (2007-08).
MENTIND was created to assess the combination of mentoring and induction. MENTIND
created a grouping of respondents based upon how they responded to W1T0220 and
W2MNTYN. This enabled the examination of those who stated they had an induction program
(W1T0220 = 1) and a mentor (W2MNTYN = 1) versus those who had induction, but did not
have a mentor (W1T0220 = 1, W2MNTYN = 2), versus those who had a mentor, but did not

85
have induction (W1T0220 = 2, W2MNTYN = 1), versus those who did not have either a mentor
or induction (W1T0220 = 2, W2MNTYN = 2). Both status variables (W2STTUS and
W3STTUS) were used as the criterion variables when determining whether having a mentor
assigned to teachers in their first year of teaching (2007-08) correlates with new teacher attrition
rates.
Research Question 3b: Does Having a Mentor with Experience Teaching Either the
Same Subject or the Same Grade Level Correlate with Higher Retention Rates? The
predictor variables for this question were W2MNSUB, W2MNGRA, and MNGRASUB.
W2MNSUB (question18c on TFS-2L and 8c on TFS-3L), asked respondents if the master or
mentor teacher ever taught students in the same subject area as theirs, while W2MNGRA (18d
on TFS-2L and 8d on TFS-3L) asked if the master or mentor teacher ever taught students at the
same grade level as theirs. MNGRASUB combined the two categories and allowed for the
testing of each combination of same subject and/or grade level. Both status variables (W2STTUS
and W3STTUS) were used as the criterion variables when determining whether having a mentor
in the same grade level and/or subject area as the mentee correlates with new teacher attrition
rates.
Research Question 3c: Does the Frequency with which New Teachers Meet with
Their Mentors During the First Year of Induction Correlate with Higher Retention Rates?
The predictor variable for this question was W2MNFRQ (18e and 8e), which asked how
frequently new teachers worked with their mentor during their first year of teaching. The choices
were ‘at least once a week,’ ‘once or twice a month,’ ‘a few times a year,’ and ‘never.’ Both
status variables (W2STTUS and W3STTUS) were used as the criterion variables when
86
determining whether the frequency with which new teachers meet with their mentors during their
first year of induction correlates with new teacher attrition rates.
Research Question 3d: Does the Frequency with which Mentors Observe New
Teachers Present Lessons During the First Year of Induction Correlate with Higher
Retention Rates? The predictor variable for this question was W2MNOBS (18f and 8f), which
asked respondents to report on how frequently their mentor observed them in their classroom
during the 2007-08 school year. The choices were ‘at least once a week,’ ‘once or twice a
month,’ ‘a few times a year,’ and ‘never.’ Both status variables (W2STTUS and W3STTUS)
were used as the criterion variables when determining whether the frequency with which mentors
observe new teachers present lessons during their first year of induction correlates with new
teacher attrition rates.
Research Question 3e: Does the Extent to which New Teachers Feel a Mentor
Improved Their Overall Teaching During the First Year of Induction Correlate with
Higher Retention Rates? The predictor variables for this question were W2MNIMP and
MENTIMP. W2MNIMP asked respondents to rate the extent to which their assigned master
teacher or mentor improved their overall teaching skills during their first year of teaching.
Respondents were asked to choose between ‘not at all,’ ‘to a small extent,’ ‘to a moderate
extent,’ and ‘to a great extent.’ MENTIMP was created to collapse the four response categories
of W2MNIMP into two categories, low and high. Both status variables (W2STTUS and
W3STTUS) were used as the criterion variables when determining whether the extent to which
new teachers feel a mentor improved their overall teaching during their first year of induction
correlates with new teacher attrition rates.
87
Research Question 4: Can a Statistical Model be Developed to Predict the Likelihood of
Retaining a Teacher After Their First and Second Year of Teaching Based on Selected
Induction Program Components?
Data were analyzed by predicting the nominal variables of teacher status W2FCSTS and
W3FCSTS using Logistic Regression. Participation in an induction program W1T0220 and
having a mentor W2MNTYN during their first year of teaching were entered first into the model
because of their overarching properties. Next, a forward selection model was used to enter the
induction component and mentoring trait variables. It is hypothesized that induction programs
that include components based on variables that are predictive would be more effective at
reducing new teacher attrition. Subsequent models allowed for the entrance of any variable using
the FORWARD selection process in SAS to see which component variables contributed most
and in what order. Odds ratios and probabilities were calculated to aid in the interpretation of the
findings.
Summary
After analysis is complete, a generic picture of an effective program should emerge.
Predictive probabilities of the logistic regression analysis will help to determine which aspects of
induction and mentoring are most important in the design of an effective induction program.
Generalized induction programs utilizing different combinations of the predictors are presented
with the hope that their implementation could help to lower teacher attrition rates. Analysis of
the preceding research questions will facilitate the recommendation of general themes needed to
make a generic induction program effective at reducing attrition rates. Ideally, any school in any
district could use the recommendations to design a simple and cost-effective induction program
that could help lower their new teacher attrition rates.

88
Chapter 4
Results
There are four main research questions of interest in this study divided into various sub
questions. Research Question 1 is divided into three parts in order to determine what are the
essential components of effective new teacher induction programs, while Research Question 2
examines the correlation between induction programs components and new teacher attrition rates
with eight separate sub questions. Research Question 3 examines the impact of mentoring
components on new teacher attrition rates with five sub questions, while Research Question 4
creates a statistical model to predict the likelihood of retaining a new teacher for two to three
years based the use of selected induction components.
Research Question 1: What are Essential Components of Effective New Teacher Induction
Programs?
Research Question 1 required a review of the literature to identify studies citing effective
induction programs and/or effective aspects of such programs. The search began on the internet
with online databases such as JSTOR and ERIC with phrases like, “new teacher induction” and
“new teacher mentoring.” After limiting the search to sources published after 1980, there were
nearly 2000 results. After further limiting of the search results to peer-reviewed sources and
using quick scans of titles and abstracts, there were approximately 100 sources for initial review.
During the review process, sources that were identified in multiple sources (either within the text
or within the references) were added to the list or given precedence in the review process.
Approximately 250 sources were reviewed.
Research Question 1a: What are the Teacher Induction Components Cited in the
Literature as Being Effective? After a thorough review of the literature, a list of the most

89
commonly mentioned components in effective induction programs was compiled. Only 52 of the
more than 100 sources reviewed explicitly listed components of effective induction programs.
Themes emerged from the literature about what components matter most, and the three most
common components were mentors, collaboration with other teachers, and sustained professional
development. Strong support from the principal or administration was on half of the lists, while
having opportunities to observe good teaching practices and be observed teaching were both on
slightly less than half of the lists. Providing release time or a reduced teaching load for new
teachers showed up on approximately a third of the lists, while only 25% of the sources cited
networking with an outside agency. Table 10 presents a list of the nine most commonly listed
components with their frequencies and percentages.
Having an experienced mentor in the same subject area and/or grade level was cited most
frequently. Of the 52 sources that listed or recommended effective components, all 52 (100%)
listed having a mentor as being essential. Although not every source made the stipulation that the
mentor needed to be in the same grade and/or subject matter or experienced, almost two-thirds
(33) did mention one or more of these factors. Adding in those sources that instead mentioned
that a lack of training made mentors ineffective (6), 75% of the sources make the stipulation that
providing a mentor that is experienced and in the same subject area and/or grade level is really
necessary for an induction program to be successful at reducing new teacher induction rates.
Most experts in the field of teacher retention agree that new teachers need to collaborate
with other teachers on issues such as classroom discipline, curriculum design, and lesson
planning, and 60% of the teacher induction programs studied included this component. It is also
widely accepted that ongoing, structured professional development (58%) will help a novice in
any career. Since senior personnel typically determine policies, it is no surprise that a supportive
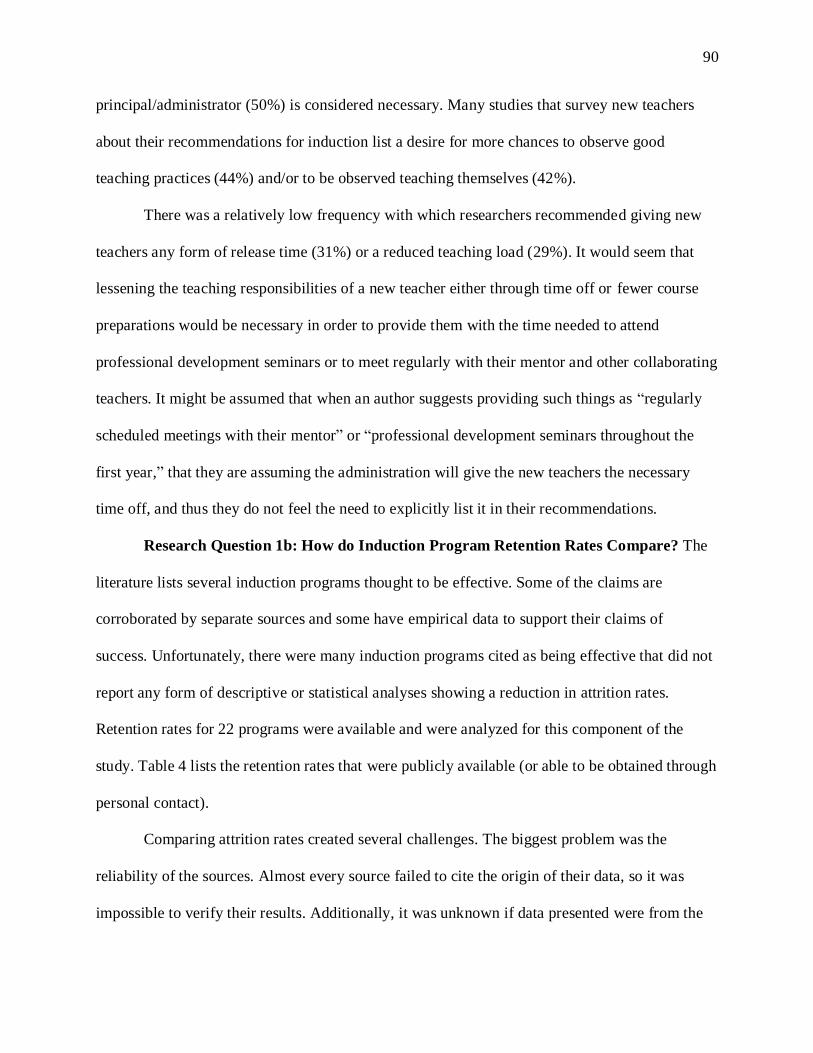
90
principal/administrator (50%) is considered necessary. Many studies that survey new teachers
about their recommendations for induction list a desire for more chances to observe good
teaching practices (44%) and/or to be observed teaching themselves (42%).
There was a relatively low frequency with which researchers recommended giving new
teachers any form of release time (31%) or a reduced teaching load (29%). It would seem that
lessening the teaching responsibilities of a new teacher either through time off or fewer course
preparations would be necessary in order to provide them with the time needed to attend
professional development seminars or to meet regularly with their mentor and other collaborating
teachers. It might be assumed that when an author suggests providing such things as “regularly
scheduled meetings with their mentor” or “professional development seminars throughout the
first year,” that they are assuming the administration will give the new teachers the necessary
time off, and thus they do not feel the need to explicitly list it in their recommendations.
Research Question 1b: How do Induction Program Retention Rates Compare? The
literature lists several induction programs thought to be effective. Some of the claims are
corroborated by separate sources and some have empirical data to support their claims of
success. Unfortunately, there were many induction programs cited as being effective that did not
report any form of descriptive or statistical analyses showing a reduction in attrition rates.
Retention rates for 22 programs were available and were analyzed for this component of the
study. Table 4 lists the retention rates that were publicly available (or able to be obtained through
personal contact).
Comparing attrition rates created several challenges. The biggest problem was the
reliability of the sources. Almost every source failed to cite the origin of their data, so it was
impossible to verify their results. Additionally, it was unknown if data presented were from the
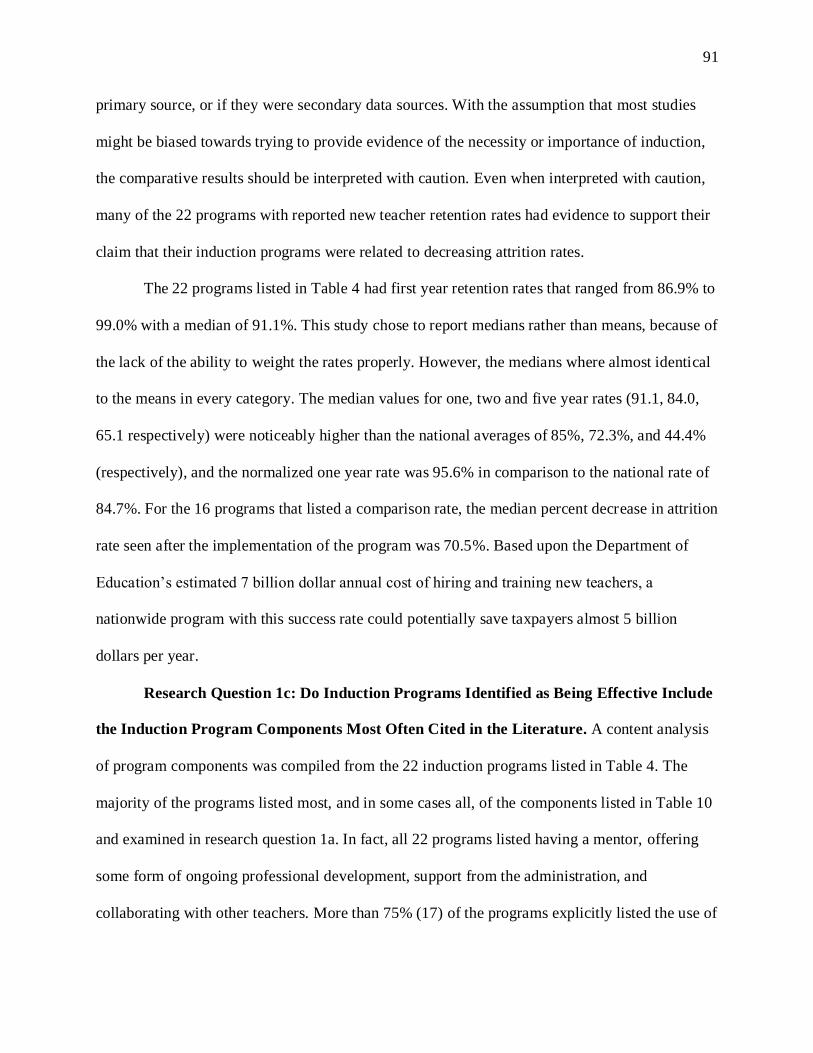
91
primary source, or if they were secondary data sources. With the assumption that most studies
might be biased towards trying to provide evidence of the necessity or importance of induction,
the comparative results should be interpreted with caution. Even when interpreted with caution,
many of the 22 programs with reported new teacher retention rates had evidence to support their
claim that their induction programs were related to decreasing attrition rates.
The 22 programs listed in Table 4 had first year retention rates that ranged from 86.9% to
99.0% with a median of 91.1%. This study chose to report medians rather than means, because of
the lack of the ability to weight the rates properly. However, the medians where almost identical
to the means in every category. The median values for one, two and five year rates (91.1, 84.0,
65.1 respectively) were noticeably higher than the national averages of 85%, 72.3%, and 44.4%
(respectively), and the normalized one year rate was 95.6% in comparison to the national rate of
84.7%. For the 16 programs that listed a comparison rate, the median percent decrease in attrition
rate seen after the implementation of the program was 70.5%. Based upon the Department of
Education’s estimated 7 billion dollar annual cost of hiring and training new teachers, a
nationwide program with this success rate could potentially save taxpayers almost 5 billion
dollars per year.
Research Question 1c: Do Induction Programs Identified as Being Effective Include
the Induction Program Components Most Often Cited in the Literature. A content analysis
of program components was compiled from the 22 induction programs listed in Table 4. The
majority of the programs listed most, and in some cases all, of the components listed in Table 10
and examined in research question 1a. In fact, all 22 programs listed having a mentor, offering
some form of ongoing professional development, support from the administration, and
collaborating with other teachers. More than 75% (17) of the programs explicitly listed the use of

92
observations, while only half (11) mentioned some form of release time. Again, this may be
because some form of release time is assumed in order to provide the new teachers with enough
time to attend seminars and meetings. The only real deviation from the list was the frequency
with which programs cited networking with outside organizations. While the literature only cited
this 25% of the time, 64% of the successful programs (14) made mention of this overtly, and
some of those not specifically mentioning networking with outside organizations alluded to this
type of activity. A possible explanation for this discrepancy is that most of these programs
worked closely with local universities or other organizations, so networking is necessitated
almost purely by design. Table 13 provides a comparison of the percentage of successful
programs including each characteristic. The results indicate that the successful programs may be
more comprehensive than the general literature's recommendations with substantially higher
proportions of successful programs including almost all nine of the components listed.
Research Question 2: Does Participation in a Teacher Induction Program and Associated
Program Components (e.g., Seminars and Common Planning Time) Correlate with Higher
Teacher Retention Rates for a National Sample of Teachers?
Before answering the quantitative research questions, it is first necessary to provide
descriptive statistics of the dataset and several variables. After NCES removed any misreported
participants from the sample, the size of the BTLS dataset fell to N = 1992 with a weighted total
of N = 150,000, which represents the approximate number of new teachers hired in the United
States for the 2007-08 school year. All of the NCES variables are nominal with only two
categories (1 = yes and 2 = no), while the two author created variables INDUCT and INDUCT2
are ordinal with six and two categories respectively. Table 14 lists the weighted and unweighted
frequencies of the status variables, while Tables 15 and 16 list all of the variables used in

93
Research Question 2 and 3 respectively with their respective weighted and unweighted
frequencies and relative frequencies along with missing value amounts. Appendix A contains
detailed descriptions of all variables used in this study.
Tables 17 and 18 list the two-way weighted frequencies of variables used in Research
Question 2, while Table 19 displays the chi square analysis results for Research Question 2. Chi
square analyses determined which relationships were statistically significant. Due to the large
sample size, all but one of the relationships examined resulted in a statistically significant
association at the alpha = .0001 level. Therefore, effect sizes were calculated using Cramer’s V.
According to sources, (e.g., http://www. acastat.com/ statbook/chisqassoc.htm;
http://sociology.camden.rutgers.edu/curriculum /format.htm) any value less than .10 is a weak
association. Associations with corresponding Cramer’s V values between .10 and .25 are
moderate, while anything above .25 is a strong association. (Note: While every source referenced
agreed that .10 was the lower bound for a moderate association, the upper bound ranged between
.15 and .30.) The two-way frequency tables 17 and 18 help further illustrate the effective
differences in teacher employment status in year two (W2STTUS) and year three (W3STTUS)
respectively based on whether or not respondents had each of the indicated induction
components.
Research Question 2a: Does Participation in a New Teacher Induction Program
Correlate with Higher Teacher Retention Rates? The weighted frequencies of teachers who
are classified as a current teacher, former teacher, or a current teacher who has changed to a new
school or district in year two (W2STTUS), and year three (W3STTUS) were categorized by
whether or not they had participated in an induction program in their first year of teaching
(W1T0220) and displayed in Tables 17 and 18 respectively.
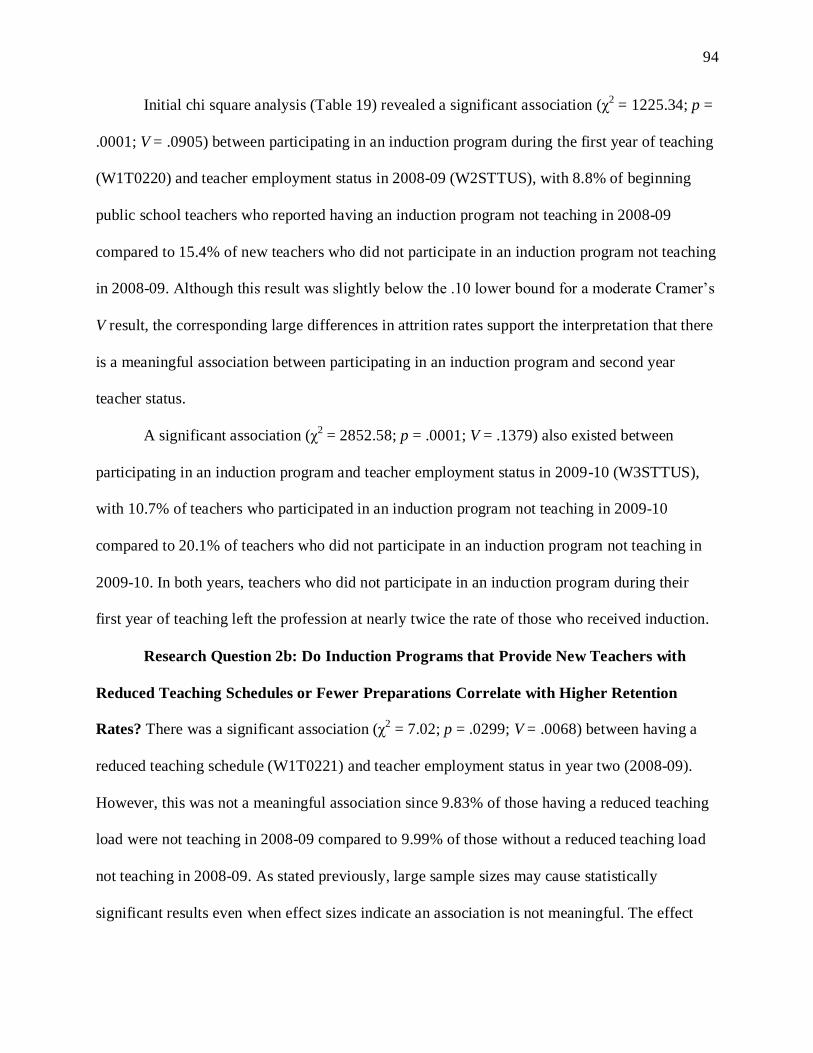
94
Initial chi square analysis (Table 19) revealed a significant association (χ2 = 1225.34; p =
.0001; V = .0905) between participating in an induction program during the first year of teaching
(W1T0220) and teacher employment status in 2008-09 (W2STTUS), with 8.8% of beginning
public school teachers who reported having an induction program not teaching in 2008-09
compared to 15.4% of new teachers who did not participate in an induction program not teaching
in 2008-09. Although this result was slightly below the .10 lower bound for a moderate Cramer’s
V result, the corresponding large differences in attrition rates support the interpretation that there
is a meaningful association between participating in an induction program and second year
teacher status.
A significant association (χ2 = 2852.58; p = .0001; V = .1379) also existed between
participating in an induction program and teacher employment status in 2009-10 (W3STTUS),
with 10.7% of teachers who participated in an induction program not teaching in 2009-10
compared to 20.1% of teachers who did not participate in an induction program not teaching in
2009-10. In both years, teachers who did not participate in an induction program during their
first year of teaching left the profession at nearly twice the rate of those who received induction.
Research Question 2b: Do Induction Programs that Provide New Teachers with
Reduced Teaching Schedules or Fewer Preparations Correlate with Higher Retention
Rates? There was a significant association (χ2 = 7.02; p = .0299; V = .0068) between having a
reduced teaching schedule (W1T0221) and teacher employment status in year two (2008-09).
However, this was not a meaningful association since 9.83% of those having a reduced teaching
load were not teaching in 2008-09 compared to 9.99% of those without a reduced teaching load
not teaching in 2008-09. As stated previously, large sample sizes may cause statistically
significant results even when effect sizes indicate an association is not meaningful. The effect

95
size for this association (V = .0068) and the difference in the two-way frequencies are both too
small to consider the association between having a reduced teaching schedule and teacher
employment status in year two meaningful.
Similarly, there was a significant association (χ2 = 444.83; p = .0001; V = .0538) between
having a reduced teaching schedule (W1T0221) and teacher employment status in year three
(2009-10). However, this association is also small. Of those teachers who received a reduced
teaching schedule or fewer class preparations, 14.34% were no longer teaching in year three,
compared to only 11.95% of those teachers who did not receive a reduced teaching schedule. Not
only is this difference smaller than what might be considered meaningful, but it is also in the
direction opposite to what the literature would indicate is expected. The direction of the
difference in the percentages was in the wrong direction for both Leavers and Returners, with
less than one percent of the respondents having a reduced schedule returning to teaching in year
three compared to 3% of the respondents who did not have a reduced schedule returning to
teaching in year three. Recall that the percentage of teachers who left after the first year was
almost identical for both groups, so not only did having a reduced teaching schedule not aid in
keeping teachers in the profession past the first year, but it also failed to help bring more of them
back to the profession later.
Research Question 2c: Do Induction Programs that Provide New Teachers with
Common Planning Time with Teachers in Their Same Subject Correlate with Higher
Retention Rates? There was a significant association (χ2 = 148.98; p = .0001; V = .0312)
between having common planning times (W1T0222) and teacher employment status in year two
(2008-09). However, this was not a meaningful association since 9.34% of those having common
planning times with other teachers in their subject were not teaching in year two compared to

96
11.04% of those without common planning times with other teachers in their subject area not
teaching in year two.
Similarly, there was a significant association (χ2 = 2072.6; p = .0001; V = .1162) between
having common planning times (W1T0222) and teacher employment status in year two (2008-
09). However, unlike the association with teacher employment status in year two, having
common planning time did have a meaningful association with teacher employment status in
year three. Of those teachers having common planning times with other teachers in their same
subject, 77.7%% were still teaching at the same school in year three, compared to only 69.2%%
of those teachers who did not have common planning times with other teachers in their same
subject were still teaching in the same school in year three. Although the percentages of Leavers
were similar for both those having common planning time (11.5%) and those who did not have
common planning time (13.7%), there was a meaningful difference in the percent who stayed
(cited above) and those who moved (7.87% and 14.59% respectively). It is possible that having
common planning times with other teachers in the same subject allowed for a larger proportion
of teachers in that group to form meaningful bonds with other teachers in their departments,
which could lend to fewer teachers wanting to move to other schools.
Research Question 2d: Do Induction Programs that Provide New Teachers with
Ongoing Seminars and Professional Development Correlate with Higher Retention Rates?
There was a significant association (χ2 = 1702.21; p = .0001; V = .1054) between having ongoing
seminars and professional development during the first year of teaching (W1T0223) and teacher
employment status in year two (2008-09). The association is also meaningful because only 8.6%
of teachers having ongoing seminars left teaching in year two compared to 15.5% of teachers
who did not have ongoing seminars leaving the profession in year two. In year two, teachers who

97
did not have ongoing seminars or professional development during their first year of teaching left
the profession at approximately twice the rate of those teachers who did have ongoing seminars
and professional development during their first year of teaching.
Similarly, there was a significant association (χ2 = 3907.36; p = .0001; V = .1595)
between having ongoing seminars and teacher employment status in year three. This association
was also meaningful with only 10.1% of the teachers having seminars leaving teaching in year
three compared to 20.1% of teachers who did not have seminars leaving teaching in year three.
The percent change was similar in year three with teachers having ongoing seminars or
professional development during their first year of teaching leaving the profession at
approximately half the rate of those teachers who did not have ongoing seminars and
professional development during their first year of teaching.
Research Question 2e: Do Induction Programs that Provide New Teachers with
Extra Classroom Assistance such as a Teacher Aide Correlate with Higher Retention
Rates? There was a significant association (χ2 = 513.78; p = .0001; V = .0579) between having
extra classroom assistance (W1T0224) and teacher employment status in year two (2008-09).
However, this was not a meaningful association since 8.6% of those having extra classroom
assistance were not teaching in year two compared to 10.6% of teachers without extra classroom
assistance not teaching in year two. The percentage of teachers having extra help (72.5%) and
continued to teach in the same school in year two was also relatively close to the percentage of
teachers who did not have extra help (74.8%) and continued to teach at the same school in year
two.
Similarly, there was a significant association (χ2 = 801.4; p = .0001; V = .0722) between
having extra classroom assistance and teacher employment status in year three (2009-10).

98
However, this association is also not meaningfully large. Of those teachers having extra
classroom assistance during their first year of teaching, 11.8% were no longer teaching and
72.1% were still teaching in the same school in year three, compared to 12.6% of the teachers
who did not receive extra classroom assistance were no longer teaching and 75.8% were still
teaching in the same school in year three. A higher percentage of teachers who did not have extra
classroom assistance during their first year of teaching were still teaching at the same school in
year three compared to teachers who did have extra classroom assistance during their first year
of teaching.
Research Question 2f: Do Induction Programs that Provide New Teachers with
Regular Supportive Communication with Their Administrators Correlate with Higher
Retention Rates? There was a significant association (χ2 = 2167.81; p = .0001; V = .1190)
between having regular supportive communication with a principal, department chair, or other
administrator during the first year of teaching (W1T0225) and teacher employment status in year
two (2008-09). The association is also meaningful because only 8.9% of teachers having regular
supportive communication left teaching in year two compared to 17.6% of teachers who did not
have regular supportive communication leaving the profession in year two. In year two, teachers
who did not have regular supportive communication with their administrators during their first
year of teaching left the profession at approximately twice the rate of those teachers who did
have regular supportive communication with their administrators during their first year of
teaching.
Similarly, there was a significant association (χ2 = 2202.62; p = .0001; V = .1198)
between having regular supportive communication and teacher employment status in year three.
This association was also meaningful with only 11.1% of the teachers having regular supportive

99
communication with their administrators leaving teaching in year three compared to 20.6% of
teachers who did not have regular supportive communication with their administrators leaving
teaching in year three. The percent change was similar in year three with teachers having regular
supportive communication with their administrators during their first year of teaching leaving the
profession at approximately half the rate of those teachers who did not have regular supportive
communication with their administrators during their first year of teaching.
Research Question 2g: Do Induction Programs that Provide New Teachers with
Ongoing Guidance or Feedback from a Mentor or Master Teacher Correlate with Higher
Retention Rates? There was a significant association (χ2 = 156.43; p = .0001; V = .0320)
between having ongoing guidance or feedback from a mentor or master teacher during the first
year of teaching (W1T0226) and teacher employment status in year two (2008-09). However,
this was not a meaningful association since 9.59% of the teachers having ongoing guidance and
feedback during their first year were not teaching in year two compared to 12.03% of teachers
who did not have ongoing guidance and feedback during their first year were not teaching in year
two. The percentage of teachers having ongoing guidance and feedback during their first year
(74.2%) who continued to teach in the same school in year two was also relatively close to the
percentage of teachers who did not have ongoing guidance and feedback during their first year
(73.3%) and continued to teach at the same school in year two.
Similarly, there was a significant association (χ2 = 682.67; p = .0001; V = .0667) between
having ongoing guidance or feedback and teacher employment status in year three (2009-10).
However, this association is also not meaningful. Of those teachers having ongoing guidance or
feedback during their first year of teaching, 11.8% were no longer teaching and 74.4% were still
teaching in the same school in year three, compared to 15.3% of the teachers who did not receive

100
ongoing guidance or feedback were no longer teaching and 75.6% were still teaching in the same
school in year three. A slightly higher percentage of teachers who did not have ongoing guidance
or feedback during their first year of teaching were still teaching at the same school in year three
compared to teachers who did have ongoing guidance or feedback during their first year of
teaching. However, teachers who did have ongoing guidance or feedback in their first year of
teaching returned to teaching in year three (3.1%) at more than three times the rate of the
teachers who did not have ongoing guidance or feedback from a mentor or master teacher (0.9%)
during their first year of teaching.
Research Question 2h: Do Induction Programs that Provide New Teachers with
Various Combinations of the Previously Tested Components Correlate with Higher
Retention Rates? After analyzing the strengths of association of each individual induction
component to teacher status, the researcher created two variables (INDUCT and INDUCT2) to
test the strength of association of teacher employment status to various combinations of
induction components. Since the literature review suggested that a reduced teaching schedule,
common planning time, seminars, supportive administrators, and feedback from mentors were all
important induction components, INDUCT included various combinations of these components.
The created variable INDUCT had a significant and meaningful association with teacher
employment status in year two (χ2 = 2317.28; p = .0001; V = .1301) and year three (χ
2 = 5082.08;
p = .0001; V = .1593). Further analysis of the corresponding frequencies suggests that having an
induction program with seminars for beginning teachers and regular supportive communication
from administrators has the strongest association with teacher employment status in years two
and three. When analyzing INDUCT, only 5.81% of teachers having both seminars and regular
supportive communication with their administrators and nothing else from the list of tested

101
components during their first year induction program left teaching in year two compared to
5.82% of teachers who also had ongoing mentor feedback, 5.93% of teachers having all six
induction components, and 30.5% of teachers who reported having induction with none of the
induction components listed. Similarly, only 5.24% of teachers having both seminars and regular
supportive communication with their administrators during their first year of teaching left the
profession in year three compared to 39.3% of teachers having induction without any of the
listed components leaving the profession in year three. Unfortunately, the number of respondents
in each of these categories is too small (N = 37, 270, 83, and 50 unweighted respectively) to
generalize the results to the entire population of new teachers in the United Stated, but they do
suggest that providing seminars and supportive communication with administrators lowers
attrition. However, the addition of induction components after seminars and supportive
administrators does not improve retention rates.
Since seminars and supportive administrators resulted in the largest levels of association,
INDUCT2 was created to compare those teachers who experienced at least both of these
components versus those teachers having neither. The created variable INDUCT2 had a
significant and meaningful association with teacher employment status in year two (χ2 =
2824.99; p = .0001; V = .1345) and in year three (χ2 = 4592.73; p = .0001; V = .1712). Only 7.6%
of teachers having at least seminars and supportive communication with their administrators left
teaching in year two compared to 15.7% of teachers who did not have at least both components
left teaching in year two. In year three, 9.5% of teachers having both components were not
teaching, while 19.7% of teachers who did not have at least both components were not teaching.
Because the unweighted number of teachers having at least seminars and supportive
communication (N = 1263) and the number of teachers that did not have at least both
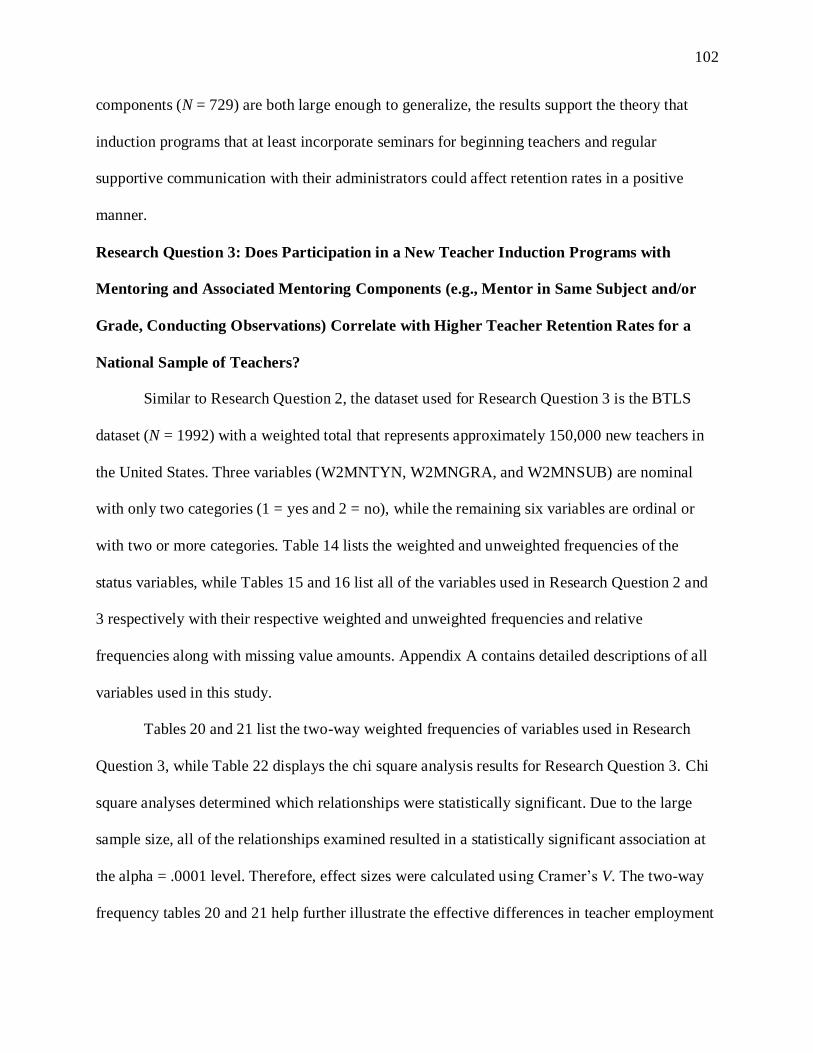
102
components (N = 729) are both large enough to generalize, the results support the theory that
induction programs that at least incorporate seminars for beginning teachers and regular
supportive communication with their administrators could affect retention rates in a positive
manner.
Research Question 3: Does Participation in a New Teacher Induction Programs with
Mentoring and Associated Mentoring Components (e.g., Mentor in Same Subject and/or
Grade, Conducting Observations) Correlate with Higher Teacher Retention Rates for a
National Sample of Teachers?
Similar to Research Question 2, the dataset used for Research Question 3 is the BTLS
dataset (N = 1992) with a weighted total that represents approximately 150,000 new teachers in
the United States. Three variables (W2MNTYN, W2MNGRA, and W2MNSUB) are nominal
with only two categories (1 = yes and 2 = no), while the remaining six variables are ordinal or
with two or more categories. Table 14 lists the weighted and unweighted frequencies of the
status variables, while Tables 15 and 16 list all of the variables used in Research Question 2 and
3 respectively with their respective weighted and unweighted frequencies and relative
frequencies along with missing value amounts. Appendix A contains detailed descriptions of all
variables used in this study.
Tables 20 and 21 list the two-way weighted frequencies of variables used in Research
Question 3, while Table 22 displays the chi square analysis results for Research Question 3. Chi
square analyses determined which relationships were statistically significant. Due to the large
sample size, all of the relationships examined resulted in a statistically significant association at
the alpha = .0001 level. Therefore, effect sizes were calculated using Cramer’s V. The two-way
frequency tables 20 and 21 help further illustrate the effective differences in teacher employment

103
status in year two (W2STTUS) and year three (W3STTUS) respectively based on whether or not
respondents had each of the indicated induction or mentoring components.
Research Question 3a: Does Having a Mentor during the First Year of Induction
Correlate with Higher Retention Rates? Frequency tables on the status variables of whether a
respondent is a current teacher, former teacher, or a current teacher who has changed to a new
school or district (W2STTUS, and W3STTUS) were categorized by whether or not they had a
mentor (W2MNTYN) during their first year of teaching (2007-08) and weighted by the
appropriate weights (W2RAFWT, and W3AFWT).
Initial chi square analysis (Table 22) revealed a significant association (χ2 = 1747.25; p =
.0001; V = .1058) between having a mentor during the first year of an induction program and
teacher employment status in 2008-09, with 8.4%% of beginning public school teachers who
reported having a mentor during their first year of teaching not teaching in 2008-09 compared to
16.3% of new teachers who did not have a mentor during their first year of teaching not teaching
in 2008-09.
A significant association (χ2 = 4036.08; p = .0001; V = .1611) also existed between
having a mentor during their first year of teaching and teacher employment status in 2009-10,
with 9.8% of teachers having a mentor during their first year of teaching not teaching in year
three compared to 22.5% of teachers who did not have a mentor during their first year of
teaching not teaching in year three. In both years, teachers who did not have a mentor during
their first year of teaching left the profession at approximately twice the rate of those who did
have a mentor during the first year of their induction program.
The TFS question (W2MNTYN), “Last school year (2007-08), were you assigned a
master or mentor teacher by your school or school district?” was separate from questions

104
regarding whether the teachers participated in an induction program or not. In order to determine
if having a mentor as part of an induction program, it was necessary to create the variable
MENTIND in order to classify respondents by how they responded to both W2MNTYN (did
they have a mentor in 2007-08) and W1T0220 (did they participate in an induction program in
2007-08). MENTIND contains four categories: Respondents who had both a mentor and an
induction program (W2MNTYN = YES, W1T0220 = YES), respondents who participated in an
induction program but did not have a mentor (W1T0220 = YES, W2MNTYN = NO),
respondents who had a mentor but did not participate in an induction program (W2MNTYN =
YES, W1T0220 – NO), and respondents who had neither an induction program nor a mentor
(W1T0220 = NO, W2MNTYN = NO).
The created variable MENTIND had a significant and meaningful association with
teacher employment status in year two (χ2 = 2593.09; p = .0001; V = .0931) and year three (χ
2 =
5780.83; p = .0001; V = .1137). Although the Cramer’s V value for the year two association was
slightly below the .10 lower bound for a moderate association, the corresponding two-way
frequencies (Tables 20 and 21) justify the meaningful interpretation. Further analysis of the
corresponding frequencies suggests that an induction program with a mentoring component is
associated with the lowest attrition rates of the four categories. When analyzing MENTIND, only
7.61% of teachers having both an induction program and a mentor during their first year of
teaching left teaching in year two compared to 15.87% of teachers who had induction without a
mentoring component, 13.23% of teachers who had a mentor without an induction program, and
18.95% of teachers who reported having neither an induction program nor a mentor during their
first year of teaching. Similarly, only 8.96% of teachers having both an induction program and a
mentor during their first year of teaching left teaching in year three compared to 20.35% of

105
teachers who had induction without a mentoring component, 15.41% of teachers who had a
mentor without an induction program, and 25.72% of teachers who reported having neither an
induction program nor a mentor during their first year of teaching.
Research Question 3b: Does Having a Mentor with Experience Teaching Either the
Same Subject or the Same Grade Level Correlate with Higher Retention Rates? There was
a significant association (χ2 = 370.53; p = .0001; V = .0586) between having a mentor with
experience teaching at the same grade level (W2MNGRA) and teacher employment status in
year two (2008-09). However, this was not a meaningful association since 7.6% of the teachers
having a mentor with experience teaching at the same grade level were not teaching in year two
compared to 6.8% of the teachers who did not have a mentor with experience teaching at the
same grade level not teaching in 2008-09. Not only is this difference too small to be meaningful,
but it is also in the wrong direction. Teachers having mentors with experience teaching at the
same grade level left the profession at higher rates than teachers having mentors that did not have
experience teaching at the same grade level.
Similarly, there was a significant association (χ2 = 403.21; p = .0001; V = .0610) between
having a mentor with experience teaching at the same grade level and teacher employment status
in year three. However, this association is also not meaningfully large. Of those teachers having
a mentor with experience teaching at the same grade level, 8.4% were no longer teaching in year
three, compared to only 8.9% of teachers having a mentor without experience teaching at the
same grade level leaving teaching in year three.
Having a mentor with experience teaching the same subject had slightly better results.
There was a significant association (χ2 = 376.98; p = .0001; V = .0588) between having a mentor
with experience teaching the same subject (W2MNSUB) and teacher employment status in year

106
two (2008-09). However, this was not a meaningful association since 7.3% of the teachers
having a mentor with experience teaching the same subject were not teaching in year two
compared to 8.3% of the teachers who did not have a mentor with experience teaching the same
subject not teaching in year two. Although similar to the results for W2MNGRA, at least having
a mentor with experience teaching the same subject correlated to attrition rates LOWER than the
rates correlated to mentors who did not have experience teaching the same subject.
Like before, there was a significant association (χ2 = 3048.04; p = .0001; V = .1669)
between having a mentor with experience teaching the same subject and teacher employment
status in year three. However, this time the association was meaningful. Of those teachers having
a mentor with experience teaching the same subject, only 6.98% were no longer teaching in year
three, compared to 13.85% of teachers having a mentor without experience teaching the same
subject leaving teaching in year three.
In order to test the conjunctive case, the variable MNGRASUB was created. There was a
significant association (χ2 = 974.51; p = .0001; V = .0672) between having a mentor with
experience teaching the same subject and grade level and teacher employment status in year two.
However, this was not a meaningful association since 7.93% of the teachers having mentors with
experience teaching both the same subject and grade level were not teaching in year two
compared to 10.49% of the teachers having mentors without experience teaching both the same
subject and grade level were not teaching in year two.
Similarly, there was a significant association (χ2 = 1733.43; p = .0001; V = .0895)
between having a mentor with experience teaching the same subject and grade level and teacher
employment status in year two, but it was not meaningful. Of the teachers who had mentors with
experience in both grade level and subject area, 7.9% left teaching in year two compared to

107
10.5% of the teachers who had mentors with no experience in either the same grade level or
subject area. However, unlike the association with teacher employment status in year two, having
mentors with experience teaching both the same subject and grade level did have a significant (χ2
= 4244.29; p = .0001; V = .1143) and meaningful association with teacher employment status in
year three. Of the teachers having mentors with experience teaching both the same subject and
grade level, 7.8% were not teaching in year three compared to 18.7% of the teachers having
mentors without experience teaching either the same subject and grade level were not teaching in
year three. Teachers having mentors in the first year of induction who do not have experience
teaching either the same subject or grade level left the teaching profession in year three at more
than twice the rate of the teachers having mentors with experience teaching both the same
subject and grade level.
Research Question 3c: Does the Frequency with which New Teachers Meet with
Their Mentors during the First Year of Induction Correlate with Higher Retention Rates?
There was a significant association (χ2 = 2030.05; p = .0001; V = .0965) between how frequently
new teachers meet with their mentors during the first year of induction (W2MNFRQ) and teacher
employment status in year two. However, this was a weak association since 6.48% of the
teachers who met with their mentors at least once per week during the first year of induction
were not teaching in year two compared to 9.97% of the teachers who met with their mentors
once or twice per month during the first year of induction were not teaching in year two.
Similarly, there was a significant association (χ2 = 3071.01; p = .0001; V = .0967)
between how frequently new teachers meet with their mentors during the first year of induction
and teacher employment status in year three. This was a slightly more meaningful association
with only 6.46% of the teachers who met with their mentors at least once per week during the

108
first year of induction not teaching in year three compared to 12.13% of the teachers who met
with their mentors once or twice per month during the first year of induction not teaching in year
three.
Research Question 3d: Does the Frequency with which Mentors Observe New
Teachers Present Lessons during the First Year of Induction Correlate with Higher
Retention Rates? There was a significant association (χ2 = 682.68; p = .0001; V = .0561)
between how frequently mentors observed new teachers presenting lessons during the first year
of induction (W2MNOBS) and teacher employment status in year two. However, this was a
confounded association since 8.29% of the teachers whose mentors observed them presenting
lessons at least once per week and 5.89% of the teachers whose mentors observed them
presenting lessons once or twice per month during the first year of induction were not teaching in
year two compared to 7.83% of the teachers who reported their mentors never observed them
presenting lessons during the first year of induction not teaching in year two.
Similarly, there was a significant association (χ2 = 1266.11; p = .0001; V = .0622)
between how frequently mentors observed new teachers presenting lessons during the first year
of induction and teacher employment status in year three. This was a confounded association as
well with only 6.81% of the teachers whose mentors observed them presenting lessons at least
once per week and 12.13% of the teachers whose mentors observed them presenting lessons once
or twice per month during the first year of induction not teaching in year three compared to
8.31% of the teachers who reported their mentors never observed them presenting lessons during
the first year of induction not teaching in year three.
109
Research Question 3e: Does the Extent to which New Teachers Feel a Mentor
Improved their Overall Teaching during the First Year of Induction Correlate with Higher
Retention Rates? There was a significant association (χ2 = 4166.1; p = .0001; V = .1384)
between the perceived amount that the mentor improved the new teacher’s overall teaching skills
during the first year of induction (W2MNIMP) and teacher employment status in year two. This
was a meaningful association because the percent of teachers leaving the profession in year two
decreased with each increase in the level of perceived teaching improvement caused by the
master or mentor teacher. Of the teachers who felt their mentor had improved their overall
teaching skills to a “great extent” and to a “moderate extent,” only 4.36% and 5.40%
(respectively) left teaching in the second year, compared to 10.71% and 14.19% of the teachers
who felt their mentor had improved their overall teaching skills to a “small extent” and “not at
all” (respectively) left teaching in the second year.
Similarly, there was a significant association (χ2 = 4758.86; p = .0001; V = .1206)
between the perceived amount that the mentor improved the new teacher’s overall teaching skills
during the first year of induction and teacher employment status in year three. This was a
confounded association because the percent of teachers leaving the profession in year three did
not decrease consistently with increases in perceived levels of overall teaching improvement
caused by master or mentor teachers. Of the teachers who felt their mentor had improved their
overall teaching skills to a “great extent” and to a “moderate extent,” 7.27% and 5.87%
(respectively) left teaching in the third year, compared to 12.60% and 10.87% of the teachers
who felt their mentor had improved their overall teaching skills to a “small extent” and “not at
all” (respectively) left teaching in the second year. The teachers who felt their master or mentor
teacher had improved their teaching skills to a moderate extent left teaching at a lesser rate than

110
teachers who felt their master or mentor teacher had improved their overall teaching skills to a
higher extent. Additionally, the highest rate of attrition was the group of teachers who felt their
master or mentor teacher had improved their teaching to a “small” extent as opposed to the group
that felt their master or mentor teacher had not improved their overall teaching skills at all during
their first year of teaching.
Because there appeared to be a larger difference between the two higher improvement
groups (great extent, moderate extent) and the two lower improvement groups (small extent, not
at all) than there was within the two groups, the variable MENTIMP was created to analyze the
higher and lower groups. There was a significant association (χ2 = 1740.21; p = .0001; V =
.1265) between the perceived amount that the master or mentor teacher improved the new
teacher’s overall teaching skills during the first year of induction (MENTIMP) and teacher
employment status in year two. This association was meaningful with only 4.95% of the teachers
who felt their master or mentor teachers provided a high level of improvement to their overall
teaching skills leaving teaching during the second year, compared to 11.82% of teachers who felt
their master or mentor teachers provided a low level of improvement to their overall teaching
skills leaving teaching during the second year.
Similarly, there was a significant association (χ2 = 1570.2; p = .0001; V = .1200) between
the perceived amount that the master or mentor teacher improved the new teacher’s overall
teaching skills during the first year of induction and teacher employment status in year three.
This association was meaningful with only 6.47% of the teachers who felt their master or mentor
teachers provided a high level of improvement to their overall teaching skills leaving teaching in
year three, compared to 12.07% of teachers who felt their master or mentor teachers provided a
low level of improvement to their overall teaching skills leaving teaching in year three.

111
Research Question 4: Can a Statistical Model be Developed to Predict the Likelihood of
Retaining a Teacher After Their First and Second Year of Teaching Based on Selected
Induction Program Components?
This study examined a prediction model for new teacher retention that utilized variables
from the 2009-10 Beginning Teacher Longitudinal Study (BTLS) on the presence of induction
program specifics and mentoring traits. New teacher retention was selected as an important
criterion because attrition causes a large financial burden on already budget-limited districts, and
consistent turnover affects teacher effectiveness and student learning. Results of a logistic
regression analysis indicated that the presence of an induction program, the presence of a mentor,
and the presence of seminars or classes for beginning teachers along with regular or supportive
communication from the principal or other administrators were significant predictors for teacher
retention in a sample of 1992 new teachers. Generalized induction programs utilizing each of the
significant predictors were presented with the expectation that their use would increase teacher
retention, resulting in greater overall teacher effectiveness and student learning.
A logistic regression analysis was conducted using respondents’ answers to survey
questions about induction program specifics during their first year of teaching to measure new
teacher attrition in years two and three. Initial analysis utilized 15 predictor variables to
determine which components of induction programs correlated to new teacher retention in years
two and three. The final analysis utilized eight predictor variables with forward selection to
model teacher retention in years two and three. The number of participants in the final analysis
was 1745 for year two retention rates and 1631 for year three.
Initial attempts to model all 15 variables were unsuccessful due to the highly correlated
nature of some variables, and the linear combination of others. Due to the nesting of the
112
mentoring components survey questions, W2MNTYN (were you assigned a master or mentor
teacher by your school or school district) was a linear combination of the mentoring component
questions (W2MNGRA, W2MNSUB, W2MNFRQ, W2MNOBS, W2MNIMP), which prevented
W2MNTYN from entering the model along with any of the other mentoring component
variables. Entering all 15 variables in the model using forward regression, with inclusion
requiring a significant relationship at alpha = .05, onlyW2MNOBS (how frequently did your
master or mentor teacher observe you in your classroom) and W2MNIMP (overall, to what
extent did your assigned master or mentor teacher improve your teaching) entered the model for
both years two and three, while W2MNFRQ (how frequently did you work with your master or
mentor teacher) entered the model for year three. Because the presence of a mentor is cited in the
literature as being vital to the effectiveness of an induction program and only three mentoring
component variables entered the model initially, it was decided that W2MNTYN should enter
the model in place of any mentoring component variables.
The presence of a mentor (W2MNTYN), the presence of an induction program
(W1T0220), and the presence of induction program components such as, a reduced teaching
schedule (W1T0221), common planning time with teachers in the same subject (W1T0222),
seminars or classes for beginning teachers (W1T0223), extra classroom assistants (e.g., teacher
aides) (W1T0224), regular or supportive communication with a principal or other administrators
(W1T0225), and ongoing guidance for feedback from a master or mentor teacher (W1T0226)
were entered into the model using forward regression with appropriate weighting and inclusion
requiring a significant relationship at an alpha = .05 level. All eight variables were retained in the
model for both years two and three (see Table 23).

113
Year Two New Teacher Employment Status. The unadjusted for predicting year-
two employment status using the eight variables (W2MNTYN and W1T0220-W1T0226) was
0.89 with a sample size of 1745 unweighted and 149391.7 weighted. Although the value is
not a measure of the variance in the criterion variable predicted using the predictor variables, it
does provide a comparison measure for other logistic regression models designed to predict
teacher retention. The percent concordant was 60.9, the percent discordant was 35.4, and the
percent tied was 3.7 with 287,224 pairs. The odds ratio for W1T0220 was 1.42, indicating that a
new teacher who participated in an induction program during their first year of teaching was 1.42
times as likely to still be teaching in year two compared to a new teacher who did not participate
in an induction program during their first year of teaching. The odds ratio for W2MNTYN was
2.09, indicating that a new teacher who was assigned a mentor teacher during their first year of
teaching was 2.09 times as likely to still be teaching in year two compared to a new teacher who
did not have a mentor during their first year of teaching. The odds ratio for W1T0225 was 2.24,
indicating that a new teacher who received regular supportive communication from a principal or
other administrators during their first year of teaching was 2.24 times as likely to still be teaching
in year two compared to a new teacher who did not receive regular supportive communication
from a principal or other administrators during their first year of teaching. The odds ratio for
W1T0223 was 1.38, indicating that a new teacher who received seminars or classes for
beginning teachers during their first year of teaching was 1.38 times as likely to still be teaching
in year two compared to a new teacher who did not receive seminars or classes for beginning
teachers during their first year of teaching. The odds ratio for W1T0224 was 1.27, indicating that
a new teacher who received extra classroom assistance (e.g., teacher aide) during their first year
of teaching was 1.27 times as likely to still be teaching in year two compared to a new teacher

114
who did not receive extra classroom assistance (e.g., teacher aide) during their first year of
teaching. The remaining three variables each resulted in odds ratios less than one, which implies
that new teachers receiving each of the three induction components (W1T0221 – reduced
teaching schedule, W1T0222 – Common planning time, and W1T0226 – ongoing feedback from
a master or mentor teacher) were less likely to still be teaching in year two compared to teachers
who did not receive each of the induction components (see Table 23).
Since the presence of extra classroom assistance did not have a meaningful association to
new teacher employment status in year two and most induction programs rarely incorporate only
one component, odds ratios and probabilities were calculated for all combinations of the
remaining four variables (W1T0220, W2MNTYN, W1T0225, and W1T0223) holding the other
four variables (W1T0221, W1T0222, W1T0224, and W1T0226) to a response of not being
present. According to the model, new teachers who responded “no” to all eight variable
questions had a 68.94% probability of still teaching in year two. According to the U.S.
Department of Education statistics, 15.28% of teachers leave each year, which extrapolates to
71.77% still teaching after two years, which is similar to the predicted value from the model.
The various combinations of induction, mentoring, and induction components resulted in
probabilities ranging from 75.36% to 95.32% (see table 24). The mentoring component resulted
in the largest single probability with 82.28% of new teachers likely to continue teaching in year
two if they had a mentor during their first year of teaching. The combination of an induction
program with a mentor resulted in an 86.84% probability of still teaching in year two, while
adding regular supportive communication with a principal or administrator to this pair of
components raised the probability to 93.66%. An induction program incorporating a mentor,
supportive communication, and seminars for new teachers has a predicted probability of 95.32%

115
of new teachers still teaching in year two. Recall that these same four variables had consistently
meaningful associations to employment status in the chi square analyses.
Year Three New Teacher Employment Status. The unadjusted for predicting year-
three employment status using the eight variables (W2MNTYN and W1T0220-W1T0226) was
0.97 with a sample size of 1631 unweighted and 148690.2 weighted. The percent concordant was
60.3, the percent discordant was 36.0, and the percent tied was 3.7 with 313,984 pairs. The odds
ratio for W1T0220 was 1.36, indicating that a new teacher who participated in an induction
program during their first year of teaching was 1.36 times as likely to still be teaching in year
three compared to a new teacher who did not participate in an induction program during their
first year of teaching. The odds ratio for W2MNTYN was 2.42, indicating that a new teacher
who was assigned a mentor teacher during their first year of teaching was 2.42 times as likely to
still be teaching in year three compared to a new teacher who did not have a mentor during their
first year of teaching. The odds ratio for W1T0225 was 2.04, indicating that a new teacher who
received regular supportive communication from a principal or other administrators during their
first year of teaching was 2.04 times as likely to still be teaching in year three compared to a new
teacher who did not receive regular supportive communication from a principal or other
administrators during their first year of teaching. The odds ratio for W1T0223 was 1.77,
indicating that a new teacher who received seminars or classes for beginning teachers during
their first year of teaching was 1.77 times as likely to still be teaching in year three compared to a
new teacher who did not receive seminars or classes for beginning teachers during their first year
of teaching. The odds ratio for W1T0224 was 1.06, indicating that a new teacher who received
extra classroom assistance (e.g., teacher aide) during their first year of teaching was 1.06 times
as likely to still be teaching in year three compared to a new teacher who did not receive extra

116
classroom assistance (e.g., teacher aide) during their first year of teaching. The remaining three
variables each resulted in odds ratios less than one, which implies that new teachers receiving
each of the three induction components (W1T0221 – reduced teaching schedule, W1T0222 –
Common planning time, and W1T0226 – ongoing feedback from a master or mentor teacher)
were less likely to still be teaching in year three compared to teachers who did not receive each
of the induction components (see Table 25).
Since the presence of extra classroom assistance did not have a meaningful association to
new teacher employment status in year three and most induction programs rarely incorporate
only one component, odds ratios and probabilities were calculated for all combinations of the
remaining four variables (W1T0220, W2MNTYN, W1T0225, and W1T0223) that, according to
the model, improved the odds of remaining in teaching in year three. According to the model,
new teachers who responded “no” to all four variable questions had a 62.29% probability of still
teaching in year three. According to the U.S. Department of Education statistics, 15.28% of
teachers leave each year, which extrapolates to 60.81% still teaching after three years, which is
again similar to the predicted value from the model.
The various combinations of induction, mentoring, and induction components resulted in
probabilities ranging from 69.26% to 95.16% (see table 26). Once again, the mentoring
component resulted in the largest single probability with 80.00% of new teachers likely to
continue teaching in year three if they had a mentor during their first year of teaching. The
combination of an induction program with a mentor resulted in an 84.51% probability of still
teaching in year three, while adding regular supportive communication with a principal or
administrator to this pair of components raised the probability to 91.76%. An induction program
incorporating a mentor, supportive communication, and seminars for new teachers has a
117
predicted probability of 95.16% of new teachers still teaching in year three. Recall that these
same four variables had consistently meaningful associations to employment status in the chi
square analyses.
Summary
Results from the two-way frequencies and chi square analyses are consistent with the
results obtained from the logistic regression model. Whether modeling all 15 variables or just the
induction variables plus the presence of a mentor or not, regular supportive communication with
a principal or other administrator (W1T0225) and the presence of an induction program
(W1T0220) always resulted in increases to the probability of teaching in both years. Similarly,
both variables had consistently meaningful associations to employment status in both years.
Providing seminars or classes for new teachers (W1T0223) had meaningful associations to
employment status while also increasing the predicted probability of teaching in the logistic
regression model for both years. While (W2MNIMP) the perceived amount of improvement to
overall teaching skills attributed to the influence of a mentor teacher during the first year of
teaching was left out of the logistic regression model to allow for the testing of the presence of a
mentor, it had consistently meaningful associations to employment status and increases to the
predicted probability of still teaching in both years. The frequency with which mentors observed
new teachers (W2MNOBS) entered the model in both years but did not increase the probability
of still teaching in either year, while the frequency with which new teachers met with their
mentor during the first year of teaching (W2MNFREQ) only entered the model for year three,
with each increasing level of frequency resulting in a new teacher being 1.44 times as likely to
still teach in year three. However, allowing W2MNTYN (the presence of a mentor) into the

118
models instead of the mentoring component variables resulted in much larger odds ratios for
years two and three teacher employment status (2.09 and 2.42 respectively).
The results of the logistic regression analysis suggest that new teachers who participate in
an induction program during their first year of teaching that includes a mentor, regular
supportive communication with their principal or administrators, and seminars or classes for new
teachers are 9.17 times more likely to still be teaching in year two and 11.91 times more likely to
still be teaching in year three compared to new teachers who did not have any form of induction.
If educational policy makers wish to create a new teacher induction program with the highest
probability of retaining teachers into their second and third years of teaching, they should create
programs that include mentors, seminars and classes for new teachers, and regular supportive
communication with the teachers’ principals, department chairs, or other administrators.
119
Chapter 5
Discussion
This study utilized one-way frequencies, chi square tests of association, and logistic
regression to provide information that could identify factors that affect new teacher retention.
This study used the Beginning Teacher Longitudinal Study (BTLS) 2012 preliminary dataset,
which is a nationally representative sample collected by the United States Department of
Education in conjunction with the National Center for Education Statistics (NCES) through a
series of surveys. The surveys involved were the 2007-08 Schools and Staffing Survey (SASS),
the 2008-09 Teacher Follow-up Survey (TFS), and the 2009-2010 BTLS survey.
Research shows that 50% of teachers leave the profession within their first five years of
teaching. Research also indicates that participating in an effective new teacher induction program
with an experienced mentor correlates with higher retention rates. The ability to identify which
aspects of an induction program and which characteristics of mentors influence new teachers’
decision to remain in teaching would help with the creation of induction programs that are more
effective at lowering attrition rates. Therefore, factors related to the presence of an induction
program and its specific components were analyzed along with factors related to the presence of
a mentor and specific mentor traits in order to determine which factors correlated most with
lower teacher attrition.
Summary
A thorough review of the literature revealed nine important components for an effective
induction program with an experienced mentor being the most important of the nine. Every
source agreed that an experienced mentor was essential, and most added the stipulation that the
mentor needed to teach in the same subject area as their mentees even though the analysis of the
120
NCES data did not support this additional component as being effective at lowering attrition
rates. Nearly two-thirds of the sources listed sustained professional development and
collaborating with others as essential, while half stated a need for a supportive principal or
administrator. Nearly half of the sources thought observations were key, while only a third stated
the importance of giving new teachers release time or a reduced teaching schedule in order to
facilitate time to spend at seminars and with their mentors. It is likely that more sources felt this
was essential but did not list it explicitly because they felt it was an assumed necessity when
providing seminars and other things that require time outside of the classroom. Only 25% of the
sources cited networking with outside organizations in their lists of effective components, while
nearly two-thirds of the effective programs examined included some form of networking with an
outside organization. This discrepancy is most likely because a large proportion of successful
programs are communal in nature with outside organizations already officially linked to the
programs from the inception.
A thorough review of the literature also revealed a list of very popular induction
programs. Regardless of their reported retention rates, most experts consider a few induction
programs to be among the best. The California Beginning Teacher Support and Assessment
(BTSA) is one of the biggest programs and most successful at retaining teachers. Although
retention rates vary from district to district, they still maintain a statewide average retention rate
of 93%. The Lafourche parish FIRST program in Louisiana is another of the best programs in
existence, according to the literature. Their average retention rates have stayed above 90% for
the last two decades. The Flowing Wells program in Arizona is so successful that they provide
yearly training seminars where they teach other school administrators how to implement the

121
program into their own schools. These are just a few of the more widely known programs that
the literature cites as effective.
All of the successful programs investigated in this report had experienced mentors,
sustained professional development, support from the administration, and collaboration with
other teachers. Over three-fourths of the programs also included opportunities for new teachers
to observe good teaching practices as well as opportunities to be observed teaching themselves.
Additionally, half of the programs explicitly listed release time or reduced teaching loads for
new teachers and/or the mentors. It is surprising that release time was not cited more often, but it
could be far more common than it would seem on the surface. It may be possible that some form
of release time is assumed necessary in order to facilitate various aspects of the induction
programs, and therefore, it is not explicitly listed by more sources. Networking with outside
organizations was far more prevalent in the effective programs than it was in the lists of
suggested components. This could be because most effective induction programs began in
partnerships with outside agencies. Therefore, a strong relationship with an outside agency was
part of the program design from day one.
The types of induction programs are almost as varied as the teachers that go through them
each year. The effective ones tend to have similar components and themes that agree with the
majority of what the literature suggests. “The best professional development programs allow
teachers to observe others, to be observed by others, and to be part of groups in which teachers
share together, grow together, and learn to respect one another’s work” (Wong, 2003, p. 47).
Other than the slight differences in relative frequencies, the literature seems to agree with the list
of effective induction program components gathered in this study. The relative frequencies of the
components are higher in the effective programs than they are in the lists of suggested

122
components, which is understandable. If the list of components in the literature contribute to
effectiveness, it would be logical that effective programs would have a higher percentage of the
components in their induction programs.
The investigation of the frequencies of BTLS participants who were still teaching in
subsequent years showed significant differences among some groups. Participants who indicated
they did not have an induction program in their first year of teaching left the profession at
roughly twice the rate of those having an induction program during their first year. Additionally,
those who stated they did not have seminars (W1T0223) or regular supportive communication
with their administrators (W1T0225) left teaching in both years at roughly twice the rate as those
having either program characteristic. Further analysis utilizing chi square tests of association
revealed a strong association between the presence of an induction program with seminars and
supportive communication and teacher status in the second and third years of teaching.
Investigation of the influence of mentors revealed similar results to those obtained from
the induction variables. A 2006 report by MetLife found that “having a mentor during the first
year of teaching significantly increases the odds that a teacher will stay in the profession” (p. 77),
which agrees with the results of this study. In this study, the respondents who indicated not
having a mentor left teaching in both years at more than twice the rate of those having a mentor.
Assuming an experienced mentor would help teachers improve their teaching skills more than a
mentor without proper training, W2MNIMP implies that training helped as well. Respondents
who stated their mentor helped increase their teaching skills at high levels left in both years at
half the rate of those who indicated low levels of improvement. Additionally, those having both
induction and mentoring left at nearly a third the rate of those who reported having neither.
Further chi square tests of association verified the hypothesized associations between mentoring

123
and retention. Effect sizes revealed the strongest relationships between teacher status and level of
teaching improvement (W2MNIMP), frequency with which they met (W2MNFRQ), teaching the
same subject (W2MNSUB), and having a mentor or not (W2MNTYN).
The results of the logistic regression analysis suggest that new teachers who participate in
an induction program during their first year of teaching (W1T0220) that includes a mentor
(W2MNTYN), regular supportive communication with their principal or administrators
(W1T0225), and seminars or classes for new teachers (W1T0223) are 9.17 times more likely to
still be teaching in year two and 11.91 times more likely to still be teaching in year three
compared to new teachers who did not have any form of induction. Teachers who receive this
type of induction program have a 95.32% predicted probability of remaining in teaching in year
two and a 95.16% predicted probability of remaining in teaching in year three. Without any of
these four support mechanisms, the likelihood of a new teacher remaining in the profession after
year two or year three is 69% and 62%, respectively. Thus the implementation of the four
induction-related support components can result in 53% increase in the probability that a teacher
will remain in the profession for three years. If educational policy makers wish to create a new
teacher induction program with the highest probability of retaining teachers into their second and
third years of teaching, they should create programs that include mentors, seminars and classes
for new teachers, and regular supportive communication with the teachers’ principals,
department chairs, or other administrators.
“The weight of accumulated evidence clearly shows that traditional sink-or-swim
induction contributes to high attrition and to lower levels of teacher effectiveness” (NCTAF,
1996, p. 40). According to the Baccalaureate and Beyond Longitudinal Study, teachers who did
not participate in an induction program in their schools or districts were nearly twice as likely to

124
leave the classroom (26%) as those who participated in such a program (15%). The fourth annual
50 state report by education week, Quality Counts 2000, reported similar findings for teachers in
their first three years of teaching. It would appear that effective induction contributes to lower
attrition rates, and in order for an induction program to have the best chance of being effective, it
should include an experienced mentor that teaches the same subject area as their mentees.
Effective induction programs also need sustained, personalized professional development
throughout the first three years of teaching so new teachers can continue to grow and hone their
craft. New teachers must have opportunities to observe good teaching practices, and they
themselves need to receive constructive feedback after being observed teaching. Providing
opportunities to collaborate with other novice or veteran teachers is essential, and having
collaborators from their same subject area and grade level whenever possible is also beneficial.
Finally yet importantly, an effective induction program must have the support of the other
teachers, the principal and administrators, the school district, and even the parents. “The
successful induction of beginning teachers, it is now widely recognized, is a vital link in what
should be a career-long continuum of professional development, [and] the first couple of years
on the job seem to set the tone” (Glassford & Salinitri, 2007, p. 2). A 2002 report from Education
Week ranked states with the most improved teacher quality, and nine of the top 10 states on the
list require and finance some form of new teacher induction.
Implications for Practice
The purpose of this study was to supplement the lack of literature on evaluations of
induction program effectiveness as it pertains to reducing attrition rates. With the impending
exodus of Baby-Boomer teacher retirees, education leaders and administrators need to focus on
the retention of new teachers. Research shows that roughly 50% of new teachers leave the

125
profession within their first five years of teaching, and effective induction programs can help cut
attrition rates in half. Based on the literature review and the results of this study, any school that
wishes to lower their attrition rates should implement an effective induction program.
This study confirmed the results of the literature on teacher induction and its potential
impact on teacher attrition rates – teachers who participate in effective induction programs tend
to remain in the teaching profession at a higher rate than those who do not (Henke, et al., 2000;
Ingersoll & Kralik, 2004; Ingersoll & Smith, 2003; Metropolitan Life, 1991, 2005, 2006, 2008;
NCTAF, 1996, 2003, 2007; Odell & Ferraro, 1992; Smith & Ingersoll, 2004). Educational
leaders must utilize research-based induction programs to improve retention of new teachers,
while collecting many quality data to help determine what does and does not work.
Limitations
The results of this study are limited to elementary and secondary public school teachers.
The results of this study should not be generalized to private, BIE, charter or non-traditional
schools. The largest limitation in this study is the lack of control over survey questions. More
detailed follow-up questions on induction and mentoring specifics could help to answer many
unanswered research questions. Additionally, more questions addressing specifically why
teachers left the profession would help to determine how to keep them from leaving. The sample
size is large enough to allow for generalizability to the larger population of United States public
schools, but the sample size drops drastically if you try to look at more specific groups of
teachers like elementary math or secondary science etc.
Although this study presents evidence of strong correlations between types of induction
and retention rates, it is unable to show that induction causes increases in retention. According to
Rockoff (2008, p. 2), “nearly all published and unpublished evaluations of mentoring programs

126
have used research methodologies that fall short of providing credible estimates of the causal
impacts of mentoring,” and this study is unfortunately no different.
Recommendations for Further Research
The research conducted for this study contributes to the body of research on new teacher
retention through quality induction. Although numerous previous studies have examined the
various induction programs offered throughout the United States, few have tried to determine
what components the effective programs have in common or how those components might
influence retention rates. It is the hope of this researcher that this study will initiate ideas for
future research to improve the induction of new teachers.
According to Ingersoll & Kralik, “there is need for assessment of the existing empirical
research on teacher induction and mentoring in order to determine its scope and merit, and the
conclusions that may be drawn from it” (2004, p. 4). “Rather than identifying the prevalence of
induction support, future research should endeavor to assess program quality and guide educators
in the provision of valuable induction for new teachers” (Winstead Fry, 2007, p. 216). “Since the
presence of induction may not be enough to reduce attrition rates, research needs to move
beyond determining the prevalence of induction and begin to assess form and quality” (Winstead
Fry, 2007, p. 218). “To inform mentoring policy and practice, we need more direct studies of
mentoring and its effects on teaching and teacher retention” (Feiman-Nemser, 1996, p. 3). In
addition to the suggestions supported by other researchers, this study also suggests:
Further research should be conducted and thoroughly analyzed on sustained support
using induction programs that continue the professional development of new teachers
beyond the first year of teaching.

127
Further research is recommended on what makes a good mentor and how to pair new
teachers with compatible mentors.
Conduct a mixed methods study using a small sample of teachers from different school
systems to get a better understanding of the relationship between school size, subjects
taught, socioecomonic status (SES), teacher demographics, induction program
components, and new teachers’ intentions to remain in the profession. A mixed methods
design is truly needed to determine “why” a factor influenced a teacher’s decision to
leave or stay.
Conduct a study to identify which induction program components contribute the most
towards new teachers’ level of satisfaction with their jobs.
More in depth analysis of the NCES data set to determine if induction programs and
associated components have varying effects on teachers in different subject areas and
grade levels.
More in depth analysis of the NCES data set to determine if licensure paths, school sizes
and locations, and other demographic details influence the effectiveness of induction
programs.
A final recommendation is to conduct a study to identify which induction program
components contribute the most towards new teachers’ level of teaching effectiveness by
tracking student improvement as well as self-reported feelings of increased skills and
peer evaluations.
Any of these recommendations could help create a clearer picture of why teachers leave the
profession, why teachers decide to stay, and what education leaders can do to keep more of the
best and brightest in classrooms.

128
Conclusion
After a thorough review of the literature and the results of this study, it is clear that there
are induction programs that contribute to the lowering of new teacher attrition rates. It is also
clear that teachers who do not receive support in the first years are more likely to leave the
profession. “Turnover in the first few years is particularly high because new teachers are
typically given the most challenging teaching assignments and left to sink or swim with little or
no support” (NCTAF, 1996, p. 39). Although a “one-size-fits-all” mentality towards induction
programs would not work, there are certain aspects that every program could and should share.
“The best professional development programs allow teachers to observe others, to be observed
by others, and to be part of groups in which teachers share together, grow together, and learn to
respect one another’s work” (Wong, 2003, p. 47).
Finding and utilizing the right mentor is paramount to the success of almost any induction
program. “Mentoring is an integral component of an effective and sustained induction program, a
one-on-one process where an experienced teacher helps guide, advise and support a new teacher”
(Shakrani, 2008, p. 3). “Mentoring is an important strategy for retaining new teachers and for
career-long, teacher-to-teacher professional development as a method of capturing the wisdom
that comes with experience” (Metropolitan Life, 2008, p. 144). However, just assigning anyone
to be a mentor is not enough.
Successful mentors need extra training in order to be effective. Mentors should receive
high quality training before they begin, and they should remain in contact with other mentors in
order to share experiences and offer useful tips and strategies (Holloway, 2001). Most experts
agree that mentors should have experience teaching the same subject area and grade level as their
mentees. Teaching in the same grade and/or subject area allows for more in depth discussions, of

129
effective instructional strategies, important standards to cover, and classroom management issues
(Wayne, Youngs, & Fleischman, 2005). Additionally, “mentors should be allowed time to
observe the novice” (Renard, 2003, p. 63). “It is also beneficial to arrange for the novice teacher
to observe his or her mentor as well as other teachers throughout the school” (Arnold-Rogers et
al., 2008, p. 19). However, none of this can happen if new teachers are not given appropriate
scheduling to allow for extra time spent on induction program related activities. New teachers
“need sympathetic timetabling and—ideally—a lower overall amount of teaching; again, this
kind of general principle has long been established in the school sector” (Cunningham, 2007, p.
89).
Policies begin at the top, so there must be a strong sense of support for both the new
teachers and the induction process itself from the principal and administrators. If those at the top
do not buy in to the principle of the induction process initiated in their schools or districts, then
the program is destined to fail. “Induction must be a structured training process coupled with an
ongoing process of support from the school site administrators, staff developers, mentors, and
teachers” (Wong, 2001, p. 2).
Some of the more popular programs illustrate several features of effective induction
programs: the creation of cohort groups allows novice teachers to collaborate with other
beginners to solve problems and develop a sense of community with others in similar
circumstances; opportunities for beginning teachers to observe and be observed by skilled
veterans develops good teaching skills while fostering a sense of collegiality and continual
learning; opportunities for mentors to discuss their practice with novices allows them to make
their thought processes explicit; pairing new teachers with mentors of the same grade level or
subject enables new teachers to pursue specific questions about content; and regular supportive

130
communication with their administrators fosters a sense of belonging and a career-long yearning
for continued professional development. It is clear that paying careful attention to how we
nurture novice teachers through induction programs during their first few years of on-the-job
training will lead to higher retention rates, more effective teaching skills learned earlier, and far
better learning outcomes for the students in their classrooms, clear through to the end of their
careers.
131
References
Alliance for Excellent Education. (2005). Teacher attrition: A costly loss to the nation and to the
states. Washington, DC: Retrieved from http://www.all4ed.org/files/archive/publications
/TeacherAttrition.pdf.
Andrews, R., & Carr, D. (2004). Transformation and the quest for excellence:
Professionalization of a teacher preparation program at the University of Missouri.
Educational Perspectives, 36(1-2), 34-41.
Arends, R., & Rigazio-DiGilio, A. (2000, July). Beginning teacher induction: Research and
examples of contemporary practice. Paper presented at the Annual Meeting of the Japan-
United States Teacher Education Consortium (JUSTEC), Tokyo, Japan.
Arnold-Rogers, J., Arnett, S., & Burris Harris, M. (2008). Mentoring new teachers in Lenoir
City, Tennessee. Delta Kappa Gamma Bulletin, 74(4), 18-23.
Berry, B., Montgomery, D., Curtis, R., Hernandez, M., Wurtzel, J., & Snyder, J. (2008). Creating
and sustaining urban teacher residencies: A new way to recruit, prepare, and retain effective
teachers in high-needs districts. The Aspen Institute & Center for Teaching Quality.
Breaux, A., & Wong, H. (2003). New teacher induction: How to train, support, and retain new
teachers. Mountain View, CA: Harry K. Wong Publications, Inc.
Brewer, R. (2004). Teaching teachers through induction. (Doctoral dissertation, Dallas Baptist
University): Retrieved from http://www.eric.ed.gov/PDFS/ED493411.pdf.
Brock, B., & Grady, M. (1996, August). Beginning teacher induction programs. Paper presented
at the Annual Meeting of the National Council of Professors in Educational Administration,
Corpus Christi, TX.
California Commission of Teacher Credentialing. (1992). Success for beginning teachers. The
California new teacher project 1988-92. Sacramento: California State Department of
Education.
California Mathematics Project Supporting Teachers to Increase Retention (CMP STIR). (2006).
CMP STIR About. Retrieved from CMP STIR: http://cmpstir.cmpso.org/home
Cherubini, L. (2007, Fall). Speaking up and speaking freely: Beginning teachers' critical
perceptions of their professional induction. The Professional Educator, 29(1), 1-12.
Ciriza, F. (2005). Making each new teacher our responsibility program (MENTOR) end-of-year
report. El Paso, TX. Retrieved from http://www.eric.ed.gov/PDFS/ED490615.pdf: El Paso
Independent School District.
Colbert, J., & Wolff, D. (1992). Surviving in urban schools: A collaborative model for a
beginning teacher support system. Journal of Teacher Education, 43(3), 193-199.

132
Connecticut State Department of Education. (2008). Report of the Beginning Educator Support
and Training Program (BEST)/Mentor Assistant Program (MAP) Task Force. Retrieved
from: http://www.sde.ct.gov/sde/lib/sde/pdf/commish/BEST_MAP_TaskForceReport.pdf.
Cunningham, B. (2007). All the right features: Towards an ‘architecture’ for mentoring trainee
teachers in UK further education colleges. Journal of Education for Teaching, 33(1), 83-97.
Curran, B., & Goldrick, L. (2002). Mentoring and supporting new teachers. Issue Brief. New
York: Carnegie Corporation.
Darling-Hammond, L. (Ed.). (1994). Professional development schools: Schools for developing
a profession. New York, NY: Teachers College Press.
Darling-Hammond, L., & Berry, B. (Summer, 1999). Recruiting teachers for the 21st century:
The foundation for educational equality. The Journal of Negro Education, 68(3), 254-279.
Darling-Hammond, L., Gendler, T., & Wise, A. (1990). The Teaching internship: Practical
preparation for a licensed profession. Santa Monica, CA: RAND Corporation.
Davis, B., & Field Waite, S. (Fall, 2006). The Long-Term effects of a public school/state
university induction program. The Professional Educator, 28(2), 1-10.
DeBolt, G. (1991, April). Mentoring: Studies of effective programs in education. Paper presented
at the Diversity in Mentoring Conference, Chicago, IL. Retrieved from
http://www.eric.ed.gov/PDFS/ED346166.pdf.
Delisio, E. (2011, November 18). Portfolios Help Teachers Reflect on What Makes Good
Teaching. Retrieved from: http://www.educationworld.com/a_admin/admin/admin201.shtml
Eberhard, J., Reinhardt-Mondragon, P., & Stottlemyer, B. (2000). Strategies for new teacher
retention: Creating a climate of authentic professional development for teachers with three
or less years of experience. Corpus Christi: Texas A&M University Corpus Christi South
Texas Research and Development Center.
Feiman-Nemser, S. (1996). Teacher mentoring: A Critical review ERIC Digest ED 397 060.
ERIC Clearinghouse on Teaching and Teacher Education, 1-6.
Feiman-Nemser, S., & Parker, M. (Spring, 1992). Mentoring in context: A Comparison of two
U.S. programs for beginning teachers. NCRTL Special Report. East Lansing, MI: National
Center for Research on Teacher Learning.
Flowing Wells School District. (2011). Induction & Mentoring Brochure. Retrieved from
http://www.flowingwellsschools.org/index.cfm?pID=183
Ganser, T. (1995, April). A Road map for designing quality mentoring prgroams for beginning
teachers. Paper presented at the Annual Conference of the Wisconsin Association for Middle
Level Education, Stevens Point, WI.

133
Glassford, L., & Salinitri, G. (2007). Designing a successful new teacher induction program: An
assessment of the Ontario Experience, 2003-2006. Canadian Journal of Educational
Administration and Policy, 60, 1-34.
Graham, S., Parmer, R., Chambers, L., Tourkin, S., & Lyter, D. (2011). Documentation for the
2008–09 Teacher Follow-up Survey (NCES 2011-304). Washington, DC: U.S. Department of
Education National Center for Education Statistics. Retrieved from
http://nces.ed.gov/pubsearch.
Gratch, A. (1998, January). Growing teaching professionals: Lessons taught by first-year
teachers. Paper presented at the Annual Conference on Qualitative Research in Education,
Athens, GA.
Hanusheck, E. (1992). The trade-off between child quantity and quality. Journal of Political
Economy, 100, 84-117.
Hanusheck, E., & Rivkin, S. (2004). How to improve the supply of high quality teachers. In D.
Ravitch (Ed.), Brookings Papers on Education Policy (pp. 7-25). Washington, DC:
Brookings Institution Press.
Hatch, J. (2002). Doing qualitative research in education settings. Albany, NY: State University
of New York Press.
Henke, R., Chen, X., & Geis, S. (2000). Progress through the teacher pipeline: 1992–93 college
graduate and elementary/secondary school teaching as of 1997. U.S. Department of
Education, National Center for Education Statistics (NCES), Washington, DC.
Hollander, R., & Scharff, N. (2002). A Precarious balance: How can we help support new
teachers? Retrieved from http://teachersnetwork.org/TNLI/research/prep/Hollander_Scharff
/newteachersupport.htm
Holloway, J. (2001). The benfits of mentoring. Educational Leadership, 58(8), 85-86.
Huling-Austin, L. (Ed.). (1989). Assisting the beginning teacher. Reston, VA: Association of
Teacher Educators.
Huling-Austin, L., & Murphy, S. (1987, April). Assessing the impact of teacher induction
programs: Implications for program development. Paper presented at the Annual Meeting of
the American Educational Research Association, Washington, D.C.
Ingersoll, R., & Kralik, J. (2004). The impact of mentoring on teacher retention: What the
research says. Denver, CO: Education Commission of the States. Retrieved from
http://www.ecs.org/html/Document.asp?chouseid=5036.
Ingersoll, R., & Rossi, R. (1995, December). A tally of teacher turnover. Education Digest, 61(4).
Ingersoll, R., & Smith, T. (2003). The wrong solution to the teacher shortage. Educational
Leadership, 60(8), 30-33.
134
Ingersoll, R., & Smith, T. (2004). Do teacher induction and mentoring matter? NAASP Bulletin,
88(638), 28-40.
Kaiser, A. (2011). Beginning Teacher Attrition and Mobility: Results From the First Through
Third Waves of the 2007–08 Beginning Teacher Longitudinal Study (NCES 2011-318).
Washington, DC: U.S. Department of Education National Center for Education Statistics.
Retrieved August 2011 from http://nces.ed.gov/pubsearch.
Karge, B., & Freiberg, M. (1992, April). Beginning special education teachers: At risk for
attrition. Paper presented at the Annual Meeting of the American Educational Research
Association, San Francisco, CA.
King Rice, J. (2003). Teacher quality: Understanding the effectiveness of teacher attributes.
Washington, DC: Economic Policy Institute.
Kirk, R. (1995). Experimental design: Procedures for the behavioral sciences. Pacific Grive,
CA: Brooks/Cole Publishing Company.
Konanc, M. (1996). Teacher attrition 1980-1996. Statistical notes no. 002. Raleigh, NC: North
Carolina State Department of Public Instruction.
Lippman, L. (2003). New teacher induction program: Islip School District: Islip, New York.
Retrieved January 20, 2012, from Teachers.net: http://teachers.net/wong/JAN11/
Islip%20New%20Teacher%20Induction%20Program.pdf
Looney, J. (1997, February). Mentoring the beginning teacher: A study of influencing variables.
Paper presented at the 30th Annual Meeting of the Eastern Education Research Association,
Hilton Head, SC.
Marso, R., & Pigge, F. (1990, February). Teacher mentor induction programs: An assessment by
first-year teachers. Paper presented at the Annual Meeting of the Association of Teacher
Educators, Las Vegaas, NV.
McConney, A., & Maor, D. (2009). The Evaluation of a pilot mentoring program for beginner
science and mathematics teachers: Summative project evaluation report. Retrieved from
http://www.eric.ed.gov/PDFS/ED505169.pdf.
McNeil, M., Wood, A., Kurtz, P., Thousand, J., & Nevin, A. (2006, November). Accelerating the
professionalization of beginning teachers. Paper presented at the Annual Meeting of Teacher
Education Division (TED), Council for Exceptional Children (CEC), San Diego, CA.
Metropolitan Life. (1991). The American Teacher, 1991. The First Year: new teachers'
Expectations and Ideals. A Survey of New Teachers Who Completed Their First Year of
teaching in Public Schools in 1991. The Metropolitan Life Survey. New York, NY: Metlife.
Metropolitan Life. (2005). The MetLife survey of the American teacher: Transitions and the role
of supportive relationships, 2004-2005. A survey of teachers, principals and students. New
York, NY: Metropolitan Life Insurance company.

135
Metropolitan Life. (2006). The MetLife survey of the American teacher: Expectations and
experiences. A survey of teachers, principals and leaders of college education programs.
New York, NY: Metropolitan Life Insurance company.
Metropolitan Life. (2008). The MetLife survey of the American teacher: Past, present and future.
A Survey of teahers, principlas and students. 25th Anniversary edition. New York, NY:
Metropolitan Life Insurance Company.
Moir, E., & Gless, J. (Winter, 2001). Quality induction: An investment in teachers. Teacher
Education Quarterly, 28(1), 1-8.
Morgan, D. (2007). Paradigms lost and pragmatism regained: Methodological implications of
combining qualitative and quantitative methods. Journal of Mixed Methods Research, 1(1),
48-76.
Morgan, M., & Kritsonis, W. (2008). A National focus: The recruitment, retention, and
development of quality teachers in hard-to-staff schools. Doctoral forum: National journal
for publishing and mentoring doctoral student research, 5(1), 1-7.
Murnane, R., Singer, J., Willett, J., Kemple, J., & Olsen, R. (Eds.). (1991). Who will. teach?:
Policies that matter. Cambridge, MA: Harvard University Press.
National Commision on Teaching and America's Future. (2003). No dream denied: A pledge to
America’s children. Washington, DC. Retrieved from http://www.nctaf.org/resources
/research_and_reports/nctaf_research_reports/.
National Commission on Teaching & America’s Future. (1996). What matters most: Teaching for
America’s future. New York, NY: National Commission on Teaching & America’s Future.
National Commission on Teaching and America's Future. (2007). Policy Brief: The high cost of
teacher turnover. Washington, DC. Retrieved from http://www.nctaf.org/resources
/research_and_reports/nctaf_research_reports/.
National Council on Teacher Quality. (2009, November). Best practices for teacher
effectiveness: How districts nationwide are stacking up. Retrieved February 14, 2012, from
Gates Foundation: http://www.gatesfoundation.org/united-states/Documents/best-practices-
teach-effectiveness.pdf
National Foundation for the Improvement of Education. (Fall, 1999). Creating a teacher
mentoring program. NFIE Teacher Mentoring Symposium, (pp. 1-16). Los Angeles, CA.
Retrieved from http://www.eric.ed.gov/PDFS/ED455230.pdf.
New York City Council Investigation Division. (2004). Teacher attrition and retention. New
York City: retrieved januray 2012 from: http://www.nyc.gov/html/records/pdf/govpub
/1024teachersal.pdf.
Odell, S., & Ferraro, D. (1992). Teacher mentoring and teacher retention. Journal of Teacher
Education, 43(3), 200-204.

136
Porter, A., & Brophy, J. (1988). Synthesis of research on good teaching: Insights from the work
of the Institute for Research on Teaching. Educational Leadership, 45(8), 74-85.
Quinn, R., & D'Amato Andrews, B. (2004). The struggles of first-year teachers: Investigating
support mechanisms. Clearing House, 77(4), 164-168.
Reichardt, C., & Cook, T. (1979). Beyond qualitative versus quantitative methods. In C.
Reichardt, & T. Cook (Eds.), Qualitative and quantitative methods in evaluation research
(pp. 7-32). Thousand Oaks, CA: Sage.
Renard, L. (2003). Setting new teachers up for failure... or success. Educational Leadership,
60(8), 62-64.
Ridenour, C., & Newman, I. (2004, October). Themes are not variables and mixed methods are
not a panacea for educational researchers. Paper presented at the annual meeting of the
Midwest Educational Research Association. Columbus, OH.
Rivkin, S., Hanusheck, E., & Kain, J. (2005). Teachers, schools, and academic achievement.
Econometrica, 73(2), 417-458.
Robinson, G. (1998, October). New teacher induction: A study of selected new teacher induction
models and common practices. Paper presented at the Annual Meeting of the Midwestern
Educational Research Association, Chicago, IL. Retrieved from http://www.eric.ed.gov
/PDFS/ED424219.pdf.
Rockoff, J. (2008, March). Does mentoring reduce turnover and improve skills of new
employees? Evidence from teachers in New York City. NBER Working Paper Series,
Working Paper(13868), 1-63.
Sanders, W., & Rivers, J. (1996). Cumulative and residual effects of teachers on future student
academic achievement. Research Progress Report. Knoxville: University of Tennessee
Value-Added Research and Assessment Center.
Schalock, H., & Schalock, M. (1993). Student learning in teacher evaluation and school
improvement: An introduction. Journal of Personnel Evaluation in Education, 7(2), 103-104.
Schlechty, P., & Vance, V. (1981). Do academically able teachers leave education? The North
Carolina case. Phi Delta Kappan, 63(2), 106-112.
Scott, N. (1999). Supporting new teachers: A Report on the 1998-99 Beginning Teacher
Induction Program in New Brusnwick. Retrieved from http://www.eric.ed.gov
/PDFS/ED437347.pdf.
Shakrani, S. (2008). Teacher turnover: Costly crisis, solvable problem. East Lansing, MI:
Education Policy Center Michigan State University. ED502130.
Smith, T., & Ingersoll, R. (2004, Fall). What are the effects of induction and mentoring on
beginning teacher turnover? American Educational Research Journal, 41(3), 681-714.

137
Smylie, M. (1994). Redesigning teachers' work: Connections to the classroom. In L. Darling-
Hammond (Ed.), Review of research in education, volume 20 (pp. 129-177). Alexandria, VA:
American Educational Research Association.
Snyder, T., & Dillow, S. (2011). Digest of Education Statistics 2010 (NCES 2011-015).
Washington, DC: National Center for Education Statistics, Institute of Education Sciences,
U.S. Department of Education.
Spuhler, L., & Zetler, A. (1995). Montana Beginning Teacher Support Program: Final report.
Helena: Montana State Board of Education.
Staiger, D., & Rockoff, J. (2010, Summer). Searching for effective teachers with imperfect
information. Journal of Economic Perspectives, 24(3), 97-118.
Strong, M. (2009). Effective teacher induction and mentoring: Assessing the evidence. New
York, NY: Teachers College Press.
Tourkin, S., Graham, S., Chambers, L., Strizek, G., Parmer, R., Jackson, B., . . . Kaiser, A.
(forthcoming). Documentation for the First Through Third Waves of the 2007–08 Beginning
Teacher Longitudinal Study (NCES 2011-319). U.S. Department of Education. Washington,
DC: National Center for Education Statistics.
Tourkin, S., Thomas, T., Swaim, N., Cox, S., Parmer, R., Jackson, B., . . . Zhang, B. (2010).
Documentation for the 2007–08 Schools and Staffing Survey (NCES 2010-332). Washington,
DC: U.S. Department of Education National Center for Education Statistics. Retrieved from
http://nces.ed.gov/pubsearch.
U.S. Department of Education, National Center for Education Statistics. (1999). Teacher quality:
A Report on the preparation and qualifications on public school teachers, NCES 1999-080.
by Laurie Lewis, Basmat Parsad, Nancy Carey, Nicole Bartfai, Elizabeth Farris, and Becky
Smerdon. Bernie Greene, project officer. Washington, DC.
U.S. Department of Education, National Center for Education Statistics. (2011a). Beginning
Teacher Longitudinal Study (BTLS). Retrieved from http://nces.ed.gov/surveys/btls/
U.S. Department of Education, National Center for Education Statistics. (2011b). Schools and
Staffing Survey (SASS). Retrieved from http://nces.ed.gov/surveys/sass/index.asp
U.S. Department of Education, National Center for Education Statistics. (2011c). The Teacher
Follow–up Survey (TFS). Retrieved from http://nces.ed.gov/surveys/sass/ovrv_whatstfs.asp
Villani, S. (2009). Comprehensive mentoring programs for new teachers (Second ed.). Thousand
Oaks, CA: Corwin: A Sage Company.
Wayne, A., Youngs, P., & Fleischman, S. (2005). Improving teacher induction. Educational
Leadership, 62(8), 76-78.

138
Wildman, T., Magliaro, S., & Niles, J. (1992). Teacher mentoring: An analysis of roles,
activities, and conditions. Journal of Teacher Education, 43(3), 212.
Wilkinson, G. (1994). Support for individualizing teacher induction. Action in Teacher
Education, 16(2), 52-61.
Winstead Fry, S. (2007). First-year teachers and induction support: Ups, downs, and in-between.
The Qualitative Report, 12(2), 216-237.
Wong, H. (2001, June 15). Induction: Helping new teachers reach their maximum potential.
Retrieved from http://www.newteacher.com/upapers/061501_b.html
Wong, H. (2003). Induction programs that keep working. In M. Scherer (Ed.), Keeping good
teachers (pp. 42-49). Alexandria, VA: Association for Supervision & Curriculum
Development.
Wong, H. (2004). Induction programs that keep new teachers teaching and improving. NASSP
Bulletin, 88(638), 41-58.
Wong, H. (2005). New teacher induction: The foundation for comprehensive, coherent, and
sustained professional development. In H. Portner (Ed.), New Teacher Induction and
Mentoring: The State of the Art and Beyond (pp. 47-54). Thousand Oaks, CA: Corwin Press.
Retrieved from http://newteacher.com/pdf/CorwinGalley.pdf.
Wood, A. (Fall, 2001). What does research say about teacher induction and IHE/LEA
Collaborative Programs? Issues in Teacher Education, 10(2), 69-81.
Wood, A., & Stanulis, R. (2009). Quality teacher induction: Fourth-wave (1997-2006) induction
programs. The New Educator, 5(1), 1-23.
Wright, S., Horn, S., & Sanders, W. (1997). Teacher and classroom context effects on student
achievement: implications for teacher evaluation. Journal of Personnel Evaluation in
Education, 11, 57-67.
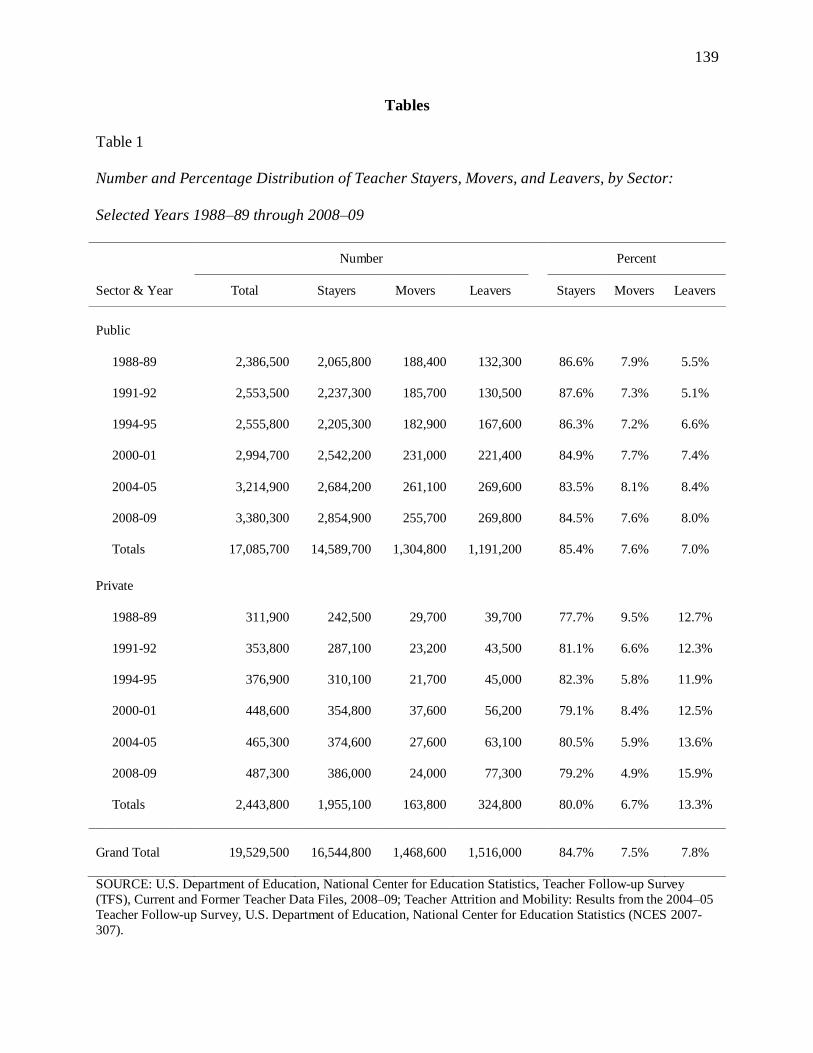
139
Tables
Table 1
Number and Percentage Distribution of Teacher Stayers, Movers, and Leavers, by Sector:
Selected Years 1988–89 through 2008–09
Sector & Year
Number Percent
Total Stayers Movers Leavers Stayers Movers Leavers
Public
1988-89
2,386,500 2,065,800 188,400 132,300
86.6% 7.9% 5.5%
1991-92
2,553,500 2,237,300 185,700 130,500
87.6% 7.3% 5.1%
1994-95
2,555,800 2,205,300 182,900 167,600
86.3% 7.2% 6.6%
2000-01
2,994,700 2,542,200 231,000 221,400
84.9% 7.7% 7.4%
2004-05
3,214,900 2,684,200 261,100 269,600
83.5% 8.1% 8.4%
2008-09
3,380,300 2,854,900 255,700 269,800
84.5% 7.6% 8.0%
Totals
17,085,700 14,589,700 1,304,800 1,191,200
85.4% 7.6% 7.0%
Private
1988-89
311,900 242,500 29,700 39,700
77.7% 9.5% 12.7%
1991-92
353,800 287,100 23,200 43,500
81.1% 6.6% 12.3%
1994-95
376,900 310,100 21,700 45,000
82.3% 5.8% 11.9%
2000-01
448,600 354,800 37,600 56,200
79.1% 8.4% 12.5%
2004-05
465,300 374,600 27,600 63,100
80.5% 5.9% 13.6%
2008-09
487,300 386,000 24,000 77,300
79.2% 4.9% 15.9%
Totals
2,443,800 1,955,100 163,800 324,800
80.0% 6.7% 13.3%
Grand Total 19,529,500 16,544,800 1,468,600 1,516,000 84.7% 7.5% 7.8%
SOURCE: U.S. Department of Education, National Center for Education Statistics, Teacher Follow-up Survey
(TFS), Current and Former Teacher Data Files, 2008–09; Teacher Attrition and Mobility: Results from the 2004–05
Teacher Follow-up Survey, U.S. Department of Education, National Center for Education Statistics (NCES 2007-
307).

140
Table 2
Number and Percentage Distribution of Public School Teacher Stayers, Movers, and Leavers, by
Selected Teacher and School Characteristics in Academic Year 2008-09
Number
Percent
Teacher or school characteristic Total Stayers Movers Leavers
Stayers Movers Leavers
Total 3,380,300 2,854,900 255,700 269,800
84.5% 7.6% 8.0%
School Type
Traditional Public 3,309,200 2,800,700 247,600 260,900
84.6% 7.5% 7.9%
Public Charter 71,100 54,200 8,100 8,900
76.2% 11.4% 12.5%
Base Salary
Less than $30,000 183,900 157,700 13,140 13,100
85.8% 7.1% 7.1%
$30,000 - $39,999 761,500 626,100 75,940 59,400
82.2% 10.0% 7.8%
$40,000 - $49,999 1,119,300 936,900 87,750 94,600
83.7% 7.8% 8.5%
$50,000 or more 1,315,700 1,134,200 78,830 102,600
86.2% 6.0% 7.8%
Gender
Male 762,000 642,900 59,210 59,900
84.4% 7.8% 7.9%
Female 2,618,300 2,212,000 196,460 209,900
84.5% 7.5% 8.0%
Race/Ethnicity
Caucasian, non-Hispanic 2,807,300 2,385,400 195,890 226,000
85.0% 7.0% 8.1%
African-American, non-Hisp 257,800 207,600 26,900 23,300
80.5% 10.4% 9.0%
Hispanic, regardless of race 232,200 194,500 24,800 12,900
83.8% 10.7% 5.6%
Asian/Pac Islander, non-Hisp 45,400 36,400 5,400 3,700
80.2% 11.9% 8.1%
Two or more races, non-Hisp 25,900 21,400 1,870 2,700
82.6% 7.2% 10.4%
Main assignment field
Early childhood/gen elem 1,102,000 958,900 81,130 61,900
87.0% 7.4% 5.6%
Special education 396,500 309,100 38,790 48,600
78.0% 9.8% 12.3%
Arts/music 212,800 188,100 15,890 8,800
88.4% 7.5% 4.1%
English/language arts 418,800 342,700 32,210 43,900
81.8% 7.7% 10.5%
Mathematics 276,200 236,400 18,470 21,300
85.6% 6.7% 7.7%
Natural sciences 198,600 166,700 14,100 17,800
83.9% 7.1% 9.0%
Social sciences 214,100 180,300 17,560 16,300
84.2% 8.2% 7.6%
Other 561,300 472,700 37,510 51,100
84.2% 6.7% 9.1%
SOURCE: U.S. Department of Education, National Center for Education Statistics, Teacher Follow-up Survey
(TFS), Current and Former Teacher Data Files, 2008–09; Teacher Attrition and Mobility: Results from the 2004–05
Teacher Follow-up Survey, U.S. Department of Education, National Center for Education Statistics (NCES 2007-
307).
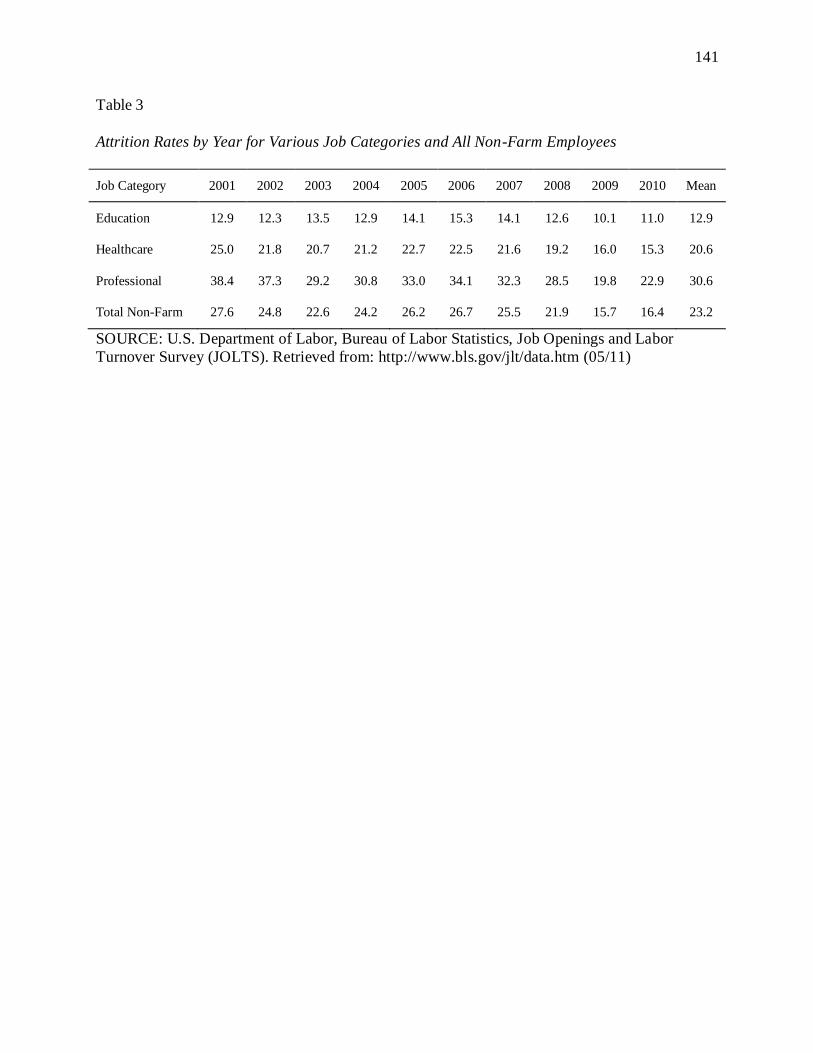
141
Table 3
Attrition Rates by Year for Various Job Categories and All Non-Farm Employees
Job Category 2001 2002 2003 2004 2005 2006 2007 2008 2009 2010 Mean
Education 12.9 12.3 13.5 12.9 14.1 15.3 14.1 12.6 10.1 11.0 12.9
Healthcare 25.0 21.8 20.7 21.2 22.7 22.5 21.6 19.2 16.0 15.3 20.6
Professional 38.4 37.3 29.2 30.8 33.0 34.1 32.3 28.5 19.8 22.9 30.6
Total Non-Farm 27.6 24.8 22.6 24.2 26.2 26.7 25.5 21.9 15.7 16.4 23.2
SOURCE: U.S. Department of Labor, Bureau of Labor Statistics, Job Openings and Labor
Turnover Survey (JOLTS). Retrieved from: http://www.bls.gov/jlt/data.htm (05/11)

142
Table 4
Comparison of Induction Program Retention Rates and Percent Decreases in Attrition
Program Length 1 year 2 years 5 years % ∆ Norm r
BTSA(Statewide) - CA 2 93.0r
89.3r
79.0r
62.8p
94.4 -0.6533
Newport Mesa 2 96.6 93.3p
84.1p
80.0 97.0
Stanislaus 2 91.1 83.0p
62.7p
Clark County, NV 3 92.5 85.6p
67.7p
71.0 95.7
CMP STIR - CA 1 89.9a
80.9p
58.8p
49.5 92.4
Connecticut BEST* 2-3 91.1 84.1r
65.4 -0.9998
Flowing Wells, AZ 4 87.2r
83.9r
74.8r
75.8 96.4 -0.8582
Glendale, AZ 3 86.9r
80.3r
63.4r
71.7 95.8 -0.6964
Homewood, IL 2 99.0 98.0p
95.1p
98.4 99.8
Islip, NY 3 87.3w
76.2p
50.7p
88.1 97.3
Lafourche, LA 3 91.0a
82.8p
62.4p
81.7 97.3
Leyden, IL N/A 95.6 91.4p
79.9p
Montana BTSP* 1 90.9w
68.4w
50.6r
48.3 92.2 -0.9235
Muscatine, IA 2 93.0 86.0 70.0r
-0.9986
MUSE – HI 2-3 89.0 79.2p
55.8p
60.0 94
Oconee, GA 2 96.3r
89.7r
72.6r
-0.8539
Odell & Ferraro - NM N/A 95.7p
91.7p
80.4p
49.0 92.4
Prince George, MD 2 92.8 86.1p
68.8p
Rochester, NY 3 88.0a
77.4p
52.8p
70.0 95.5
South TX 3 89.0w
74.6w
57.0r
72.9 95.9 -0.9598
St. Louis, MO 3-5 91.4w
83.5p
63.8p
67.0 95.1
Texas BESS* 1 89.2 84.4 64.8r
43.8 91.6 -0.9804
Medians 2.4 91.1 84.0 65.1 70.5 95.6
National Averages 85.0 72.3C
44.4C
Note. Length is in years. * = Canceled programs. a = Average of rates.
w = Weighted mean.
p =
Computed with simple powers. r = Regressed rate. Rates without any markings are single year
results. Norm = Yearly rate normalized to national average rate of 85%.
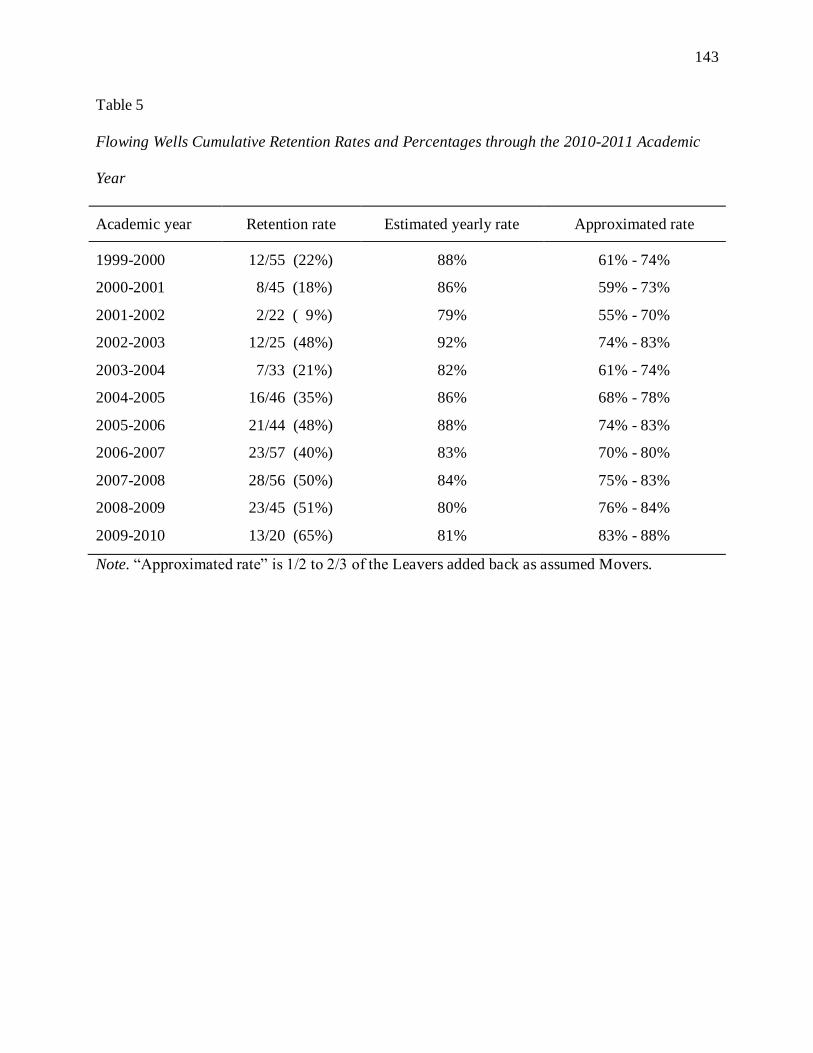
143
Table 5
Flowing Wells Cumulative Retention Rates and Percentages through the 2010-2011 Academic
Year
Academic year Retention rate Estimated yearly rate Approximated rate
1999-2000 12/55 (22%) 88% 61% - 74%
2000-2001 8/45 (18%) 86% 59% - 73%
2001-2002 2/22 ( 9%) 79% 55% - 70%
2002-2003 12/25 (48%) 92% 74% - 83%
2003-2004 7/33 (21%) 82% 61% - 74%
2004-2005 16/46 (35%) 86% 68% - 78%
2005-2006 21/44 (48%) 88% 74% - 83%
2006-2007 23/57 (40%) 83% 70% - 80%
2007-2008 28/56 (50%) 84% 75% - 83%
2008-2009 23/45 (51%) 80% 76% - 84%
2009-2010 13/20 (65%) 81% 83% - 88%
Note. “Approximated rate” is 1/2 to 2/3 of the Leavers added back as assumed Movers.

144
Table 6
Montana Beginning Teacher Support Program (BTSP) Retention Rates
1992-93
Mentees
1993-94
Mentees
1993-94
Control
1994-95
Mentees
1994-95
Control
N 11 12 11 12 10
After One Year
Original District 9 9 7 12 7
Another District 2 1 1 -- --
Seeking Teaching -- 1 3 -- 1
Grad School -- 1 -- -- --
Not Teaching -- -- -- -- 2
Percent Active 100% 83% 73% 100% 70%
After Two Years
Original District 8 5 6 n/a n/a
Another District 3 3 2
Seeking Teaching -- 2 2
Grad School -- 2 --
Not Teaching -- -- 1
Percent Active 100% 67% 73%
After Three Years
Original District 7 n/a n/a n/a n/a
Another District 3
Seeking Teaching 1
Grad School --
Not Teaching --
Percent Active 91%
Note. Percent Active = “Original District” + “Another District” only. No “Control” group used
for 1992-93.
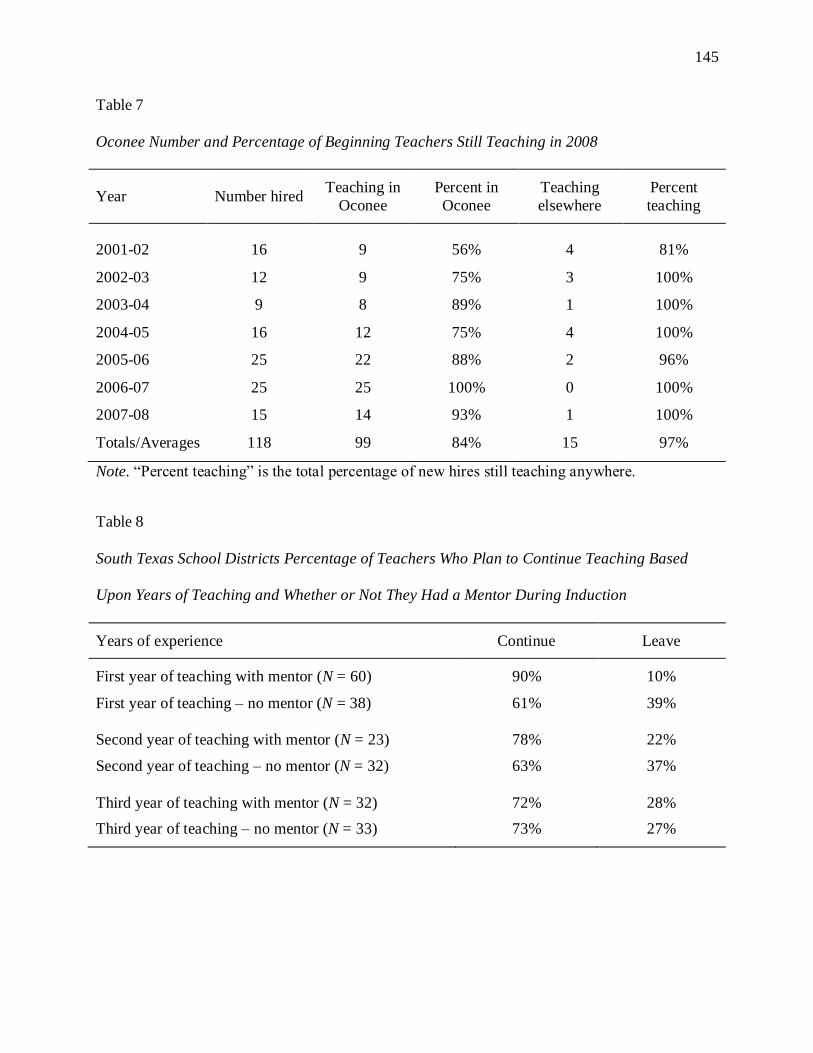
145
Table 7
Oconee Number and Percentage of Beginning Teachers Still Teaching in 2008
Year Number hired Teaching in
Oconee
Percent in
Oconee
Teaching
elsewhere
Percent
teaching
2001-02 16 9 56% 4 81%
2002-03 12 9 75% 3 100%
2003-04 9 8 89% 1 100%
2004-05 16 12 75% 4 100%
2005-06 25 22 88% 2 96%
2006-07 25 25 100% 0 100%
2007-08 15 14 93% 1 100%
Totals/Averages 118 99 84% 15 97%
Note. “Percent teaching” is the total percentage of new hires still teaching anywhere.
Table 8
South Texas School Districts Percentage of Teachers Who Plan to Continue Teaching Based
Upon Years of Teaching and Whether or Not They Had a Mentor During Induction
Years of experience Continue Leave
First year of teaching with mentor (N = 60) 90% 10%
First year of teaching – no mentor (N = 38) 61% 39%
Second year of teaching with mentor (N = 23)
78%
22%
Second year of teaching – no mentor (N = 32) 63% 37%
Third year of teaching with mentor (N = 32)
72%
28%
Third year of teaching – no mentor (N = 33) 73% 27%
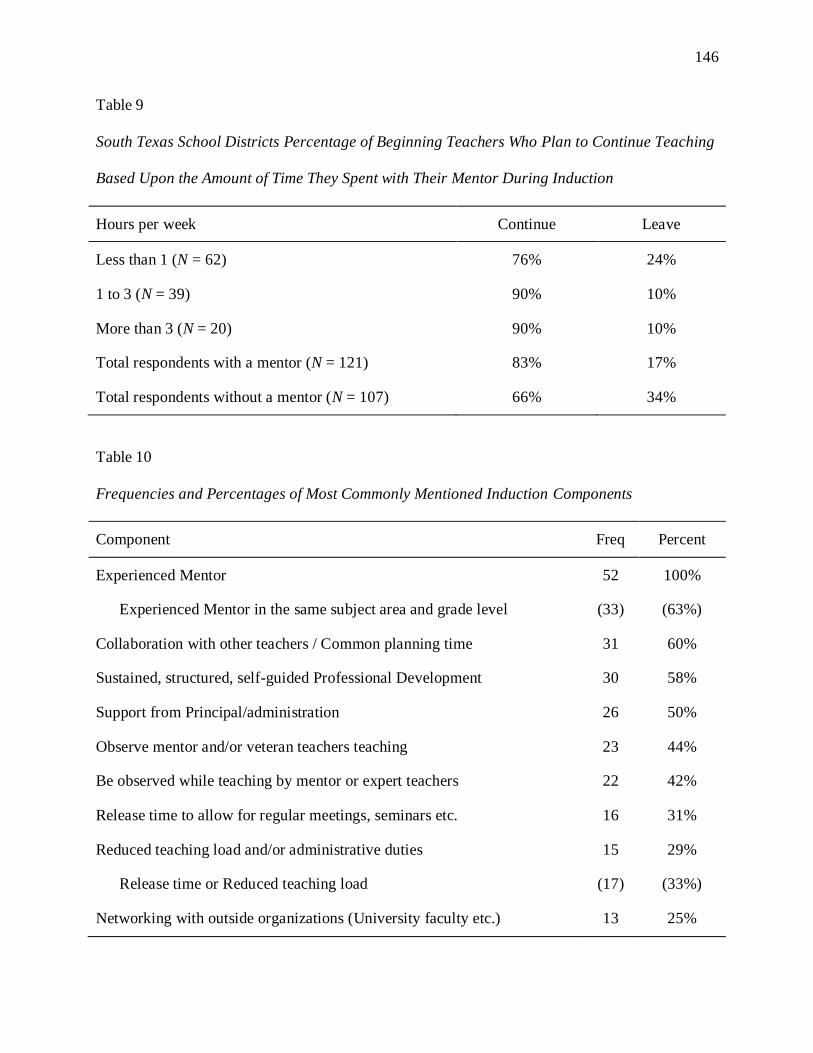
146
Table 9
South Texas School Districts Percentage of Beginning Teachers Who Plan to Continue Teaching
Based Upon the Amount of Time They Spent with Their Mentor During Induction
Hours per week Continue Leave
Less than 1 (N = 62) 76% 24%
1 to 3 (N = 39) 90% 10%
More than 3 (N = 20) 90% 10%
Total respondents with a mentor (N = 121) 83% 17%
Total respondents without a mentor (N = 107) 66% 34%
Table 10
Frequencies and Percentages of Most Commonly Mentioned Induction Components
Component Freq Percent
Experienced Mentor 52 100%
Experienced Mentor in the same subject area and grade level (33) (63%)
Collaboration with other teachers / Common planning time 31 60%
Sustained, structured, self-guided Professional Development 30 58%
Support from Principal/administration 26 50%
Observe mentor and/or veteran teachers teaching 23 44%
Be observed while teaching by mentor or expert teachers 22 42%
Release time to allow for regular meetings, seminars etc. 16 31%
Reduced teaching load and/or administrative duties 15 29%
Release time or Reduced teaching load (17) (33%)
Networking with outside organizations (University faculty etc.) 13 25%
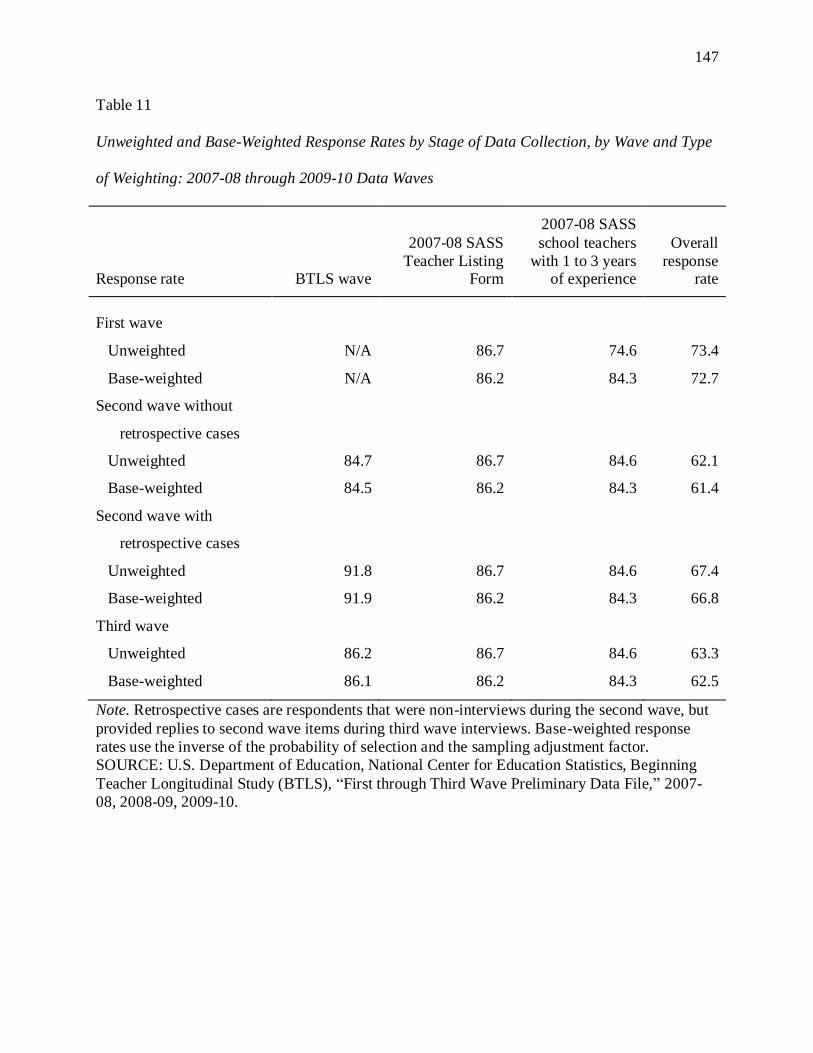
147
Table 11
Unweighted and Base-Weighted Response Rates by Stage of Data Collection, by Wave and Type
of Weighting: 2007-08 through 2009-10 Data Waves
Response rate
BTLS wave
2007-08 SASS
Teacher Listing Form
2007-08 SASS
school teachers
with 1 to 3 years of experience
Overall
response rate
First wave
Unweighted N/A 86.7 74.6 73.4
Base-weighted N/A 86.2 84.3 72.7
Second wave without
retrospective cases
Unweighted 84.7 86.7 84.6 62.1
Base-weighted 84.5 86.2 84.3 61.4
Second wave with
retrospective cases
Unweighted 91.8 86.7 84.6 67.4
Base-weighted 91.9 86.2 84.3 66.8
Third wave
Unweighted 86.2 86.7 84.6 63.3
Base-weighted 86.1 86.2 84.3 62.5
Note. Retrospective cases are respondents that were non-interviews during the second wave, but
provided replies to second wave items during third wave interviews. Base-weighted response
rates use the inverse of the probability of selection and the sampling adjustment factor.
SOURCE: U.S. Department of Education, National Center for Education Statistics, Beginning
Teacher Longitudinal Study (BTLS), “First through Third Wave Preliminary Data File,” 2007-
08, 2008-09, 2009-10.

148
Table 12
Range of Item Response Rates and Percentage of Items with Selected Rate Ranges, by Wave and
Type of Weighting: 2007-08 through 2009-10 Data Waves
Wave and type of weighting
Range of item response rate
Percentage of
items with a
response rate of 85.0% or more
Percentage of
items with a
response rate of 70.0% - 84.9%
Percentage of
items with a
response rate of less than 70.0%
First wave
Unweighted 0.0 - 100.0 82.5 10.1 7.4
Base-weighted 0.0 - 100.0 83.3 8.9 7.8
Second wave without
retrospective cases
Unweighted 4.3 – 100.0 87.2 8.5 4.3
Base-weighted 3.8 – 100.0 86.8 8.9 4.3
Second wave with
retrospective cases
Unweighted 4.3 – 100.0 87.8 7.8 4.4
Base-weighted 3.9 – 100.0 87.8 7.8 4.4
Third wave
Unweighted 0.0 – 100.0 84.3 12.2 3.5
Base-weighted 0.0 – 100.0 84.7 11.8 3.5
Note. Retrospective cases are respondents that were non-interviews during the second wave, but
provided replies to second wave items during third wave interviews. Base-weighted response
rates use the inverse of the probability of selection and the sampling adjustment factor. Final-
weighted response rates use an initial basic weight, a SASS teacher weighting adjustment factor,
a non-interview adjustment factor, and a ratio adjustment factor. Detail may not sum to totals due
to rounding.
SOURCE: U.S. Department of Education, National Center for Education Statistics, Beginning
Teacher Longitudinal Study (BTLS), “First through Third Wave Preliminary Data File,” 2007-
08, 2008-09, 2009-10.

149
Table 13
A Comparison of the Most Commonly Mentioned Induction Components in the Literature to the
Selection of Components in Successful Programs with Reduced Attrition Rates
Frequency(%)
Characteristic Lit Rev Success
Experienced Mentor in the same subject area and grade level 52(100) 22(100)
Collaboration with other teachers / Common planning time 31(60) 22(100)
Sustained, structured, self-guided Professional Development 30(58) 22(100)
Support from Principal/administration 26(50) 22(100)
Observe mentor and/or veteran teachers teaching 23(44) 17(77)
Be observed while teaching by mentor or expert teachers 22(42) 17(77)
Release Time to allow for regular meetings, seminars etc. 16(31) 11(50)
Reduced teaching load and/or administrative duties 15(29) 11(50)
Networking with outside organizations (University faculty etc.) 13(25) 14(64)
Table 14
Frequencies and Relative Frequencies of Employment Status Variables
Unweighted Weighted
Variable Name (missing) - Description Freq Rel Freq Freq Rel Freq
W2STTUS (163) - Yr 2 Employment Status
1=Leavers 190 10.39 15479.16 9.91
2=Stayers 1347 73.65 116007.70 74.25
3=Movers 292 15.97 24742.00 15.84
W3STTUS (274) - Yr 3 Employment Status
1=Leavers 234 13.62 19534.59 12.47
2=Stayers 1247 72.58 116457.10 74.36
3=Movers 198 11.53 16248.29 10.37
4=Returners 39 2.27 4376.77 2.79
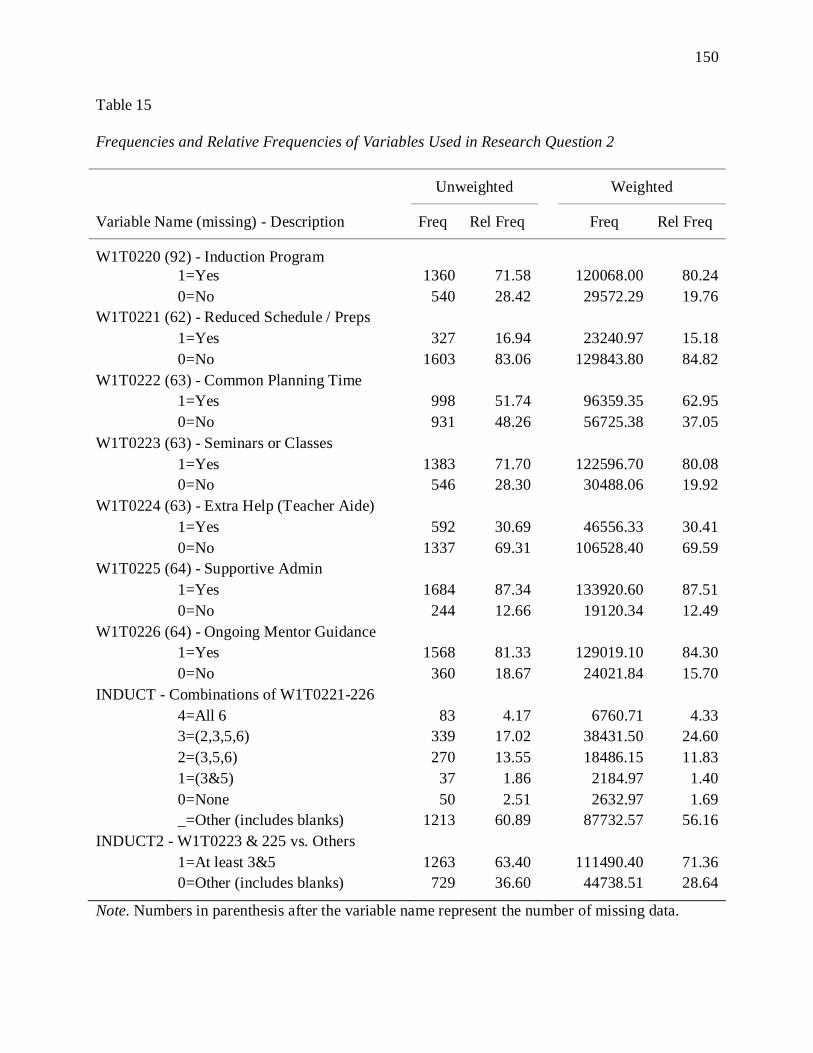
150
Table 15
Frequencies and Relative Frequencies of Variables Used in Research Question 2
Unweighted Weighted
Variable Name (missing) - Description Freq Rel Freq Freq Rel Freq
W1T0220 (92) - Induction Program
1=Yes 1360 71.58 120068.00 80.24
0=No 540 28.42 29572.29 19.76
W1T0221 (62) - Reduced Schedule / Preps
1=Yes 327 16.94 23240.97 15.18
0=No 1603 83.06 129843.80 84.82
W1T0222 (63) - Common Planning Time
1=Yes 998 51.74 96359.35 62.95
0=No 931 48.26 56725.38 37.05
W1T0223 (63) - Seminars or Classes
1=Yes 1383 71.70 122596.70 80.08
0=No 546 28.30 30488.06 19.92
W1T0224 (63) - Extra Help (Teacher Aide)
1=Yes 592 30.69 46556.33 30.41
0=No 1337 69.31 106528.40 69.59
W1T0225 (64) - Supportive Admin
1=Yes 1684 87.34 133920.60 87.51
0=No 244 12.66 19120.34 12.49
W1T0226 (64) - Ongoing Mentor Guidance
1=Yes 1568 81.33 129019.10 84.30
0=No 360 18.67 24021.84 15.70
INDUCT - Combinations of W1T0221-226
4=All 6 83 4.17 6760.71 4.33
3=(2,3,5,6) 339 17.02 38431.50 24.60
2=(3,5,6) 270 13.55 18486.15 11.83
1=(3&5) 37 1.86 2184.97 1.40
0=None 50 2.51 2632.97 1.69
_=Other (includes blanks) 1213 60.89 87732.57 56.16
INDUCT2 - W1T0223 & 225 vs. Others
1=At least 3&5 1263 63.40 111490.40 71.36
0=Other (includes blanks) 729 36.60 44738.51 28.64
Note. Numbers in parenthesis after the variable name represent the number of missing data.

151
Table 16
Frequencies and Relative Frequencies of Variables Used in Research Question 3
Unweighted Weighted
Variable Name (missing) - Description Freq Rel Freq Freq Rel Freq
W2MNTYN (162) - Mentor in First Year
1=Yes 1433 78.31 125776.90 80.51
0=No 397 21.69 30451.95 19.49
MENTIND (243) - Inducting & Mentoring
3=Both 1096 62.66 102661.30 68.61
2=Induct only 169 9.66 17406.74 11.63
1=Mentor only 279 15.95 18149.73 12.13
0=Neither 205 11.72 11422.56 7.63
W2MNGRA (753) - Teaches Same Grade
1=Yes 1080 87.17 88235.42 81.70
0=No 159 12.83 19760.89 18.30
W2MNSUB (750) - Teaches Same Subject
1=Yes 879 70.77 82328.71 75.53
0=No 363 29.23 26677.18 24.47
MNGRASUB (755) - Grade & Subject
3=Both 791 63.95 69498.35 64.37
2=Subject only 85 6.87 11983.84 11.10
1=Grade only 287 23.20 18701.14 17.32
0=Neither 74 5.98 7777.05 7.20
W2MNFRQ (748) - Meeting Frequency
3=Once/week 620 49.84 58553.49 53.70
2=1or2/month 354 28.46 27533.48 25.25
1=Few/year 219 17.60 16707.19 15.32
0=Never 51 4.10 6235.01 5.72
W2MNOBS (752) - Observation Freq
3=Once/week 122 9.84 12329.17 11.35
2=1or2/month 260 20.97 20517.83 18.89
1=Few/year 539 43.47 49091.19 45.19
0=Never 319 25.73 26700.55 24.58
W2MNIMP (754) - Teaching Improvement
3=Great extent 328 26.49 29634.74 27.25
2=moderately 409 33.04 38780.72 35.67
1=Small extent 380 30.69 27479.72 25.27
0=Not at all 121 9.77 12838.67 11.81
Note. Numbers in parenthesis after the variable name represent the number of missing data.

152
Table 17
Weighted Two Way Frequencies of Year Two (2008-09) Teacher Employment Status W2STTUS
used for Research Question 2 on Induction Components
Leaver
Stayer
Mover
Variable Name N %
N %
N %
W1T0220 - Induction
1=Yes 10576 8.81
90126 75.06
19367 16.13
0=No 4566 15.44
19974 67.54
5032 17.01
W1T0221 - Less Preps
1=Yes 2284 9.83
17104 73.59
3853 16.58
0=No 12974 9.99
96233 74.11
20637 15.89
W1T0222 - Common Planning
1=Yes 8998 9.34
72240 74.97
15122 15.69
0=No 6260 11.04
41097 72.45
9368 16.51
W1T0223 - Seminars
1=Yes 10540 8.60
93300 76.10
18756 15.30
0=No 4718 15.48
20037 65.72
5733 18.80
W1T0224 - Extra Help
1=Yes 4000 8.59
33735 72.46
8822 18.95
0=No 11258 10.57
79602 74.72
15668 14.71
W1T0225 - Admin Support
1=Yes 11903 8.89
101632 75.89
20386 15.22
0=No 3356 17.55
11661 60.99
4103 21.46
W1T0226 - Mentor Feedback
1=Yes 10510 8.36
95151 75.65
20116 15.99
0=No 4969 16.32
20857 68.49
4626 15.19
INDUCT
4=All 6 401 5.93
4834 71.51
1525 22.56
3=(2,3,5,6) 3986 10.37
28182 73.33
6263 16.30
2=(3,5,6) 1076 5.82
15016 81.23
2395 12.96
1=(3&5) 127 5.81
1610 73.69
448 20.50
0=None 803 30.50
1336 50.76
493 18.74
_=Other 9086 10.36
65029 74.12
13617 15.52
INDUCT2
1=>3&5 8471 7.60
86350 77.45
16669 14.95
0=Other 7008 15.66
29658 66.29
8073 18.04
Note. INDUCT & INDUCT2 are variables created by the author.
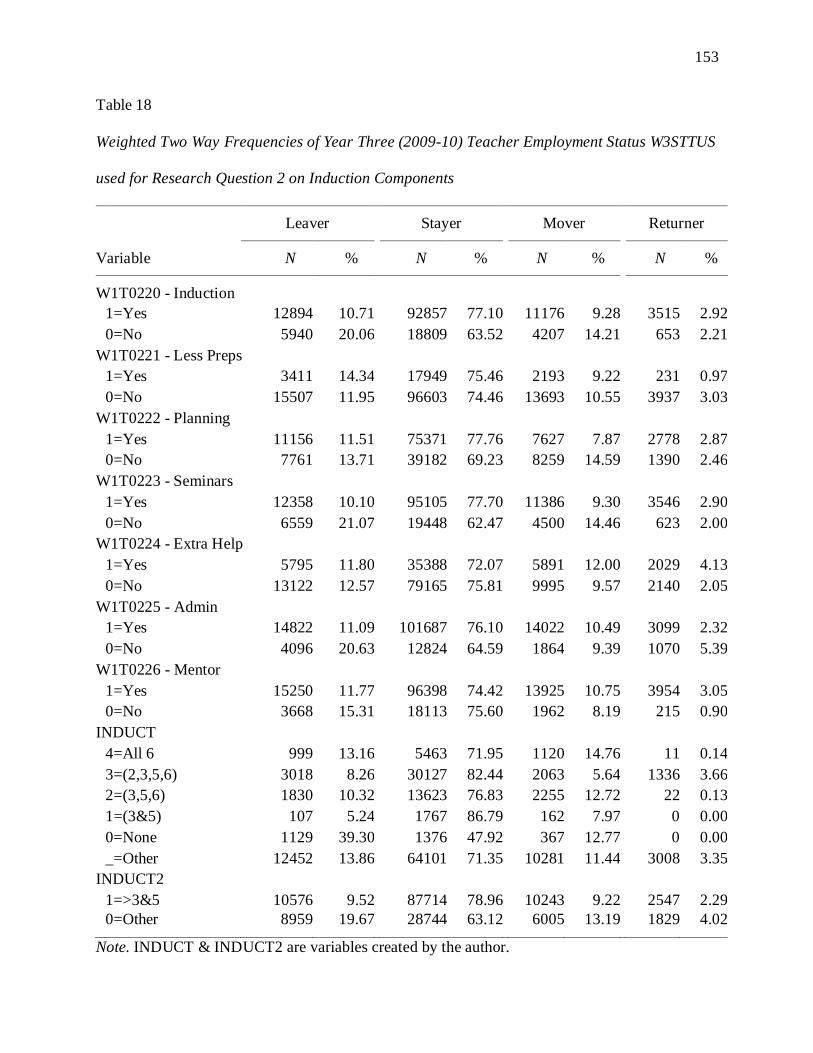
153
Table 18
Weighted Two Way Frequencies of Year Three (2009-10) Teacher Employment Status W3STTUS
used for Research Question 2 on Induction Components
Leaver
Stayer
Mover
Returner
Variable N %
N %
N %
N %
W1T0220 - Induction
1=Yes 12894 10.71
92857 77.10
11176 9.28
3515 2.92
0=No 5940 20.06
18809 63.52
4207 14.21
653 2.21
W1T0221 - Less Preps
1=Yes 3411 14.34
17949 75.46
2193 9.22
231 0.97
0=No 15507 11.95
96603 74.46
13693 10.55
3937 3.03
W1T0222 - Planning
1=Yes 11156 11.51
75371 77.76
7627 7.87
2778 2.87
0=No 7761 13.71
39182 69.23
8259 14.59
1390 2.46
W1T0223 - Seminars
1=Yes 12358 10.10
95105 77.70
11386 9.30
3546 2.90
0=No 6559 21.07
19448 62.47
4500 14.46
623 2.00
W1T0224 - Extra Help
1=Yes 5795 11.80
35388 72.07
5891 12.00
2029 4.13
0=No 13122 12.57
79165 75.81
9995 9.57
2140 2.05
W1T0225 - Admin
1=Yes 14822 11.09
101687 76.10
14022 10.49
3099 2.32
0=No 4096 20.63
12824 64.59
1864 9.39
1070 5.39
W1T0226 - Mentor
1=Yes 15250 11.77
96398 74.42
13925 10.75
3954 3.05
0=No 3668 15.31
18113 75.60
1962 8.19
215 0.90
INDUCT
4=All 6 999 13.16
5463 71.95
1120 14.76
11 0.14
3=(2,3,5,6) 3018 8.26
30127 82.44
2063 5.64
1336 3.66
2=(3,5,6) 1830 10.32
13623 76.83
2255 12.72
22 0.13
1=(3&5) 107 5.24
1767 86.79
162 7.97
0 0.00
0=None 1129 39.30
1376 47.92
367 12.77
0 0.00
_=Other 12452 13.86
64101 71.35
10281 11.44
3008 3.35
INDUCT2
1=>3&5 10576 9.52
87714 78.96
10243 9.22
2547 2.29
0=Other 8959 19.67
28744 63.12
6005 13.19
1829 4.02
Note. INDUCT & INDUCT2 are variables created by the author.

154
Table 19
Chi Square Test of Association for Induction Program Variables and Teacher Employment
Status Variables used for Research Question 2
Year 2
Year 3
Variable df χ2 p V
df χ2 p V
W1T0220 - Induction 2 1225.34 0.0001 0.0905
3 2852.58 0.0001 0.1379
W1T0221 - Less Preps 2 7.02 0.0299 0.0068
3 444.83 0.0001 0.0538
W1T0222 - Planning 2 148.98 0.0001 0.0312
3 2072.60 0.0001 0.1162
W1T0223 - Seminars 2 1702.21 0.0001 0.1054
3 3907.36 0.0001 0.1595
W1T0224 - Extra Help 2 513.78 0.0001 0.0579
3 801.40 0.0001 0.0722
W1T0225 - Admin 2 2167.81 0.0001 0.1190
3 2202.62 0.0001 0.1198
W1T0226 - Mentor 2 156.43 0.0001 0.0320
3 682.67 0.0001 0.0667
INDUCT 8 2317.28 0.0001 0.1301
12 5082.08 0.0001 0.1593
INDUCT2 2 2824.99 0.0001 0.1345
3 4592.73 0.0001 0.1712
Table 20
Weighted Two Way Frequencies of Year Two (2008-09) Teacher Employment Status W2STTUS
used for Research Question 3 on Mentoring Components
Leaver
Stayer
Mover
Variable Name N %
N %
N %
W2MNTYN - Mentor
1=Yes 10510 8.36
95151 75.65
20116 15.99
0=No 4969 16.32
20857 68.49
4626 15.19
W2MNGRA - Teach Grade
1=Yes 6719 7.61
68619 77.77
12898 14.62
0=No 1335 6.76
14456 73.15
3970 20.09
W2MNSUB - Teach Subject
1=Yes 6032 7.33
64467 78.30
11830 14.37
0=No 2201 8.25
19417 72.79
5059 18.96

155
Leaver
Stayer
Mover
Variable Name N %
N %
N %
MNGRASUB
3=Both 5513 7.93
54221 78.02
9765 14.05
2=Subject only 519 4.33
9421 78.61
2044 17.06
1=Grade only 1206 6.45
14362 76.80
3133 16.75
0=Neither 816 10.49
5035 64.74
1926 24.77
W2MNFRQ - Meet Frequency
3=Once/week 3797 6.48
46624 79.63
8133 13.89
2=1or2/month 2744 9.97
18742 68.07
6047 21.96
1=Few/year 1121 6.71
13199 79.00
2387 14.29
0=Never 549 8.80
5365 86.04
322 5.16
W2MNOBS - Observation Freq
3=Once/week 1022 8.29
9955 80.75
1352 10.96
2=1or2/month 1208 5.89
15636 76.21
3674 17.91
1=Few/year 3681 7.50
36854 75.07
8556 17.43
0=Never 2091 7.83
21303 79.78
3307 12.39
W2MNIMP - Teaching Improve
3=Great extent 1293 4.36
25804 87.07
2537 8.56
2=moderately 2093 5.40
28546 73.61
8142 20.99
1=Small extent 2943 10.71
20724 75.42
3813 13.88
0=Not at all 1822 14.19
8652 67.39
2365 18.42
MENTIMP
1=High (3+4) 3386 4.95
54350 79.44
10679 15.61
0=Low (1+2) 4764 11.82
29376 72.86
6178 15.32
MENTIND
3=Both 7814 7.61
78092 76.07
16755 16.32
2=Induct only 2762 15.87
12033 69.13
2612 15.00
1=Mentor only 2401 13.23
12586 69.34
3163 17.43
0=Neither 2165 18.95
7389 64.69
1869 16.36
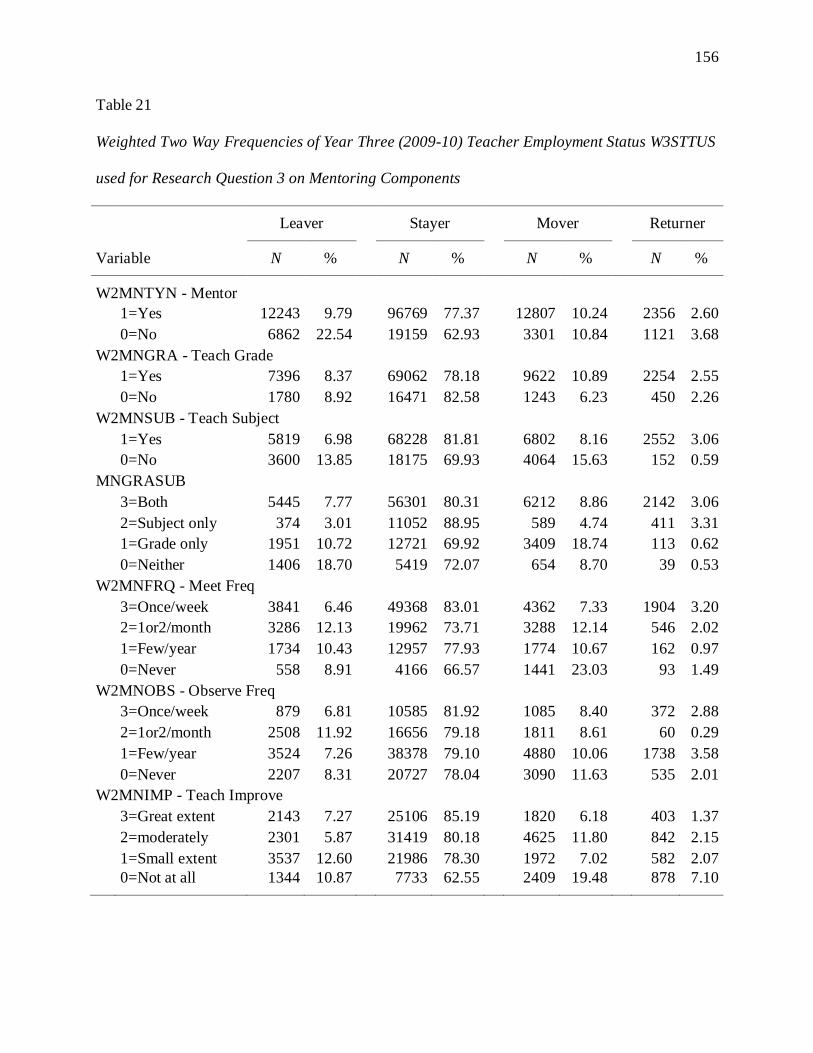
156
Table 21
Weighted Two Way Frequencies of Year Three (2009-10) Teacher Employment Status W3STTUS
used for Research Question 3 on Mentoring Components
Leaver
Stayer
Mover
Returner
Variable N %
N %
N %
N %
W2MNTYN - Mentor
1=Yes 12243 9.79
96769 77.37
12807 10.24
2356 2.60
0=No 6862 22.54
19159 62.93
3301 10.84
1121 3.68
W2MNGRA - Teach Grade
1=Yes 7396 8.37
69062 78.18
9622 10.89
2254 2.55
0=No 1780 8.92
16471 82.58
1243 6.23
450 2.26
W2MNSUB - Teach Subject
1=Yes 5819 6.98
68228 81.81
6802 8.16
2552 3.06
0=No 3600 13.85
18175 69.93
4064 15.63
152 0.59
MNGRASUB
3=Both 5445 7.77
56301 80.31
6212 8.86
2142 3.06
2=Subject only 374 3.01
11052 88.95
589 4.74
411 3.31
1=Grade only 1951 10.72
12721 69.92
3409 18.74
113 0.62
0=Neither 1406 18.70
5419 72.07
654 8.70
39 0.53
W2MNFRQ - Meet Freq
3=Once/week 3841 6.46
49368 83.01
4362 7.33
1904 3.20
2=1or2/month 3286 12.13
19962 73.71
3288 12.14
546 2.02
1=Few/year 1734 10.43
12957 77.93
1774 10.67
162 0.97
0=Never 558 8.91
4166 66.57
1441 23.03
93 1.49
W2MNOBS - Observe Freq
3=Once/week 879 6.81
10585 81.92
1085 8.40
372 2.88
2=1or2/month 2508 11.92
16656 79.18
1811 8.61
60 0.29
1=Few/year 3524 7.26
38378 79.10
4880 10.06
1738 3.58
0=Never 2207 8.31
20727 78.04
3090 11.63
535 2.01
W2MNIMP - Teach Improve
3=Great extent 2143 7.27
25106 85.19
1820 6.18
403 1.37
2=moderately 2301 5.87
31419 80.18
4625 11.80
842 2.15
1=Small extent 3537 12.60
21986 78.30
1972 7.02
582 2.07
0=Not at all 1344 10.87
7733 62.55
2409 19.48
878 7.10
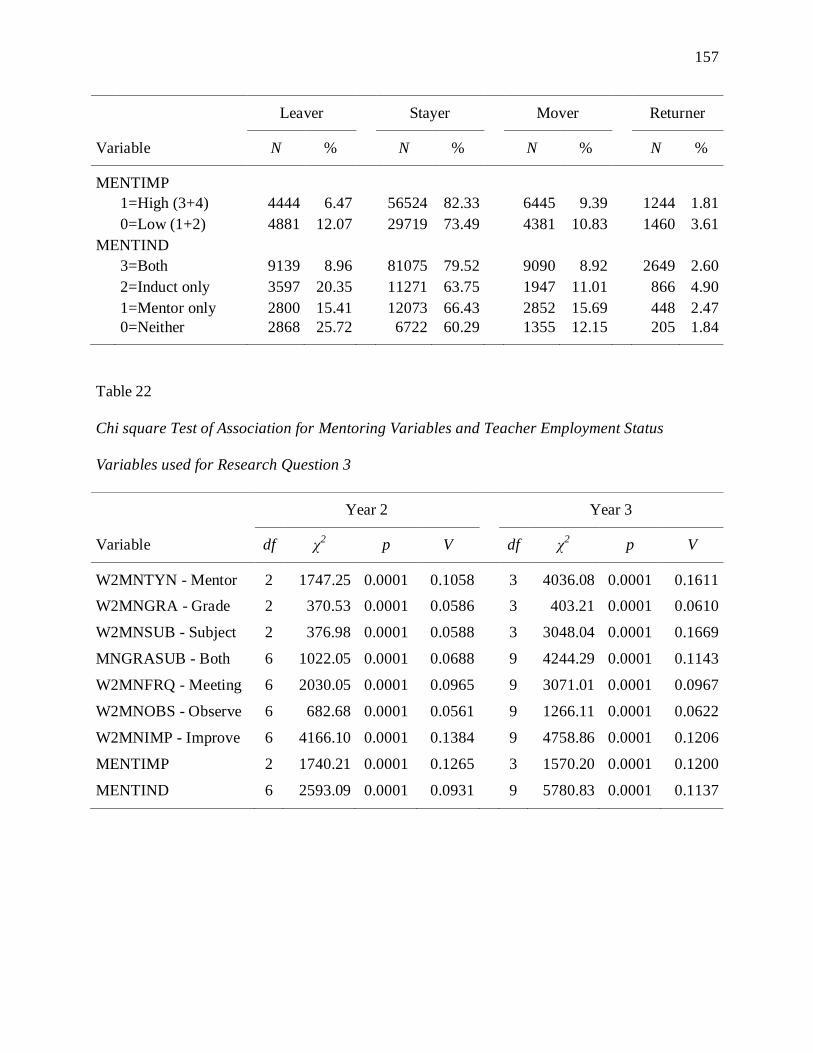
157
Leaver
Stayer
Mover
Returner
Variable N %
N %
N %
N %
MENTIMP
1=High (3+4) 4444 6.47
56524 82.33
6445 9.39
1244 1.81
0=Low (1+2) 4881 12.07
29719 73.49
4381 10.83
1460 3.61
MENTIND
3=Both 9139 8.96
81075 79.52
9090 8.92
2649 2.60
2=Induct only 3597 20.35
11271 63.75
1947 11.01
866 4.90
1=Mentor only 2800 15.41
12073 66.43
2852 15.69
448 2.47
0=Neither 2868 25.72
6722 60.29
1355 12.15
205 1.84
Table 22
Chi square Test of Association for Mentoring Variables and Teacher Employment Status
Variables used for Research Question 3
Year 2
Year 3
Variable df χ2 p V
df χ2 p V
W2MNTYN - Mentor 2 1747.25 0.0001 0.1058
3 4036.08 0.0001 0.1611
W2MNGRA - Grade 2 370.53 0.0001 0.0586
3 403.21 0.0001 0.0610
W2MNSUB - Subject 2 376.98 0.0001 0.0588
3 3048.04 0.0001 0.1669
MNGRASUB - Both 6 1022.05 0.0001 0.0688
9 4244.29 0.0001 0.1143
W2MNFRQ - Meeting 6 2030.05 0.0001 0.0965
9 3071.01 0.0001 0.0967
W2MNOBS - Observe 6 682.68 0.0001 0.0561
9 1266.11 0.0001 0.0622
W2MNIMP - Improve 6 4166.10 0.0001 0.1384
9 4758.86 0.0001 0.1206
MENTIMP 2 1740.21 0.0001 0.1265
3 1570.20 0.0001 0.1200
MENTIND 6 2593.09 0.0001 0.0931
9 5780.83 0.0001 0.1137
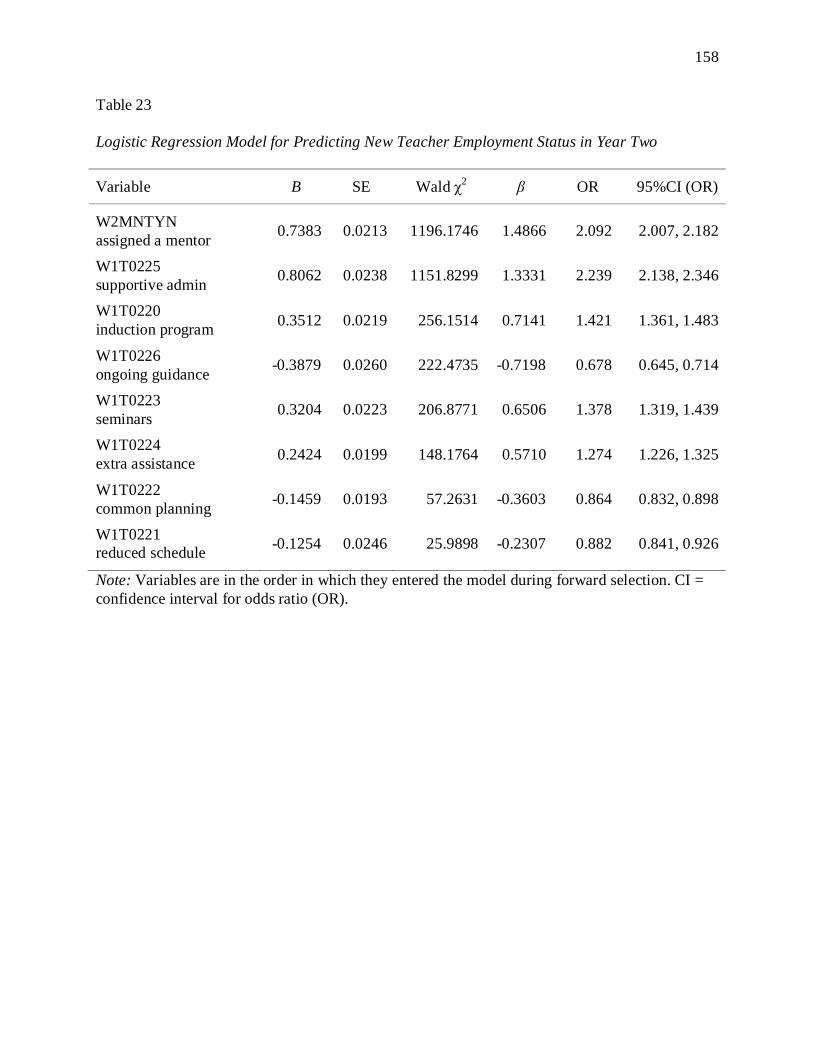
158
Table 23
Logistic Regression Model for Predicting New Teacher Employment Status in Year Two
Variable B SE Wald χ2 β OR 95%CI (OR)
W2MNTYN
assigned a mentor 0.7383 0.0213 1196.1746 1.4866 2.092 2.007, 2.182
W1T0225
supportive admin 0.8062 0.0238 1151.8299 1.3331 2.239 2.138, 2.346
W1T0220
induction program 0.3512 0.0219 256.1514 0.7141 1.421 1.361, 1.483
W1T0226
ongoing guidance -0.3879 0.0260 222.4735 -0.7198 0.678 0.645, 0.714
W1T0223
seminars 0.3204 0.0223 206.8771 0.6506 1.378 1.319, 1.439
W1T0224
extra assistance 0.2424 0.0199 148.1764 0.5710 1.274 1.226, 1.325
W1T0222
common planning -0.1459 0.0193 57.2631 -0.3603 0.864 0.832, 0.898
W1T0221
reduced schedule -0.1254 0.0246 25.9898 -0.2307 0.882 0.841, 0.926
Note: Variables are in the order in which they entered the model during forward selection. CI =
confidence interval for odds ratio (OR).
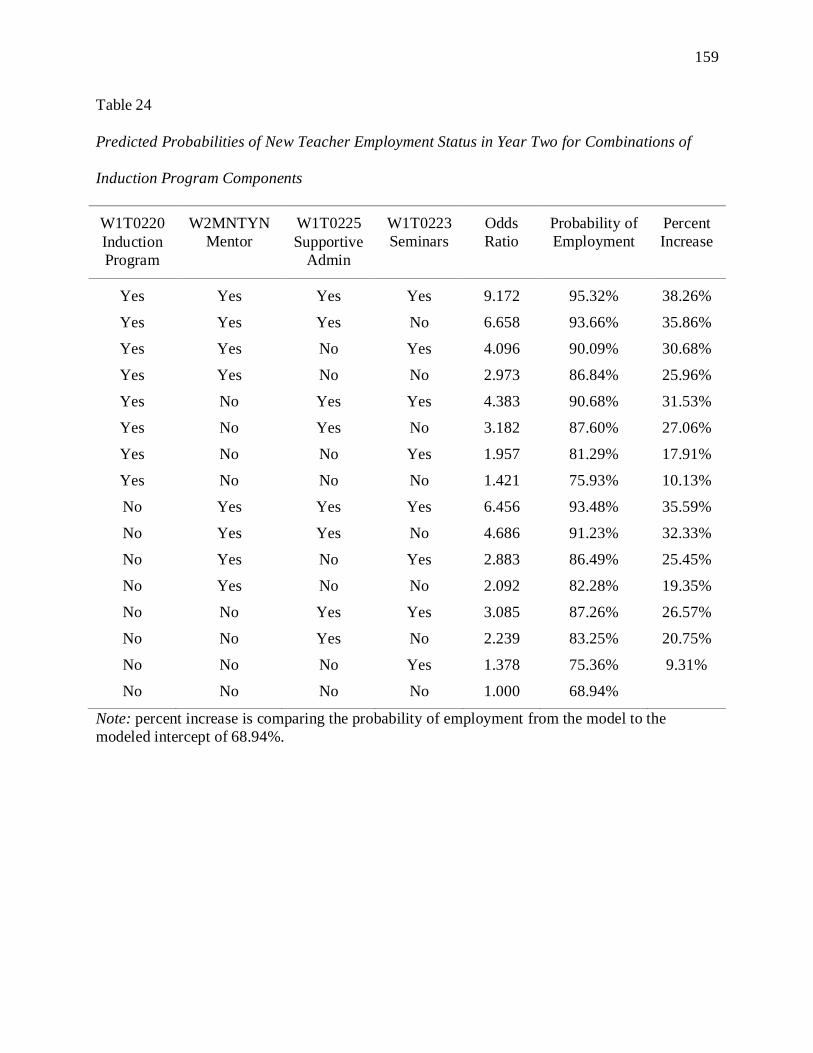
159
Table 24
Predicted Probabilities of New Teacher Employment Status in Year Two for Combinations of
Induction Program Components
W1T0220
Induction
Program
W2MNTYN
Mentor
W1T0225
Supportive
Admin
W1T0223
Seminars
Odds
Ratio
Probability of
Employment
Percent
Increase
Yes Yes Yes Yes 9.172 95.32% 38.26%
Yes Yes Yes No 6.658 93.66% 35.86%
Yes Yes No Yes 4.096 90.09% 30.68%
Yes Yes No No 2.973 86.84% 25.96%
Yes No Yes Yes 4.383 90.68% 31.53%
Yes No Yes No 3.182 87.60% 27.06%
Yes No No Yes 1.957 81.29% 17.91%
Yes No No No 1.421 75.93% 10.13%
No Yes Yes Yes 6.456 93.48% 35.59%
No Yes Yes No 4.686 91.23% 32.33%
No Yes No Yes 2.883 86.49% 25.45%
No Yes No No 2.092 82.28% 19.35%
No No Yes Yes 3.085 87.26% 26.57%
No No Yes No 2.239 83.25% 20.75%
No No No Yes 1.378 75.36% 9.31%
No No No No 1.000 68.94%
Note: percent increase is comparing the probability of employment from the model to the
modeled intercept of 68.94%.

160
Table 25
Logistic Regression Model for Predicting New Teacher Employment Status in Year Three
Variable B SE Wald χ2 β OR 95%CI (OR)
W2MNTYN
assigned a mentor 0.8841 0.0195 2062.8426 1.8404 2.421 2.330, 2.515
W1T0223
seminars 0.5690 0.0201 803.0444 1.2037 1.766 1.698, 1.837
W1T0225
supportive admin 0.7140 0.0224 1013.5144 1.2359 2.042 1.954, 2.134
W1T0221
reduced schedule -0.3714 0.0216 294.4857 -0.7096 0.690 0.661, 0.720
W1T0226
ongoing guidance -0.4103 0.0241 289.1433 -0.7834 0.663 0.633, 0.696
W1T0220
induction program 0.3104 0.0201 238.0156 0.6504 1.364 1.311, 1.419
W1T0222
common planning -0.1302 0.0180 52.5876 -0.3314 0.878 0.848, 0.909
W1T0224
extra assistance 0.0558 0.0176 10.0097 0.1373 1.057 1.021, 1.095
Note: Variables are in the order in which they entered the model during forward selection. CI =
confidence interval for odds ratio (OR).
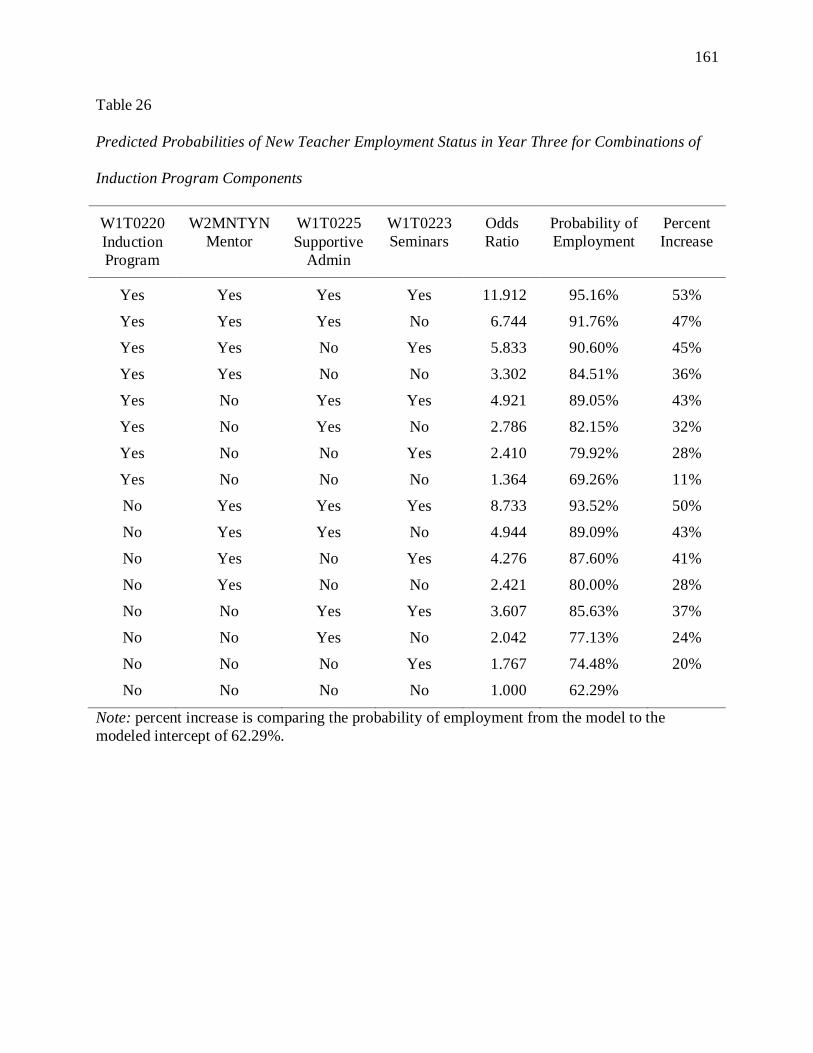
161
Table 26
Predicted Probabilities of New Teacher Employment Status in Year Three for Combinations of
Induction Program Components
W1T0220
Induction
Program
W2MNTYN
Mentor
W1T0225
Supportive
Admin
W1T0223
Seminars
Odds
Ratio
Probability of
Employment
Percent
Increase
Yes Yes Yes Yes 11.912 95.16% 53%
Yes Yes Yes No 6.744 91.76% 47%
Yes Yes No Yes 5.833 90.60% 45%
Yes Yes No No 3.302 84.51% 36%
Yes No Yes Yes 4.921 89.05% 43%
Yes No Yes No 2.786 82.15% 32%
Yes No No Yes 2.410 79.92% 28%
Yes No No No 1.364 69.26% 11%
No Yes Yes Yes 8.733 93.52% 50%
No Yes Yes No 4.944 89.09% 43%
No Yes No Yes 4.276 87.60% 41%
No Yes No No 2.421 80.00% 28%
No No Yes Yes 3.607 85.63% 37%
No No Yes No 2.042 77.13% 24%
No No No Yes 1.767 74.48% 20%
No No No No 1.000 62.29%
Note: percent increase is comparing the probability of employment from the model to the
modeled intercept of 62.29%.

162
Figures
Figure 1. BTSA statewide retention rates over a five-year span for academic years 2004 through
2008. The Teaching category (lighter shade) includes those teachers (1% per year on average)
that moved into leadership positions such as principal or into pupil service positions such as
librarian or counselor. CTC Statistic of the Month December 2008 retrieved from
http://www.ctc.ca.gov/educator-prep/statistics-archive.html
2 Year
3 Year
4 Year
5 Year
6.2%
7.9%
10.3%
12.8%
93.8%
92.1%
89.7%
87.2%
Teaching in 2008-09 Unknown Status

163
Figure 2. BTSA statewide retention rates over a five-year span for academic years 2006 through
2010. The Teaching category (lighter shade) includes (1% per year on average) those teachers
that moved into leadership positions such as principal or into pupil service positions such as
librarian or counselor. CTC Statistic of the Month February 2011 retrieved from
http://www.ctc.ca.gov/educator-prep/statistics.html
2 Year
3 Year
4 Year
5 Year
14.2%
25.8%
27.0%
24.1%
85.8%
74.2%
73.0%
75.9%
Teaching in 2010-11 Unknown Status
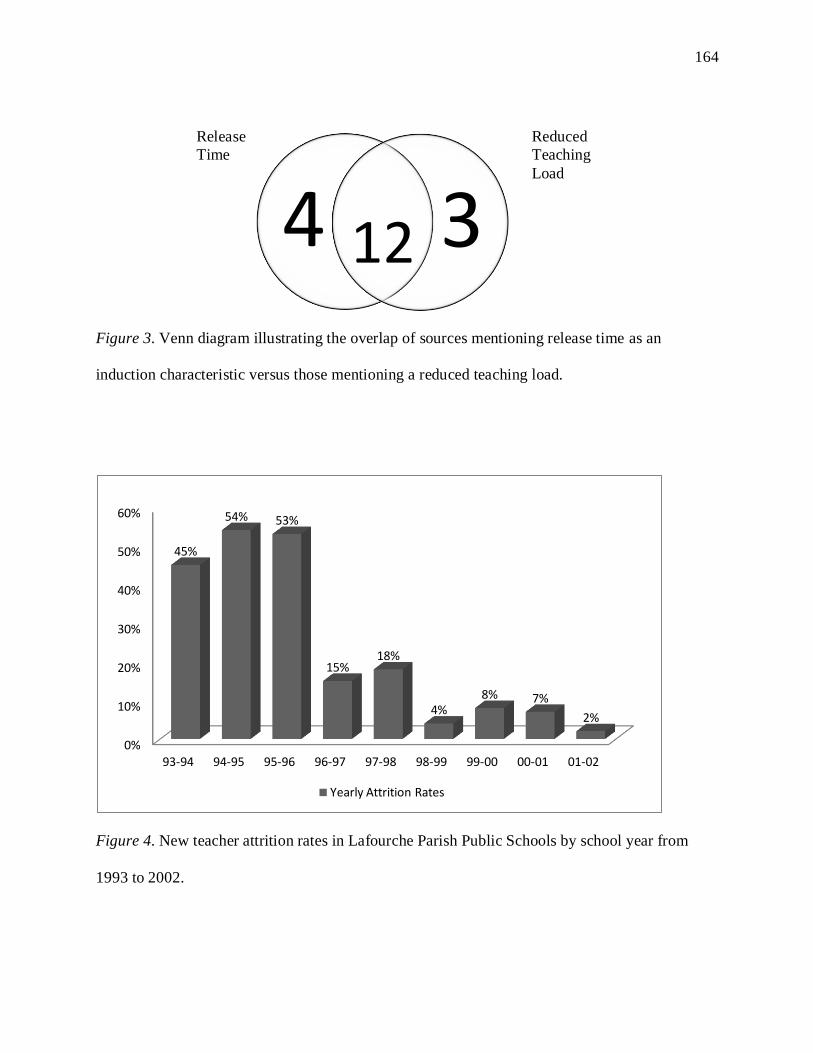
164
Figure 3. Venn diagram illustrating the overlap of sources mentioning release time as an
induction characteristic versus those mentioning a reduced teaching load.
Figure 4. New teacher attrition rates in Lafourche Parish Public Schools by school year from
1993 to 2002.
4 3
0%
10%
20%
30%
40%
50%
60%
93-94 94-95 95-96 96-97 97-98 98-99 99-00 00-01 01-02
45%
54% 53%
15% 18%
4% 8% 7%
2%
Yearly Attrition Rates
Release Reduced
Time Teaching
Load
12
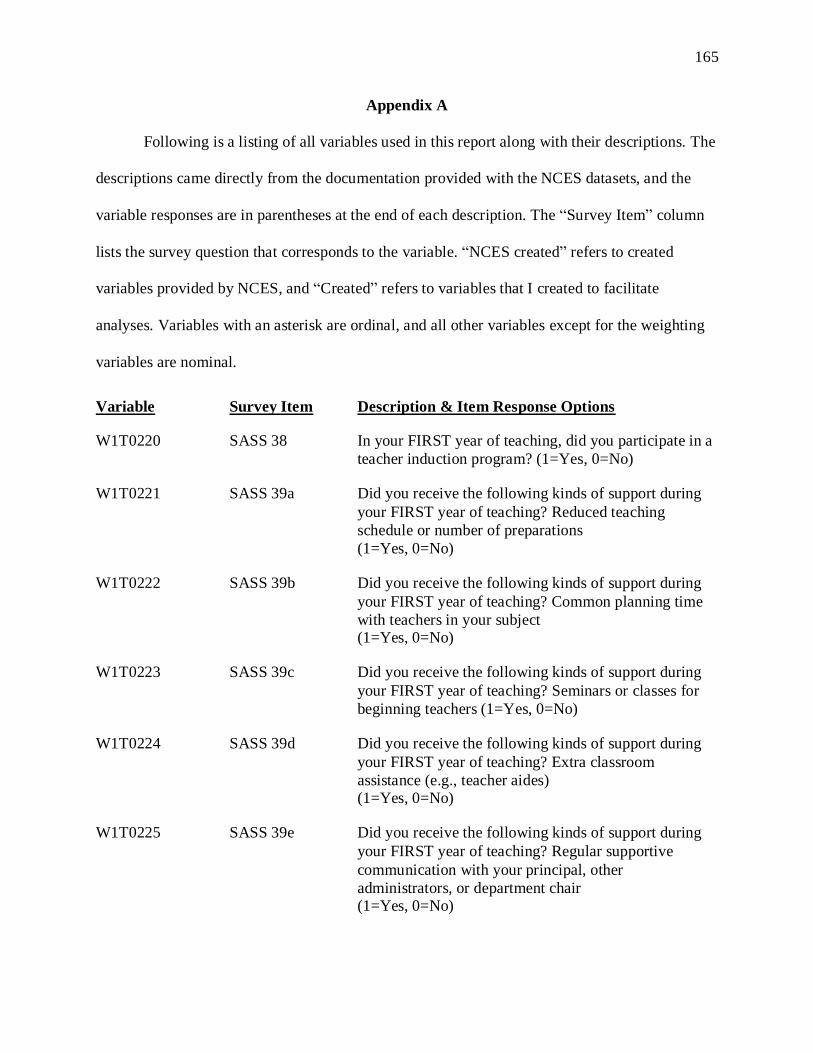
165
Appendix A
Following is a listing of all variables used in this report along with their descriptions. The
descriptions came directly from the documentation provided with the NCES datasets, and the
variable responses are in parentheses at the end of each description. The “Survey Item” column
lists the survey question that corresponds to the variable. “NCES created” refers to created
variables provided by NCES, and “Created” refers to variables that I created to facilitate
analyses. Variables with an asterisk are ordinal, and all other variables except for the weighting
variables are nominal.
Variable Survey Item Description & Item Response Options
W1T0220 SASS 38 In your FIRST year of teaching, did you participate in a
teacher induction program? (1=Yes, 0=No)
W1T0221 SASS 39a Did you receive the following kinds of support during
your FIRST year of teaching? Reduced teaching
schedule or number of preparations
(1=Yes, 0=No)
W1T0222 SASS 39b Did you receive the following kinds of support during
your FIRST year of teaching? Common planning time
with teachers in your subject (1=Yes, 0=No)
W1T0223 SASS 39c Did you receive the following kinds of support during
your FIRST year of teaching? Seminars or classes for
beginning teachers (1=Yes, 0=No)
W1T0224 SASS 39d Did you receive the following kinds of support during
your FIRST year of teaching? Extra classroom
assistance (e.g., teacher aides) (1=Yes, 0=No)
W1T0225 SASS 39e Did you receive the following kinds of support during
your FIRST year of teaching? Regular supportive
communication with your principal, other
administrators, or department chair (1=Yes, 0=No)

166
W1T0226 SASS 39f Did you receive the following kinds of support during
your FIRST year of teaching? Ongoing guidance or
feedback from a master or mentor teacher (1=Yes,
0=No)
W2MNFRQ* TFS 18e/8e How frequently did you work with your master or
mentor teacher during the 2007-08 school year? (3=At
least once a week, 2=Once or twice a month, 1=A few times a year, 0=Never)
W2MNGRA TFS 18d/8d Has your master or mentor teacher ever instructed
students in the same grade level(s) as yours?
(1=Yes, 0=No)
W2MNIMP* TFS 20/10 Overall, to what extent did your assigned master or
mentor teacher improve your teaching last school year
(2007-08)? (0=Not at all, 1=To a small extent, 2=To a moderate extent, 3=To a great extent)
W2MNOBS* TFS 18f/8f How frequently did your master or mentor teacher
observe your teaching during the 2007-08 school year?
(3=At least once a week, 2=Once or twice a month, 1=A few times a year, 0=Never)
W2MNSUB TFS 18c/8c Has your master or mentor teacher ever instructed
students in the same subject area(s) as yours? (1=Yes, 0=No)
W2MNTYN TFS 18a/8a Last school year (2007-08), were you assigned a master
or mentor teacher by your school or school district?
(1=Yes, 0=No)
W2FCSTS NCES created Former=1 or Current=2 status in year 2 (2008-09)
W2STTUS NCES created 3-way teacher status in year 2 (2008-09)
(1=Leavers, 2=Stayers, 3=Movers)
W3FCSTS NCES created Former=1 or Current=2 status in year 3 (2009-10)
W3STTUS NCES created 4-way teacher status in year 3 (2009-10)
(1=Leavers, 2=Stayers, 3=Movers, 4=Returners)
INDUCT CREATED Level of induction (combinations of W1T0221-226)
(4=Yes to all six, 3=Yes to (2,3,5,6 - Lit Review), 2=Yes to (3,5,6), 1=Yes to (3&5), 0=No to all)

167
INDUCT2 CREATED Induction that included Seminars & Supportive
Administrators - (W1T0223 & W1T0225) (1=Yes to (3 & 5), 0=No to both)
MNGRASUB CREATED Mentor in both grade and/or subject (combinations of
W2MNGRA & W2MNSUB) (3=Both, 2=Subject only,
1=Grade only, 0=Neither)
MENTIMP CREATED Collapses W2MNIMP from 4 categories into 2
(1=HIGH, 0=LOW)
MENTIND CREATED Mentoring & Induction (combinations of W1T0220 &
W2MNTYN) (3=Both, 2=Induction only, 1=Mentoring
only, 0=Neither)
WEIGHTING VARIABLES
W2RAFWT weighting variable for wave 2 variables (includes retrospective cases)
W3AFWT weighting variable for wave 3 variables