composites: part b - core.ac.uk · 50.3 wt% rpp, 44.5 wt% rwf, 3.9 wt% mapp, 0.2 wt% uv stabilizer,...
TRANSCRIPT

Composites: Part B 56 (2014) 350–357
Contents lists available at ScienceDirect
Composites: Part B
journal homepage: www.elsevier .com/locate /composi tesb
The optimal formulation of recycled polypropylene/rubberwood flourcomposites from experiments with mixture design
1359-8368/$ - see front matter � 2013 Elsevier Ltd. All rights reserved.http://dx.doi.org/10.1016/j.compositesb.2013.08.041
⇑ Corresponding author. Tel.: +66 74 287151; fax: +66 74 558829.E-mail address: [email protected] (T. Ratanawilai).
Chatree Homkhiew a, Thanate Ratanawilai a,⇑, Wiriya Thongruang b
a Department of Industrial Engineering, Faculty of Engineering, Prince of Songkla University, Hat Yai, Songkhla 90112, Thailandb Department of Mechanical Engineering, Faculty of Engineering, Prince of Songkla University, Hat Yai, Songkhla 90112, Thailand
a r t i c l e i n f o
Article history:Received 4 April 2013Received in revised form 8 July 2013Accepted 12 August 2013Available online 20 August 2013
Keywords:A. Polymer–matrix composites (PMCs)B. Mechanical propertiesC. Statistical properties/methodsE. Extrusion
a b s t r a c t
A mixture design was used in experiments, to determine the optimal mixture for composites of rubber-wood flour (RWF) and reinforced recycled polypropylene (rPP). The mixed materials were extruded intopanels. Effects were determined of the mixture components rPP, RWF, maleic anhydride-grafted polypro-pylene (MAPP), and ultraviolet (UV) stabilizer, on the mechanical properties. The overall composition sig-nificantly affected flexural, compressive, and tensile properties. The fractions of recycled polypropyleneand rubberwood flour increased all the mechanical material properties; however, increasing one fractionmust be balanced by decreasing the other, and the rubberwood flour fraction had a higher effect size. Thefraction of MAPP was best kept in mid-range of the fractions tested, while the UV stabilizer fraction over-all degraded the mechanical properties. Our results suggest that the fraction of UV stabilizer should be assmall as possible to minimize its negative influences. The models fitted were used for optimization of adesirability score, substituting for the multiple objectives modeled. The optimal formulation found was50.3 wt% rPP, 44.5 wt% RWF, 3.9 wt% MAPP, 0.2 wt% UV stabilizer, and 1.0 wt% lubricant; the compositemade with this formulation had good mechanical properties that closely matched the model predictions.
� 2013 Elsevier Ltd. All rights reserved.
1. Introduction
Wood waste is generated when wood is processed for variousapplications, such as in sawmills and in furniture making. Thewaste in the forms of flour, sawdust, and chips, has primarily beenused as inexpensive filler in plastic industries, to reduce raw mate-rial costs and to increase the strength and modulus of various ther-moplastics. Likewise, the wood particles show high specificstrength and modulus that allow the production of low-densitycomposites with higher filler content [1,2], and advantages associ-ated with wood particles include their non-abrasive nature, lowenergy consumption, and biodegradability. Hence, these naturalplant-based fillers offer several benefits over synthetic fillers [1].Recent advances in natural fillers may lead to improved materialsusing renewable resources; this trend would also support globalsustainability [3]. The mechanical properties of environmentallyfriendly plastic composites have been improved with wood wastefrom various tree species including eastern red cedar [4], maple[5], oak [4], pine [6], and rubberwood [7]. In addition, the increas-ing worldwide production and consumption of plastics has causedserious public concerns about effective and safe disposal [8]; how-ever, plastic waste could be a promising raw material source for
wood plastic composites (WPCs) [9]. The use of recycled plasticsfor producing WPCs would not only decrease the consumption ofenergy and natural resources, but also offers an effective and safeway to dispose of plastic waste [10]. Therefore, increasing theuse of wood and plastic waste could reduce solid waste, lessenthe amounts going to landfills, and decrease the cost of makingWPCs [6,8].
A D-optimal mixture experimental design is a special type ofstatistical approach to experimentally find the individual effectsand interactions of components in a mixture, and the fitted modelscan be used to find the optimal formulation of a composite mate-rial [11]. A D-optimal design can considerably reduce the numberof experiments needed for scientific and technical information onthe composition effects. It allows restricting the ranges of compo-nent fractions, and within this range of formulations helps fit themathematical models, used to improve the characteristics of finalgoods [11,12]. Moreover, this method is appropriate for non-linearmodels [13].
The fractions of components in wood–plastic composites, suchas polymer, filler and coupling agent, significantly affect theirmechanical properties. Recently, several publications have as-sessed the effects of each material component on the thermaland mechanical properties. Mixture designs and factorial designshave been used in experiments on WPCs. Matuana et al. [14] useda four-factor central composite design to develop a response

Table 1Selected components and their constraints for the mixturedesign of experiments.
Component Fraction restriction (wt%)
rPP (x1) 50 6 x1 6 70RWF (x2) 25 6 x2 6 45MAPP (x3) 3 6 x3 6 5UV stabilizer (x4) 0 6 x4 6 1Lub (x5) =1
C. Homkhiew et al. / Composites: Part B 56 (2014) 350–357 351
surface model and to study the foamability of rigid PVC/wood-flourcomposites. Stark and Matuana [15] applied a 24 factorial design todetermine the effects of two hindered amine light stabilizers, a col-orant, an ultraviolet absorber, and their interactions on the photostabilization of wood flour/high-density polyethylene composites.Jun et al. [16] used a Box-Behnken design with response surfacemethod to determine which variables influenced board perfor-mance significantly. Prior studies on the component effects andinteractions, and optimization of the formulation for WPCs, seemnot to have used a D-optimal mixture design. Here, a D-optimalmixture design was applied to model mechanical characteristicsof WPCs. The main objective of this work was to optimize the mix-ture ratios for composites made from recycled polypropylene andrubberwood flour, based on mechanical properties determinedexperimentally. The new information will facilitate informed deci-sions regarding manufacture of such composites.
2. Materials and methods
2.1. Materials
Rubberwood flour (RWF) collected from a local furniture factorywas used as lignocellulosic filler, and the size of the wood flourparticles was smaller than 180 lm, after sieving through a stan-dard sieve of 80 mesh. The chemical composition of RWF was, byweight: cellulose 39%; hemicellulose 29%; lignin 28%; and ash 4%[17]. Withaya Intertrade Co., Ltd. (Samutprakarn, Thailand) sup-plied recycled polypropylene (rPP) pellets with a melt flow indexof 11 g/10 min at 230 �C, under the trade name WT170. The inter-facial adhesion between wood flour and polymer was improvedusing maleic anhydride grafted polypropylene (MAPP), suppliedby Sigma–Aldrich (Missouri, USA), with 8–10% of maleic anhydride(Mw = 9100, Mn = 3900) as a coupling agent. The ultraviolet (UV)stabilizer used was hindered amine light stabilizer additive, pur-chased from TH Color Co., Ltd. (Samutprakarn, Thailand) underthe trade name MEUV008. Paraffin wax chosen as the lubricant(Lub) was supplied by Nippon Seiro Co., Ltd. (Yamaguchi, Japan).
2.2. Experimental design to optimize formulation
The responses of a process to various factors and parameters areeffectively explored with designed experiments, using approachessuch as the Taguchi method, factorial design, and mixture design[18,19]. The fractions of components in a mixture cannot be chan-ged independently, and for this situation the mixture designs areappropriate. The nonnegative fractions must add up to 100%. Forexample, if x1, x2, . . . ,xl denote the fractions of l components of amixture, then [18]
0 6 xi 6 1 i ¼ 1;2; . . . ; l
and x1 þ x2 þ . . .þ xl ¼ 1 ði:e:; 100%Þ
The region of interest for the current experiments is not this sim-plex but has additional constraints added [18], so a D-optimal de-sign was used to statistically evaluate the effects of componentfractions on the mechanical properties, and the identified modelswere used to optimize the formulation. The optimized experimentaldesign had mixture compositions for the manufacture of WPCs, thecomponents being rPP (x1), RWF (x2), MAPP (x3), UV (x4), and Lub(x5). The upper and lower limits of experimental range for the frac-tions are shown in Table 1. Despite the fraction of Lub being heldconstant, it is included as a variable because it contributes to the100% in the mixture. The experimental design and analysis weredone with Design-Expert software (version 8.0.6, Stat-Ease, Inc.),according to D-optimal mixture design. The design included 15
different formulations and 5 replicates to check the lack of fit. Thus,the total number of runs was 20, as shown in Table 2. After data col-lection, linear and quadratic models following Eqs. (1) and (2),respectively, were used to model the responses.
Y ¼Xl
i¼1
bixi ð1Þ
Y ¼Xl
i¼1
bixi þXXl
i<j
bijxixj ð2Þ
where Y is the predicted response, bi is the model response to a purecomponent in the blend, each bij scales an interaction between com-ponents, xi, xj, . . . ,xl are the fractions of components, and xixj,xixk, -. . . ,xkxl are the quadratic interactions of the fractions. Note thatmixture models differ in appearance from the general polynomialsapplied in response surface work, because the constraint
Pxi = 1
enables elimination of terms quadratic in a single fraction [18]. Be-cause of this, Eq. (2) has the same power to fit data from mixtures asa general quadratic polynomial; such a polynomial can be rewrittenin this form.
2.3. Composites processing
To minimize its moisture content, the rubberwood flour wascarefully dried prior to use; in an oven at 110 �C for 8 h. WPCs werethen manufactured in a two-stage process. In the first stage to pro-duce WPC pellets, rubberwood flour and recycled polypropylenewere dry-blended, and then melt-blended into wood–plastic com-posite pellets using a twin-screw extruder machine (Model SHJ-36from En Mach Co., Ltd., Nonthaburi, Thailand). The 10 temperaturezones of the extruder were set to a profile in range 130–170 �C, toreduce degradation of the mixture components, while the screwrotating speed was controlled at 70 rpm. The extruded strandpassed through a water bath and was subsequently pelletized. Inthe second stage to produce WPC panels, the WPC pellets wereagain dried at 110 �C for 8 h. WPC pellets, MAPP, UV stabilizer,and lubricant compositions indicated in Table 2 were then dry-mixed, and added into the feeder of a twin-screw extruder. Theprocessing conditions for extruding were as follows: (1) barreltemperatures: 130–190 �C; (2) screw rotation speed: 50 rpm; (3)melt pressure: 0.10–0.20 MPa depending on wood flour content;and (4) vacuum venting at nine temperature zones: 0.022 MPa.The samples were extruded through a 9 mm � 22 mm rectangulardie and cooled in atmospheric air. Consequently, the specimenswere machined following the standards of American Society forTesting and Materials (ASTM) for flexural, compressive, and tensiletests.
2.4. Mechanical properties
Flexural properties were measured in a three-point bending testat a cross-head speed of 2 mm/min, with nominal dimensions of4.8 mm � 13 mm � 100 mm, and a span of 80 mm in accordancewith ASTM D790-92. For compressive properties, prism specimenswere used to determine the compressive strength and modulus.

Table 2Experimental compositions and responses based on mixture experiment design.
Experiment run no. Mixture component fraction (wt%) Response (MPa)
Flexure Compression Tension
x1 x2 x3 x4 x5 MOR MOE CS CM TS TM
1 63.9 29.9 4.5 0.7 1.0 39.38 2120 12.43 978 24.86 8332 70.0 25.0 3.0 1.0 1.0 36.84 1807 9.45 763 23.89 7873 50.0 43.0 5.0 1.0 1.0 36.91 2429 8.89 1133 23.37 10584 54.9 38.9 4.5 0.7 1.0 41.62 2387 14.43 1018 26.17 9675 59.5 34.5 5.0 0.0 1.0 42.51 1965 14.82 830 26.32 8726 55.4 39.9 3.5 0.2 1.0 43.97 2472 16.44 1123 28.10 9977 59.5 34.5 4.0 1.0 1.0 36.64 2119 9.03 945 23.79 9618a 59.5 34.5 5.0 0.0 1.0 41.41 2040 15.61 915 27.42 8679 50.0 44.3 4.3 0.5 1.0 40.44 2569 15.02 1287 26.84 106710 68.0 25.0 5.0 1.0 1.0 37.04 2007 8.21 826 23.29 73811 50.0 45.0 3.0 1.0 1.0 39.66 2685 13.59 1202 23.97 99312a 50.0 43.0 5.0 1.0 1.0 37.85 2485 10.23 1236 24.00 108313 60.3 35.3 3.0 0.5 1.0 40.23 2175 15.73 1151 25.38 87914 64.9 30.4 3.5 0.2 1.0 41.01 1969 13.02 832 25.20 76515a 70.0 25.0 3.0 1.0 1.0 36.94 1760 8.25 711 23.00 64916 51.0 45.0 3.0 0.0 1.0 46.24 2601 17.96 1449 28.36 108717a 51.0 45.0 3.0 0.0 1.0 47.63 2740 18.20 1418 28.33 107418a 50.0 45.0 3.0 1.0 1.0 39.49 2676 11.74 1262 24.70 102419 70.0 25.0 4.0 0.0 1.0 38.95 1902 10.55 1006 24.65 76020 69.0 25.0 5.0 0.0 1.0 38.44 1929 8.96 789 25.01 785
a Duplicate experiments.
Table 3Tabulation of p-values from analysis of variance, for the quadratic and linear models, and for the individual interaction terms included in the quadratic models.
Resource MOR MOE CS CM TS TM
Model Quadratic Quadratic Quadratic Quadratic Quadratic Linear<0.0001* <0.0001* <0.0001* 0.0002* <0.0001* <0.0001*
Linear mixture <0.0001* <0.0001* <0.0001* <0.0001* <0.0001* <0.0001*
x1x2 0.5289 0.0072* 0.1054 0.0958 0.9599 –x1x3 0.8167 0.3759 0.3675 0.9867 0.3210 –x1x4 0.6484 0.0844 0.0171* 0.4518 0.1583 –x2x3 0.7577 0.5301 0.3433 0.9665 0.3374 –x2x4 0.7047 0.0841 0.0196* 0.4440 0.1918 –x3x4 0.5885 0.0195* 0.0273* 0.1605 0.1815 –Lack of Fit 0.0628 0.4678 0.2521 0.0631 0.5874 0.6260
* P-value less than 0.05 is considered significant.
Table 4Model adequacy indicators for each modeled response of rPP/RWF composites.
Response R2 Adj-R2 Pred-R2 CV
MOR 0.9390 0.8841 0.5496 2.63MOE 0.9838 0.9693 0.9237 2.51CS 0.9490 0.9031 0.6751 8.15CM 0.9258 0.8589 0.6135 7.94TS 0.9533 0.9112 0.8004 2.04TM 0.9153 0.8995 0.8577 4.72
352 C. Homkhiew et al. / Composites: Part B 56 (2014) 350–357
The displacement rate was a constant 0.5 mm/min, followingASTM standard D6108-97. Type-IV tensile bar specimens withdimensions of 115 mm � 19 mm � 4 mm were cut and machinedfrom the extruded composite panels. The crosshead speed of ten-sile test was 5 mm/min, according to ASTM standard D638-99.The flexural, compressive and tensile measurements were carriedout on an Instron Universal Testing Machine (Model 5582 from In-stron Corporation, Massachusetts, USA) and performed at ambientconditions of 25 �C. Five replicates of each composite formulationwere tested. Extrusion is directional and orients the fibers andpolymer chains. The composite will not be similar in all directions(isotropic); instead, it has a preferred direction. The span in flexuraltesting was in the extrusion direction, and the same for tensiletesting. The compression tests, however, compressed normal tothe extrusion direction.
2.5. Morphological analysis
The interfacial morphology and phase dispersion of the woodflour in the polymeric matrix were assessed by imaging with ascanning electron microscope (SEM). The surfaces were preparedby sputter coating with gold, to prevent electrical charging, andwere imaged with a FEI Quanta 400 microscope (FEI Company,Oregon, USA) at an accelerating voltage of 20 kV. Magnificationsof 150� and 1000� were used.
3. Results and discussion
The D-optimal mixture design of experiments, with five frac-tions as (mutually dependent) variables (that sum to one), had20 runs in a randomized order. The six determined responses wereflexural strength (MOR) and modulus (MOE), compressive strength(CS) and modulus (CM), and tensile strength (TS) and modulus(TM). The results are summarized in Table 2.
3.1. Statistical analysis of the response surface model
Analysis of variance (ANOVA) of the response surface modelsindicated the quadratic model as the best fit with MOR, MOE, CS,CM, and TS, while TM was best fit with a linear model. These best
A: rPP
B: RWF C: MAPPMOR
70.5
45.5
23.5
65.4
40.4
18.4
60.3
35.3
13.3
55.1
30.1
8.1
50.025.0
3.0
39
40
41
42
43
(a)
A: rPP
B: RWF C: MAPPMOE
70.5
45.5
23.5
65.4
40.4
18.4
60.3
35.3
13.3
55.1
30.1
8.1
50.025.0
3.0
2000
2200
2400
2600
(b)
Observation area
Observation area
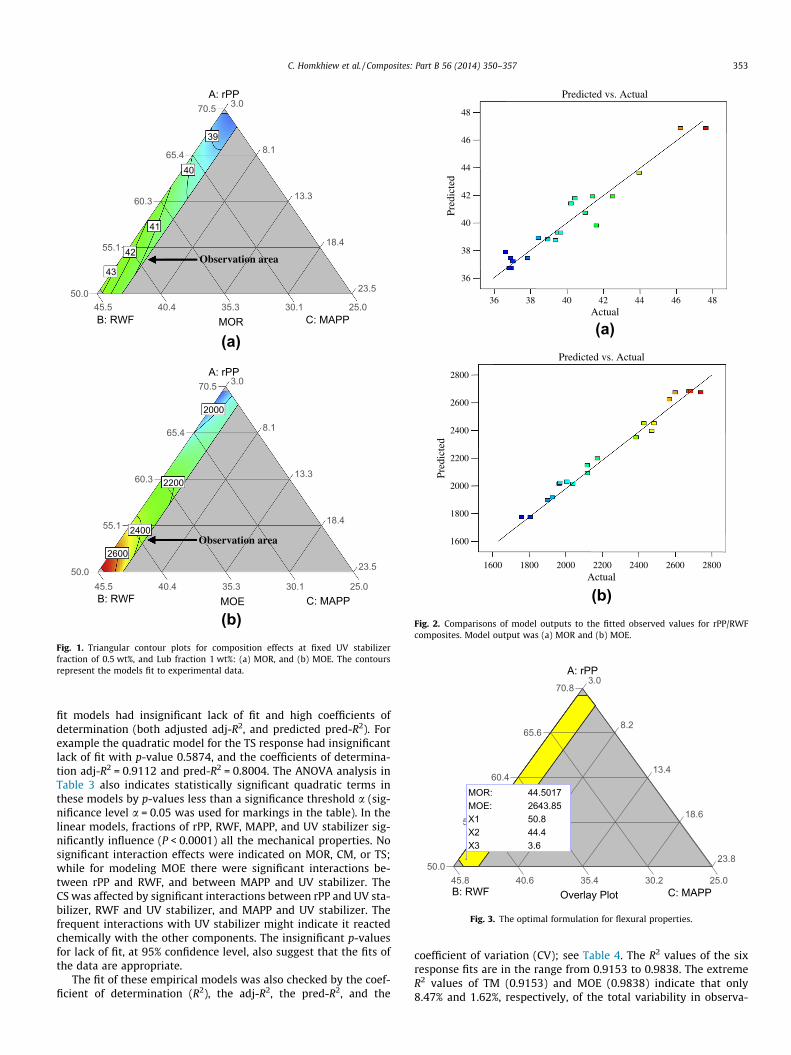
Fig. 1. Triangular contour plots for composition effects at fixed UV stabilizerfraction of 0.5 wt%, and Lub fraction 1 wt%: (a) MOR, and (b) MOE. The contoursrepresent the models fit to experimental data.
(a)
(b)
Actual
Pred
icte
d
Predicted vs. Actual
36
38
40
42
44
46
48
36 38 40 42 44 46 48
Actual
Pred
icte
d
Predicted vs. Actual
1600
1800
2000
2200
2400
2600
2800
1600 1800 2000 2200 2400 2600 2800
Fig. 2. Comparisons of model outputs to the fitted observed values for rPP/RWFcomposites. Model output was (a) MOR and (b) MOE.
A: rPP
C: MAPPB: RWF Overlay Plot
70.8
45.8
23.8
65.6
40.6
18.6
60.4
35.4
13.4
55.2
30.2
8.2
50.025.0
3.0
MOR: 44.5017MOE: 2643.85X1 50.8X2 44.4X3 3.6
Fig. 3. The optimal formulation for flexural properties.
C. Homkhiew et al. / Composites: Part B 56 (2014) 350–357 353
fit models had insignificant lack of fit and high coefficients ofdetermination (both adjusted adj-R2, and predicted pred-R2). Forexample the quadratic model for the TS response had insignificantlack of fit with p-value 0.5874, and the coefficients of determina-tion adj-R2 = 0.9112 and pred-R2 = 0.8004. The ANOVA analysis inTable 3 also indicates statistically significant quadratic terms inthese models by p-values less than a significance threshold a (sig-nificance level a = 0.05 was used for markings in the table). In thelinear models, fractions of rPP, RWF, MAPP, and UV stabilizer sig-nificantly influence (P < 0.0001) all the mechanical properties. Nosignificant interaction effects were indicated on MOR, CM, or TS;while for modeling MOE there were significant interactions be-tween rPP and RWF, and between MAPP and UV stabilizer. TheCS was affected by significant interactions between rPP and UV sta-bilizer, RWF and UV stabilizer, and MAPP and UV stabilizer. Thefrequent interactions with UV stabilizer might indicate it reactedchemically with the other components. The insignificant p-valuesfor lack of fit, at 95% confidence level, also suggest that the fits ofthe data are appropriate.
The fit of these empirical models was also checked by the coef-ficient of determination (R2), the adj-R2, the pred-R2, and the
coefficient of variation (CV); see Table 4. The R2 values of the sixresponse fits are in the range from 0.9153 to 0.9838. The extremeR2 values of TM (0.9153) and MOE (0.9838) indicate that only8.47% and 1.62%, respectively, of the total variability in observa-

Table 5Predicted responses with optimized formulation of each property.
Property Mixture component proportion (wt%) Predicted response (MPa)
x1 x2 x3 x4 x5 Strength Modulus Desirability
Flexure 50.8 44.4 3.6 0.2 1.0 44.50 2643 0.803Compression 51.2 44.2 3.4 0.2 1.0 17.51 1333 0.886Tension 50.0 44.8 4.0 0.2 1.0 28.47 1065 0.975
D: UV
B: RWF C: MAPPCS
11.2
36.2
14.2
8.4
33.4
11.4
5.6
30.6
8.6
2.8
27.8
5.8
0.025.0
3.0
1016 14
(a)
A: rPP
B: RWF C: MAPPCM
70.5
45.5
23.5
65.4
40.4
18.4
60.3
35.3
13.3
55.1
30.1
8.1
50.025.0
3.0
900
1000
1100
12001300
(b)
Observation area
Observation area
Fig. 4. Triangular contour plots for effects of the compositions on (a) CS with rPPfixed at 59.8 wt% and Lub at 1 wt%; and (b) CM with UV stabilizer fixed at 0.5 wt%,and Lub at 1 wt%.
A: rPP
B: RWF C: MAPPTS
70.5
45.5
23.5
65.4
40.4
18.4
60.3
35.3
13.3
55.1
30.1
8.1
50.025.0
3.0
25
26
27
26.45
25.43
27.23
(a)
A: rPP
B: RWF C: MAPPTM
70.5
45.5
23.5
65.4
40.4
18.4
60.3
35.3
13.3
55.1
30.1
8.1
50.025.0
3.0
800
900
1000
1044
933
835
(b)
Observation area
Observation area
Fig. 5. Composition effects on (a) TS and (b) TM. The fractions held fixed were UVstabilizer at 0.5 wt% and Lub at 1 wt%. The contours represent the numerical modelsfitted to experimental observations.
354 C. Homkhiew et al. / Composites: Part B 56 (2014) 350–357
tions was not explained by the models; R2 values close to 1 indicategood fits [20]. The pred-R2 value of MOE was 0.9237, meaning thatthe full model is estimated to explain about 92.37% of the variabil-ity in new data. The coefficients of variation, of MOR, MOE, CS, CM,TS, and TM, were estimated at 2.63%, 2.51%, 8.15%, 7.94%, 2.04%,and 4.72%, respectively, based on the replicates of experiments.The low CV values indicate that the determinations of materialcharacteristics had a good precision, and can serve the fitting ofparametric models. Basically, the coefficient of variation was usedto measure the residual variation in the data [18].
3.2. Effect of composition on the flexural properties, and optimalformulation
The quadratic regression models fitted to experimental MORand MOE values were:
MOR ¼ 39:04x1 þ 47:14x2 þ 107:71x3 � 646:43x4 þ 2:09x1x2
� 77:5x1x3 þ 668:48x1x4 � 102:86x2x3 þ 555:13x2x4
þ 728:26x3x4 ð3Þ

(a) (150×) (b) (1000×)
(c) (150×) (d) (1000×)
Rubberwood flour
rPP matrix
Rubberwood flour
rPP matrix
Fig. 6. Scanning electron micrographs of rPP/RWF composites with (a), (b) 25 wt% RWF and (c), (d) 45 wt% RWF. Magnifications were 150� and 1000�, from left to right.
C. Homkhiew et al. / Composites: Part B 56 (2014) 350–357 355
MOE ¼ 1803:43x1 þ 2743:06x2 � 11575:14x3 � 136983x4
� 573:4x1x2 þ 16071:92x1x3 þ 145070x1x4
þ 11237:53x2x3 þ 145344:6x2x4 þ 192792:7x3x4 ð4Þ
The equation of MOR shows a negative coefficient for fractionof UV stabilizer (x4), and MOE shows negative coefficients forMAPP (x3) and UV stabilizer (x4). However, since these are qua-dratic models, also the quadratic interaction terms must be in-spected, for example at some reasonable values of the otherfractions. This is why linear models are much more interpret-able, and even on inspecting them, the dependency betweenthe fractions (they must sum to one) makes model interpretationdifficult. The addition of UV stabilizer in the wood–plastic com-posites is known to reduce the flexural properties due to non-homogeneous spatial distribution of wood flour, polymer, andUV stabilizer [21]. The covered experimental regions of MORand MOE are shown in Fig. 1a and b, respectively. In these trian-gular plots the three pure components (rPP, RWF, and MAPP) arerepresented by the corners, while the additive levels were fixed(UV stabilizer at 0.5 wt% and Lub at 1 wt%). The contours in thecolored areas, that include the experimental observations, pres-ent the MOR and MOE regression fits varying from 39 to43 MPa and 2000 to 2600 MPa, respectively. MOR and MOEclearly increase with the rubberwood flour content, and its goodinterfacial adhesion to recycled polypropylene contributes tothis. MAPP acts as a compatibilizer providing a hydrophobic richlayer attached to wood flour [22]. Generally, the strength andmodulus of wood flour reinforced composites depend on theproperties of constituents and the interfacial adhesion [22]. TheMAPP addition of about 3–4 wt% is close to optimal for MOE,based on the regression fit. Similar results were found in the
work of Kuo et al. [23] who reported that the optimal contentof MAPP was 3–4.5 wt% because the interfacial adhesion weak-ens at higher MAPP contents.
Fig. 2a and b shows the MOR and MOE model predictions vs.observations. The model outputs fit the actual observations quitewell, with MOR model deviating from actual by less than about5%, and MOE model being slightly more accurate. These correla-tions verified that the Eqs. (3) and (4) are adequate to predict theMOR and MOE responses. The numerically optimized composition,based on these model fits, is shown in Fig. 3. Since two models areoptimized simultaneously, the software actually uses a single sur-rogate called ‘‘desirability’’ to balance them. The model-based opti-mal formulation is included in Table 5.
3.3. Effect of composition on the compressive properties, and optimalformulation
The quadratic regression models for the compressive propertiesCS and CM were:
CS ¼ 9:76x1 þ 18:28x2 þ 287:82x3 � 3776:11x4 þ 5:56x1x2
� 299:68x1x3 þ 3956:09x1x4 � 314:6x2x3
þ 3852:86x2x4 þ 3278:65x3x4 ð5Þ
CM ¼ 1014:25x1 þ 1461:58x2 � 1406:56x3 � 87880:43x4
� 462:14x1x2 þ 435:39x1x3 þ 87388:18x1x4
� 1096:7x2x3 þ 89032x2x4 þ 155014:6x3x4 ð6Þ
Again these equations do not lend themselves to easy interpreta-tion, due to interaction terms and dependencies between the model

A: rPP
B: RWF C: MAPPDesirability
70.8
45.8
23.8
65.6
40.6
18.6
60.4
35.4
13.4
55.2
30.2
8.2
50.025.0
3.0
0.4
0.4
0.8Prediction 0.846
A: rPP
B: RWF C: MAPPOverlay Plot
70.8
45.8
23.8
65.6
40.6
18.6
35.4
13.4
5
30.2
8.2
50.025.0
3.0
MOR: 43.8211MOE: 2628.17CS: 16.8844CM: 1292.66TS: 28.3218TM: 1059.16X1 50.3X2 44.5X3 3.9
Fig. 7. The optimal formulation for overall desirability.
Table 6Predicted and observed responses with the formulation optimized jointly for all themechanical properties.
Mixture componentproportion (wt%)
Response (MPa)
Flexure Compression Tension
x1 x2 x3 x4 x5 MOR MOE CS CM TS TM
Predicted 50.3 44.5 3.9 0.2 1.0 43.82 2628 16.88 1292 28.32 1059Observed 47.28 2527 17.11 1369 27.68 1024
(2.92)a (112) (2.72) (109) (2.41) (128)
a The values in parentheses are standard deviations from five replicates.
356 C. Homkhiew et al. / Composites: Part B 56 (2014) 350–357
input variables. We resort to inspecting plots of the model outputs.Fig. 4a shows that CS (in range of 16–10 MPa) decreases for highfractions of the UV stabilizer. The reason for this phenomenon isprobably similar to what was discussed in relation to flexural prop-erties. In Fig. 4b, the CM values vary in range of 900–1300 MPa andincrease with wood flour loading, since wood flour is stiffer thanneat plastic [24]. Likewise, the optimal addition of MAPP for thecompressive modulus is approximately 3–4 wt%. Too much MAPPrelative to wood flour will cause self-entanglement, resulting inslippage with the PP molecules [25]. The optimal formulation basedon these regression models is also included in Table 5.
3.4. Effect of composition on the tensile properties, and optimalformulation
The regression fits for the tensile strength (TS) and modulus(TM) were:
TS ¼ 23:54x1 þ 28:64x2 � 112:44x3 � 989:02x4 þ 0:081x1x2
þ 166:14x1x3 þ 1059:37x1x4 þ 159:72x2x3
þ 973:37x2x4 þ 914:15x3x4 ð7Þ
TM ¼ 717:6x1 þ 1067:03x2 þ 1114:53x3 þ 687:04x4 ð8Þ
By these equations, rPP (x1) and RWF (x2) increase the tensile prop-erties; all terms containing these variables have positive coeffi-cients. Of these two, RWF has the larger coefficient in the fit for
TS and TM, so it should be maximized. The fractions of MAPP (x3)and UV stabilizer (x4) each have both positive and negative coeffi-cients in the model for tensile strength, but both increase the tensilemodulus. Fig. 5a and b show that TS and TM increase with the rub-berwood flour content. The SEM micrographs in Fig. 6 show that thecomposites with 25 and 45 wt% of RWF had low porosity, good con-tact between the wood flour and the PP matrix, and good dispersionof wood flour. Stress transfer was therefore supported at these highrubberwood flour contents. The composition optimized based onthese regression models is shown numerically in Table 5.
3.5. Optimal formulation of the overall mechanical properties
Multiobjective optimization using all of the regression modelswas performed with the Design-Expert software, using its defaultsettings to construct a desirability score that balances all of the fit-ted models. The plot in Fig. 7 shows the formulation that was con-sidered optimal, along with contours of the desirability score. Theoptimal formulation is given in Table 6, and can be compared withthe formulations in Table 5: all the previous optima were at prac-tically the same formulation, so a reasonable desirability scoremust also give this formulation. Table 6 also shows the model pre-dicted responses for this formulation. Test samples with five repli-cates were prepared with this formulation, and the averagematerial properties along with their standard deviations are in-cluded in Table 6. The maximum deviation between model predic-tion and experimental average occurs for MOR and is of the order10%.
4. Conclusions
Design and analysis of a D-optimal mixture experiment wereused to obtain the optimal formulation of an rPP/RWF composite.The formulation provides high values for all the material character-istics modeled. Analysis of variance revealed that all the compo-nent fractions experimentally varied, namely of rPP, RWF, MAPP,and UV stabilizer, statistically significantly affected every one ofthe mechanical properties (MOR, MOE, CS, CM, TS, and TM). In gen-eral, a high fraction of RWF improved all of these, and the optimafound had close to 45% RWF that was the maximum in the exper-imental design. At this wood flour loading stress transfer was stillsupported by good dispersion and surface contact with the poly-mer, and the wood flour is much stiffer than the rPP matrix. Thecompatibilizer MAPP had negative effects on MOE and CM, whilefor TS a middle of the range value seemed optimal (Fig. 5a). Thefraction of UV stabilizer overall degraded the mechanical proper-ties. While the actual optimal composition may depend on a vari-ety of factors, including the quality of raw materials and processingconditions, we have demonstrated the applicability of particulartechniques to optimizing properties of composites. In this case,the optima for various mechanical properties agreed well, whilein general the joint optimization of multiple responses will dependon their prioritization.

C. Homkhiew et al. / Composites: Part B 56 (2014) 350–357 357
Acknowledgements
The authors would like to express their thanks to the Prince ofSongkla Graduate Studies Grant, the Government budget Fund (Re-search Grant Code: 2555A11502062) for financial supportthroughout this work, and Rubberwood Technology and Manage-ment Research Group (ENG-54-27-11-0137-S) of Faculty of Engi-neering, Prince of Songkla University, Thailand. We would alsolike to thank Research and Development Office (RDO) and Assoc.Prof. Seppo Karrila for editing this article.
References
[1] Ashori A, Nourbakhsh A. Performance properties of microcrystalline celluloseas a reinforcing agent in wood plastic composites. Compos Part B: Eng2010;41(7):578–81.
[2] Liu W, Drzal LT, Mohanty AK, Misra M. Influence of processing methods andfiber length on physical properties of kenaf fiber reinforced soy basedbiocomposites. Compos Part B: Eng 2007;38(3):352–9.
[3] Cheung HY, Ho MP, Lau KT, Cardona F, Hui D. Natural fibre-reinforcedcomposites for bioengineering and environmental engineering applications.Compos Part B: Eng 2009;40(7):655–63.
[4] Kim JW, Harper DP, Taylor AM. Effect of wood species on the mechanical andthermal properties of wood–plastic composites. J Appl Polym Sci2009;112(3):1378–85.
[5] Li T, Yan N. Mechanical properties of wood flour/HDPE/ionomer composites.Compos Part A – Appl Sci Manuf 2007;38(1):1–12.
[6] Adhikary KB, Pang S, Staiger MP. Dimensional stability and mechanicalbehaviour of wood–plastic composites based recycled and virgin high-density polyethylene (HDPE). Compos Part B: Eng 2008;39(5):807–15.
[7] Homkhiew C, Ratanawilai T, Thongruang W. Effect of wood flour content andcooling rate on properties of rubberwood flour/recycled polypropylenecomposites. Adv Mater Res 2012;488–489:495–500.
[8] Ashori A, Sheshmani S. Hybrid composites made from recycled materials:moisture absorption and thickness swelling behavior. Bioresour Technol2010;101(12):4717–20.
[9] Najafi SK, Hamidinia E, Tajvidi M. Mechanical properties of composites fromsawdust and recycled plastics. J Appl Polym Sci 2006;100(5):3641–5.
[10] Khan ZA, Kamaruddin S, Siddiquee AN. Feasibility study of use of recycled highdensity polyethylene and multi response optimization of injection mouldingparameters using combined grey relational and principal component analyses.Mater Des 2010;31(6):2925–31.
[11] Khosrowshahi YB, Salem A. Influence of polyvinyl alcohol and carboxymethylcellulose on the reliability of extruded ceramic body: application of mixturedesign method in fabricating reliable ceramic raschig rings. Int J Appl CeramTechnol 2011;8(6):1334–43.
[12] John RCS. Experiments with mixtures, ill-conditioning, and ridge regression. JQual Technol 1984;16:81–96.
[13] Mannarswamy A, Munson-McGee SH, Andersen PK. D-optimal designs for thecross viscosity model applied to guar gum mixtures. J Food Eng2010;97(3):403–9.
[14] Matuana LM, Mengeloglu F. Manufacture of rigid PVC/wood-flour compositefoams using moisture contained in wood as foaming agent. J Vinyl AdditTechnol 2002;8(4):264–70.
[15] Stark NM, Matuana LM. Ultraviolet weathering of photostabilized wood-flour-filled high-density polyethylene composites. J Appl Polym Sci2003;90(10):2609–17.
[16] Jun Z, Xiang-Ming W, Jian-Min C, Kai Z. Optimization of processing variables inwood–rubber composite panel manufacturing technology. Bioresour Technol2008;99(7):2384–91.
[17] Petchpradab P, Yoshida T, Charinpanitkul T, Matsumura Y. Hydrothermalpretreatment of rubber wood for the saccharification process. Ind Eng ChemRes 2009;48(9):4587–91.
[18] Montgomery DC. Design and analysis of experiments. 7th ed. John Wiley &Sons; 2009.
[19] Mirjalili F, Moradian S, Ameri F. Attaining optimal dyeability and tensileproperties of polypropylene/poly(ethylene terephthalate) blends with aspecial cubic mixture experimental design. J Appl Polym Sci2011;121(6):3201–10.
[20] Amini M, Younesi H, Bahramifar N, Lorestani AAZ, Ghorbani F, Daneshi A, et al.Application of response surface methodology for optimization of leadbiosorption in an aqueous solution by Aspergillus niger. J Hazard Mater2008;154(1–3):694–702.
[21] Wechsler A, Hiziroglu S. Some of the properties of wood–plastic composites.Build Environ 2007;42(7):2637–44.
[22] Ashori A, Nourbakhsh A. Mechanical behavior of agro-residue-reinforcedpolypropylene composites. J Appl Polym Sci 2009;111(5):2616–20.
[23] Kuo PY, Wang SY, Chen JH, Hsueh HC, Tsai MJ. Effects of material compositionson the mechanical properties of wood–plastic composites manufactured byinjection molding. Mater Des 2009;30(9):3489–96.
[24] Garcia M, Hidalgo J, Garmendia I, Garcia-Jaca J. Wood–plastics compositeswith better fire retardancy and durability performance. Compos Part A – ApplSci Manuf 2009;40(11):1772–6.
[25] Mohanty S, Verma SK, Nayak SK, Tripathy SS. Influence of fiber treatment onthe performance of sisal–polypropylene composites. J Appl Polym Sci2004;94(3):1336–45.