composition and distribution of internal resistance in an
TRANSCRIPT

RSC Advances
PAPER
Ope
n A
cces
s A
rtic
le. P
ublis
hed
on 0
5 M
arch
201
9. D
ownl
oade
d on
2/1
7/20
22 8
:42:
03 P
M.
Thi
s ar
ticle
is li
cens
ed u
nder
a C
reat
ive
Com
mon
s A
ttrib
utio
n-N
onC
omm
erci
al 3
.0 U
npor
ted
Lic
ence
.
View Article OnlineView Journal | View Issue
Composition and
aTianjin Institute of Industrial Biotechnolog
7th Avenue, Tianjin Airport Economic
[email protected]; Fax: +86-022-8486-1926bBiofuels Institute, School of the Environme
Zhenjiang 212013, Jiangsu Province, China
Cite this: RSC Adv., 2019, 9, 7292
Received 5th November 2018Accepted 27th February 2019
DOI: 10.1039/c8ra09147a
rsc.li/rsc-advances
7292 | RSC Adv., 2019, 9, 7292–7300
distribution of internal resistancein an enzymatic fuel cell and its dependence on celldesign and operating conditions
Ranran Wu, a Chunling Ma,a Yang-Chun Yong, ab Yi-Heng P. Job Zhang a
and Zhiguang Zhu *a
A variety of sugar-based enzymatic fuel cells (EFCs) are able to completely oxidize fuels catalyzed by
enzyme cascades, achieving high energy densities. However, the poor power output of EFCs limits their
potential applications. In the present study, the composition of internal resistance throughout the EFCs
affected by various factors, including the separator, enzyme loading, electron acceptor, applied voltage
and operation time, was characterized by electrochemical impedance spectroscopy (EIS). Total
resistance is divided into solution-separator resistance, charge transfer resistance, and diffusion
resistance, respectively. The Nafion 212 membrane was found to yield a small solution-separator
resistance and a high power density. Increased enzyme loading led to reduced internal resistance and
improved cell performance, generating a maximum power density of 0.17 mW cm�2. Using potassium
ferricyanide to replace oxygen as the electron acceptor could improve cathode performance
significantly and resulted in a 4-fold increase in the power density. EIS was also performed for EFCs
operated continuously for 16 h. Power output decreased distinctly over time, while the internal
resistance, primarily the diffusion resistance, increased. Additionally, altering operation voltages had an
impact on diffusion resistances. These results can be summarized that diffusion plays a rather important
role in deciding the power and future efforts should be made towards increasing the mass transfer in EFCs.
1. Introduction
Enzymatic fuel cells (EFCs) have emerged as a promising tech-nology to transform chemical energy to electric power usingenzymes as biocatalysts. They are able to completely oxidizevarious fuels, such as sugar,1–3 alcohol,4 and glycerol,5 to achievehigh energy densities catalyzed by enzyme cascades. Recently,our group has constructed several in vitro pathways tocompletely utilize a variety of inexpensive and widely-availablepentose and hexose fuels, including maltodextrin,6 glucose,3
fructose,2 sucrose,2 and xylose,1 achieving very high Faradayefficiencies. However, the practical application of these sugar-based EFCs is still challenging. Their poor power output isstill far from being applicable to powering portable or wearableelectronic devices. Signicant power loss over time can beobserved because of multiple causes such as enzyme degrada-tion, electrode fouling, and decreased mass transfer efficiency.7
Among our in vitro pathways, sugars are transformed to glucose-6-phosphate (G6P) under the catalysis of different enzymes. The
y, Chinese Academy of Sciences, 32 West
Area, Tianjin 300308, China. E-mail:
; Tel: +86-022-2482-8797
nt, Jiangsu University, 301 Xuefu Road,
oxidation of G6P catalyzed by glucose-6-phosphate dehydroge-nase (G6PDH), as a key reaction, contributes to the electricitygeneration. Meanwhile, nicotinamide adenine dinucleotide(NAD+) is simultaneously reduced to NADH, which is subse-quently re-oxidized by diaphorase (DI), producing two electronsper NADH. The electrons are further transferred to the anode bymediators. Therefore, the investigation of G6P-based EFCallows us to better understand the power limiting factors andenhance the performance of such sugar-based EFCs with highenergy densities.
Developing quantitative models based on the principles offuel cells and biocatalysts and predicting the conditions thatallow EFCs work at peak performance are of crucial importanceto understand the fundamentals of EFCs and implement theirapplications. Various electrochemical tools such as cyclic vol-tammetry, differential pulse voltammetry, polarization curve,and chronoamperometry, have been employed to study theeffects of cell conguration, electrode materials and operatingconditions on the performance of many types of fuel cells.Among them, electrochemical impedance spectroscopy (EIS)has been demonstrated as a powerful technique to evaluate fuelcell properties and parameters.8,9 Different from other electro-chemical techniques, EIS is considered as non-intrusive (i.e., itcan be performed without disturbing the cell), and is ofappreciable signicance in diagnosing highly heterogeneous
This journal is © The Royal Society of Chemistry 2019

Paper RSC Advances
Ope
n A
cces
s A
rtic
le. P
ublis
hed
on 0
5 M
arch
201
9. D
ownl
oade
d on
2/1
7/20
22 8
:42:
03 P
M.
Thi
s ar
ticle
is li
cens
ed u
nder
a C
reat
ive
Com
mon
s A
ttrib
utio
n-N
onC
omm
erci
al 3
.0 U
npor
ted
Lic
ence
.View Article Online
and complex systems.10 For example, several studies have beenfocused on the identication of the contribution of differentinternal resistances to the overall impedance of microbial fuelcells (MFCs), in order to nd out the rate-limiting factor and drawthe optimum power output.11–13 Generally, the overall internalresistance in MFCs can be determined by many aspects such aselectrode, electrolyte, charge transfer, as well asmass transfer. Yet,the quantitative composition and distribution of the resistancesand their dynamics under operation conditions remain unclear.
Since EFCs are very similar in principle and in conguration toMFCs, the same equivalent circuit model used for EIS studies ofMFCs may also be suitable to analyze the impedance spectra ofEFCs.14 To our limited knowledge, although EIS has beenemployed in a few studies to investigate immobilized enzymeelectrodes15,16 or EFCs at limited operating conditions17 recently,more systematic work is desired to provide a better understandingfor the distribution and dynamics of the resistances in EFCs.
Among various components of internal resistance, the onecaused by separators is the most straightforward as they physi-cally separate anodic and cathodic chambers and largely blockthe mass transfer in electrolyte, and it has been studied andoptimized in MFCs since a decade ago.18,19 More recently, severalmembraneless EFCs have been constructed to totally remove theseparator resistance and achieve the high power output, becauseof effective enzyme immobilization and high enzyme speci-city.20–22 Besides separators, operating conditions also signi-cantly inuence the EFC performance. For example, Aaron et al.have demonstrated that in a hybrid EFC catalyzed by Pt on theanode and laccase on the cathode, increased enzyme loadingresults in improved power output and reduced internal resis-tance; EFCs operated continuously for 2 days lead to increases forall internal resistances; varying air-humidication temperatureshave little effect on internal resistance.17 Wu et al. have investi-gated the electron transfer resistance of laccase-immobilizedglassy carbon cathodes and concluded their electrochemicalprocess as diffusion-limited.23Campell et al. have also used EIS toexamine the surface characteristics of the gold/carbon nanotubeber anodes with various adsorbed materials and revealeda dramatically decreased electron transfer resistance by themodication of glucose oxidase with ferrocenyl acrylamide.24
Hereby, to systematically investigate the impact of separatorsand operating conditions on aforementioned sugar-based EFCperformance, such as enzyme concentration, operation voltage,as well as operating time, a model EFC based on G6P oxidationwas built and a detailed internal resistance analysis was con-ducted. The total internal resistance was divided into solution-separator, charge transfer, and diffusion resistances, to identifyexactly which part of the internal resistance contributes to thechanges in the performance under different operating condi-tions. This study can be used to guide the future design of EFCswith minimum internal resistance and enhanced performance.
2. Experimental2.1 Materials
NAD+ and G6P purchased from Sigma-Aldrich (St. Louis, MO,USA) were reagent-grade. 1-Ethyl-3-[3-dimethylaminopropyl]
This journal is © The Royal Society of Chemistry 2019
carbodiimide hydrochloride (EDC) and poly-L-lysine (PLL)were purchased from Solarbio (Beijing, China). Multi-wallcarbon nanotubes modied with carboxyl groups (CheapTubes Inc, Cambridgeport, VT, USA) were well dispersed ina 50% ethanol solution with a concentration of 5 mg mL�1. Allother chemicals were analytical reagent grade and purchasedfrom Sinopharm Chemical Reagent Co., Ltd (Shanghai, China).E. coli Top10 was used for DNA manipulation, and BL21 (DE3)containing a protein expression plasmid was used to producethe recombinant enzymes. E. coli cell growth and recombinantprotein expression were performed in Luria–Bertani mediumcontaining either 50 mg L�1 kanamycin or 100 mg L�1 ampi-cillin at 37 �C. Glucose-6-phosphate dehydrogenase (G6PDH)and diaphorase (DI) were puried using heat precipitation asdescribed elsewhere.1
2.2 Preparation of bioanodes
Carbon felts (CF, Fuel Cell Earth, Stoneham, MA, USA) were cutinto 1 � 1.5 cm2 and utilized to fabricate the bioanodes. Beforebeing used, CFs were rst treated with acetone (24 h) and 0.1 MHCl (24 h) successively and washed up with Milli-Q water. Then,200 mL of 25 mM EDC solution, 100 mL of a PLL aqueous solu-tion (2% (w/v)), 600 mL multi-walled carbon nanotube solution(5 mg mL�1 in 50% ethanol), 24 mg G6PDH, 12 mg DI, and 120mL of a vitamin K3 (VK3) solution (0.29 M in acetone) were addedonto the CF in the order mentioned. Drying at 40 �C for 20 minfollowed aer each addition step. The enzyme-modied elec-trodes were rinsed in distilled water for 2 h to wash out non-immobilized enzymes before electrochemical measurements.
2.3 EFC reactors and operation
Two-chambered, cubic-shaped EFCs with separate anodic andcathodic chambers were used in this study. Each chamber was1 cm thick with an open internal area of 2 � 2 cm2. Enzymaticreaction occurred at the bioanode to generate the electronswhile the terminal electron acceptor at the cathode was eitheroxygen or ferricyanide. The anolyte contained 4 mM NAD+,100 mM G6P in a HEPES buffer (100 mM, pH 7.30) solutioncomprising of 100 mM NaCl, 5 mM MgCl2 and 0.5 mM MnCl2.For oxygen-based EFCs, HEPES (100 mM, pH 7.30) buffer servedas the electrolyte in both chambers and Naon 212, cellophaneor glass ber lter were used as the separator. Cathodes weremade from wet proong carbon cloth (CC, HCP330, ShanghaiChu Xi Industrial Co., LTD), with the water side coated by the Pt/C catalyst (0.5 mg cm�2 Pt) via 5% Naon and isopropanol asthe binder. In the tests using potassium ferricyanide as theelectron acceptor, 100 mM NaCl served as catholyte and carbonclothes were used as cathode supporters. The projected area ofthe carbon cloth was 2 � 2 cm2. In the ferricyanide-based EFC,the cathodic and anodic chambers were separated by Naon212. The anode current collector was made of titanium wire,while the cathode current collector was a stainless steel mesh incontact with the cathode electrode. All experiments were oper-ated in a batch mode at the room temperature in this study. Aschematic of the EFC is shown in Fig. 1.
RSC Adv., 2019, 9, 7292–7300 | 7293
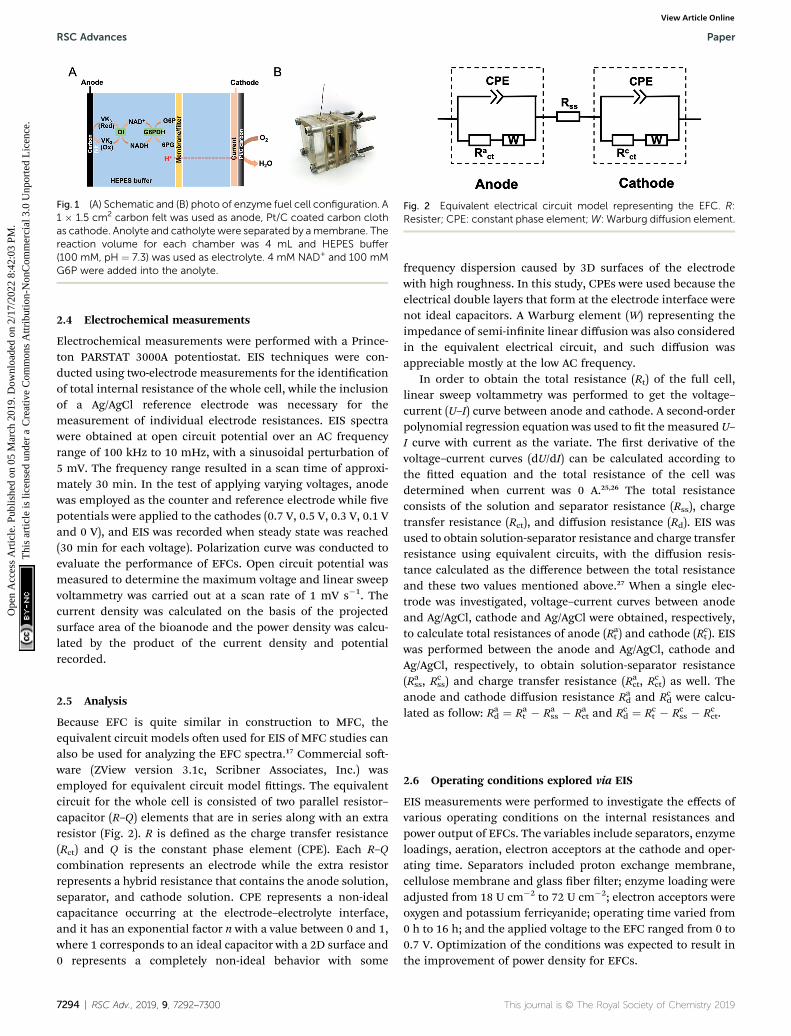
Fig. 1 (A) Schematic and (B) photo of enzyme fuel cell configuration. A1 � 1.5 cm2 carbon felt was used as anode, Pt/C coated carbon clothas cathode. Anolyte and catholyte were separated by amembrane. Thereaction volume for each chamber was 4 mL and HEPES buffer(100 mM, pH ¼ 7.3) was used as electrolyte. 4 mM NAD+ and 100 mMG6P were added into the anolyte.
Fig. 2 Equivalent electrical circuit model representing the EFC. R:Resister; CPE: constant phase element;W: Warburg diffusion element.
RSC Advances Paper
Ope
n A
cces
s A
rtic
le. P
ublis
hed
on 0
5 M
arch
201
9. D
ownl
oade
d on
2/1
7/20
22 8
:42:
03 P
M.
Thi
s ar
ticle
is li
cens
ed u
nder
a C
reat
ive
Com
mon
s A
ttrib
utio
n-N
onC
omm
erci
al 3
.0 U
npor
ted
Lic
ence
.View Article Online
2.4 Electrochemical measurements
Electrochemical measurements were performed with a Prince-ton PARSTAT 3000A potentiostat. EIS techniques were con-ducted using two-electrode measurements for the identicationof total internal resistance of the whole cell, while the inclusionof a Ag/AgCl reference electrode was necessary for themeasurement of individual electrode resistances. EIS spectrawere obtained at open circuit potential over an AC frequencyrange of 100 kHz to 10 mHz, with a sinusoidal perturbation of5 mV. The frequency range resulted in a scan time of approxi-mately 30 min. In the test of applying varying voltages, anodewas employed as the counter and reference electrode while vepotentials were applied to the cathodes (0.7 V, 0.5 V, 0.3 V, 0.1 Vand 0 V), and EIS was recorded when steady state was reached(30 min for each voltage). Polarization curve was conducted toevaluate the performance of EFCs. Open circuit potential wasmeasured to determine the maximum voltage and linear sweepvoltammetry was carried out at a scan rate of 1 mV s�1. Thecurrent density was calculated on the basis of the projectedsurface area of the bioanode and the power density was calcu-lated by the product of the current density and potentialrecorded.
2.5 Analysis
Because EFC is quite similar in construction to MFC, theequivalent circuit models oen used for EIS of MFC studies canalso be used for analyzing the EFC spectra.17 Commercial so-ware (ZView version 3.1c, Scribner Associates, Inc.) wasemployed for equivalent circuit model ttings. The equivalentcircuit for the whole cell is consisted of two parallel resistor–capacitor (R–Q) elements that are in series along with an extraresistor (Fig. 2). R is dened as the charge transfer resistance(Rct) and Q is the constant phase element (CPE). Each R–Qcombination represents an electrode while the extra resistorrepresents a hybrid resistance that contains the anode solution,separator, and cathode solution. CPE represents a non-idealcapacitance occurring at the electrode–electrolyte interface,and it has an exponential factor n with a value between 0 and 1,where 1 corresponds to an ideal capacitor with a 2D surface and0 represents a completely non-ideal behavior with some
7294 | RSC Adv., 2019, 9, 7292–7300
frequency dispersion caused by 3D surfaces of the electrodewith high roughness. In this study, CPEs were used because theelectrical double layers that form at the electrode interface werenot ideal capacitors. A Warburg element (W) representing theimpedance of semi-innite linear diffusion was also consideredin the equivalent electrical circuit, and such diffusion wasappreciable mostly at the low AC frequency.
In order to obtain the total resistance (Rt) of the full cell,linear sweep voltammetry was performed to get the voltage–current (U–I) curve between anode and cathode. A second-orderpolynomial regression equation was used to t the measured U–I curve with current as the variate. The rst derivative of thevoltage–current curves (dU/dI) can be calculated according tothe tted equation and the total resistance of the cell wasdetermined when current was 0 A.25,26 The total resistanceconsists of the solution and separator resistance (Rss), chargetransfer resistance (Rct), and diffusion resistance (Rd). EIS wasused to obtain solution-separator resistance and charge transferresistance using equivalent circuits, with the diffusion resis-tance calculated as the difference between the total resistanceand these two values mentioned above.27 When a single elec-trode was investigated, voltage–current curves between anodeand Ag/AgCl, cathode and Ag/AgCl were obtained, respectively,to calculate total resistances of anode (Rat ) and cathode (Rc
t ). EISwas performed between the anode and Ag/AgCl, cathode andAg/AgCl, respectively, to obtain solution-separator resistance(Ra
ss, Rcss) and charge transfer resistance (Ra
ct, Rcct) as well. The
anode and cathode diffusion resistance Rad and Rcd were calcu-
lated as follow: Rad ¼ Ra
t � Rass � Ra
ct and Rcd ¼ Rc
t � Rcss � Rc
ct.
2.6 Operating conditions explored via EIS
EIS measurements were performed to investigate the effects ofvarious operating conditions on the internal resistances andpower output of EFCs. The variables include separators, enzymeloadings, aeration, electron acceptors at the cathode and oper-ating time. Separators included proton exchange membrane,cellulose membrane and glass ber lter; enzyme loading wereadjusted from 18 U cm�2 to 72 U cm�2; electron acceptors wereoxygen and potassium ferricyanide; operating time varied from0 h to 16 h; and the applied voltage to the EFC ranged from 0 to0.7 V. Optimization of the conditions was expected to result inthe improvement of power density for EFCs.
This journal is © The Royal Society of Chemistry 2019

Paper RSC Advances
Ope
n A
cces
s A
rtic
le. P
ublis
hed
on 0
5 M
arch
201
9. D
ownl
oade
d on
2/1
7/20
22 8
:42:
03 P
M.
Thi
s ar
ticle
is li
cens
ed u
nder
a C
reat
ive
Com
mon
s A
ttrib
utio
n-N
onC
omm
erci
al 3
.0 U
npor
ted
Lic
ence
.View Article Online
3. Results and discussion
In general, membrane, enzyme loading, enzyme immobiliza-tion approach, salt concentration, electron mediator participa-tion, external resistance, running time, and so on, were allexpected to contribute to the resistance of EFCs. Because of theenzyme and mediator instability over time, as well as thesubstrate consumption, each experiment was performed withfreshly immobilized enzyme electrode and fresh EFC materialsfor three times to ensure good reproducibility.
3.1 Membrane resistances
Three types of membranes including Naon 212, cellophaneand glass ber were used in this study, and their properties areshown in Table 1. The impedance across the testing membranewas measured by EIS in a two-electrode mode with an anodeserved as the working electrode, and a cathode as the referenceand counter electrode. The resistance corresponded to theminimum x-intercept of each experimental spectrum (closest tothe origin) represented the combined solution and separatorresistance (separator resistance + solution resistance). Toobtain the separator resistance only, the combined resistancewas deducted by the solution resistance, which was obtainedfrom a blank experiment without a separator under the sametesting condition. Fig. 3A shows Nyquist plots and tted curves
Table 1 Comparison of various properties of different separators
Thickness (mm)Exchange capacity(meq. g�1)
Naon 212 50.8 0.95–1.01Glass ber 200 NACellophane 50 NA
Fig. 3 (A) Equivalent circuit fit for Nyquist plots, (B) components ofresistances, polarization curves: profiles of (C) voltage and (D) powerdensity versus current density of EFCs using different membranes/filters. C: cellophane; N: Nafion 212; G: glass fiber. Scan rate for linearscan voltammetry was 1 mV s�1.
This journal is © The Royal Society of Chemistry 2019
according to the equivalent circuit for EFCs equipped withdifferent separators. Distribution of internal resistance wasanalyzed by using an equivalent circuit and presented in Fig. 3B.The results demonstrate that Naon 212 and cellophane exhibitsimilar and pretty low membrane resistances (ca. 8 U) whileglass ber has the largest resistance (ca. 480 U), possibly due tothe highest thickness of the glass ber. Moreover, the diffusionresistance does not change much regardless of using a sepa-rator or not. In addition, we compared the resistances of EFCsusing two different Naon membranes, i.e. Naon 117 andNaon 212, but no evident difference was observed (data notshown).
Open circuit voltage, power density and maximum currentwere also tested on EFCs with different membranes. It can befound that in the presence or absence of a membrane, all theseEFCs can reach to an open circuit voltage of ca. 0.6 V (Fig. 3C).However, the maximum current and power density data variedgreatly. Without a membrane, the maximum power density ofthe EFC was 0.14 mW cm�2 and the maximum current densitywas 1.45 mA cm�2. When using Naon 212, the maximumpower density and current density were even higher, possiblydue to its high selectivity on protons. The maximum power andcurrent density decreased slightly with the EFC using cello-phane as a separator. The glass ber showed the worst perfor-mance, possibly due to its large thickness and high resistance asmentioned above. The results of polarization curve coincidewith the analysis of component internal resistances. Hence,Naon 212 was adopted as the separator in followingexperiments.
3.2 Effects of enzyme loading on anode
The effect of enzyme loading was investigated using a series ofimmobilized enzyme electrodes with different enzyme quanti-ties. According to our experience, the optimal weight ratio ofG6PDH and DI was 2 : 1, and a 1 � 1.5 cm2 CF electrodeimmobilized with 16 mg cm�2 G6PDH and 8 mg cm�2 DIshowed an excellent performance in a 4 mL three-electrodesystem (data not shown). Therefore, the enzyme loadings usedfor an optimization herein were 12 mg G6PDH/6 mg DI, 24 mgG6PDH/12 mg DI, and 48 mg G6PDH/24 mg DI, which in totalwere 18 mg, 36 mg and 72 mg enzymes immobilized, respec-tively. It is expected that the catalyst amount should havea strong inuence on both the internal resistance and the powerdensity of the cell.17 EIS was performed using a two-electrodemode for measuring the full cell resistance and using a three-electrode mode for obtaining anodic resistance with a Ag/AgClas the reference electrode. In Fig. 4A, the distribution of
Density(g m�2)
Conductivity(S cm�1) Pore size (mm)
100 0.083 NANA NA 0.7NA NA NA
RSC Adv., 2019, 9, 7292–7300 | 7295

Fig. 4 (A) Components of resistances for varying enzyme loading andthe corresponding polarization curves: profiles of (B) voltage and (C)power density versus current density in the presence of 100 mM G6P.
RSC Advances Paper
Ope
n A
cces
s A
rtic
le. P
ublis
hed
on 0
5 M
arch
201
9. D
ownl
oade
d on
2/1
7/20
22 8
:42:
03 P
M.
Thi
s ar
ticle
is li
cens
ed u
nder
a C
reat
ive
Com
mon
s A
ttrib
utio
n-N
onC
omm
erci
al 3
.0 U
npor
ted
Lic
ence
.View Article Online
internal resistance both for the full cell and the anode arepresented with such three enzyme loadings. The total resistancedecreased as the enzyme loading was increased from 18 mg to36 mg. However, when enzyme loading was further increased,the total resistance remained unchanged. Comparing compo-nent internal resistances, separator-solution resistance showeda relatively stable value when changing enzyme loadings due tothe uniform electrolyte and substrate concentration used in thisstudy. Reduced charge transfer resistance for the full cell and
7296 | RSC Adv., 2019, 9, 7292–7300
the anode can be observed as the enzyme loading was increasedfrom 18 mg to 36 mg. Nonetheless, charge transfer resistancewas slightly increased if we further increased the enzymeamount. This may be because too many immobilized enzymeswould over-occupy the surface of the electrode, impeding thecharge transfer between the mediator and the accessible elec-trode. Notably, there is also no signicant difference in thediffusion resistance when varying enzyme loadings. Fig. 4Bshows that an insufficient enzyme loading signicantly inu-ence catalytic reaction rate on the anode, resulting in a lowervoltage and current. The maximum current and power densitytested on EFCs with different enzyme loadings conrmed thatthe optimal overall enzyme loading was 36 mg, which generatedthe output of 1.60 mA cm�2 and 0.17 mW cm�2 (Fig. 4C).
3.3 Effects of electron acceptor on cathode
EIS measurements for the oxygen- or ferricyanide-based EFCswere conducted under open circuit conditions. Componentinternal resistances for both full cell and the cathode wereshown in Fig. 5A. It is obviously shown that using ferricyanideas the electron acceptor greatly reduced the total resistance,especially the cathode resistance. This was in accordance withthe impedance study of MFCs, in which ferricyanide-based oneshowed a much smaller charge transfer resistance in Nyquistplot than the oxygen-based one and the impedance did notextend into the low frequency region.28 External aeration wasexpected to lead to more dissolved oxygen available at thecathode, reducing the diffusion resistance and improving thecatalytic rate for the oxygen reduction reaction. However,although charge transfer and diffusion resistances decreasedunder aeration, solution-separator resistance unexpectedlyincreased, which is possibly due to that the disturbance in thecatholyte by aeration would impede the proton transfer insolution. When the ferricyanide concentration was increasedfrom 50 mM to 100 mM, the total resistance for the full cell andthe cathode further diminished, primarily arising from thedecrease in diffusion resistance. Since ferricyanide reduction isa faster process, the minimum charge transfer resistance ofcathode was found. In contrast, the oxygen-based cathodeshowed a higher charge transfer resistance. Because the ferri-cyanide has a lower redox potential (0.36 V vs. SHE) than oxygen(0.401 V vs. SHE), it possesses a stronger ability to receiveelectrons. Using ferricyanide instead of oxygen could also resultin a smaller solution–separator resistance because of thealteration of catholyte.
Polarization curves of the EFCs based on oxygen or ferricyanidewere plotted (Fig. 5B and C). Although the total internal resistancewas smaller under aeration when using oxygen as the terminalelectron acceptor, the maximum current and power densityshowed no signicant difference. This can be conrmed byanother research which has demonstrated that the ow rate andoxygen concentration of the cathode gas stream had strong effectson stability but not on maximum current density.7 When ferricy-anide (50 mM) was used, the maximum current and power densityincreased greatly, reaching to 3.31 mA m�2 and 0.49 mW m�2,respectively. When its concentration was further increased to
This journal is © The Royal Society of Chemistry 2019
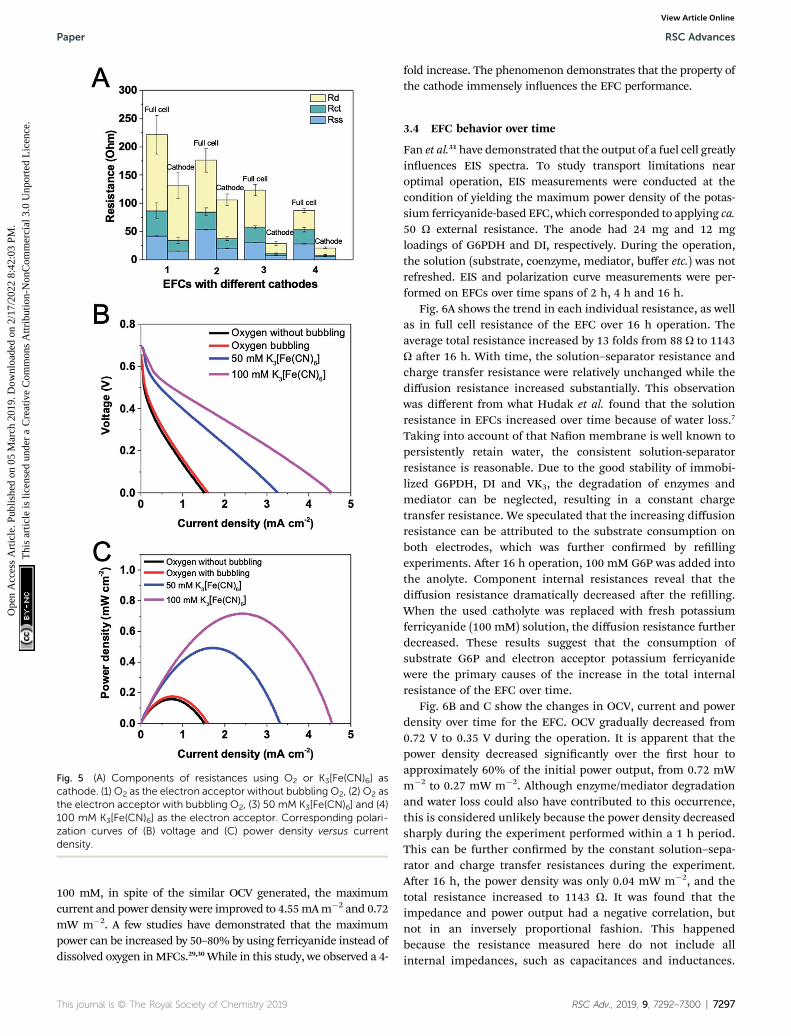
Fig. 5 (A) Components of resistances using O2 or K3[Fe(CN)6] ascathode. (1) O2 as the electron acceptor without bubbling O2, (2) O2 asthe electron acceptor with bubbling O2, (3) 50 mM K3[Fe(CN)6] and (4)100 mM K3[Fe(CN)6] as the electron acceptor. Corresponding polari-zation curves of (B) voltage and (C) power density versus currentdensity.
Paper RSC Advances
Ope
n A
cces
s A
rtic
le. P
ublis
hed
on 0
5 M
arch
201
9. D
ownl
oade
d on
2/1
7/20
22 8
:42:
03 P
M.
Thi
s ar
ticle
is li
cens
ed u
nder
a C
reat
ive
Com
mon
s A
ttrib
utio
n-N
onC
omm
erci
al 3
.0 U
npor
ted
Lic
ence
.View Article Online
100 mM, in spite of the similar OCV generated, the maximumcurrent and power density were improved to 4.55mAm�2 and 0.72mW m�2. A few studies have demonstrated that the maximumpower can be increased by 50–80% by using ferricyanide instead ofdissolved oxygen inMFCs.29,30 While in this study, we observed a 4-
This journal is © The Royal Society of Chemistry 2019
fold increase. The phenomenon demonstrates that the property ofthe cathode immensely inuences the EFC performance.
3.4 EFC behavior over time
Fan et al.31 have demonstrated that the output of a fuel cell greatlyinuences EIS spectra. To study transport limitations nearoptimal operation, EIS measurements were conducted at thecondition of yielding the maximum power density of the potas-sium ferricyanide-based EFC, which corresponded to applying ca.50 U external resistance. The anode had 24 mg and 12 mgloadings of G6PDH and DI, respectively. During the operation,the solution (substrate, coenzyme, mediator, buffer etc.) was notrefreshed. EIS and polarization curve measurements were per-formed on EFCs over time spans of 2 h, 4 h and 16 h.
Fig. 6A shows the trend in each individual resistance, as wellas in full cell resistance of the EFC over 16 h operation. Theaverage total resistance increased by 13 folds from 88 U to 1143U aer 16 h. With time, the solution–separator resistance andcharge transfer resistance were relatively unchanged while thediffusion resistance increased substantially. This observationwas different from what Hudak et al. found that the solutionresistance in EFCs increased over time because of water loss.7
Taking into account of that Naon membrane is well known topersistently retain water, the consistent solution-separatorresistance is reasonable. Due to the good stability of immobi-lized G6PDH, DI and VK3, the degradation of enzymes andmediator can be neglected, resulting in a constant chargetransfer resistance. We speculated that the increasing diffusionresistance can be attributed to the substrate consumption onboth electrodes, which was further conrmed by rellingexperiments. Aer 16 h operation, 100 mM G6P was added intothe anolyte. Component internal resistances reveal that thediffusion resistance dramatically decreased aer the relling.When the used catholyte was replaced with fresh potassiumferricyanide (100 mM) solution, the diffusion resistance furtherdecreased. These results suggest that the consumption ofsubstrate G6P and electron acceptor potassium ferricyanidewere the primary causes of the increase in the total internalresistance of the EFC over time.
Fig. 6B and C show the changes in OCV, current and powerdensity over time for the EFC. OCV gradually decreased from0.72 V to 0.35 V during the operation. It is apparent that thepower density decreased signicantly over the rst hour toapproximately 60% of the initial power output, from 0.72 mWm�2 to 0.27 mW m�2. Although enzyme/mediator degradationand water loss could also have contributed to this occurrence,this is considered unlikely because the power density decreasedsharply during the experiment performed within a 1 h period.This can be further conrmed by the constant solution–sepa-rator and charge transfer resistances during the experiment.Aer 16 h, the power density was only 0.04 mW m�2, and thetotal resistance increased to 1143 U. It was found that theimpedance and power output had a negative correlation, butnot in an inversely proportional fashion. This happenedbecause the resistance measured here do not include allinternal impedances, such as capacitances and inductances.
RSC Adv., 2019, 9, 7292–7300 | 7297

Fig. 6 Variations of (A) internal resistances, (B) open circuit voltagesand (C) power densities versus current density for a EFC operated for16 h at a constant load of 50 U.
RSC Advances Paper
Ope
n A
cces
s A
rtic
le. P
ublis
hed
on 0
5 M
arch
201
9. D
ownl
oade
d on
2/1
7/20
22 8
:42:
03 P
M.
Thi
s ar
ticle
is li
cens
ed u
nder
a C
reat
ive
Com
mon
s A
ttrib
utio
n-N
onC
omm
erci
al 3
.0 U
npor
ted
Lic
ence
.View Article Online
Besides, the enzymes and mediator may also slightly degradeover time.17 With the relling of G6P aer 16 h operation, OCVrose up to 0.45 V while maximum current and power densityreached to 2.77 mA m�2 and 0.31 mW m�2, respectively. Whenfresh potassium ferricyanide solution was used, these valuesfurther increased. OCV, maximum current and power densitywere 0.58 V, 3.65 mA m�2 and 0.50 mW m�2, respectively.Combining with the results of the component internal resis-tances, it suggests that EIS can be used as a useful tool to detectthe mechanism behind the loss of the cell performance.
7298 | RSC Adv., 2019, 9, 7292–7300
3.5 Effects of operation voltage
The behavior described in the previous studies indicates thenecessity of acquiring EIS data for EFCs under diversiedoperating conditions.26 Varying operating conditions for an EFCwill certainly change its internal resistance and power output.The effects of operation voltage on EFC internal resistance weretherefore measured. The time allowed before measurementsaer a change in operation voltage was 30 min. It was foundthat Nyquist plot under 0.3 V exhibited a different pattern fromplots under other voltages (Fig. 7A). It has two arcs in the rangeof low and medium frequencies, representing a two-timeconstants pattern involved. An insulating layer may occurunder the voltage of 0.3 V. By analyzing component internalresistances, we noticed that the operation voltage had dominanteffects on charge transfer and diffusion resistances. The secondintercept on X-axis had a slight positive shi along with thedecrease of operation voltage, demonstrating the increase ofcharge transfer resistance. In comparison with charge transferresistance, the diffusion resistance varied greatly. The voltage of0.3 V generated the smallest diffusion resistance value, possiblydue to that the maximum power density can be produced underthis voltage. This nding was also demonstrated by others that
Fig. 7 Nyquist plots for the EFC at varied operation voltages (A)without or (B) with stir.
This journal is © The Royal Society of Chemistry 2019

Paper RSC Advances
Ope
n A
cces
s A
rtic
le. P
ublis
hed
on 0
5 M
arch
201
9. D
ownl
oade
d on
2/1
7/20
22 8
:42:
03 P
M.
Thi
s ar
ticle
is li
cens
ed u
nder
a C
reat
ive
Com
mon
s A
ttrib
utio
n-N
onC
omm
erci
al 3
.0 U
npor
ted
Lic
ence
.View Article Online
a minimum internal resistance was achieved at the maximumpower density, rather than at the highest current.17
Logan' group has revealed that diffusion resistance wasusually the largest component internal resistance under highbuffer cathode had effects on internal resistances.26 CathodeEIS spectra revealed that both the charge transfer and diffusionresistances were larger at 0.3 V than at 0.1 V at high bufferconcentrations.26 Unlike in MFCs where operation voltages haveeffects on the growth of microorganisms and their extracellularelectron transfer and hence cause the variations in chargetransfer resistances, enzyme reaction in vitro is much morestable than microbial metabolism and thus the reaction rate inEFCs should not be affected by the external voltage. Therefore,the charge transfer resistance of the EFC maintained at a rela-tively steady value as noticed. Our result clearly indicates thatthe external voltage has an impact on substrate diffusion to theelectrode or on product diffusion away from the electrode. Theminimum internal resistance could be the result of minimizeddiffusion resistances at optimized voltage, as well as thereduction of other losses throughout the EFC.
To further conrm this, magnetic stirring was applied in theanodic chamber and EIS measurements were conducted underthe same operation voltages. Fig. 7B shows quite similar resultscomparing with the experiment without stirring. The Nyquistplot suggests a two-time constants pattern and the lowestdiffusion resistance under 0.5 V operation. However, the exactreason why diffusion resistance plays such an important roleunder different operation voltages has not been elucidated.More efforts should be focused on increasing the diffusion andmass transfer in EFCs using a ow-through mode.
4. Conclusions
Various aspects of EFC construction and operation conditionswere investigated via EIS and the component internal resis-tances were obtained. Using different separators distinctlychanged the performance of a EFC and Naon 212 exhibiteda small solution-separator resistance and a high power densityof the EFC. Among operating conditions, enzyme loading,electrode acceptor at the cathode, operation voltage, andstability over time were of interests. Enzyme loading wasdemonstrated to have a very strong inuence on both powerdensity and internal resistances. As enzyme loading increased,the G6P oxidation reaction proceeded at a more rapid rate,contributing to a signicant reduction in the charge transferresistance. Using potassium ferricyanide as the terminal elec-tron acceptor at the cathode instead of oxygen improved the cellperformance meanwhile decreased the resistance of thecathode. Signicant power loss and increased diffusion resis-tance of the EFC occurred over 16 h of operation, although theinternal resistance and power density did not change ina correlative way. Additionally, the operation voltage also had animpact on the diffusion resistance of the EFCs.
EIS technique has great potential in analyzing and studyingcomponent internal resistances of EFCs. However, it still hassome limitations and knowledge of impedance alone is notsufficient. The equivalent circuit can hardly be modeled or
This journal is © The Royal Society of Chemistry 2019
accurately describe the real status of an EFC. Most EISmeasurements in this study were conducted under OCPconditions, whichmay result in situations that differ from thoseoccurring under practical working conditions. The performanceand mechanism of a EFC could be fully understood by furthercombining EIS measurements with other electrochemical andbiochemical methodologies.
Conflicts of interest
There are no conicts to declare.
Acknowledgements
This work was supported by the Tianjin Institute of IndustrialBiotechnology, Chinese Academy of Sciences (ZDRW-ZS-2016-3S), the National Natural Science Foundation of China(21706273) and the CAS Pioneer Hundred Talent Program (TypeC, reference # 2016-081).
Notes and references
1 R. Wu, C. Ma, Y. H. P. Zhang and Z. Zhu, ChemCatChem,2018, 10, 1–7.
2 Z. G. Zhu, C. L. Ma and Y. H. P. Zhang, Electrochim. Acta,2018, 263, 184–191.
3 Z. Zhu and Y. P. Zhang, Metab. Eng., 2017, 39, 110–116.4 Y. H. Kim, E. Campbell, J. Yu, S. D. Minteer and S. Banta,Angew. Chem., Int. Ed. Engl., 2013, 52, 1437–1440.
5 D. P. Hickey, M. S. McCammant, F. Giroud, M. S. Sigman andS. D. Minteer, J. Am. Chem. Soc., 2014, 136, 15917–15920.
6 Z. Zhu, T. Kin Tam, F. Sun, C. You and Y. H. Percival Zhang,Nat. Commun., 2014, 5, 3026.
7 N. S. Hudak, J. W. Gallaway and S. C. Barton, J. Electrochem.Soc., 2009, 156, B9–B15.
8 D. Kashyap, P. K. Dwivedi, J. K. Pandey, Y. H. Kim, G. M. Kim,A. Sharma and S. Goel, Int. J. Hydrogen Energy, 2014, 39,20159–20170.
9 X. Dominguez-Benetton, S. Sevda, K. Vanbroekhoven andD. Pant, Chem. Soc. Rev., 2012, 41, 7228–7246.
10 N. Sekar and R. P. Ramasamy, J. Microb. Biochem. Technol.,2013, S6, 004.
11 S. Sevda, K. Chayambuka, T. R. Sreekrishnan, D. Pant andX. Dominguez-Benetton, Bioelectrochemistry, 2015, 106(partA), 159–166.
12 Z. He and F. Mansfeld, Energy Environ. Sci., 2009, 2, 215–219.13 A. K. Manohar, O. Bretschger, K. H. Nealson and
F. Mansfeld, Bioelectrochemistry, 2008, 72, 149–154.14 S. Y. D. Aaron and C. Tsouris, Sep. Sci. Technol., 2008, 43,
2307–2320.15 R. Rahmanian, S. A. Mozaffari, H. S. Amoli and M. Abedi,
Sens. Actuators, B, 2018, 256, 760–774.16 G. Figueroa-Miranda, L. Y. Feng, S. C. C. Shiu,
R. M. Dirkzwager, Y. W. Cheung, J. A. Tanner,M. J. Schoning, A. Offenhausser and D. Mayer, Sens.Actuators, B, 2018, 255, 235–243.
RSC Adv., 2019, 9, 7292–7300 | 7299

RSC Advances Paper
Ope
n A
cces
s A
rtic
le. P
ublis
hed
on 0
5 M
arch
201
9. D
ownl
oade
d on
2/1
7/20
22 8
:42:
03 P
M.
Thi
s ar
ticle
is li
cens
ed u
nder
a C
reat
ive
Com
mon
s A
ttrib
utio
n-N
onC
omm
erci
al 3
.0 U
npor
ted
Lic
ence
.View Article Online
17 D. Aaron, A. P. Borole, S. Yiacoumi and C. Tsouris, J. PowerSources, 2012, 201, 59–65.
18 X. Zhang, S. Cheng, X. Wang, X. Huang and B. E. Logan,Environ. Sci. Technol., 2009, 43, 8456–8461.
19 G. Chen, B. Wei, Y. Luo, B. E. Logan and M. A. Hickner, ACSAppl. Mater. Interfaces, 2012, 4, 6454–6457.
20 S. A. Neto, R. D. Milton, D. P. Hickey, A. R. De Andrade andS. D. Minteer, J. Power Sources, 2016, 324, 208–214.
21 N. Lalaoui, A. de Poulpiquet, R. Haddad, A. Le Goff,M. Holzinger, S. Gounel, M. Mermoux, P. Infossi, N. Mano,E. Lojou and S. Cosnier, Chem. Commun., 2015, 51, 7447–7450.
22 M. J. Gonzalez-Guerrero, J. P. Esquivel, D. Sanchez-Molas,P. Godignon, F. X. Munoz, F. J. del Campo, F. Giroud,S. D. Minteer and N. Sabate, Lab Chip, 2013, 13, 2972–2979.
23 G. Z. Wu, Y. Gao, D. Zhao, P. H. Ling and F. Gao, ACS Appl.Mater. Interfaces, 2017, 9, 40978–40986.
7300 | RSC Adv., 2019, 9, 7292–7300
24 A. S. Campbell, H. Murata, S. Carmali, K. Matyjaszewski,M. F. Islam and A. J. Russell, Biosens. Bioelectron., 2016, 86,446–453.
25 N. Wagner, J. Appl. Electrochem., 2002, 32, 859–863.26 B. Wei, J. C. Tokash, F. Zhang, Y. Kim and B. E. Logan,
Electrochim. Acta, 2013, 89, 45–51.27 A. J. Hutchinson, J. C. Tokash and B. E. Logan, J. Power
Sources, 2011, 196, 9213–9219.28 R. P. Ramasamy, V. Gadhamshetty, L. J. Nadeau and
G. R. Johnson, Biotechnol. Bioeng., 2009, 104, 882–891.29 S. Oh, B. Min and B. E. Logan, Environ. Sci. Technol., 2004,
38, 4900–4904.30 E. S. Yanzhen Fan andH. Liu, Environ. Sci. Technol., 2008, 42,
8101–8107.31 Y. Z. Fan, H. Q. Hu and H. Liu, J. Power Sources, 2007, 171,
348–354.
This journal is © The Royal Society of Chemistry 2019