composition of atlantic sturgeon in rivers, estuaries and ... · gulf of maine dps: ..... 2 new...
TRANSCRIPT
| P a g e
February 2013
White paper by
Kim Damon-Randall, Mary Colligan and Julie Crocker
PROTECTED
RESOURCES
DIVISION
COMPOSITION OF ATLANTIC STURGEON IN
RIVERS, ESTUARIES AND IN MARINE WATERS

i | P a g e
Contents Background ................................................................................................................................................... 1
Review of DPS distributions and Life History Characteristics ................................................................... 1
Gulf of Maine DPS: ................................................................................................................................ 2
New York Bight DPS: ............................................................................................................................. 2
Chesapeake Bay DPS: ............................................................................................................................ 2
Carolina DPS: ......................................................................................................................................... 2
South Atlantic DPS: ............................................................................................................................... 3
Tagging Data ............................................................................................................................................. 3
Genetic Data ............................................................................................................................................. 5
Appendix 1. Effort maps by fishery. ........................................................................................................ 20

ii | P a g e
Figure 1. Maps of Atlantic sturgeon capture locations. ................................................................................ 4
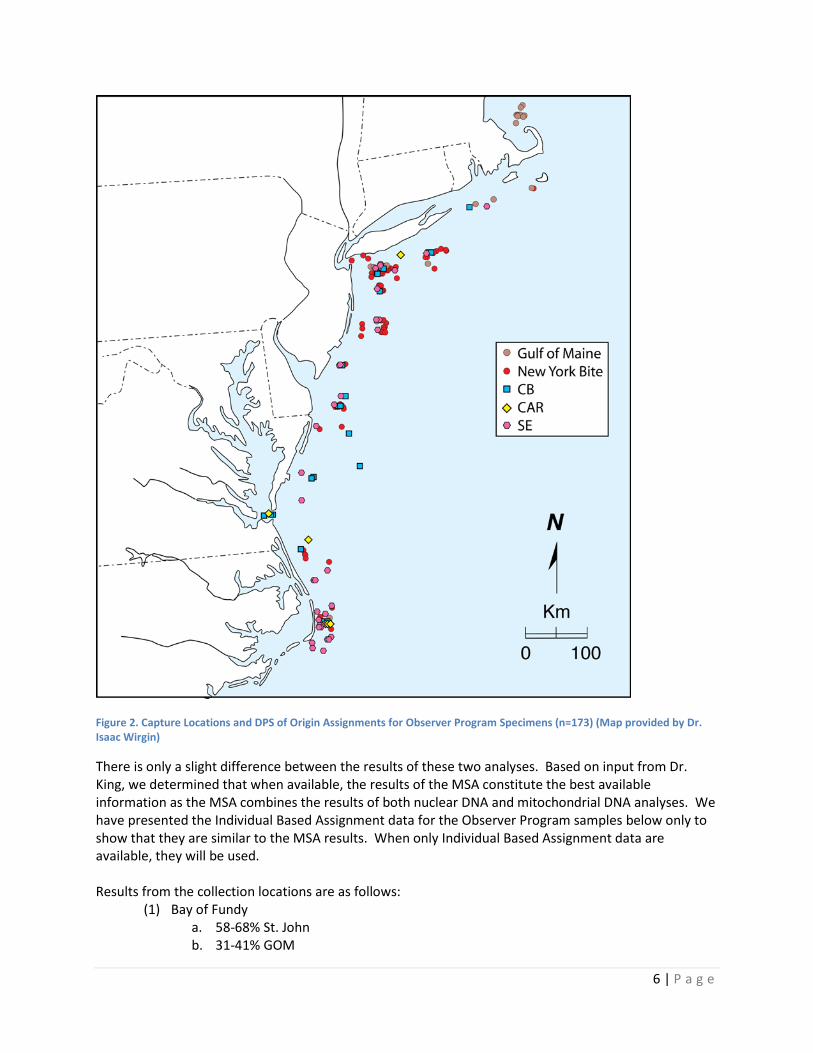
Figure 2. Capture Locations and DPS of Origin Assignments for Observer Program Specimens (n=173)
(Map provided by Dr. Isaac Wirgin) .............................................................................................................. 6
Figure 3. Observer Program Mixed Stock Analysis results (n=173) (Data from Dr. Isaac Wirgin and Dr. Tim
King) .............................................................................................................................................................. 7
Figure 4. Observer Program Individual Based Assignments (n=173) (Data from Dr. Isaac Wirgin and Dr.
Tim King) ....................................................................................................................................................... 8
Figure 5. Map of TNC marine ecoregions. .................................................................................................. 11
Figure 6. Map of mixing zones. ................................................................................................................... 12
Figure 7. MMZ1 percentages. ..................................................................................................................... 13
Figure 8. ERMZ1 percentages. .................................................................................................................... 14
Figure 9. SZ1 percentages. .......................................................................................................................... 15
Figure 10. MMZ2 percentages. ................................................................................................................... 15
Figure 11. ERMZ2 percentages. .................................................................................................................. 16
Figure 12. ERMZ3 percentages. .................................................................................................................. 17
Figure 13. SZ2 percentages. ........................................................................................................................ 17
Figure 14. Spawning percentages for the NYB DPS. ................................................................................... 18
Figure 15. SZ3 percentages. ........................................................................................................................ 19

1 | P a g e
Background Tagging, genetic studies, and interceptory fisheries have revealed that Atlantic sturgeon make extensive
coastal migrations. Tagging and interceptory fisheries provide evidence that Atlantic sturgeon are
widely dispersed along the East Coast. Results of tagging studies and genetic analyses provide us with
the information necessary to determine the origin of some of these Atlantic sturgeon and provide
insights into migratory patterns. Insights provided by many tagging studies, however, are limited in that
fish were captured and tagged in one river, but in many cases, this may not have been the actual river of
origin for that particular fish. Only those fish tagged as spawning adults in the river or young of year
(YOY) can be considered positively identified to river of origin.
In August 2011, NER PRD staff held a workshop to examine available information to understand
migration of Atlantic sturgeon and to determine a consistent approach for establishing the composition
of Atlantic sturgeon present in rivers, estuaries and in marine waters. These consistent stock
contribution percentages could then be used when section 7 consultations are conducted on activities
funded, authorized/permitted or carried out by federal agencies in these areas.
Review of DPS distributions and Life History Characteristics The workshop began with an overview of the five Distinct Population Segments (DPSs) of Atlantic
sturgeon that have been proposed for listing under the Endangered Species Act (ESA). It is important to
note that only Atlantic sturgeon that originate in U.S. waters (i.e. are the progeny of fish that spawned in
rivers in the U.S.) are proposed for listing under the ESA. Some relevant and important life history
characteristics are that Atlantic sturgeon are long lived (approximately 60 years) and relatively late
maturing. Females spawn approximately every two to five years, and males spawn approximately every
one to five years. Spawning is believed to occur in flowing water between the salt front of estuaries and
the fall line of large rivers, where optimal flows are 46 to 76 cm/s and depths are 11-27 m. Eggs are
deposited on the river bottom typically in cobble, gravel or boulder substrate, and hatching occurs
approximately 94 to 140 hours after egg deposition. Oligohaline waters have been identified as juvenile
rearing habitats within some Atlantic sturgeon spawning rivers. Atlantic sturgeon migrate to the ocean
as subadults.
There is clinal variation in growth rate with Atlantic sturgeon in southern rivers maturing earlier. For
example, Atlantic sturgeon mature in South Carolina river systems at 5 to 19 years, in the Hudson River
at 11 to 21 years and in the St. Lawrence River at 22 to 34 years. The timing of spawning migration also
exhibits a latitudinal patter in which migrations generally occur during February to March in southern
systems, April to May in mid-Atlantic systems and May to July in Canadian systems.

2 | P a g e
The marine range of U.S. Atlantic sturgeon extends from Labrador, Canada to Cape Canaveral, Florida.
Fish from all five DPSs appear to have the potential to be located anywhere in this full marine range.
Atlantic sturgeon will enter and use non spawning rivers for foraging and perhaps other purposes.
Therefore, they may be found in virtually any river and estuary along the East Coast. They are more
likely to be found in closer proximity to their natal rivers so each DPS tends to spread out up and down
the coast from the core population.
Gulf of Maine DPS: The GOM DPS includes all Atlantic sturgeon that spawn in the watersheds from the
Maine/Canadian border and extending southward to include all associated watersheds draining into the
GOM as far south as Chatham, MA as well as wherever these fish occur in coastal bays and estuaries and
the marine environment. The only known spawning river in the GOM DPS is the Kennebec River, but
there is the potential for spawning in other rivers including the Penobscot River. Within the GOM DPS,
Atlantic sturgeon have been documented in the following rivers: Penobscot, Kennebec, Androscoggin,
Sheepscot, Saco, Pemaquid, Piscataqua and Merrimack Rivers. However, Atlantic sturgeon observed in
these rivers are not necessarily GOM DPS fish unless they have been identified as such through genetic
analysis or other means (e.g. tags applied to YOY). Little is known about the abundance and trends of
the GOM DPS.
New York Bight DPS: The NYB DPS includes all Atlantic sturgeon that spawn in the watersheds that
drain into coastal waters , including Long Island Sound, the New York Bight, and Delaware Bay, from
Chatham, MA to the Delaware-Maryland border on Fenwick Island as well as wherever these fish occur
in coastal bays and estuaries and the marine environment. The two known spawning rivers in the NYB
DPS are the Hudson and Delaware Rivers. Within the NYB DPS, Atlantic sturgeon have also been
observed in the Taunton and Connecticut River; however, these are not necessarily NYB DPS fish unless
they have been identified as such through genetic analysis or other means (e.g. tags applied to YOY).
The overall abundance and trend for the NYB DPS is not known; however, there is an estimate of 863
mature adults (consisting of approximately 596 males and 267 females) based on data from
approximately 1985 to 1995 (Kahnle et al. 2007).
Chesapeake Bay DPS: The CB DPS includes all Atlantic sturgeon that spawn in the watersheds that
drain into the Chesapeake Bay and into coastal waters from the Delaware-Maryland border on Fenwick
Island to Cape Henry, VA, as well as wherever these fish occur in coastal bays and estuaries and the
marine environment. The only known spawning river in the CB DPS is the James River, but there is the
potential for spawning to occur in other rivers including the York River. Within the CB DPS, Atlantic
sturgeon have been documented in the James, York, Potomac, Rappahannock, Pocomoke, Choptank,
Little Choptank, Patapsco, Nanticoke, Honga and South Rivers as well as the Susquehanna Flats.
However, Atlantic sturgeon observed in these rivers are not necessarily CB DPS fish unless they have
been identified as such through genetic analysis or other means (e.g. tags applied to YOY). The
abundance and trends of the CB DPS are not known.
Carolina DPS: The Carolina DPS includes all Atlantic sturgeon that spawn in the watersheds from the
Roanoke River, Virginia, southward along the southern Virginia, North Carolina and South Carolina

3 | P a g e
coastal areas to the Cooper River. There are six known spawning rivers (Roanaoke, Tar-Pamlico, Cape
Fear, Waccamaw, Pee Dee and Santee-Cooper) and possibly others (e.g. Neuse River). The abundance
and trends of the Carolina DPS are not known.
South Atlantic DPS: The South Atlantic DPS includes all Atlantic sturgeon that spawn in the watersheds of the ACE Basin in South Carolina to the St. Johns River, Florida. The abundance and trends of the South Atlantic DPS are not known. There are seven spawning rivers (Ashepoo, Combahee, and Edisto (ACE Basin), Savannah, Ogeechee, Altamaha, and Satilla Rivers). In addition, the St. Marys and St. Johns Rivers are used as nursery habitat by young Atlantic sturgeon originating in other rivers. An estimate of 343 spawning adults/year is available for the Altamaha River (Schueller and Peterson 2006).
Tagging Data Four primary information sources were examined for tagging and capture data. These are the NMFS’ observer database, the USFWS tagging database, tagging data supplied by the Delaware State University, and a publication by Erikson et al. (2011). Dr. Dan Erickson and several other sturgeon researchers undertook a study tagging 23 Atlantic sturgeon from the Hudson River in 2006 and 2007 with pop-up archival satellite tags (Erickson et al., 2011). Fifteen of the tagged fish migrated back to the ocean from the river, and the tags remained on these fish for 108 to 360 days. Of the 15 fish, 13 remained within the Mid-Atlantic Bight for up to 1 year after tagging. In general, they were found to occupy the area from Long Island, New York to Chesapeake Bay at depths between 5 and 40 m. Tagging data revealed aggregation areas off southwest Long Island, along the New Jersey coast, off Delaware Bay, and off Chesapeake Bay. It also revealed seasonal depth distribution patterns with fish inhabiting the deepest waters during the winter and the shallowest waters during summer and early fall. Two Atlantic sturgeon traveled extensively with one migrating north to Cobequid Bay which is located at the end of the Bay of Fundy, Nova Scotia, and the other migrated south to the coast of Georgia. The USFWS Cooperative Atlantic Coast Sturgeon Tagging Database contains over 11,000 capture events, of which approximately 8,200 had Universal Transverse Mercator (UTM) points. The remaining points for which geographic coordinates were not provided were represented by approximate points placed on the map using the site description data provided in the database. If these approximate locations overlapped with known capture events, the points were not plotted on the map. After this process, approximately 1,600 points remained for which no coordinates were available. Some data points appeared to have incorrect UTMs, as evidenced by points plotted on land. However, the majority of the data set is believed to accurately represent the locations where fish have been captured during targeted sampling activities conducted by cooperating researchers. Because the points displayed are a collection of points voluntarily provided by individual researchers using different capture methodology and sampling effort was not standardized, this data cannot be used to determine relative abundance of Atlantic sturgeon in areas where fish have been captured. In addition, these points do not reflect all locations containing Atlantic sturgeon, only those points where fish have been captured. Therefore, areas without points should not be assumed to not contain Atlantic sturgeon. For instance, there are several rivers where the range of Atlantic sturgeon is known to extend further upriver than the capture events depicted. The capture locations were plotted in GIS along with the location of captures in the Northeast Fisheries Observer Program (NEFOP) and At Sea Monitoring (ASM) program to compile maps.

4 | P a g e
Figure 1. Maps of Atlantic sturgeon capture locations.
These maps reaffirmed the observation that Atlantic sturgeon are widely dispersed in rivers, estuaries and the marine environment. Areas with concentrated data points coincide with directed sampling efforts. No conclusions could be drawn from the plotted capture events in terms of origin of the fish without having the associated genetic or tagging data linked to each of the captures/observations. It was noted that this capture information could be useful to section 7 biologists. We will contact FWS to ensure that this information can be used in section 7 consultations.

5 | P a g e
Genetic Data Insights into the movement of fish from their river of origin can be gained by reviewing results of genetic analyses conducted on sturgeon captured in different locations. Workshop participants reviewed Grunwald et al. 2008, King et al. 2001, Waldman et al. 1996, and Wirgin et al. 2000. In addition, two powerpoint presentations from the February 2011 Sturgeon Workshops were reviewed - Mixed Stock Analysis of Atlantic Sturgeon from Coastal Locales and a Non-Spawning River by Wirgin and King and Conservation Genetics and Genomics of the Acipenseridae: Population Genetics, Phylogeography, and Transcriptomics by King. In order to assign fish to river of origin, first a reference database had to be created containing samples that could be confirmed to be from fish from that river of origin. The nine spawning river populations included in the reference database include1: (1) St. John River (n=31); (2) Kennebec River (n=34); (3) Hudson River (n=53); (4) Delaware River (n=83); (5) James River (n=65); (6) Albemarle Sound (n=25): (7) Savannah River (n=34); (8) Ogeechee River (n=37); and (9) Altamaha River (n=49). It is important to note that not all spawning populations in the Carolina DPS and the South Atlantic DPS are represented in the reference samples, and thus, it is not possible to assign fish back to river of origin in all cases. Fish were collected from the following six locations for comparison against the above reference
populations2: (1) Bay of Fundy (n=178)(2008-2010); (2) Central Long Island Sound (n=275)(2006 to
2010); (3) Delaware Coast (n=105)(April 2009 – 2010); (4) North Carolina Coast (winter)( n=163)(2000-
2010); (5) Observers Program(n=173)(2009-present); and (6) Connecticut River (n=69)(1991, 2005-
2010). All fish were characterized at sequence in mtDNA control region and at 12 informative
microsatellite markers. Results were presented from the Mixed Stock Analysis (MSA) and the Individual
Based Assignment Test. The MSA considers all of the data for each of the DPSs/stocks and determines a
percentage of fish from each of those DPSs/stocks. There is a 95% confidence interval associated with
the MSA. The assignment test provides finer individual resolution as it removes an individual and then
based on the genetic information assigns that individual to a DPS or riverine population. Because the
Individual Based Assignments are done on a single fish basis, it is possible to map their capture locations
by DPS assignments which is informative and thus, is presented below.
1 The number in parenthesis is the number of samples from each collection location.
2 The number in parenthesis is the number of samples from each collection location followed by the years samples
were taken.
6 | P a g e
Figure 2. Capture Locations and DPS of Origin Assignments for Observer Program Specimens (n=173) (Map provided by Dr. Isaac Wirgin)
There is only a slight difference between the results of these two analyses. Based on input from Dr. King, we determined that when available, the results of the MSA constitute the best available information as the MSA combines the results of both nuclear DNA and mitochondrial DNA analyses. We have presented the Individual Based Assignment data for the Observer Program samples below only to show that they are similar to the MSA results. When only Individual Based Assignment data are available, they will be used. Results from the collection locations are as follows:
(1) Bay of Fundy a. 58-68% St. John b. 31-41% GOM

7 | P a g e
c. 0-6% NYB DPS (2) Long Island Sound
a. 0-9% GOM b. 74-84% NYB c. 2-12% CB d. 0-5.5% Carolina e. 5-15% South Atlantic
(3) Observer Data (percentages based on MSA results updated by T. King Feb. 2013) a. 0-6% St. John b. 6-16% GOM c. 46-56% NYB d. 8-18% CB e. 0-7% Carolina f. 17-27% South Atlantic
Figure 3. Observer Program Mixed Stock Analysis results (n=173) (Data from Dr. Isaac Wirgin and Dr. Tim King)
GOM 11%
NYB 51%
CB 13%
Carolina 2%
SA 22%
Canada 1%
MSA Observer Data (n=173)

8 | P a g e
Figure 4. Observer Program Individual Based Assignments (n=173) (Data from Dr. Isaac Wirgin and Dr. Tim King)
(4) Connecticut River
a. 0-9% St. John b. 6-16% GOM c. 71-81% NYB d. 3-13% Chesapeake e. 0-6% South Atlantic
(5) Delaware Coastal a. 2-12% GOM b. 53-63% NYB c. 13-23% CB d. 12-22% South Atlantic
The data for the North Carolina Coastal survey was also examined. Since this survey is conducted in the winter and is expected to sample an overwintering population only, we determined that the results of this analysis should not be used to broadly characterize the river of origin composition of Atlantic sturgeon in this area year round. If an action occurs off the southern Virginia/North Carolina coast during the winter, it may be appropriate to use the percentages from the North Carolina samples. Consequently, they are presented below.
a. 0-6% GOM b. 12-22% NYB c. 47-57% CB d. 25-35% South Atlantic
In interpreting and applying the genetic analysis data, we examined whether there were breaks within a river through the estuary to the marine environment where composition of the fish changed. In looking at the marine environment, the NEFOP and ASM data covers the broadest area. The other sampling sites (Bay of Fundy, Long Island Sound, North Carolina) encompass smaller localized sample areas. We
Canada 2%
GOM 11%
NYB 47%
CB 14%
Carolina 6%
SA 20%
Observer Program Individual Based Assignments (n=173)
9 | P a g e
considered whether to draw lines horizontal from the coast out to the EEZ from the landward boundary of each of the 5 DPSs. We determined that it was best to look at the raw genetic analysis and determine if natural boundaries emerged. Given the relatively small number of samples, boundaries were not obvious from the genetics data alone. A trend that is obvious is that fish tend to aggregate within the geographic region of their spawning river so a significant percentage of fish in the adjacent Atlantic sturgeon mixing zone are from the nearest DPS while a smaller percentage are from the other DPSs. There appears to be both a geographic and population size effect. We questioned whether there was a direction to the movement out of spawning rivers. In general, there may be a southerly movement in the fall and a northerly migration in the spring and a very small sample size of tagged fish showed more movement south than north (Erikson). For each spawning river, we need to draw a line above which the composition changes where there is a shift to a greater percentage of river of origin fish. The two exceptions will be the Androscoggin and the James Rivers. The Kennebec and the Androscoggin share a common estuary as do the James and Appomattox Rivers. In these cases, fish in portions of the non spawning rivers of the Androscoggin and Appomattox Rivers are expected to reflect the composition of fish in the adjacent spawning rivers. One distinction is that all non spawning rivers, even those that share an estuary with a spawning river (Androscoggin and Appomattox Rivers) are not expected to contain eggs and larvae, but could contain all other life stages (e.g., young of the year, subadults, and adults). Although we expect a mix of stocks even within spawning areas, above the line we draw in these rivers, we expect eggs/larvae and young of the year to be 100% from the spawning river of origin. In moving from river to estuary to marine waters we had three examples – the Connecticut, Hudson and Delaware Rivers. Genetic analysis from samples taken in the Connecticut River indicates a similar distribution to samples taken from Long Island Sound. It is important to remember that the Connecticut River does not contain a spawning population, and the fish captured in the river were significantly smaller than those captured in the Sound. Smaller fish are most likely not as capable of migrating long distances as large fish. Tagging evidence in both the Connecticut and Merrimack Rivers indicate that smaller fish may migrate further into non-natal rivers (particularly, non-natal rivers with the geographic range of their DPS of origin) either to forage on specific riverine/upper estuarine prey items or to avoid predators. Consequently, the small fish found up in the non-natal river are probably most often from that particular DPS (as indicated above with 71-81% of the fish found in the CT River being from the NYB DPS) but other DPSs could be represented as well. Tim King has genotyped 32 subadult Atlantic sturgeon from the Penobscot River and 10 subadults from the Saco River. The results from samples from both rivers suggest that these fish are mostly migrants from the Kennebec River with the possibility of a few St. John and Hudson fish. According to Tim King, The Fst values between the Kennebec, Penobscot, and Saco are zero (i.e., no differentiation), and based on this, he has concluded that the collections from Maine (Kennebec, Penobscot, and Saco) appear to constitute a metapopulation much like the structure that was observed for shortnose sturgeon from the same vicinity. This supports the conclusion that many but not all of the fish found in the lower river/upper estuary are fish that originated from a river within that particular DPS. Based on this conclusion, we determined that it would be most appropriate to create estuarine/riverine mixing zones 1 and 2 to correspond with the marine mixing zones. These estuarine/riverine zones extend from the coastline up to the furthest extent of sturgeon migration in non-spawning rivers and up to the 0.5 parts per thousand (ppt) salinity threshold in spawning rivers.

10 | P a g e
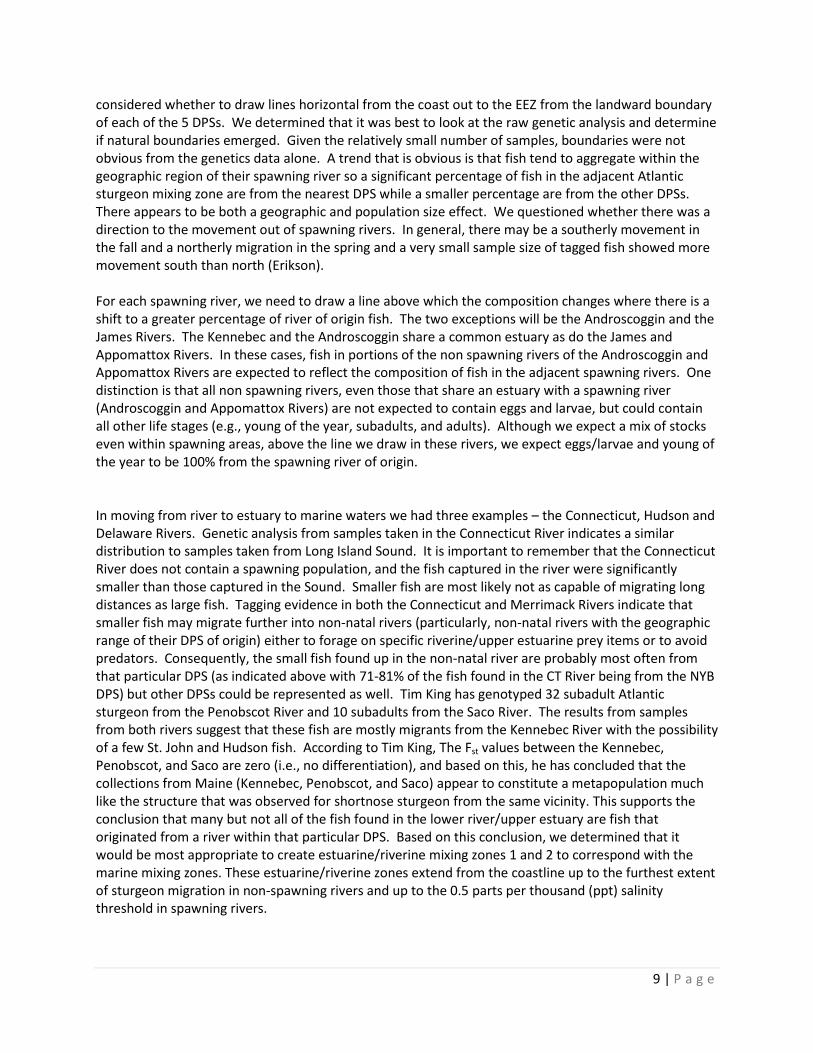
In looking at the coastal samples, there appeared to be three zones that coincide with well known and recognized biogeographic breaks. These biogeographic zones were established by the Nature Conservancy (TNC) and refined in 2007. They represent areas in which the species composition is relatively homogenous and is clearly distinct from adjacent systems. The species composition is likely to be determined by the predominance of a small number of ecosystems and/or a distinct suite of oceanographic or topographic features. The dominant biogeographic features used to define the ecoregions varied between locations, but included features such as isolation, upwelling, nutrient inputs, freshwater influx, temperature regimes, ice regimes, exposure, sediments, currents, and bathymetric or coastal complexity. Along the East Coast of the U.S., there are 3 marine ecoregions as depicted in the figure below.
11 | P a g e
Figure 5. Map of TNC marine ecoregions.
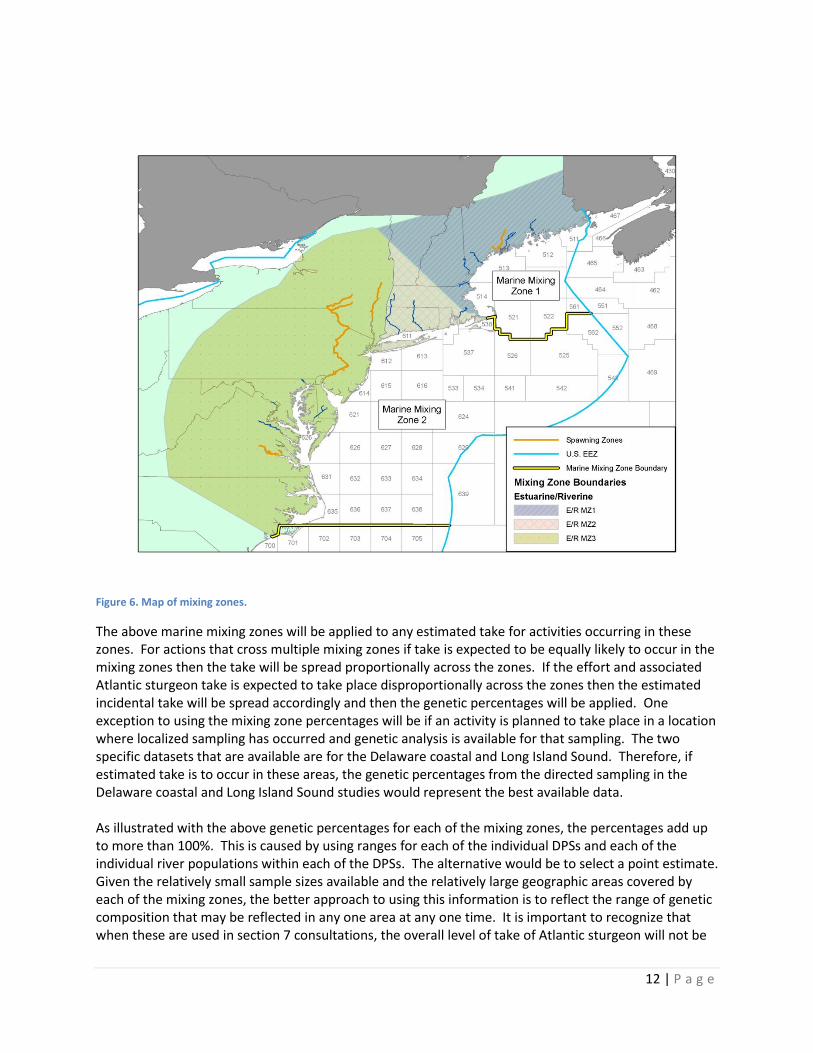
We used these known biogeographic breaks as a starting point for delineating between mixing zones. In further discussion with the Sustainable Fisheries Division, we refined the boundaries between the mixing zones based on the boundaries for the fisheries statistical areas and known migratory behavior of Atlantic sturgeon. Based on this information, we created the following three marine mixing zones: (1) Marine Mixing Zone 1 which encompasses the area from the Northern Maine border to Chatham; (2) Marine Mixing Zone 2 from Chatham to Cape Hatteras; and (3) Marine Mixing Zone 3 from Cape Hatteras to the southern tip of Florida. These mixing zones will be used for all consultations on actions that occur in the non-spawning rivers, estuaries, and near-shore coastal regions.
12 | P a g e
Figure 6. Map of mixing zones.
The above marine mixing zones will be applied to any estimated take for activities occurring in these zones. For actions that cross multiple mixing zones if take is expected to be equally likely to occur in the mixing zones then the take will be spread proportionally across the zones. If the effort and associated Atlantic sturgeon take is expected to take place disproportionally across the zones then the estimated incidental take will be spread accordingly and then the genetic percentages will be applied. One exception to using the mixing zone percentages will be if an activity is planned to take place in a location where localized sampling has occurred and genetic analysis is available for that sampling. The two specific datasets that are available are for the Delaware coastal and Long Island Sound. Therefore, if estimated take is to occur in these areas, the genetic percentages from the directed sampling in the Delaware coastal and Long Island Sound studies would represent the best available data. As illustrated with the above genetic percentages for each of the mixing zones, the percentages add up to more than 100%. This is caused by using ranges for each of the individual DPSs and each of the individual river populations within each of the DPSs. The alternative would be to select a point estimate. Given the relatively small sample sizes available and the relatively large geographic areas covered by each of the mixing zones, the better approach to using this information is to reflect the range of genetic composition that may be reflected in any one area at any one time. It is important to recognize that when these are used in section 7 consultations, the overall level of take of Atlantic sturgeon will not be
13 | P a g e
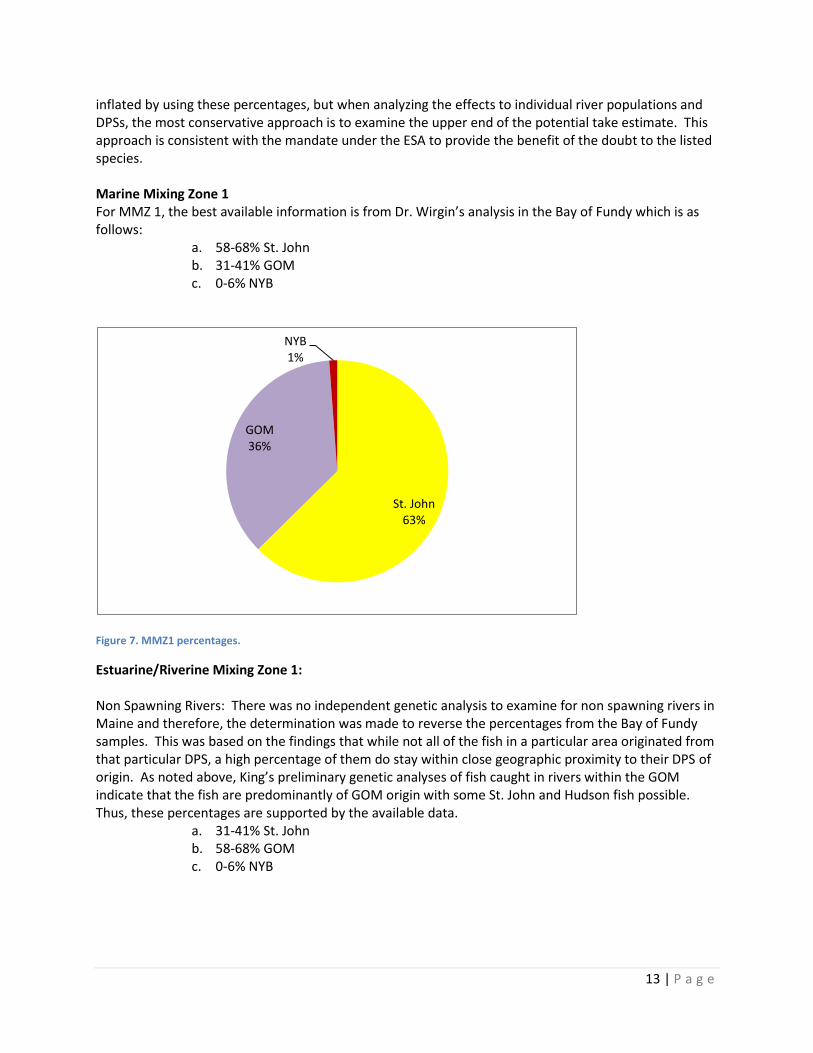
inflated by using these percentages, but when analyzing the effects to individual river populations and DPSs, the most conservative approach is to examine the upper end of the potential take estimate. This approach is consistent with the mandate under the ESA to provide the benefit of the doubt to the listed species. Marine Mixing Zone 1 For MMZ 1, the best available information is from Dr. Wirgin’s analysis in the Bay of Fundy which is as follows:
a. 58-68% St. John b. 31-41% GOM c. 0-6% NYB
Figure 7. MMZ1 percentages.
Estuarine/Riverine Mixing Zone 1: Non Spawning Rivers: There was no independent genetic analysis to examine for non spawning rivers in Maine and therefore, the determination was made to reverse the percentages from the Bay of Fundy samples. This was based on the findings that while not all of the fish in a particular area originated from that particular DPS, a high percentage of them do stay within close geographic proximity to their DPS of origin. As noted above, King’s preliminary genetic analyses of fish caught in rivers within the GOM indicate that the fish are predominantly of GOM origin with some St. John and Hudson fish possible. Thus, these percentages are supported by the available data.
a. 31-41% St. John b. 58-68% GOM c. 0-6% NYB
St. John 63%
GOM 36%
NYB 1%

14 | P a g e
Figure 8. ERMZ1 percentages.
Spawning Zone 1: The Kennebec River is the only confirmed spawning river in Mixing Zone 1, but it does share an estuary with the Androscoggin River (early life stages have been documented in the Androscoggin so spawning may be occurring in the Androscoggin as well). Based on supplemental data from Fox and King’s genetic analysis of these samples, it was deterined that 92% of the fish in the spawing region of the Hudson River originated from the NYB DPS while 8% originated from the GOM DPS. Given the lack of data specific to the spawning regions in these two rivers, we determined that using these numbers for the Kennebec Complex represented the best available information for this spawning area. Based on the above percentages, some percentage of fish on the spawning grounds in SZ 1 could be from the St. John while a more limited percentage could be from the NYB DPS. However, the most significant percentage would be expected to be from the GOM DPS. Thus, we used the breakdown of 92% of the fish SZ 1 being from the GOM DPS while the remaining 8% are from either the NYB DPS or the St. John. Since more fish in this area are attributed to the St. John River, a higher proportion of the 8% are attributed to this population. Thus, the analysis for the Kennebec and shared portion of the Androscoggin is as follows:
a. 1-12% St. John b. 87-97% GOM c. 0-6% NYB
GOM 63%
St. John 36%
NYB 1%
15 | P a g e
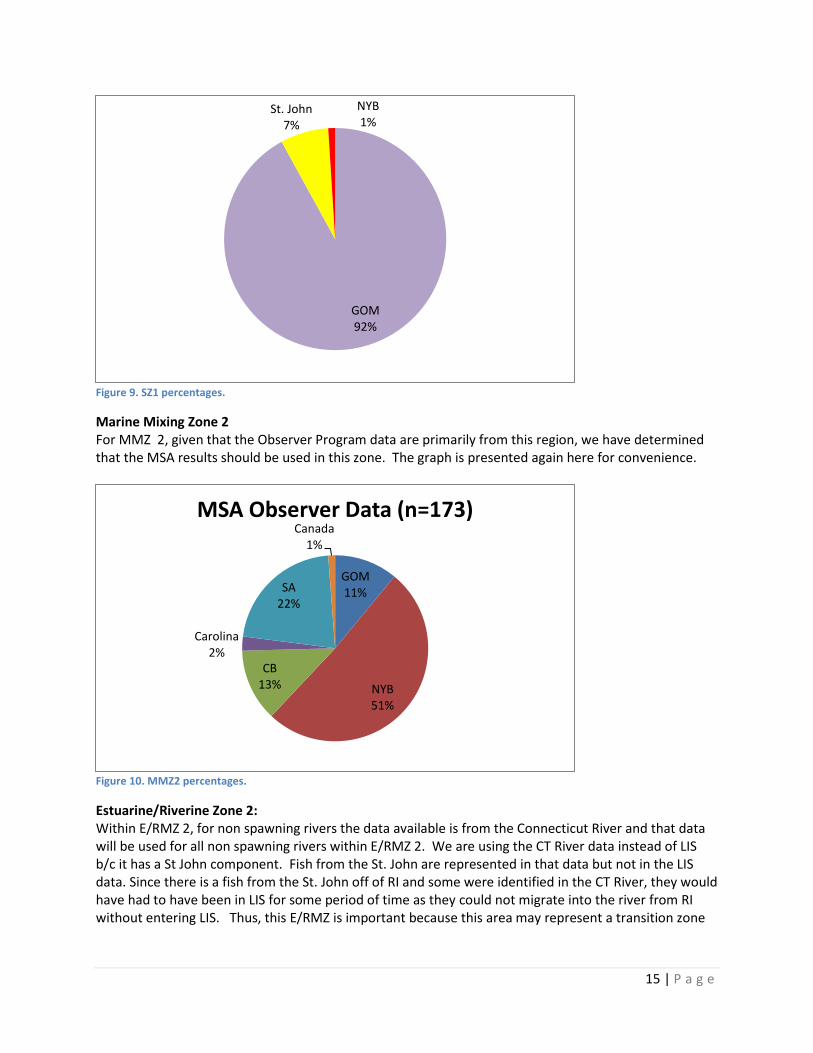
Figure 9. SZ1 percentages.
Marine Mixing Zone 2 For MMZ 2, given that the Observer Program data are primarily from this region, we have determined that the MSA results should be used in this zone. The graph is presented again here for convenience.
Figure 10. MMZ2 percentages.
Estuarine/Riverine Zone 2: Within E/RMZ 2, for non spawning rivers the data available is from the Connecticut River and that data will be used for all non spawning rivers within E/RMZ 2. We are using the CT River data instead of LIS b/c it has a St John component. Fish from the St. John are represented in that data but not in the LIS data. Since there is a fish from the St. John off of RI and some were identified in the CT River, they would have had to have been in LIS for some period of time as they could not migrate into the river from RI without entering LIS. Thus, this E/RMZ is important because this area may represent a transition zone
GOM 92%
St. John 7%
NYB 1%
GOM 11%
NYB 51%
CB 13%
Carolina 2%
SA 22%
Canada 1%
MSA Observer Data (n=173)
16 | P a g e
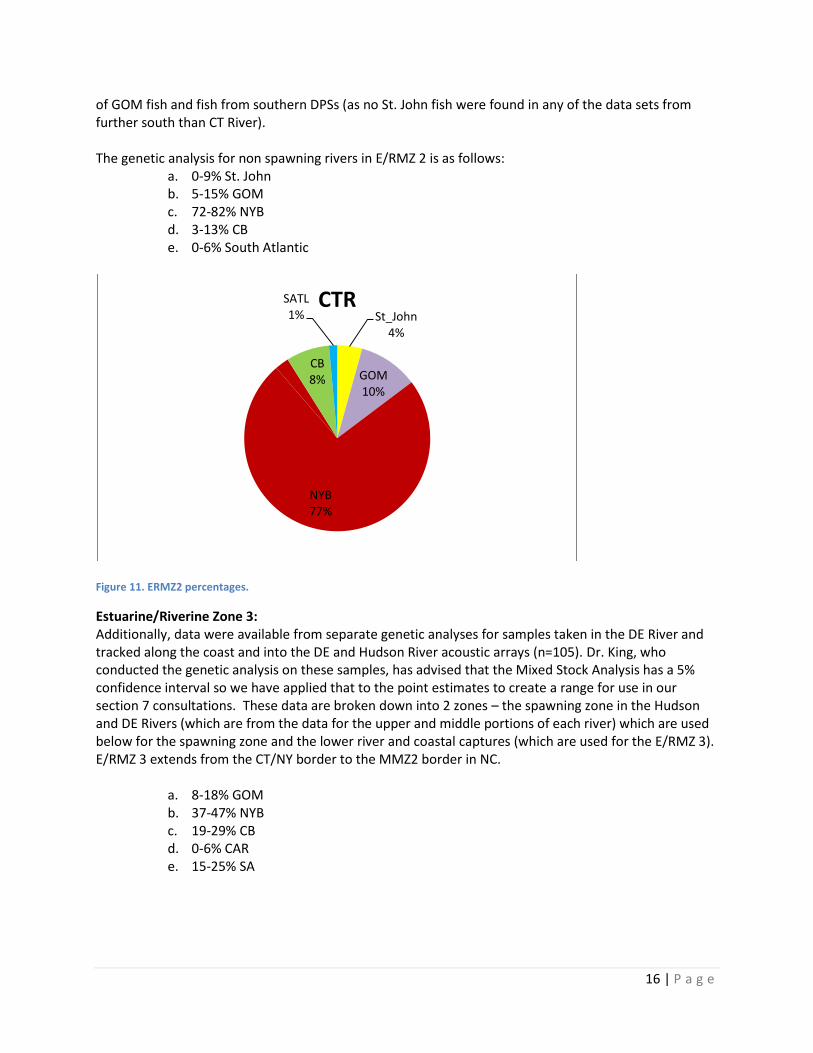
of GOM fish and fish from southern DPSs (as no St. John fish were found in any of the data sets from further south than CT River). The genetic analysis for non spawning rivers in E/RMZ 2 is as follows:
a. 0-9% St. John b. 5-15% GOM c. 72-82% NYB d. 3-13% CB e. 0-6% South Atlantic
Figure 11. ERMZ2 percentages.
Estuarine/Riverine Zone 3: Additionally, data were available from separate genetic analyses for samples taken in the DE River and tracked along the coast and into the DE and Hudson River acoustic arrays (n=105). Dr. King, who conducted the genetic analysis on these samples, has advised that the Mixed Stock Analysis has a 5% confidence interval so we have applied that to the point estimates to create a range for use in our section 7 consultations. These data are broken down into 2 zones – the spawning zone in the Hudson and DE Rivers (which are from the data for the upper and middle portions of each river) which are used below for the spawning zone and the lower river and coastal captures (which are used for the E/RMZ 3). E/RMZ 3 extends from the CT/NY border to the MMZ2 border in NC.
a. 8-18% GOM b. 37-47% NYB c. 19-29% CB d. 0-6% CAR e. 15-25% SA
St_John 4%
GOM 10%
NYB 77%
CB 8%
SATL 1%
CTR
17 | P a g e
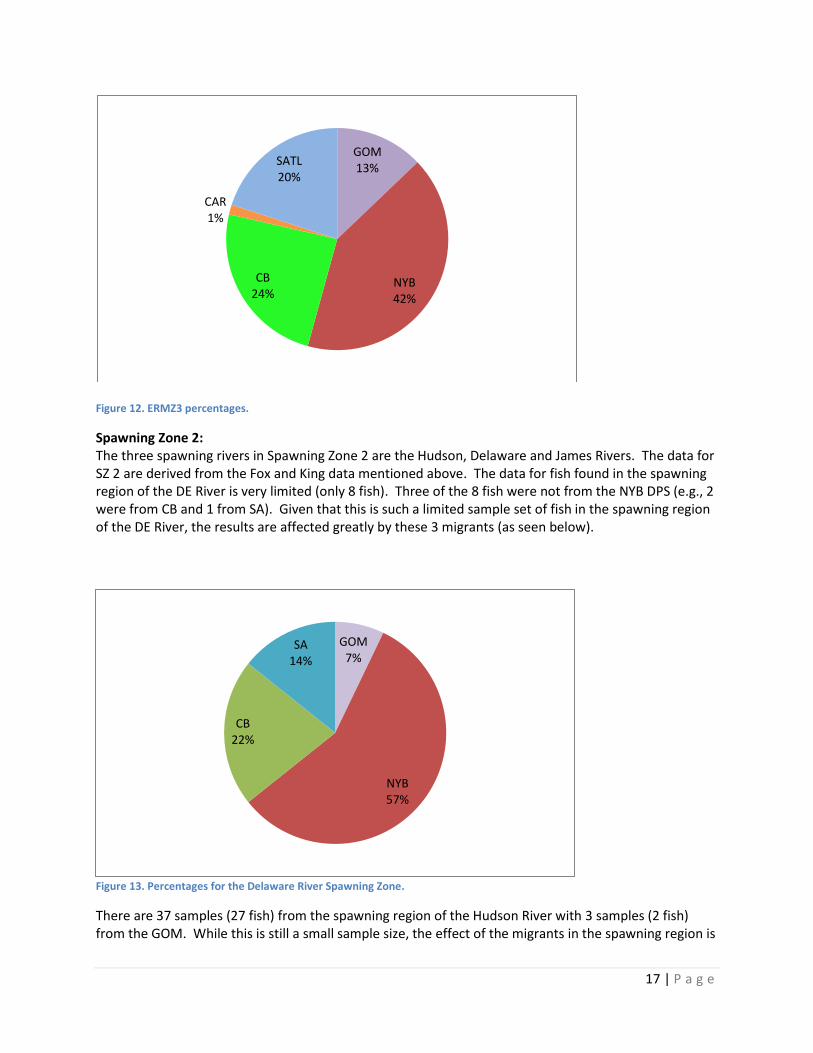
Figure 12. ERMZ3 percentages.
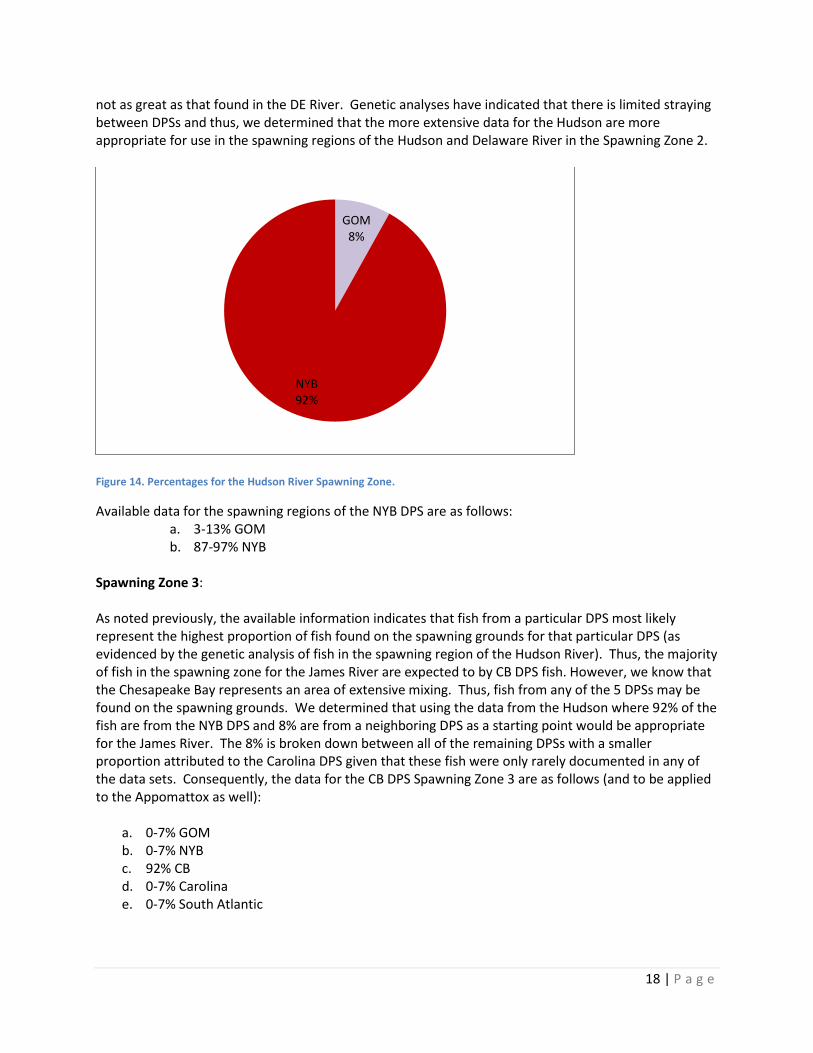
Spawning Zone 2: The three spawning rivers in Spawning Zone 2 are the Hudson, Delaware and James Rivers. The data for SZ 2 are derived from the Fox and King data mentioned above. The data for fish found in the spawning region of the DE River is very limited (only 8 fish). Three of the 8 fish were not from the NYB DPS (e.g., 2 were from CB and 1 from SA). Given that this is such a limited sample set of fish in the spawning region of the DE River, the results are affected greatly by these 3 migrants (as seen below).
Figure 13. Percentages for the Delaware River Spawning Zone.
There are 37 samples (27 fish) from the spawning region of the Hudson River with 3 samples (2 fish) from the GOM. While this is still a small sample size, the effect of the migrants in the spawning region is
GOM 13%
NYB 42%
CB 24%
CAR 1%
SATL 20%
GOM 7%
NYB 57%
CB 22%
SA 14%
18 | P a g e
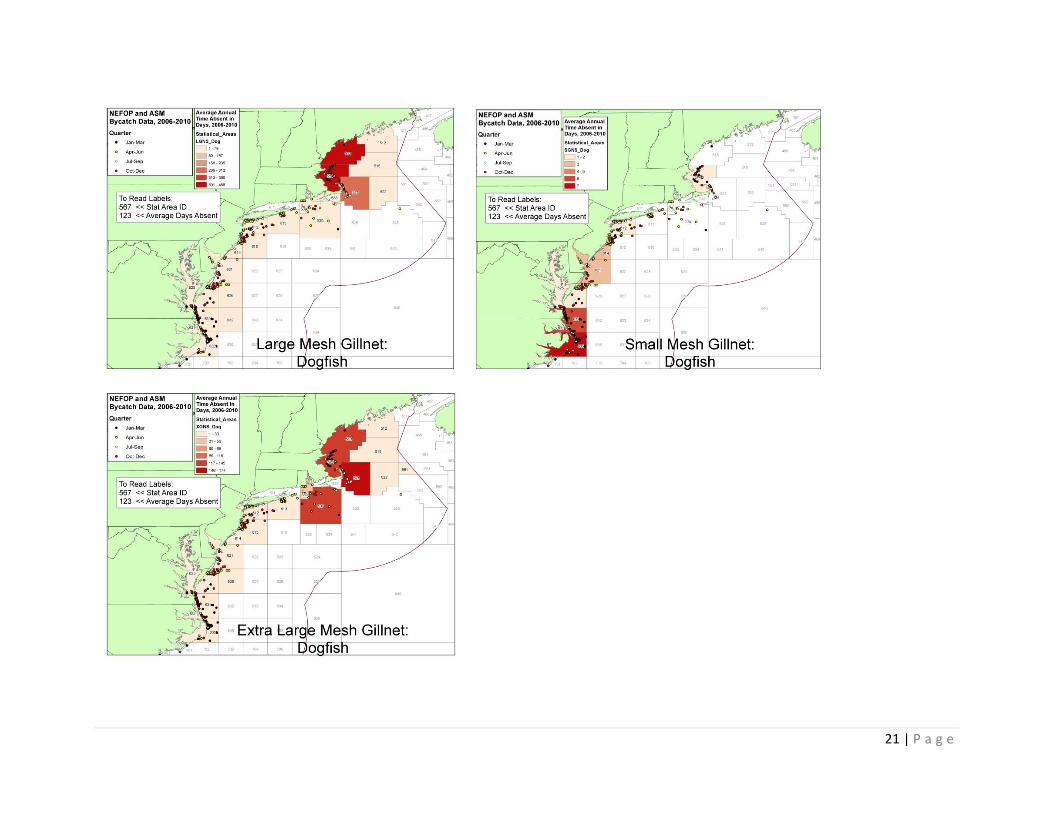
not as great as that found in the DE River. Genetic analyses have indicated that there is limited straying between DPSs and thus, we determined that the more extensive data for the Hudson are more appropriate for use in the spawning regions of the Hudson and Delaware River in the Spawning Zone 2.
Figure 14. Percentages for the Hudson River Spawning Zone.
Available data for the spawning regions of the NYB DPS are as follows: a. 3-13% GOM b. 87-97% NYB
Spawning Zone 3: As noted previously, the available information indicates that fish from a particular DPS most likely represent the highest proportion of fish found on the spawning grounds for that particular DPS (as evidenced by the genetic analysis of fish in the spawning region of the Hudson River). Thus, the majority of fish in the spawning zone for the James River are expected to by CB DPS fish. However, we know that the Chesapeake Bay represents an area of extensive mixing. Thus, fish from any of the 5 DPSs may be found on the spawning grounds. We determined that using the data from the Hudson where 92% of the fish are from the NYB DPS and 8% are from a neighboring DPS as a starting point would be appropriate for the James River. The 8% is broken down between all of the remaining DPSs with a smaller proportion attributed to the Carolina DPS given that these fish were only rarely documented in any of the data sets. Consequently, the data for the CB DPS Spawning Zone 3 are as follows (and to be applied to the Appomattox as well):
a. 0-7% GOM b. 0-7% NYB c. 92% CB d. 0-7% Carolina e. 0-7% South Atlantic
GOM 8%
NYB 92%

19 | P a g e
Figure 15. SZ3 percentages.
As noted previously, because the James and the Appomattox share a common estuary, the above percentage for the James will be applied to the Appomattox, but eggs/larvae would only be expected to be present in the James River. Mixing Zone 3 For Mixing Zone 3, there are no data currently available. Thus, the data from the Observer Program are the only data available at this time and will be used until such time as we are able to calculate percentages for this particular area. Non Spawning Rivers in Mixing Zone 3: There was no independent genetic analysis to examine for non spawning rivers in Mixing Zone 3 and therefore, the determination was made to apply the Mixing Zone 3 percentages to non spawning rivers within this zone. Spawning Rivers in Mixing Zone 3: There are six known spawning rivers in the Carolina DPS (Roanaoke, Tar-Pamlico, Cape Fear, Waccamaw, Pee Dee and Santee-Cooper) and seven spawning rivers in the South Atlantic DPS (Ashepoo, Combahee, and Edisto (ACE Basin), Savannah, Ogeechee, Altamaha, and Satilla Rivers). Reference genetic samples are only available for the Albemarle Sound, Savannah River, Ogeechee River and Altamaha River. The NEFOP and ASM are programs run by the NEFSC and a comparable program does not exist off the coast of the Southeast. Therefore, there are both very limited samples available from this mixing zone and very limited ability to link back the samples that have been taken to spawning rivers.
GOM 2% NYB
2%
CB 92%
Carolina 2%
SA 2%

20 | P a g e
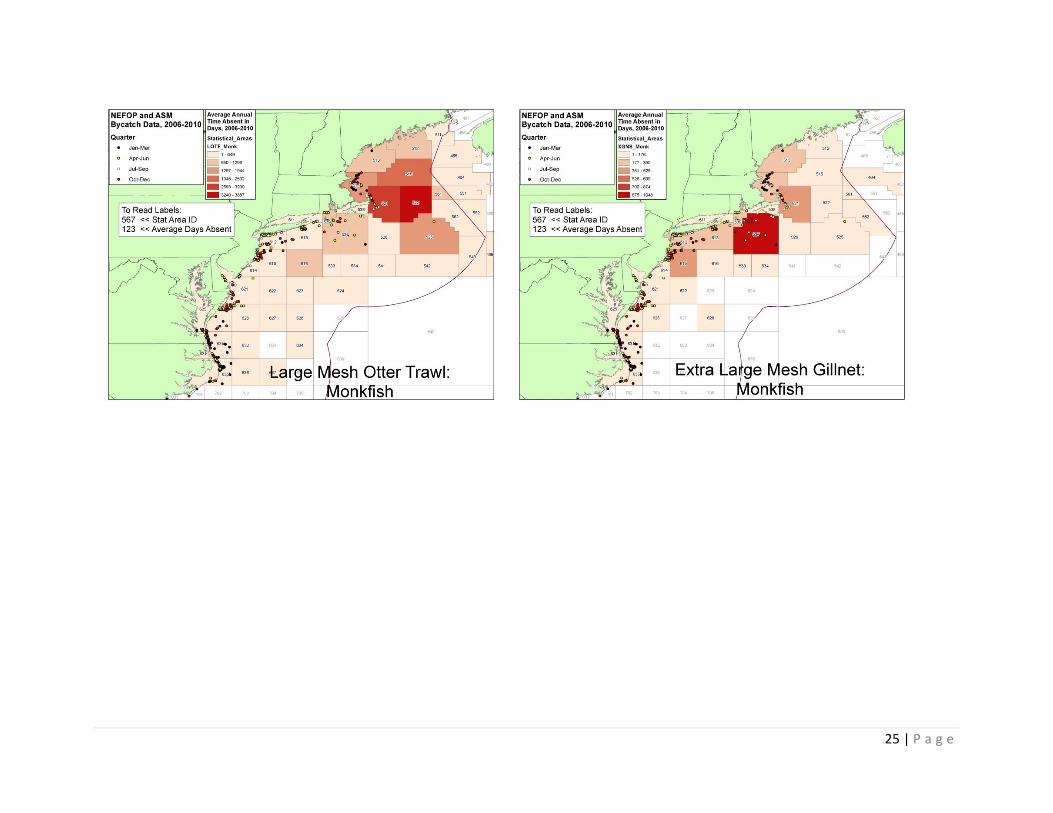
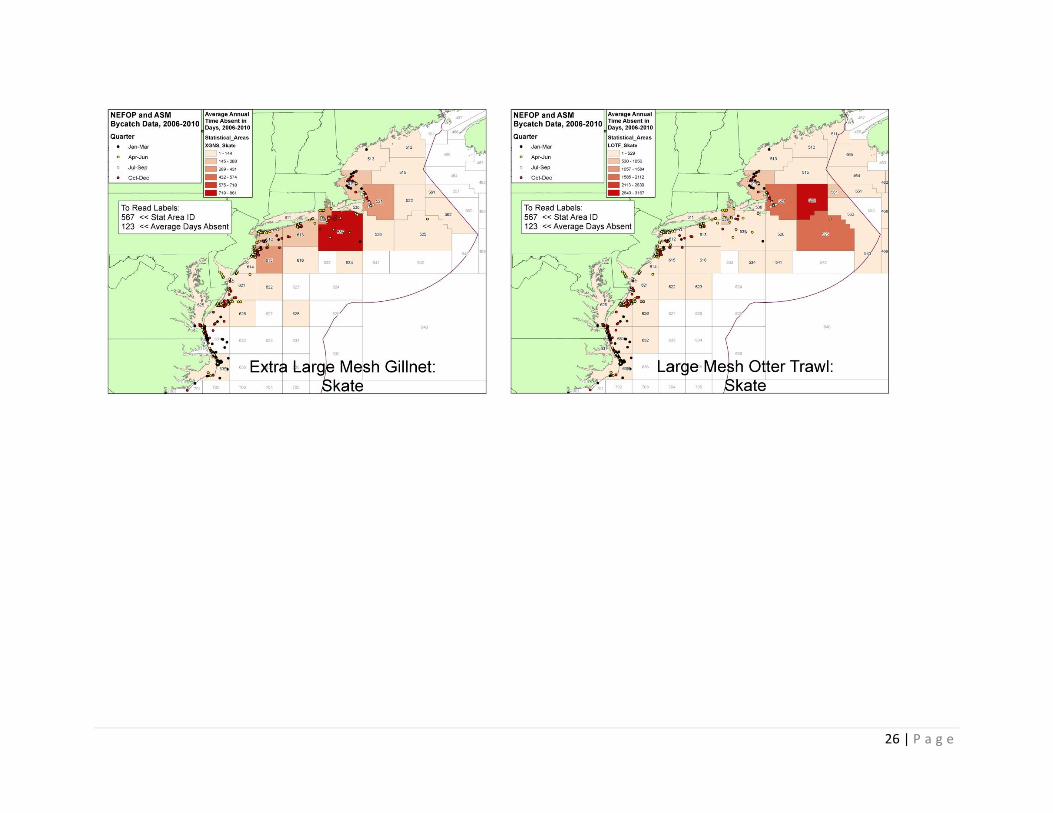
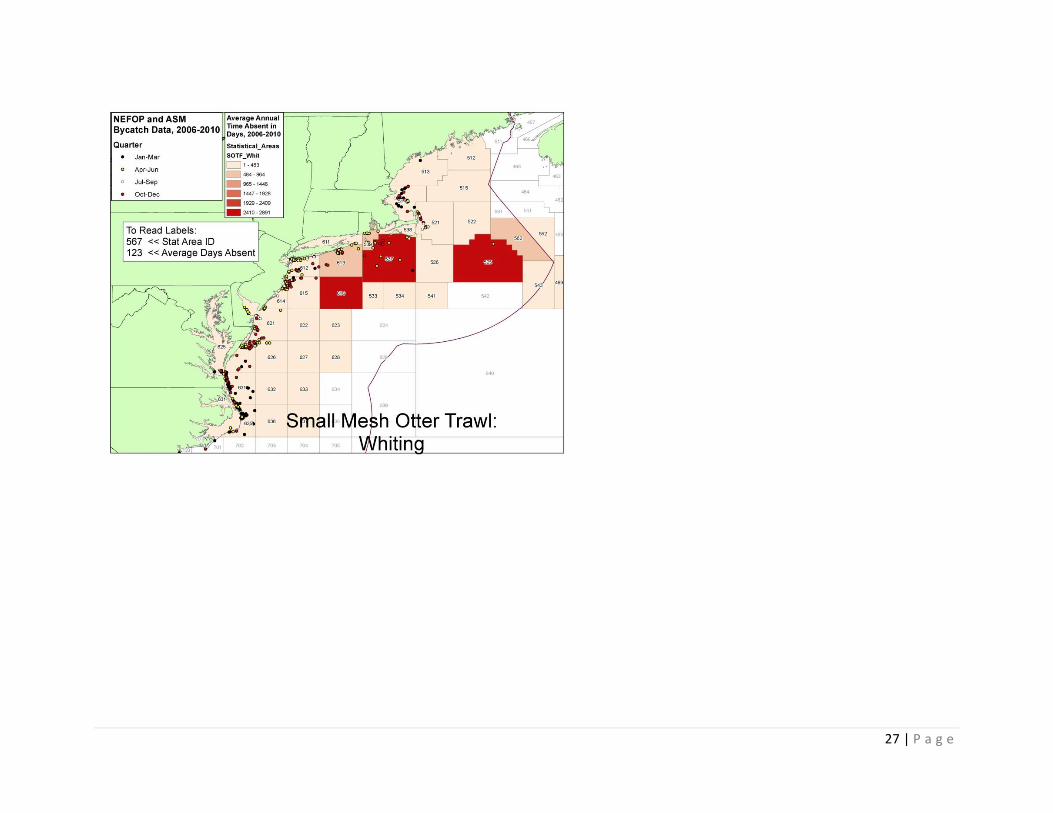
Appendix 1. Effort maps by fishery.
21 | P a g e

22 | P a g e

23 | P a g e

24 | P a g e
25 | P a g e
26 | P a g e
27 | P a g e

28 | P a g e
Based on the maps of effort displayed above, we reviewed the various DPS assignment percentages and noted that effort is distributed
throughout the majority of the range from Maine through North Carolina for all fisheries (with the exception of the small mesh gillnet fishery for
bluefish and large and extra large mesh gillnet fisheries for groundfish). Given that the percentage breakdowns for the Observer Program data
are based on the raw data and thus, required no interpretation and that effort is distributed throughout the entire range, we have determined
that the Observer Program percentages are the best available and most representative for all fisheries on which we will be consulting. While
effort for the small mesh gillnet fishery for bluefish is predominantly focused in the Mid Atlantic, the percentages for Mixing Zone 2 are very
similar to those for the Observer program. Effort for the large and extra large mesh gillnet fisheries for groundfish is higher in the Gulf of Maine
with more limited effort in the Mid Atlantic. Consequently, we considered using the Mixing Zone 1 percentages which attribute higher
percentages to the St. John and GOM populations and a very small percentage to the NYB DPS. Since effort does occur in the Mid Atlantic (south
of the Mixing Zone 1 boundary) and a significant number of Atlantic sturgeon from all DPSs (including the four endangered DPSs) have been
documented in this range, we determined that it would be most precautionary (e.g., it would err on the side of the endangered DPSs rather than
the threatened DPS) to apply the Observer Program percentages for these gear types as well. Thus, we concluded that using the Observer
Program percentages for all fisheries allows us to utilize a standard and consistent methodology as well as the most precautionary and
defensible data set.
For consultations that occur in discrete areas within the spawning zones and estuarine/riverine mixing zones, the appropriate zones and the
associated DPS percentages should be used.