compositional and structural properties thermochemical air
TRANSCRIPT

Supporting Information for
Substituted SrFeO3 as Robust Oxygen Sorbents for Thermochemical Air Separation: Correlating Performance with Compositional and Structural PropertiesEmily Krzystowczyk,†Xijun Wang,† Jian Dou, Vasudev Haribal, Fanxing Li
Department of Chemical and Biomolecular Engineering, North Carolina State University, 911 Partners Way, Raleigh, North Carolina 27695-7905, United States†co-first authors
Electronic Supplementary Material (ESI) for Physical Chemistry Chemical Physics.This journal is © the Owner Societies 2020

Figure S1: Example thermogravemetric curve of the Ba doped sample. Orange curve is weight in mg and blue curve is temperature in C.

Figure S2: Temperature programed desorption of all tested perovskites in Ar and ramped to 1000 C.

2θ°Figure S3: XRD images of all samples tested to confirm phase.* Small amount of phase impurities appeared in K, Cu, and Ba doped samples. Their contents are estimated to be less than 3% in all cases. Possible compositions are given based on the phase diagrams (Figure S4 – S6). They are not anticipated to contribute to CLAS activities.
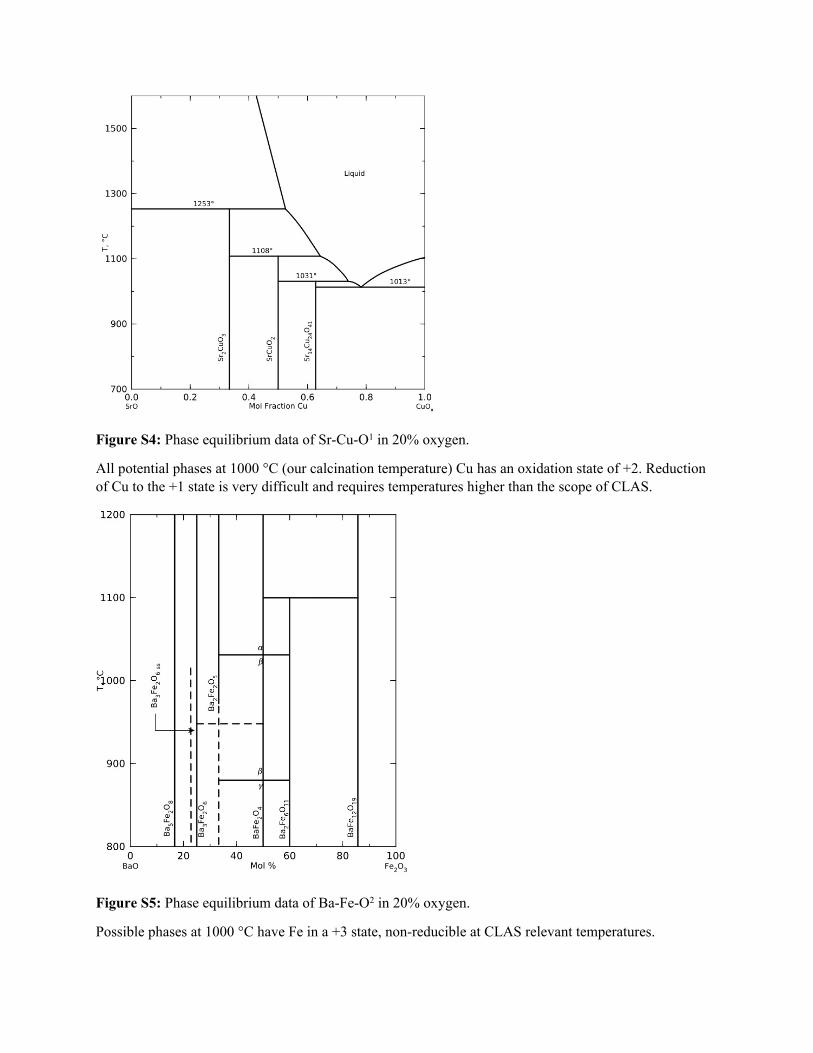
Figure S4: Phase equilibrium data of Sr-Cu-O1 in 20% oxygen.
All potential phases at 1000 °C (our calcination temperature) Cu has an oxidation state of +2. Reduction of Cu to the +1 state is very difficult and requires temperatures higher than the scope of CLAS.
Figure S5: Phase equilibrium data of Ba-Fe-O2 in 20% oxygen.
Possible phases at 1000 °C have Fe in a +3 state, non-reducible at CLAS relevant temperatures.

Figure S6: Phase equilibrium data of K-Fe-O in 20% air3–5.
Table S1: 2-theta angles for the primary diffraction peak in the perovskite phase for SrFeO3 and for each of the doped samples. Shifts in the peaks indicate changes in unit cell parameters.
MaterialSrFeO3
2𝜃32.75
Ba 32.73Co 32.85Cu 32.8K 32.85La 32.72Mn 32.75Ni 32.9Y 32.85

Figure S7. Oxygen vacancy (δ) of SrFeO3-δ as a function of temperature and oxygen partial pressure
DFT Computational Details
First-principles simulations were performed at the DFT level implemented by the Vienna ab initio
simulation package (VASP)6 with the all-electron projector augmented wave (PAW) model7 and Perdew-
Burke-Ernzerhof (PBE) functions.8 A kinetic energy cutoff of 450 eV was used for the plane-wave
expansion of the electronic wave function. The convergence criterions of force and energy were set as 0.01
eVÅ-1 and 10-5 eV, respectively. A Gaussian smearing of 0.1 eV was applied for optimization. A 2 × 1 × 2
Gamma-centered k-point grid was chosen for the brownmillerite (Sr8Fe8O20) and the lattice-redefined
perovskite (Sr8Fe8O24) (Figure S8) unit cell which contains 36 and 40 atoms respectively. In our
simulations the 2 × 1 × 1 brownmillerite (Sr16Fe16O40) and perovskite (Sr16Fe16O48) supercell were used
with two out of 16 Sr or Fe atoms replaced by A or B site dopant to mimic the doped materials, where A
represents Ba or Y and B represents Cu or Mn. The strong on-site coulomb interaction on the d-orbital
electrons of the transition metals were treated with the GGA+U approach.9 The Ueff of Fe, Mn and Cu were
set as 4, 3.9 and 4 eV, which were shown to give reasonable predictions of both geometric and electronic
structures in previous studies.10 To make the calculations directly comparable, we assumed a ferromagnetic
(FM) state for all the cases. Previous studies indicated that magnetic ordering had relatively small effect on
the oxygen vacancy formation and migration.11 The Gibbs free energy was calculated as:

𝐺 = 𝐻 ‒ 𝑇𝑆 = 𝐸𝐷𝐹𝑇 + 𝐸𝑍𝑃𝐸 ‒ 𝑇(𝑆𝑣𝑖𝑏 + 𝑆𝑐𝑜𝑛𝑓)
Here , , and represent the DFT total energy, zero-point energy, vibrational and 𝐸𝐷𝐹𝑇 𝐸𝑍𝑃𝐸 𝑆𝑣𝑖𝑏 𝑆𝑐𝑜𝑛𝑓
configurational entropy respectively. The vibrational and configurational entropy were calculated based
on12:
𝑆𝑣𝑖𝑏 = 𝑅∑𝑖
( ℎ𝜈𝑖 𝑘𝑇
exp (ℎ𝜈𝑖 𝑘𝑇) ‒ 1‒ ln [1 ‒ 𝑒𝑥𝑝( ‒ ℎ𝜈𝑖 𝑘𝑇)])
𝑆𝑐𝑜𝑛𝑓 = 𝑎𝑅 ∙ [ln (0.5 ‒ 𝛿) ‒ ln 𝛿]
where R is the ideal gas constant, h is the Plank constant, is the frequency of the ith vibrational mode, a 𝜈𝑖
is a factor referring to the interaction of oxygen vacancies with a=2 describing an ideal solid solution with
no defect interaction. We also considered the cases when a=1 and 3, which corresponds to different extent
of vacancy-vacancy interactions, but found that their impacts on the Gibbs free energies are so small (<
0.05 eV) that cannot affect our qualitative conclusions. Therefore a=2 was chosen in this study.
Selection of the base structure for DFT calculations
The phase transitions from the standard perovskite structure to brownmillerite structure was identified
by the in-situ XRD experiments, suggesting a brownmillerite nature of doped SrFeO3-δ (SF) at high
temperature. To elucidate the underlying mechanism of the phase transition, First-principles simulations
were carried out. Prior to detailed simulations, we carefully compared the structural differences between
perovskite and brownmillerite phases of SF by redefining the lattice of SF perovskite to make their
structures directly comparable (Figure S8). As shown in Figure S9, it is found that the lattice distortion is
mainly caused by the ordered vacancy sites formed in brownmillerite, and these ordered oxygen vacancy
sites have one-to-one correspondence with the oxygen atom sites (blue circle marked) in Perovskite. This
finding can provide us guidance for the addition or removal of oxygen from brownmillerite to perovskite
or perovskite to brownmillerite.

Figure S8. Reshape the lattice of perovskite with all the positions of atoms unchanged.
Figure S9. Illustration of structural differences between Perovskite and Brownmillerite.
To determine the more favorable phase at different oxygen vacancy concentration levels (δ), we
calculated the Gibbs free energy of the oxides by (i) removing oxygen from the perovskite structure; and
(ii) adding oxygen to the brownmillerite structure. The relative energy of the two cases at an identical
oxygen vacancy concentration level would then determine the more stable form of the structure. Starting

from our Sr16Fe16O48 perovskite supercell model, we removed 0, 1, 2, 3, 4 and 5 Oxygen atoms to mimic
δ=0, 0.0625, 0.125, 0.1875, 0.25 and 0.3125 respectively. The removed oxygen atoms were selected from
the 8 highlighted sites that correspond to the vacancy sites in brownmillerite. The 1st, 2nd, 3rd and 4th removed
oxygen atoms were determined by the lowest relative energies as shown in Figure S10. Similarly, starting
from brownmillerite, we added 4, 3, 2, 1 and 0 Oxygen atoms into the vacancy sites of the Sr16Fe16O40
brownmillerite model to mimic δ=0.25, 0.3125, 0.375, 0.4375 and 0.5 respectively. The oxygen dopant
sites were also determined by the lowest relative energies (Figure S11). To make the Gibbs free energies
of all the structures with different δ comparable, all the energies were normalized by Gδ=G(Sr16Fe16O48-
16δ)+16δ/2 μ(O2). As plotted in Figure S12, with the increase of δ, the energies of both Perovskite and
Brownmillerite models increase. Their energy intersection is located at δ ≈ 0.26, indicating a phase
transition occurred at high temperature during the release of oxygen. Therefore, to more accurately
reproduce the experimental observed δ change (usually 0.3 ~ 0.5) for all the A- and B-doped species, we
would use Brownmillerite instead of Perovskite as our starting point.
Figure S10. Relative energies of removing 1st, 2nd, 3rd and 4th oxygen from SF Perovskite. The most
stable structures (red marked) was chosen as the starting point for the removal of the next oxygen atom.
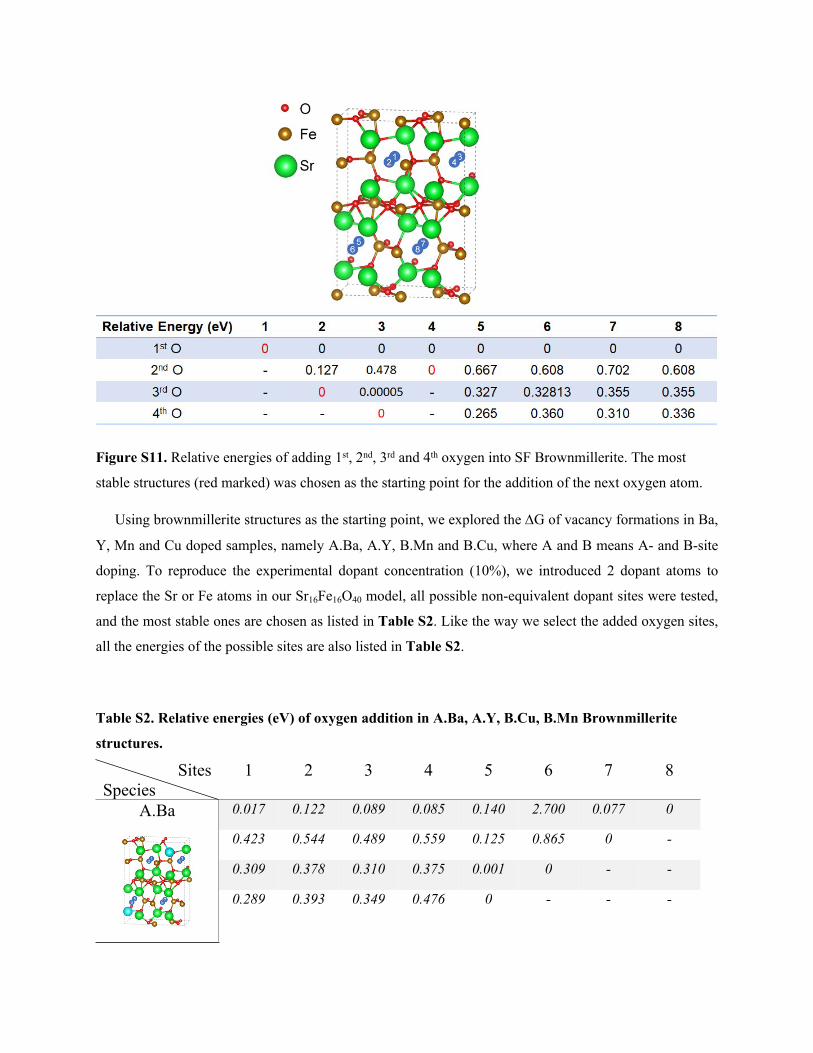
Figure S11. Relative energies of adding 1st, 2nd, 3rd and 4th oxygen into SF Brownmillerite. The most
stable structures (red marked) was chosen as the starting point for the addition of the next oxygen atom.
Using brownmillerite structures as the starting point, we explored the G of vacancy formations in Ba,
Y, Mn and Cu doped samples, namely A.Ba, A.Y, B.Mn and B.Cu, where A and B means A- and B-site
doping. To reproduce the experimental dopant concentration (10%), we introduced 2 dopant atoms to
replace the Sr or Fe atoms in our Sr16Fe16O40 model, all possible non-equivalent dopant sites were tested,
and the most stable ones are chosen as listed in Table S2. Like the way we select the added oxygen sites,
all the energies of the possible sites are also listed in Table S2.
Table S2. Relative energies (eV) of oxygen addition in A.Ba, A.Y, B.Cu, B.Mn Brownmillerite
structures.
SitesSpecies
1 2 3 4 5 6 7 8
A.Ba 0.017 0.122 0.089 0.085 0.140 2.700 0.077 0
0.423 0.544 0.489 0.559 0.125 0.865 0 -
0.309 0.378 0.310 0.375 0.001 0 - -
0.289 0.393 0.349 0.476 0 - - -

A.Y 0.478 0.503 0.374 0.388 0.113 0 0.032 0.023
1.008 1.568 1.005 1.537 0.227 - 0 0.256
0.675 0.748 0.670 0.744 0.009 - - 0
0.709 0.859 0.658 0.866 0 - - -
B.Mn 0.031 0.086 0.087 0.031 0.022 0.022 0 0.00003
0.774 0.680 0.753 1.219 0.561 0 - 0.629
0.408 0.380 0.372 0.360 0.126 - - 0
0.246 0.223 0.149 0.226 0 - - -
B.Cu 0.050 0.053 0.053 0.050 0.038 0 0.344 0.143
0.509 0.587 0.517 0.612 0 - 0.685 0.727
0.018 0.001 0 0.017 - - 0.126 0.127
0.781 0 - 0.026 - - 0.673 0.149
Due to the limitation of the periodic boundary conditions used in our simulations, in order to more
accurately simulate the possible O-O and vacancy-vacancy coupling in the experiments, a very large model
is required, which would make the CPU requirements prohibitive. To estimate the error introduced by the
periodic boundary conditions in our A16B16O48-16δ Brownmillerite model, a 2× supercell mode A32B32O82
model was made based on the A16B16O41 model as shown in Figure S13. We tried to change the positions
of the two added atoms in A32B32O82 and found that the energy could be further lower by 1.8 eV, indicating
an overestimation in the energy of A16B16O41 (G(0.4375)) by 0.9 eV. Similarly, there should also be
computational errors for G(0.25), G(0.3125) and G(0.375). The errors can be largely cancelled out when
calculating G(0.25→0.3125), G(0.3125→0.375) and G(0.375→4375). However, because the periodic
boundary conditions would not cause error in G(0.5), the G(0.4375→0.5) should be underestimated by
0.9 eV. To more accurately present the uncertainty, error bars were added in Figure 11. The error bars are
estimated to be +0.1 eV for the upper limit and -0.3 eV for the lower limit for the first three ranges according
to a previous report,7 and -0.1 eV and +0.9 eV for the last one.

Figure S12. ΔG at different ranges of δ change for SF, A.Ba, A.Y, B.Mn and B.Cu at 700℃.
Figure S13. Relative energies of Sr32Fe32O80 brownmillerite models with 2 oxygen added. The first one
(reference zero point) is equivalent to a twice the size of Sr16Fe16O40 considering the periodic conditions.
It indicates that the neglected oxygen-oxygen interactions due to periodic conditions will overestimate the
energy of the system. The error can be as large as 1.80/2=0.90 eV for the Sr16Fe16O41 model we used.

Figure S14: Preliminary testing of SrFe0.9Mn0.1O3 showing weight change vs time. Oxidation (in 20% O2) was done for 4 minutes and reduction (in Ar) was done for 6 minutes.

Figure S15: Long term testing of Sr0.9Ba0.1FeO3 showing weight change vs time. Oxidation (in 20% O2) was done for 2 minutes and reduction (in Ar) was done for 4 minutes. Arrows and percentages are displayed approximately where they were calculated from.
The average redox rate was calculated by the following equation:
𝐴𝑣𝑔 𝑅𝑒𝑑𝑜𝑥 𝑅𝑎𝑡𝑒 =
(𝑜𝑥𝑖𝑑𝑎𝑡𝑖𝑜𝑛 𝑟𝑎𝑡𝑒 ∗ 𝑟𝑒𝑑𝑢𝑐𝑡𝑖𝑜𝑛 𝑟𝑎𝑡𝑒)(𝑜𝑥𝑖𝑑𝑎𝑡𝑖𝑜𝑛 𝑟𝑎𝑡𝑒 + 𝑟𝑒𝑑𝑢𝑐𝑡𝑖𝑜𝑛 𝑟𝑎𝑡𝑒)
∗ 100
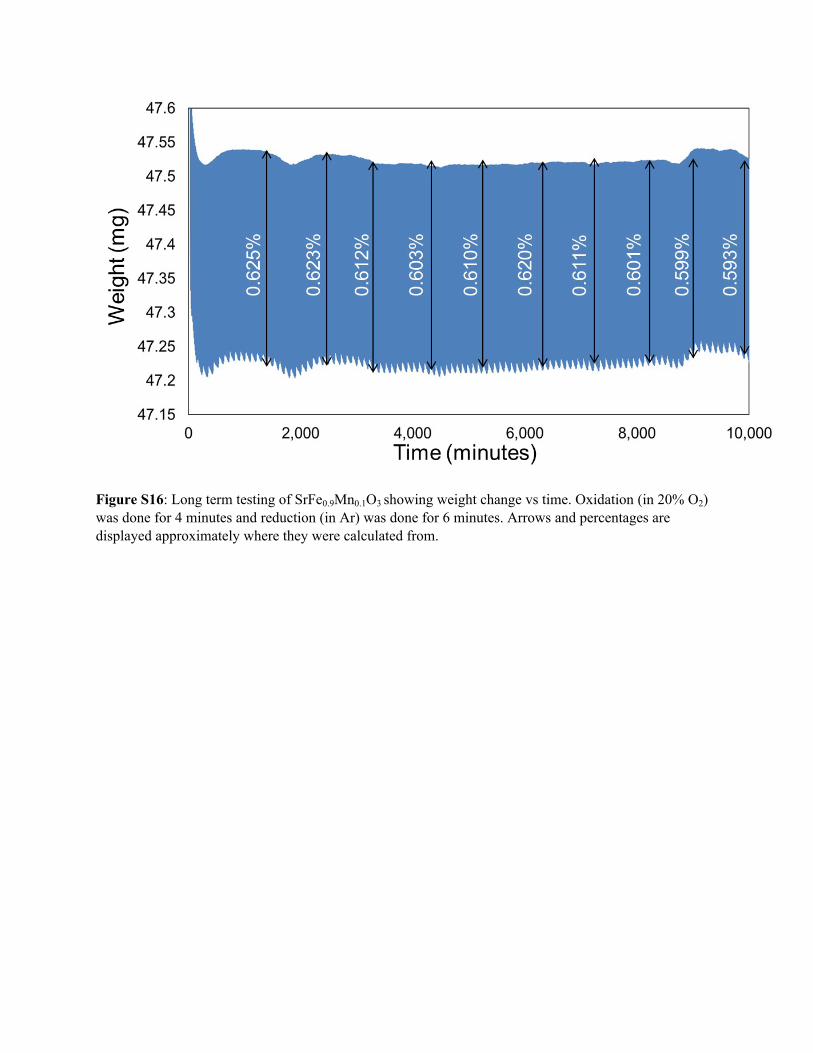
Figure S16: Long term testing of SrFe0.9Mn0.1O3 showing weight change vs time. Oxidation (in 20% O2) was done for 4 minutes and reduction (in Ar) was done for 6 minutes. Arrows and percentages are displayed approximately where they were calculated from.

Figure S17. XRD of 1000 cycled vs fresh SrFe0.9Mn0.1O3
a) b)

Figure S18. SEM images and (c-e) EDX mapping of SrFe0.9Mn0.1O3 perovskite. The red rectangle in (a) marks the region of EDX mapping
a) b)
c) Sr d) Fe e) Mn
b)

Particle Size (um)≤ 145 (145, 184] (184, 223] (223, 261] (261, 300] > 300
Cou
nts
0
2
4
6
8
10
12
Figure S19. SEM images and (c-e) EDX mapping of 1000 cycled SrFe0.9Mn0.1O3 perovskite. The red rectangle in (a) marks the region of EDX mapping
a) b)
c) Sr d) Fe e) Mn

Particle Size (um)≤ 145 (145, 184] (184, 223] (223, 261] (261, 300] > 300
Cou
nts
0
5
10
15
20
25
30
35
40
Figure S20. (a) SEM imaging of fresh SrFe0.9Mn0.1O3and histogram showing particle size in um. (b) Cycled SrFe0.9Mn0.1O3and histogram showing particle size in um.
References
(1) I. Barin and O. Knacke; Thermochemical Properties of Inorganic Substances, 921 Pp. Springer-Verlag, Berlin, Germany, 1973.
(2) G. Pouillard, M. Shamsul Alam, M. C. Trinel-Dufour, and P. Perrot, J. Chem. Res., Synop., No. 5, 136-137 (1981).

(3) H. S. Parker, R. S. Roth, C. D. Olson, and E. R. Plante, “NBS: Properties of Electronic Materials”, Natl. Bur. Stand. (U.S.) Int. Rep., Rep. No. NBSIR 78-1483, National Bureau of Standards, U. S. Department of Commerce; Washington, D.C., Pp. 84-100 (1978).
(4) C. L. McDaniel, National Bureau of Standards, Gaithersburg, Maryland; Private Communication.(5) T. Takahashi, K. Kuwabara, and Y. Kase, Denki Kagaku Oyobi Kogyo Butsuri Kagaku, 43 [5] 273-
277 (1975).(6) Blöchl, P. E. Projector Augmented-Wave Method. Phys. Rev. B 1994, 50 (24), 17953–17979.
https://doi.org/10.1103/PhysRevB.50.17953.(7) Perdew, J. P.; Burke, K.; Ernzerhof, M. Generalized Gradient Approximation Made Simple. Phys.
Rev. Lett. 1996, 77 (18), 3865–3868. https://doi.org/10.1103/PhysRevLett.77.3865.(8) Kresse, G.; Furthmüller, J. Efficient Iterative Schemes for Ab Initio Total-Energy Calculations
Using a Plane-Wave Basis Set. Phys. Rev. B 1996, 54 (16), 11169–11186. https://doi.org/10.1103/PhysRevB.54.11169.
(9) Anisimov, V. I.; Zaanen, J.; Andersen, O. K. Band Theory and Mott Insulators: Hubbard U Instead of Stoner I. Phys. Rev. B 1991, 44 (3), 943–954. https://doi.org/10.1103/PhysRevB.44.943.
(10) Hautier, Geoffroy, et al. "Accuracy of density functional theory in predicting formation energies of ternary oxides from binary oxides and its implication on phase stability." Phys. Rev. B 85.15 (2012): 155208.
(11) Lee, Yueh-Lin, et al. "Ab initio energetics of La B O 3 (001)(B= Mn, Fe, Co, and Ni) for solid oxide fuel cell cathodes." Phys. Rev. B 85.15 (2009): 224101.
(12) Vieten, Josua, et al. "Materials design of perovskite solid solutions for thermochemical applications." Energy & Environmental Science 12.4 (2019): 1369-1384.