comprehensive annual financial report - microsoft · the comprehensive annual financial report of...
TRANSCRIPT

Comprehensive AnnualFinancial ReportChatham County, GeorgiaFor Fiscal Year Ended June 30, 2015


COMPREHENSIVE ANNUAL FINANCIAL
REPORT
CHATHAM COUNTY, GEORGIA 124 BULL STREET, SAVANNAH, GEORGIA 31401
FOR THE FISCAL YEAR ENDED JUNE 30, 2015
PREPARED BY DEPARTMENT OF FINANCE
December 15, 2015


CHATHAM COUNTY, GEORGIACOMPREHENSIVE ANNUAL FINANCIAL REPORT
YEAR END JUNE 30, 2015TABLE OF CONTENTS
INTRODUCTORY SECTION PAGE
Letter of Transmittal........................................................................................................................................... A - 1
List of Principal Officials................................................................................................................................... A - 7
Organizational Chart.......................................................................................................................................... A - 9
GFOA Certificate of Achievement for Excellence in Financial Reporting..................................................... A - 10
FINANCIAL SECTION
INDEPENDENT AUDITORS' REPORT................................................................................................................ B - 1
MANAGEMENT'S DISCUSSION AND ANALYSIS.............................................................................................. C - 1
BASIC FINANCIAL STATEMENTS:
GOVERNMENT-WIDE FINANCIAL STATEMENTS:
Statement of Net Position........................................................................................................................... D - 1
Statement of Activities................................................................................................................................ D - 2
FUND FINANCIAL STATEMENTS:
Governmental Funds:
Balance Sheet......................................................................................................................................... D - 4
Reconciliation of Total Governmental Fund Balances to
Net Position of Governmental Activities............................................................................................. D - 6
Statement of Revenues, Expenditures, and Changes in Fund Balances.......................................... D - 7
Reconciliation of the Statement of Revenues, Expenditures, and Changes in
Fund Balances of Governmental Funds to the Statement of Activities........................................... D - 9
Proprietary Funds:
Statement of Fund Net Position............................................................................................................ D - 10
Statement of Revenues, Expenses, and Changes in Fund Net Position........................................... D - 11
Statement of Cash Flows....................................................................................................................... D - 12
Fiduciary Funds:
Statement of Fiduciary Net Position..................................................................................................... D - 13
Statement of Changes in Fiduciary Net Position................................................................................. D - 14
Discretely Presented Component Units:
Combining Statement of Net Position.................................................................................................. D - 15
Combining Statement of Activities....................................................................................................... D - 16
NOTES TO THE BASIC FINANCIAL STATEMENTS........................................................................................ D - 18

CHATHAM COUNTY, GEORGIACOMPREHENSIVE ANNUAL FINANCIAL REPORT
YEAR END JUNE 30, 2015TABLE OF CONTENTS
REQUIRED SUPPLEMENTARY INFORMATION OTHER THAN MD&A:
Budgetary Comparison Schedule - General Fund..................................................................................... E - 1
Budgetary Comparison Schedule - Special Service District Fund........................................................... E - 5
Notes to Required Supplementary Information......................................................................................... E - 7
Required Supplementary Information - Pension Schedules..................................................................... E - 8
Required Supplementary Information - OPEB Schedules........................................................................ E - 12
SUPPLEMENTARY DATA - Combining Fund Financial Statements and Schedules: PAGE
NONMAJOR GOVERNMENTAL FUNDS:
Combining Balance Sheet...................................................................................................................... F - 1
Combining Statement of Revenues, Expenditures, and
Changes in Fund Balances ................................................................................................................. F - 3
Budgetary Comparison Schedules - Nonmajor Governmental Funds:
Special Revenue Funds:
Street Lighting.................................................................................................................................. F - 5
Inmate Welfare Fund........................................................................................................................ F - 6
Confiscated Revenue Fund............................................................................................................. F - 7
Restricted Court Fees...................................................................................................................... F - 8
Emergency Telephone System....................................................................................................... F - 9
Land Bank......................................................................................................................................... F - 10
Land Disturbing Activities Ordinance............................................................................................ F - 11
Multiple Grant Fund......................................................................................................................... F - 12
Child Support Enforcement............................................................................................................ F - 13
Hotel/Motel Tax................................................................................................................................ F - 14
Debt Service Fund.............................................................................................................................. F - 15
NONMAJOR ENTERPRISE FUNDS:
Combining Statement of Net Position................................................................................................... F - 16
Combining Statement of Revenues, Expenses, and Changes in Fund Net Position....................... F - 17
Combining Statement of Cash Flows................................................................................................... F - 18
INTERNAL SERVICE FUNDS:
Combining Statement of Net Position................................................................................................... F - 19
Combining Statement of Revenues, Expenses, and Changes in Fund Net Position....................... F - 20
Combining Statement of Cash Flows................................................................................................... F - 21
FIDUCIARY FUNDS:
Combining Statement of Plan Net Position - Pension and OPEB Trust Fund.................................. F - 22
Combining Statement of Changes in Plan Net Position - Pension and OPEB Trust Fund............ F - 23
Combining Statement of Changes in Assets and Liabilities - Agency Funds................................... F - 24

CHATHAM COUNTY, GEORGIACOMPREHENSIVE ANNUAL FINANCIAL REPORT
YEAR END JUNE 30, 2015TABLE OF CONTENTS
STATISTICAL SECTION PAGE
Comment Relative to Statistical Section.......................................................................................................... G - 1
Narrative to Statistics......................................................................................................................................... G - 2
Net Position by Component - Last Ten Fiscal Years....................................................................................... G - 3
Graphic Presentation - Total Government Net Position - Last Ten Fiscal Years....................................... G - 4
Change in Net Position - Last Ten Fiscal Years............................................................................................. G - 5
Graphic Presentation - Change in Net Position -
Last Ten Fiscal Years..................................................................................................................................... G - 7
Fund Balances of Governmental Funds - Last Ten Fiscal Years................................................................... G - 8
Changes in Fund Balances of Governmental Funds - Last Ten Fiscal Years............................................... G - 10
Governmental Activities Tax Revenues by Source - Last Ten Fiscal Years................................................. G - 12
Assessed Value and Estimated Actual Value of Taxable Property - Last Ten Fiscal Years....................... G - 13
Graphic Presentation -Total Taxable Assessed Value and Exemptions -
Last Ten Fiscal Years..................................................................................................................................... G - 15
Property Tax Rates - Last Ten Fiscal Years..................................................................................................... G - 16
Graphic Presentation - County Government Property Tax Rates -
Last Ten Fiscal Years..................................................................................................................................... G - 18
Principal Property Taxpayers............................................................................................................................ G - 19
Property Tax Levies and Collections - Consolidated Digest - Last Ten Fiscal Years................................. G - 20
Category of Land Use…………………………………………………………………………………………………. G - 21
Ratios of Outstanding Debt by Type - Last Ten Fiscal Years......................................................................... G - 22
Ratios of General Bonded Debt Outstanding - Last Ten Fiscal Years........................................................... G - 23
Direct and Overlapping Governmental Activities Debt................................................................................... G - 24
Legal Debt Margin Information - Last Ten Fiscal Years.................................................................................. G - 25
Demographic and Economic Statistics - Last Ten Fiscal Years.................................................................... G - 26
Principal Employers - Current and Nine Years Ago........................................................................................ G - 28
Summary of Banking Deposits………………………………………………………………………………………. G - 29
Industry Mix…………………………………………………………………………………………………………….. G - 30
Full-time Equivalent County Government Employees by Function - Last Ten Fiscal Years....................... G - 31
New Construction Residential Building Permits…………………………………………………………………. G - 32
Operating Indicators by Function - Last Ten Fiscal Years............................................................................. G - 33
Capital Asset Statistics by Function - Last Ten Fiscal Years......................................................................... G - 34
STATE MANDATED PROGRAM INFORMATION SECTION
Child Support Enforcement Program Information:
Summary Statement and Schedules of Vehicles........................................................................................... H - 1
Schedule of Salaries and Travel..................................................................................................................... H - 2
Schedule of Contract Revenues and Expenditures...................................................................................... H - 3
Schedules of Projects Constructed with Special Sales Tax Proceeds......................................................... H - 4
Schedule of Required Expenditures Generated by the Hotel/Motel Tax....................................................... H - 15
Schedule of Required Expenditures Generated by the Energy Excise Tax.................................................. H - 16


LETTER OF TRANSMITTAL
LIST OF PRINCIPAL OFFICIALS
ORGANIZATIONAL CHART
GFOA CERTIFICATE OF ACHIEVEMENT FOR EXCELLENCE IN FINANCIAL REPORTING


A-1
December 15, 2015 The Chairman and Members Board of County Commissioners Chatham County, Georgia The Comprehensive Annual Financial Report of Chatham County, Georgia (County) for the year ended June 30, 2015 is hereby submitted to meet the requirements of local ordinances and state statutes. Those requirements state that the County must annually issue a complete set of financial statements presented in conformity with generally accepted accounting principles (GAAP) and audited by an independent firm of certified public accountants. Responsibility for the accuracy of the data and the completeness and fairness of the presentation, including disclosures, rests with management. To provide a reasonable basis for making these representations, management of the County has established a comprehensive internal control framework that is designed both to protect the government’s assets from loss, theft, or misuse and to compile sufficient reliable information for the preparation of the County’s financial statements in conformity with GAAP. Because the cost of internal controls should not outweigh their benefits, the County’s comprehensive framework of internal controls has been designed to provide reasonable rather than absolute assurance that the financial statements will be free from material misstatement. Management hereby asserts that, to the best of its knowledge and belief, the financial report is complete and reliable in all material respects. All disclosures necessary to enable the reader to gain an understanding of the County’s activities have been included. The firm KRT, CPAs, P.C., was selected by the Board of County Commissioners to provide independent audit services. The auditor’s report on the basic financial statements is included in the Financial Section of this report and expresses an unmodified opinion. In addition to the audit of the financial records, the County is required to undergo an annual single audit in conformity with the provisions of the federal Single Audit Act Amendments of 1996 and the related U.S. Office of Management and Budget’s Circular A-133, Audits of States, Local Governments, and Non- Profit Organization. The auditor’s report on internal controls and compliance with applicable laws and regulations, including the schedule of findings and questioned costs, are found in the Single Audit Report, which is published separately from the Comprehensive Annual Financial Report (CAFR). The Single Audit Report can be obtained from the County’s Finance Department. The internal audit function is the responsibility of the Internal Audit Department. Internal audit is an independent appraisal function that examines and evaluates the activities of the County’s various departments, agencies and officials. The Internal Audit Director reports to the County Manager. In addition to independent review, the County has asked each department to document their internal control systems which is helpful to both external and internal auditors in their review of the County’s controls and processes. The Management’s Discussion and Analysis provides an objective and easily readable analysis of the County’s financial activities on both a short-term and long-term basis. This letter of transmittal is designed to complement the MD&A and should be read in conjunction with it. The County’s MD&A can be found immediately after the Independent Auditors’ Report.

A-2
Profile of the Government The County, incorporated in 1777, is located in the southeastern part of the state and has a land area of 455 square miles with a population of 283,379. According to the 2010 census, this makes Chatham County the fifth most populous county in Georgia. The County is empowered to levy a property tax on both real and personal property located within its boundaries. The County has operated under the county-manager form of government since 1985. Policy making and legislative authority are vested in the governing Board of Commissioners consisting of a Chairman and eight Commissioners. The Board’s responsibilities include passing ordinances, adopting an annual budget, appointing committees, and hiring the County Manager and the County Attorney. The County Manager is responsible for carrying out the policies and ordinances of the governing county commission, for overseeing the day-to-day operations of the County, and for appointing the heads of the County’s departments. The Chairman and County Commissioners are elected for a four-year term with the current term expiring on December 31, 2016. The County provides a full range of services including public safety, judicial functions, planning and zoning, health and social services, recreational facilities and events, parking, recycling services, cultural events, general administrative services, and the construction and maintenance of highways, public facilities, streets and infrastructure. Public transportation, library and health services are provided by the County’s component units. The County’s financial reporting entity incorporates the activities of three component units. The County is considered the primary government. Financial activities of the Chatham County Board of Health, Chatham Area Transit Authority (CAT) and the Live Oak Library System are reported separately from the primary government on the Statement of Net Position and the Statement of Activities. Information on the County’s component units can be found in Note I A. of the Notes to the Basic Financial Statements. The County maintains extensive budgetary controls. The objective of these controls is to ensure compliance with legal provisions embodied in the annual appropriated budget approved by the County Commission and to provide appropriate disclosures to the general public. Activities of the General Fund, special revenue funds and debt service fund are included in the annual appropriated budget. Project-length budgets are prepared for the capital project funds. The level of budgetary control (i.e. the level at which expenditures cannot legally exceed the appropriated amount) is the department level within each fund. The County also maintains an encumbrance accounting system as one method of maintaining budgetary control. Although encumbrances lapse at year end, outstanding encumbrances are re-appropriated as part of the following year’s budget. Local Economic Condition and Outlook Income In the fourth quarter of 2014, the average weekly wage was $871. This is can be compared to the national average weekly wage of $1,035 and State of Georgia at $958. Fourth quarter wage gains in 2014 compared to fourth quarter 2013 were 2.7%. The purchasing power of those wages is enhanced due to the relatively low cost of living and housing in the region. This, combined with Savannah/Chatham's high quality of life, implies that workers and employers continue to receive a high return on value for area wages. Labor Force / Employment The Chatham County Sheriff’s Office and Detention Center employs 631 employees In the last three years, unemployment in Chatham County has been slightly higher than Statewide. Chatham's unemployment, however, has been consistently 1% above the United States rate. In 2015, Savannah's employment will rise by 2.5 percent, or 4,000 jobs. The area's long-term growth prospects are among the best in the nation. Manufacturing Gulfstream Aerospace Corporation, maker of Gulfstream private jets The Savannah Metropolitan Statistical Area's manufacturing firms created approximately 19.3% of the area's economic output as measured by Gross Domestic Product, accounting for $2.7 billion of output in 2013. The number of manufacturing establishments in the Savannah CMSA was 249 firms employing 15,667 workers as of mid-2014.

A-3
Tourism The preservation and restoration of Savannah's downtown historic district and the riverfront has served as the anchor for tourism in the area. Complementing the tourism sector is convention trade. Savannah's Civic Center includes a 2,566 seat theater, an arena with a capacity of 9,600, a ballroom with a capacity of 550 and over 25,000 square feet of exhibit space. In addition, the Savannah International Trade & Convention Center has allowed Savannah to compete for larger conventions, meetings and events. Savannah’s tourism and hospitality industry currently employs over 24,000 people and continues to be one of the largest economic drivers of Savannah. Travel to Savannah remains strong and the city enjoys visitors from all over the world. Most recently, the city was named “A World’s Best City for United States & Canada” by Travel & Leisure. Chatham County has over 14,900 hotel/motel rooms and a variety of restaurants in the downtown area and throughout the Metropolitan Area. During the past ten years, the growth in retail trade and service sectors is attributable to increased tourism and reflects its importance to the County's income. The Savannah tourism sector has experienced strong growth in 2014. In 2014, over 13.5 million visitors came to Savannah, including 7.5 million overnight visitors and 6 million day-trippers. Visitor spending total $2.5 billion, and room tax revenue collections exceeded $20 million for the first time in 2014. Transportation CSX Transportation and Norfolk Southern Railroad serve the Chatham County area Logistics Today has rated this area "the most logistics friendly city in the nation" - recognizing the area as a superior transportation hub. Here are some of the reasons for the honor: • Savannah is only a few miles from Interstate 95, as well as at the eastern terminus of Interstate 16 - which gives the residents speedy access to Atlanta. • Savannah is only two hours away from the burgeoning Florida market, yet has the cost and business advantages of a Georgia location. • The area enjoys a strategic location on the East coast, but is far more westerly than other coastal cities; located 647 miles due south of Cleveland, Ohio. • The taxpayers understand the importance of quality infrastructure and improvements by the continued approval of Special Purpose Local Option Sales Taxes (SPLOST). Amtrak provides rail passenger service to the Savannah area. Freight service is provided by CSX, Georgia Central and Norfolk Southern Corporation. Trucking service is provided by over 100 motor freight carriers to the Savannah area. Port of Savannah The Port of Savannah is fourth largest port in the United States The County's continued economic progress is based to a large extent on the continuing development of the Port of Savannah. The definition of the Savannah Harbor is "that it comprises the lower 21.3 miles of the Savannah River generally forming a boundary between South Carolina and Georgia and 11.0 miles of bar channel for a total length of 32.3 miles." Savannah is the farthest inland port on the East Coast. This places Savannah within a day's haul over road or rail to many major Midwestern markets, thus greatly reducing the cost of shipping, a definite advantage for the Port of Savannah. Although the Port has a large number of private businesses having docking facilities, the Georgia Ports Authority (GPA) has the largest wharfing facilities for handling cargo for both imports and exports on the East Coast. The Port of Savannah, home to the largest single-terminal container facility of its kind on the U.S. East and Gulf coasts, is comprised of two modern, deep-water terminals: Garden City Terminal and Ocean Terminal. Together, these facilities exemplify the Georgia Port Authority's exacting standards of efficiency and productivity. The Port of Savannah is the fourth largest and fastest growing container terminal in the United States. In FY 2015, Georgia Ports Authority set an all-time record in fiscal 2015, having moved more than 31.7 million tons of cargo a 7.8 percent increase from fiscal 2014. Also, 3.66 million twenty foot container units (TEUs) were moved, up 16.9 percent over fiscal 2014. A total of 714,021 auto and machinery units passed through the Port, up 1.9 percent over fiscal 2014. The port serves approximately 21,000 companies in all 50 states, more than 75% of which are headquartered outside of Georgia. Georgia Governor Nathan Deal released a statement July 27, 2015 describing the Port’s fiscal 2015 success, “The

A-4
deepwater Ports of Savannah and Brunswick are cornerstones of Georgia’s success and major factors in creating new jobs and prosperity across the state. The wave of economic impact created by our logistics network supports virtually every industry, from manufacturing and agriculture to mining, distribution, technology and transportation.” The Garden City Terminal is owned and operated by the Georgia Ports Authority. The Garden City Terminal is a secured, dedicated container facility, the largest of its kind on the U.S. East and Gulf coasts. The 1,200 acre single terminal facility features 9,693 linear feet of continuous berthing and more than 1.2 million square feet of covered storage. The terminal is equipped with fifteen high-speed container cranes (4 super post-panamax and 11 post-panamax) as well as an extensive inventory of yard handling equipment. The Ocean Terminal is a secured, dedicated breakbulk facility specializing in the rapid and efficient handling of a vast array of forest and solid wood products, steel, RoRo (Roll-on / Roll-off), project shipments and heavy-lift cargoes. The 200.4-acre general cargo terminal features 9 berths totaling 5,768 linear feet and over 1.4 million square feet of covered storage. The leading imports were iron and steel, machinery, plywood, cocoa bean, granite, lumber, aluminum, and paper products. Kaolin clay, linerboard, machinery, wood pulp, military ordinance, lumber, and foodstuff were the leading exports. The port also includes a foreign trade zone which consists of twenty eight acres at the Savannah International Airport and twelve acres at Georgia Ports Authority facilities. It allows imports into the United States to be processed, displayed, or otherwise handled free from duties and taxes. The 2,600 acre Crossroad Business Center was recently made a part of the Zone. Only when cargo leaves the zone to be distributed in the United States is it subject to these charges. If it is exported, these costs are avoided. SOURCE: Savannah Area Chamber of Commerce, Savannah 2015 Economic Trends Military
Hunter Army Airfield is in honor of Lieutenant Colonel Frank O’Driscoll Hunter, a native of Savannah and a World War I flying ace
Fort Stewart and Hunter Army Airfield are the home of the 3rd Infantry Division, and combine to be the Army's Premier Power Projection Platform on the Atlantic Coast. It is the largest, most effective and efficient armor training base east of the Mississippi, covering 280,000 acres including parts of Liberty, Long, Tattnall, Evans and Bryan counties in southeast Georgia. Hunter Army Airfield is home to the Army's longest runway on the east coast (11,375 feet) and the Truscott Air Deployment Terminal. Together these assets are capable of deploying units such as the heavy, armored forces of the 3rd Infantry Division or the elite light fighters of the 1st Battalion, 75th Ranger Regiment. Ft. Stewart, located just outside of the Savannah MSA, and Hunter Army Airfield generate sufficient economic activity to warrant inclusion of Liberty and Long counties in the larger Savannah CMSA. Ft. Stewart and Hunter AAF have an annual financial impact of $4.9 billion. Ft. Stewart and Hunter AAF together are one of Coastal Georgia’s largest employers. The ratio of military to civilian employees is approximately five to one, with 23,835 officers and enlisted military and 3,967 civilians employed at both installations. Ft. Stewart accounts for nearly three-fourths of the military employment in the area. Several small-scale deployments will have elements of the Third Infantry Division (3rd ID) overseas during 2015. Two hundred soldiers of the divisional headquarters deployed to Afghanistan for a training mission focusing on high level operational activities for Afghan security forces. Three hundred soldiers with the 3rd Sustainment Brigade deployed to Kuwait to provide logistical support for troops, and the 82nd Civil Affairs Battalion deployed to West Africa to assist in the Ebola outbreak. Financial Planning Efforts The County incorporates financial planning in its decision making and budget processes. The financial policies adopted by the Board in fiscal 2004 continue to be used as a guideline for fiscal management. In July 2010 financial policies were updated to reflect the fund balance classifications noted in GASB Statement 54 and to incorporate revised GFOA

A-5
best practices. The County Commissioners, with assistance from staff, utilize a five year forecasting model for the two main operating funds and the enterprise funds. The model shows the impact of current year’s decisions in “out” years, including the effect on fund balance, as well as the impact of millage rate / service fee changes. This model is also utilized as recurring revenues or expenditures are considered. Each January the Board receives the Five-Year Capital Improvement Program workbook which outlines the County’s CIP needs for the next five years. In February the Board holds workshops to discuss the projects, review project ratings, and discuss funding. This process enables the County to identify long-term capital needs and plan for their implementation. Each February the Board of Commissioners meets with department heads and elected officials at their annual budget retreat to review Commission goals, department goals, and prioritize budgetary needs. Additional workshops may also occur before final budget adoption in June. In 2015 the County implemented an employee merit appraisal process. Depending on the individual evaluation, the employees were given between 2% and 3.5% pay increases. This is intended to be an annual process with varying increase amounts. 2015 was the year for county-wide technology improvements. The county is currently implementing a new court system, tax assessment and collection software as well as a new financial management and human resources systems. In addition, the County and City of Savannah have been negotiating a new agreement for combined police services. In September of 2014 the Board of Commissioners voted in favor to dissolve the 10 year old joint police force, which gave them 18 months to either negotiate a new contract with the City or stand up a new separate department. At the end of the fiscal year the negotiations continued. Fund Balance Policy The County has a fund balance retention policy not less than two months of expenditures in the General Fund M&O Fund and the Special Service District Fund. In 2015 the actual amount retained was equal to three months of expenditures in each of these funds. On the governmental fund financial statements, these amounts are shown as Committed Fund Balance in accordance with adopted financial policies. Funds in excess of stated reserve levels can be redirected by the Board for other uses, preferably for non-recurring/one-time expenditures. Details on the policy can be found in the Notes to the Financial Statements page D-22. Debt Administration Chatham County’s financial condition is demonstrated by the Aa2 rating of its bonds by Moody’s Investor Services and AA from Standard and Poor’s Corporation. The County’s ratings were reaffirmed in September 2013. The constitutional debt limit for direct general obligation bonds is 10 percent of the assessed value of taxable property within the County. The constitutional debt limitation applies to all general obligation bonds authorized. Additional general obligation bonds may be authorized if approved by a majority of those voting in an election held for that purpose. Capital leases and contractual obligations are presented in Note III. F and G and constitute a debt, general obligation, or a pledge of the full faith and credit of the County. Awards & Acknowledgments The Government Finance Officers Association (GFOA) awarded a Certificate of Achievement for Excellence in Financial Reporting to the County for its comprehensive annual financial report for the fiscal year ended June 30, 2014. This was the thirty-first consecutive year that the County has received this prestigious award. In order to be awarded a Certificate of Achievement, the County must publish an easily readable and efficiently organized comprehensive annual financial report that satisfies both generally accepted accounting principles and applicable legal requirements.

A-6
A Certificate of Achievement is valid for a period of one year only. The County believes that the 2015 comprehensive annual financial report continues to meet the program’s requirements, and is submitting the report to the GFOA to determine its eligibility for another certificate. In addition, the County also received the GFOA’s Award for Distinguished Budget presentation for its Adopted Annual Budget for the fiscal year July 1, 2014 – June 30, 2015. The County’s budget document was judged proficient in several categories including policy documentation, financial planning and organization. The Finance Director would like to extend thanks and appreciation to all parties who have provided their support and encouragement to the Department throughout the past year. This includes the County Manager, the County Board of Commissioners, Assistant County Managers, the Internal Audit Director, and the Fixed Assets Coordinator. In addition, thanks and appreciation is extended to all members of the Finance Department in some way involved in the audit process. The hard work and dedication of the Finance Staff is reflected each year in the final report document and in any subsequent awards received. Sincerely,
Lee Smith Amy J. Davis County Manager Finance Director

CHATHAM COUNTY, GEORGIA
DEPARTMENT OF FINANCE
Finance Director. . . . . . . . . . . . . . . . . . . . . . . . . . . . . . . . Amy J. DavisAssistant Finance Director. . . . . . . . . . . . . . . . . . . . . . . . . . . . Alisa FishFinancial Services Manager. . . . . . . . . . . . . . . . . . . . . . . . . Maria WallerBudget Officer.. . . . . . . . . . . . . . . . . . . . . . . . . . . . . . . . . Read DehavenSenior Accountant.. . . . . . . . . . . . . . . . . . . . . . . . . . . . . . . . . . Irene VighSenior Accountant. . . . . . . . . . . . . . . . . . . . . . . . . . . . . . Joyce PrescottSenior Accountant. . . . . . . . . . . . . . . . . . . . . . . . . . . . . . . . . . . Vida HillAccountant I. . . . . . . . . . . . . . . . . . . . . . . . . . . . . . . . . . . Michole JenksAccountant I. . . . . . . . . . . . . . . . . . . . . . . . . . . . . . . . . . . . . Janie BrooksAccountant I. . . . . . . . . . . . . . . . . . . . . . . . . . . . . . . . . Felecia ChapmanPayroll Administrator . . . . . . . . . . . . . . . . . . . . . . . . . . . . Debra BickhamRisk Manager. . . . . . . . . . . . . . . . . . . . . . . . . . . . . . . . . . . . . Greg ScottAdministrative Assistant. . . . . . . . . . . . . . . . . . . . . . . . . . Delores Stokes
CHATHAM COUNTY, GEORGIA
PURCHASING DEPARTMENT
Fixed Asset Coordinator.. . . . . . . . . . . . . . . . . . . . . . . . . .Syrina Mitchell
A-7

CHATHAM COUNTY, GEORGIABOARD OF COMMISSIONERS
2013-2016
CHAIRMAN Albert J. Scott
VICE-CHAIRMAN Dr. Priscilla D. Thomas
CHAIRMAN PRO-TEM Helen L. Stone
DISTRICT ONE Helen L. Stone
DISTRICT TWO James J. Holmes
DISTRICT THREE Tony Center
DISTRICT FOUR Patrick K. Farrell
DISTRICT FIVE Yusef K. Shabazz
DISTRICT SIX Lori L. Brady
DISTRICT SEVEN Dean Kicklighter
DISTRICT EIGHT Dr. Priscilla D. Thomas
Independent Auditor
KRT, CPAs, P.C.
Certified Public Accountants
Lee Smith
County Manager
Linda B. Cramer
Michael Kaigler
Assistant County Managers
R. Jonathan Hart
County Attorney
Janice Bocook
Clerk of Commission
A-8

CHATHAM CO UNTY, GEORGIA Organizational Chart
Citizens
Elected Officials & Judicial
AppointmentsBoard of Commisioners
CountyManager
Human Resources
Occupational Safety
Police
Counter Narcotics Team
Indigent Defense Unit
Asst. County Manager
Public Works
Animal Control
Building Safety & Reg. Services
M/WBE Outreach
EMS
County Engineer
Fleet
Facilities Maintenance
Asst. County Manager
Internal Audit
Information & Communications
Finance
Transit Operations
Purchasing
Mosquito Control
County Attorney
County Clerk
A-9

A-10

INDEPENDENT AUDITORS’ REPORT MANAGEMENT’S DISCUSSION AND ANALYSIS
A-11


B-1
Tel 912-232-0475 Fax 912-232-0478 6600 Abercorn Street, Suite 200 | Savannah, GA 31405 | P.O. Box 16149 | Savannah, GA 31416 | krtcpa.com
INDEPENDENT AUDITORS’ REPORT Chatham County Board of Commissioners Savannah, Georgia 31405 Report on the Financial Statements
We have audited the accompanying financial statements of the governmental activities, the business-type activities, the discretely presented component units, each major fund, and the aggregate remaining fund information of Chatham County, Georgia (County), as of and for the year ended June 30, 2015, and the related notes to the financial statements, which collectively comprise the County’s basic financial statements as listed in the table of contents.
Management’s Responsibility for the Financial Statements
The County’s management is responsible for the preparation and fair presentation of these financial statements in accordance with accounting principles generally accepted in the United States of America; this includes the design, implementation, and maintenance of internal control relevant to the preparation and fair presentation of financial statements that are free from material misstatement, whether due to fraud or error.
Auditor’s Responsibility
Our responsibility is to express opinions on these financial statements based on our audit. We did not audit the financial statements of the Chatham Area Transit Authority, the Chatham County Health Department and Live Oak Public Libraries, which represent 100% of the assets, net position and revenues of the discretely presented component units. Those statements were audited by other auditors whose report has been furnished to us, and our opinion, insofar as it relates to the amounts included for the Chatham Area Transit Authority, the Chatham County Health Department and Live Oak Public Libraries is based solely on the report of the other auditors. We conducted our audit in accordance with auditing standards generally accepted in the United States of America and the standards applicable to financial audits contained in Government Auditing Standards, issued by the Comptroller General of the United States. Those standards require that we plan and perform the audit to obtain reasonable assurance about whether the financial statements are free from material misstatement.
An audit involves performing procedures to obtain audit evidence about the amounts and disclosures in the financial statements. The procedures selected depend on the auditor’s judgment, including the assessment of the risks of material misstatement of the financial statements, whether due to fraud or error. In making those risk assessments, the auditor considers internal control relevant to the County’s preparation and fair presentation of the financial statements in order to design audit procedures that are appropriate in the circumstances, but not for the purpose of expressing an opinion on the effectiveness of the County’s internal control. Accordingly, we express no such opinion. An audit also includes evaluating the appropriateness of accounting policies used and the reasonableness of significant accounting estimates made by management, as well as evaluating the overall presentation of the financial statements.

B-2
We believe that the audit evidence we have obtained is sufficient and appropriate to provide a basis for our audit opinions.
Opinions
In our opinion, based on our audit and the report of other auditors, the financial statements referred to above present fairly, in all material respects, the respective financial position of the governmental activities, the business-type activities, the discretely presented component units, each major fund, and the aggregate remaining fund information of the County, as of June 30, 2015, and the respective changes in financial position and cash flows, where applicable, for the year then ended in conformity with accounting principles generally accepted in the United States of America.
Other Matters
Required Supplementary Information
Accounting principles generally accepted in the United States of America require that the management’s discussion and analysis (MD&A) and required supplementary information other than the MD&A as listed in the table of contents C-1 through C-11 and E-1 through E-12 respectively, be presented to supplement the basic financial statements. Such information, although not a part of the basic financial statements, is required by the Governmental Accounting Standards Board, who considers it to be an essential part of financial reporting for placing the basic financial statements in an appropriate operational, economic, or historical context. We have applied certain limited procedures to the required supplementary information in accordance with auditing standards generally accepted in the United States of America, which consisted of inquiries of management about the methods of preparing the information and comparing the information for consistency with management’s responses to our inquiries, the basic financial statements, and other knowledge we obtained during our audit of the basic financial statements. We do not express an opinion or provide any assurance on the information because the limited procedures do not provide us with sufficient evidence to express an opinion or provide any assurance.
Other Information
Our audit was conducted for the purpose of forming opinions on the financial statements that collectively comprise the County’s basic financial statements. The supplementary data, state mandated program information, introductory section and statistical section as listed in the table of contents are presented for purposes of additional analysis and are not a required part of the basic financial statements.
The supplementary data and state mandated program information listed in the table of contents are the responsibility of management and were derived from and relate directly to the underlying accounting and other records used to prepare the basic financial statements. Such information has been subjected to the auditing procedures applied in the audit of the basic financial statements and certain additional procedures, including comparing and reconciling such information directly to the underlying accounting and other records used to prepare the basic financial statements or to the basic financial statements themselves, and other additional procedures in accordance with auditing standards generally accepted in the United States of America. In our opinion, the supplementary data and state mandated program information listed in the table of contents are fairly stated in all material respects in relation to the basic financial statements as a whole.
The introductory and statistical sections have not been subjected to the auditing procedures applied in the audit of the basic financial statements and, accordingly, we do not express an opinion or provide any assurance on them.

B-3
Other Reporting Required by Government Auditing Standards
In accordance with Government Auditing Standards, we have also issued our report dated December 15, 2015, on our consideration of County’s internal control over financial reporting and on our tests of its compliance with certain provisions of laws, regulations, contracts, and grant agreements and other matters. The purpose of that report is to describe the scope of our testing of internal control over financial reporting and compliance and the results of that testing, and not to provide an opinion on internal control over financial reporting or on compliance. That report is an integral part of an audit performed in accordance with Government Auditing Standards in considering the County’s internal control over financial reporting and compliance.
KRT, CPAs P.C. Savannah, Georgia December 15, 2015


C-1
Management’s Discussion and Analysis
This Management’s Discussion and Analysis (MD&A) section offers you, the reader, a narrative overview and analysis of the financial activities of Chatham County, Georgia for the fiscal year ended June 30, 2015. Please consider the information presented herein with the additional information furnished in the letter of transmittal that can be found beginning on page A-1 of this report. The MD&A presents both current year and prior year financial information for comparative purposes. Prior year numbers provided for comparative purposes throughout this report have been adjusted to include a restatement for GASB 68 and the removal of Chatham Area Transit as a blended component unit. Financial Highlights
• Chatham County’s assets and deferred outflows exceeded its liabilities and deferred inflows at June 30, 2015 by $1,072,423,495 (net position). Of this amount, $22,522,735 (unrestricted net position) may be used to meet the County’s ongoing obligations to citizens and creditors.
• Beginning net position was adjusted down $48,937,780 for net pension liability in the
governmental activities. In business-type activities, the beginning balance was adjusted down $43,194,168 for the reclassification of Chatham Area Transit from a blended component unit to a discretely presented component unit and adjusted down $871,988 for net pension liability.
• Adjusting for the restatement of beginning net position for GASB 68 and the removal of
Chatham Area Transit as a blended component unit, the County’s total net position increased from the previous year by $4.4 million. Net position of governmental activities increased $5,305,355 while net position from business-type activities decreased by $836,412.
• At June 30, 2015, Chatham County’s governmental funds balance sheet reports combined
ending fund balances of $267,966,573, an increase of $16,144,412 over the previous fiscal year. Of this amount, $184,949,935 is classified as restricted, $540,898 is non-spendable and $82,475,740 is classified as unrestricted. Unrestricted fund balance includes $27,670,993 of assigned fund balance, $53,558,757 of committed fund balance, and $1,245,990 of unassigned fund balance.
• The General Fund reported an unrestricted fund balance of $43,883,798. Of the
unrestricted fund balance, $42,637,808 was committed. The remaining $1,245,990 was unassigned. Total fund balance increased by $5,120,937 to $44,401,101 in 2015.
• Total long-term debt of in governmental activities increased by $4,287,449 from the
previous fiscal year as a result of the issuance of a capital lease for radios and radio equipment and increase in claims and judgements. Long term debt in business-type activities decreased $110,876 from prior year due to annual debt service payments.

C-2
Overview of the Financial Statements This discussion and analysis is intended to serve as an introduction to Chatham County’s basic financial statements. The basic financial statements include government-wide and fund financial statements as well as notes to the financial statements. This report also contains other supplementary information in addition to the basic financial statements themselves. These statements are described herein: Government-wide Financial Statements Government-wide financial statements are designed to provide a broad overview of the finances of Chatham County, Georgia, in a manner similar to a private-sector business. The government-wide statements include a Statement of Net Position and a Statement of Activities. These statements appear on pages D-1 to D-3 of the report. The Statement of Net Position shows all of the County’s assets and liabilities, and the difference between the two is reported as net position. Changes in net position over time may be helpful in indicating an improving or deteriorating financial position. The Statement of Activities presents information showing how the net position changed during the fiscal year. The statement presents all underlying events that gave rise to the change, regardless of the timing of the related cash flow. Consequently, revenues and expenses are reported in this statement for some items that will only result in cash flow changes in future fiscal periods, such as uncollected taxes and earned but unused vacation leave. Both statements distinguish functions of Chatham County that are principally supported by taxes and intergovernmental revenues (governmental activities) from other functions that are intended to recover all or a significant portion of their costs through user fees and charges (business-type activities). Governmental activities reported in the statements include general government, judiciary, public safety, public works, health and welfare, culture and recreation, housing and development, and interest on long-term debt. Business-type activities in Chatham County include environmental services (solid waste) and other services (water & sewer utility, parking garage, and building safety and regulatory services). The government-wide statements include the activities of the County and its component units. Financial information for the discretely presented component units is reported separately from the primary government. The discretely presented component units are the Chatham County Board of Health, Chatham Area Transit and the Live Oak Public Libraries. As a result of structural changes in specific debt instruments held by Chatham Area Transit (CAT), which was guaranteed by Chatham County government, CAT was reclassified from a blended component unit to a discretely presented component unit. Fund Financial Statements A fund is a grouping of related accounts that is used to maintain control over resources that have been segregated for specific activities or objectives. Like other state and local governments, Chatham County uses fund accounting to ensure and demonstrate compliance with finance-

C-3
related legal requirements. All funds of Chatham County can be divided into three categories: governmental, proprietary and fiduciary. Governmental Funds Governmental funds, presented on pages D-4 to D-9, essentially account for the same functions as those reported as governmental activities in the government-wide financial statements. However, this set of financial statements focuses on events that produce near-term inflows and outflows of spendable resources and on the balances available at the end of the fiscal year. Such information may be useful in evaluating Chatham County’s near-term financing requirements. Since the focus of governmental funds is narrower than that of the government-wide financial statements, it is useful to compare the information presented for governmental funds with similar information presented for the governmental activities found in the government-wide financial statements. This will give the reader a better understanding of the long-term impact of the government’s near-term financing decisions. Both the governmental funds balance sheet and the statement of revenues, expenditures, and changes in fund balances provide a reconciliation to facilitate this comparison. Governmental funds individually presented in Chatham County’s statements include eight major funds: General Fund, Special Service District Fund, Sales Tax I Fund, Sales Tax II Fund, Sales Tax III Fund, Sales Tax IV Fund , Sales Tax V Fund and Sales Tax VI Fund. Chatham County’s remaining governmental funds are combined for presentation in a total column termed “Other Governmental Funds”. Individual fund data for each of these non-major governmental funds is provided in the form of combining statements elsewhere in the report. Chatham County adopts annual budgets for its General Fund, special revenue funds and debt service fund. Budgetary comparison schedules are provided within the report for these funds. Budgetary comparison schedules for the General Fund and the Special Service District are provided as required supplementary information while schedules for the non-major funds are found elsewhere in the report. Proprietary Funds Chatham County maintains and presents two different types of proprietary funds, enterprise and internal service, on pages D-10 to D-12 of this report. Enterprise funds report, in greater detail, the same information presented as business-type activities in the government-wide financial statements. Major funds include and the Solid Waste Fund. Details of other enterprise fund transactions are shown in combining statements presented elsewhere in the report. Internal service funds represent an accounting mechanism used to accumulate and allocate costs internally for Chatham County government. The County has four internal service funds: Health Insurance Fund, Catastrophic Claims Fund, Computer Replacement Fund and Risk Management Fund. The internal service funds are combined into a single, aggregated presentation in the proprietary fund financial statements. Individual fund data for the internal service funds is provided in the form of combining statements elsewhere in this report. Because these funds predominately benefit governmental activities rather than business-type functions, they have been included within governmental activities in the government-wide financial statements.

C-4
Fiduciary Funds Chatham County uses fiduciary funds to account for resources held for the benefit of parties outside county government. Although these funds are presented in the fund set of statements, they do not appear in the government-wide financial statements because their resources are not available to support the County’s own programs. The accounting used for fiduciary funds is much like that used for proprietary funds. These funds are presented on pages D-13 to D-14 of this report. Notes to the Financial Statements The Notes to the Financial Statements provide additional information essential to a full understanding of the data provided in both government-wide and fund financial statements. Notes are presented beginning on page D-18 of the report. Other Information In addition to the basic financial statements and accompanying notes, this report also presents certain required supplementary information concerning the County’s budget process and the County’s progress in funding pension and other post-employment benefits to employees and/or retirees. This information begins on page E-1. The combining statements referred to earlier in connection with non-major funds begin on page F-1. This section includes individual budget to actual schedules for non-major special revenue funds and the debt service fund. Also included are statements for internal service and agency funds. Additional information about the County, which may be of interest to the reader, is found under the Statistical and State Mandated sections of this report. Government-wide Financial Analysis Net position may serve over time as a useful indicator of a government’s financial position. The County’s combined net position (governmental and business-type activities) totaled $1,088,536,773 as of June 30, 2015. Summary data on net position for the current and prior fiscal year is shown herein:

C-5
Governmental Activities Business-type Activities Total2015 2014 2015 2014 2015 2014
ASSETSCurrent and other assets 318,900,536$ 302,583,816$ 13,252,537$ 14,550,431$ 332,153,073$ 317,134,247$
Capital assets, net 887,869,400 898,860,651 8,242,759 7,693,310 896,112,159 906,553,961 Total assets 1,206,769,936 1,201,444,467 21,495,296 22,243,741 1,228,265,232 1,223,688,208
DEFERRED OUTFLOWS OF RESOURCES 7,234,694 - 138,457 - 7,373,151 -
TOTAL ASSETS AND DEFERRED OUTFLOW OF RESOURCES 1,214,004,630 1,201,444,467 21,633,753 22,243,741 1,235,638,383 1,223,688,208
LIABILITIES
Current and other liabilities 22,639,722 23,448,710 725,216 746,833 23,364,938 24,195,543 Noncurrent liabilities 116,836,050 159,516,721 4,759,966 4,547,218 121,596,016 164,063,939 Total liabilities 139,475,772 182,965,431 5,485,182 5,294,051 144,960,954 188,259,482
DEFERRED INFLOWS OF RESOURCES 2,105,363 298,676 35,293 - 2,140,656 298,676
TOTAL LIABILITIES AND DEFERRED INFLOW OF RESOURCES 141,581,135 183,264,107 5,520,475 5,294,051 147,101,610 188,558,158 Net Position
Net Investment in Capital Assets 864,460,707 872,404,763 9,380,303 7,693,310 873,841,010 880,098,073 Restricted 185,440,053 186,408,358 2,392,990 2,736,253 187,833,043 189,144,611 Unrestricted 22,522,735 8,305,019 4,339,985 6,520,127 26,862,720 14,825,146
TOTAL NET POSITION 1,072,423,495$ 1,067,118,140$ * 16,113,278$ 16,949,690$ * 1,088,536,773$ 1,084,067,830$ *
* Prior year numbers as restated for GASB 68 and for the removal of Chatham Area Transit Authority as a blended component unit in the Business Type Activities.
Chatham County's Net Position (in $)
The largest portion of Chatham County’s net position (80.28%) reflects its investment in capital assets such as land, building, equipment and infrastructure, less any related outstanding debt used to acquire those assets. The County uses these capital assets to provide services to citizens; consequently, these assets are not available for future spending needs. Any resources needed to repay the debt associated with capital assets must be provided from sources other than the capital assets themselves since the capital assets cannot be liquidated to pay the related liabilities. In recent years, the County has benefited from Special Purpose Local Option Sales Tax referendums to fund many of its capital assets. Restricted net position (17.26%) represents resources that are subject to external restrictions on use. A significant portion of the County’s restricted net position relates to funds restricted by law for the construction of certain capital projects as authorized by public referendum. The remaining category, unrestricted net position (2.47%), may be used to meet the County’s ongoing obligations to citizens and creditors. Internally imposed designations of resources are not presented as restricted net position. At the end of the current fiscal year, the County reports positive balances in all three categories of net position for the government as a whole. Total net position increased by approximately $4.47 million over the prior year. Net investment in capital assets increased $6.26 million during the period to a total of $873,841,010. Restricted net position decreased by $1.3 million to a year-end balance of $187,833,043. Unrestricted net position increased by $12 million and totaled $26.86 million at year end. Governmental Activities – Adjusting for the restatement of beginning net position for GASB 68 governmental activities increased the County’s net position by $5.3 million. Key components of the increase were:

C-6
• Total governmental revenue was $278.7 million which is a decrease from prior year
amounts by $5.2 million. The decrease in revenues can be attributed to a decrease in capital grants, which decreased $7.1 million. Property taxes also had a decrease of $2.9 million due to a one time re-purposing of sales taxes to lower the millage rate. Local option sales taxes increased $1.36 million; Special purpose local option sales taxes increased $4.58 million; other taxes increased $.78 million; and miscellaneous income decreased $2.4 million.
• As a percentage of total County revenues from governmental activities, tax revenue was 87.8% and program revenues were 12.2%. Charges for various goods and services made up 8.25% of the total governmental revenue and unrestricted investment earnings represented .22%.
• Total governmental expenses increased $1.85 million to $272,078,926. The County’s expenses cover a range of services. Public safety expenses, the largest category of expenses, were $90.75 million, an increase of $367,991 over prior year expense levels. Public Works expenses were $74.7 million, a decrease of $1.8 million due to decreased activity in the capital projects funds. General government expenses totaled over $44.7 million, an increase over the prior year by $3.8 million. Total excess revenues over expenses before transfers amounted to $6.6 million. Including transfers out to other funds of $1.3 million, the total increase in net position was $5.3 million. Total ending net position was $1,072,423,495, which takes into account a net pension liability of $46.41 million.
Business-type Activities – Adjusting for the removal of Chatham Area Transit Authority as a blended component unit and for the restatement of beginning net position for GASB 68, net position for business-type activities decreased $836,412 for the fiscal year ended June 30, 2015. Prior to transfers in of $1.3 million, business-type activities experienced revenue deficiency of $2.16 million. Key factors within the business-type activities included:
• Net position of the solid waste facilities increased $60,734 from prior year to end with a balance of $7,268,747, which takes into account a net pension liability of $411,339. This increase is due to increased revenue in the solid waste fund from title ad valorem tax.
• Net position of the Water and Sewer fund decreased $783,074, which includes bad debt expense of $157,000 and system repairs of $210,960. Net position of the Building Safety and Regulatory Services increased $19,651 and the Parking Garage Fund had a net position decrease of $133,723. The net pension liability for other enterprise funds was $466,974.

C-7
The following table presents a comparative summary of the changes in net position for the past two fiscal years:
2015 2014 2015 2014 2015 2014Revenues:
Program Revenues:Charges for Services 22,879,528$ 22,489,822$ 5,372,135$ 5,473,801$ 28,251,663$ 27,963,623$ Operating grants and contributions 7,193,606 6,228,108 7,193,606 6,228,108 Capital grants and contributions 4,042,713 10,892,860 4,042,713 10,892,860
General Revenues: - - Property Taxes 149,024,634 152,267,395 584,193 149,608,827 152,267,395 Sales and Use Taxes 82,261,908 76,320,453 82,261,908 76,320,453 Other taxes 12,138,748 12,580,176 12,138,748 12,580,176 Unrestricted investment earnings 611,244 127,667 14,306 14,316 625,550 141,983 Miscellaneous 557,889 2,973,993 42,167 135,777 600,056 3,109,770
Total Revenues 278,710,270$ 283,880,474$ 6,012,801$ 5,623,894$ 284,723,071$ 289,504,368$
Expenses:General Government 44,742,008$ 40,945,542$ 44,742,008$ 40,945,542$ Judiciary 34,014,080 34,250,520 34,014,080 34,250,520 Public Safety 90,749,438 90,381,447 90,749,438 90,381,447 Public Works 74,736,144 76,564,482 74,736,144 76,564,482 Health and Welfare 10,992,259 11,817,249 10,992,259 11,817,249 Culture and Recreation 12,760,485 12,427,844 12,760,485 12,427,844 Houseing and Development 3,080,182 2,840,861 3,080,182 2,840,861 Interest on Long term debt 1,004,330 997,546 1,004,330 997,546 Environmental Services - Solid Waste 3,612,473 3,269,247 3,612,473 3,269,247 Other Services - Water and Sewer 2,809,031 2,329,631 2,809,031 2,329,631 Other Services - Parking 450,180 481,516 450,180 481,516 Other Services - Building Safety & Reg Svc 1,303,518 1,177,062 1,303,518 1,177,062
Total Expenses 272,078,926$ 270,225,491$ 8,175,202$ 7,257,456$ 280,254,128$ 277,482,947$
Excess (deficiency) before transfers 6,631,344 13,654,983 (2,162,401) (1,633,562) 4,468,943 12,021,421 Transfers (1,325,989) (3,707,861) 1,325,989 1,239,273 - (2,468,588)
Total Transfers (1,325,989) (3,707,861) 1,325,989 1,239,273 - (2,468,588) Change in Net Position 5,305,355 9,947,122 (836,412) (394,289) 4,468,943 9,552,833 Net Position - Beginning 1,067,118,140 1,057,171,018 16,949,690 17,343,979 1,084,067,830 1,074,514,997 Net Position - Ending 1,072,423,495$ 1,067,118,140$ * 16,113,278$ 16,949,690$ * 1,088,536,773$ 1,084,067,830$
* Prior year numbers as restated for GASB 68 and for the removal of Chatham Area Transit Authority as a blended component unit in the Business Type Activities.
Governmental Activities Business-type Activities Total
Chatham County's Changes in Net Position
Financial Analysis of Chatham County’s Funds As noted earlier, the County uses fund accounting to ensure and demonstrate compliance with finance-related legal requirements. Governmental Funds: Governmental funds provide information on near-term inflows, outflows, and balances of spendable resources. Such information is useful in assessing Chatham County’s financing requirements. In particular, unrestricted fund balance may serve as a useful measure of the County’s net resources available for spending at the end of the fiscal year. As of June 30, 2015, the County’s governmental funds reported combined ending fund balances of $267,966,573, an increase of $16.1 million in comparison to the previous year. Approximately 69% of the fund balance or $184,949,935 is classified as restricted, most of which represents funding for capital projects in the County’s special purpose local option sales tax funds which use a legally restricted revenue source for capital project funding. The remaining fund balance classifications are $540,898 non-spendable and $82,475,740 unrestricted. Of the unrestricted portions of fund balance, 64.94% is committed, 33.55% assigned and 1.51% unassigned. Since there were no deficit fund balances in the governmental funds, all of the unassigned fund balance is held in the General Fund. The General Fund is the chief operating fund of the County. At the end of the current fiscal year, the General Fund’s total fund balance was $44.4 million, an increase of $5.1 million from 2014.

C-8
Most of the balance (98.83%) was classified as unrestricted. The County’s General Fund at the end of fiscal year 2015 had no assignment of fund balance. The County’s General Fund has exceeded the Board of Commissioner’s adopted policy goal of achieving a committed reserve fund balance of two month’s expenditures. These funds are shown as committed fund balance of $42.6 million. Unassigned fund balance decreased $10.1 million from its prior year level of $11.3 million to $1.2 million at year end due to increase in the emergency reserve from two months of operating expenditures to three months operating expenditures. Financial policies indicate that these unassigned funds could be appropriated for non-recurring/one-time expenditures such as capital funding. As a measure of the General Fund’s liquidity, it may be useful to calculate the ratio of both unrestricted fund balance and total fund balance to total fund expenditures. Unrestricted fund balance represents 27.74% of fiscal 2015 fund expenditures (excluding transfers out), and total fund balance represents 28.07% of that same amount. Key differences between 2014 and 2015 in the general fund include:
• A referendum was passed to re-purpose special purpose local option sales taxes (SPLOST) as a reduction in the millage rate. The millage rate reduction was the equivalent to $4 million reduction in tax revenue. However, a transfer from the SPLOST IV fund in the amount of $4 million was made to the general fund to replace the lost tax revenue. This resulted in a net transfer reduction of $6 million.
• Underspending of department budgets of $7.1 million. • The fund transferred out over $9.6 million to other County funds during the year. The
General Fund transferred over $3.1 million to the Capital Improvement Fund, $4 million to the Risk Management Fund, $1.1 million to the Solid Waste Fund and $2 million to debt service to retire debt.
Special revenue funds are used to account for specific revenue sources and expenditures. The County reports the Special Service District Fund (SSD) as a major fund. The SSD Fund reports the operations and activities of Chatham County’s unincorporated area which is subject to a special tax levy. Total fund balance of the SSD Fund was $8.85 million, an increase of $1.28 million from the prior year’s fund balance. 100% of the fund balance is classified as unrestricted. An analysis of the SSD Fund reveals the following factors:
• Revenues and transfers in were $30.38 million, a slight decrease over FY 2014 revenues and transfers in.
• Underspending of departmental budgets of $2 million including, $500,000 million in salary savings on vacant positions, $700,000 in reduced intergovernmental spending and unused contingencies of $228,000.
• $898,548 more revenue than budgeted.
Capital Projects Funds: There are six capital project funds presented as major funds in this report. All of the major capital project funds were the result of voter-approved referendums, the most recent being a referendum held in September 2014 that led to the creation of the Sales Tax VI Capital Project Fund. The September 2014 referendum authorized the imposition and collection of a 1% special purpose local option sales tax beginning October 2014 and ending September 30, 2020. Tax collections will be used for various defined capital projects, and will also provide percentage distributions to municipalities for their stated capital projects.

C-9
Revenues in special purpose local option sales tax funds increased $3 million at the fund level from 2014 all primarily due to additional tax revenue. Capital outlay expenditures in the major funds decreased by over $10.2 million largely as a result of completion of projects. Capital projects in the sales tax funds often take several years to complete and involve a variety of phases so that expenditures in these funds may, by their nature, vary widely from year to year. Schedules detailing SPLOST project expenditures are located in the state mandated section of this report. General Fund Budgetary Highlights Budget to actual schedules are provided in the required supplementary information other than MD&A for the General Fund and the Special Service District fund. Individual columns are provided for both the adopted and amended budgets. A column for actual expenditures and a column for differences between final budget and actual expenditures follow these columns. These schedules can be found beginning on page E-1. Throughout the year Board approval is obtained for any budget adjustments at the department level as well as any adjustments to salaries and wages within the department. During the year the general fund budget increased $9.9 million. Significant budget adjustments made during the year included:
• Increase of $1.97 million for 2014 encumbrances. • Increase of $2.3 million to transfer to capital projects fund for projects. • Increase of $2.3 million to transfer to risk management fund for payment of claims. • Increase of $2.3 million to transfer to debt service fund to pay off outstanding debt.
Significant variances between the final budget and actual amounts are discussed herein:
• For fiscal 2015 there was an unfavorable variance in the General Fund between revenue budgets and actual revenues of $566,074.
• Within the Property taxes category, the General Fund recognized digest-based property tax revenue of $129.9 million for 2015, which resulted in a negative variance of $3.67 million. Local option sales tax had a positive variance of $925,903 and charges for services had a positive variance of $777,864.
• Commissions for collection of property taxes exceeded budget by $514,501. • Investment income exceeded budget $393,846. • Departmental savings produced a positive appropriations variance for the General Fund
of $7.7 million. No departments exceeded their 2015 budget appropriation. Outstanding encumbrances are not included in the budget variances shown.
• Salary savings on vacancies are budgeted as a negative expenditure, however, actual salary savings are recognized in the individual department budgets. Actual salaries were under budget by $1.6 million.
Capital Asset and Debt Administration Capital Assets - At the conclusion of 2015, the County had invested roughly $896 million in a broad range of capital assets including land, buildings, infrastructure, system improvements, machinery, equipment, parks, roads, bridges, major drainage structures and intangible assets.

C-10
Investment in capital assets, net of depreciation, decreased overall by $10.4 million. The County’s financial statements present capital assets in two groups: those assets subject to depreciation such as equipment and operational facilities, and those assets not subject to depreciation such as land, right of ways and construction-in-progress. Significant expenditures on capital assets and infrastructure improvements for fiscal year 2015 included:
• $2 million for other County roads • $1.5 million for the Bay Street Widening • $1.8 million for the library • $1 million for the Chatham Area Transit • 1.8 million for Dean Forest Road Widening • $3 million for Turners Creek
The County continues to expend funds as authorized by referendum for capital projects in the Sales Tax I, Sales Tax II, Sales Tax III, Sales Tax IV, Sales Tax V and Sales Tax VI funds. At year end the County had outstanding construction commitments of $16.7 million. Most of the financing for these construction commitments (76%) will be from special purpose local option sales tax collections. A summary of the County’s capital assets is shown below:
2015 2014 2015 2014 2015 2014
Land $ 46,685,613 $ 46,657,468 $ 1,931,687 $ 1,931,687 $ 48,617,300 $ 53,398,029Right of Ways 339,876,971 340,259,516 - - 339,876,971 340,158,506Construction-in-progress 12,815,014 11,298,199 - 207,077 12,815,014 107,337,812Buildings and improvements 223,670,853 234,293,277 1,002,640 1,144,105 224,673,493 178,302,771Machinery and Equipment 11,706,086 11,409,170 1,768,979 911,185 13,475,065 32,366,130Plant - 3,539,451 3,499,256 3,539,451 3,962,213Infrastructure 248,871,757 253,414,954 - 248,871,757 241,574,069Intangible assets 4,243,108 1,528,067 - 4,243,108 1,559,458Total $ 887,869,402 $ 898,860,651 * $ 8,242,757 $ 7,693,310 * $ 896,112,159 $ 958,658,988 *
* Prior year numbers as restated for the removal of Chatham Area
Transit Authority as a blended component unit in the Business Type Activities.
Capital Assets at Year-endNet of Depreciation
Governmental Activities Business-type Activities Total
Additional information on the County’s capital assets can be found in Note III.C on page D-29. Debt – The County’s long-term debt at June 30, 2015 totaled $21,372,423, a decrease of $1,166,683 from 2014. Debt service payments for all of the County’s obligations were made in accordance with contractual agreements. Net Pension Liability - The County’s proportionate share of the net pension liability as of June 30, 2015 was $47,285,732, which was included as a non- current liability in the entity wide statements.

C-11
Net OPEB Obligation – The County’s Net OPEB obligation increased $4.6 million from the prior year. The County is partially funding its annual OPEB obligation through a combination of pay-as-you-go and pre-funding of its obligations. In the most recent valuation, the County’s actuary increased the annual employer contribution based on recent experiences and medical trends. The Net OPEB obligation is shown as a noncurrent liability on the government-wide financial statements. Additional information on Chatham County’s long-term obligations can be found in Note III.G. Currently Known Facts, Decisions, or Conditions Currently known facts, decisions or conditions that are expected to have a significant effect on the financial position (net position) or results of Chatham County’s operations (revenues, expenses and other changes in nets assets) include:
• The County’s Capital Improvement Program contains a number of unfunded projects, many of which are maintenance projects. As operating budgets continue to tighten, the County will be challenged to find additional dollars for maintenance and capital needs.
• The Adopted 2015 budget included employer contributions of $2,800 per active employee for pre-funding of retirement health care. Due to budgetary constraints, the County was not able to increase the per-employee rate from 2010 levels. In addition the County’s OPEB Trust fund also has budgeted $4 million for pay-as-you-go retiree health claims. To offset future benefit costs, the County will continue to increase funding for the OPEB Trust Fund to manage other post-employment benefit costs.
• The sale of the Chatham Water and Sewer operation will be effective during FY 2016. Ownership of the sewer system is not included in the sale, but will be managed by Chatham Water Company. It is anticipated that many large repairs and improvements will be made over the next year
Requests for Information This financial report is designed to provide a general overview of the County’s finances. Questions concerning any of the information provided in this report or requests for additional financial information may be addressed to the Chatham County Finance Director, Chatham County, Georgia, P.O. Box 9297, Savannah, Georgia 31412.


GOVERNMENT-WIDE FINANCIAL STATEMENTS


CHATHAM COUNTY, GEORGIA STATEMENT OF NET POSITION
FOR THE YEAR ENDED JUNE 30, 2015
The notes to the basic financial statements are an integral part of this statement. D-1
Primary Government
Governmental Activities
Business-type Activities Total
ASSETS AND DEFERRED
OUTFLOWS OF RESOURCES
Cash and investments 292,200,166$ 7,350,405$ 299,550,571$ 9,600,588$
Receivables 25,900,479 660,654 26,561,133 6,920,664
Prepaid items 573,299 - 573,299 344,002
Inventories 103,304 - 103,304 229,427
Other - - - 70,529
Restricted cash and investments 123,288 5,241,478 5,364,766 -
Capital assets:Land, improvements, and
construction in progress 399,377,598 1,931,688 401,309,286 8,099,574
Other capital assets,
net of depreciation 488,491,802 6,311,071 494,802,873 66,253,560
Total assets 1,206,769,936 21,495,296 1,228,265,232 91,518,344
Deferred outflows of resources
Related to pensions 7,234,694 138,457 7,373,151 2,028,917
TOTAL ASSETS AND DEFERRED
OUTFLOWS OF RESOURCES 1,214,004,630 21,633,753 1,235,638,383 93,547,261
LIABILITIES AND DEFERRED
INFLOW OF RESOURCES
Accounts payable 20,617,139 380,797 20,997,936 2,547,663
Other liabilities 1,751,324 344,419 2,095,743 3,484,687
Accrued interest 271,259 - 271,259 -
Noncurrent liabilities:Due within one year 4,063,214 152,064 4,215,278 1,762,187
Due in more than one year 35,380,123 2,685,525 38,065,648 4,166,381
Net pension liabillity 46,407,419 878,313 47,285,732 13,798,544
Net OPEB Obligation 30,985,294 1,044,064 32,029,358 277,454
Total liabilities 139,475,772 5,485,182 144,960,954 26,036,916
Deferred inflows of resources
Related to pensions 1,851,582 35,293 1,886,875 3,856,815
Unearned revenue 253,781 - 253,781 -
Total deferred inflows of
resources 2,105,363 35,293 2,140,656 3,856,815
TOTAL LIABILITIES AND
DEFERRED INFLOW
OF RESOURCES 141,581,135 5,520,475 147,101,610 29,893,731
NET POSITIONNet investment in
capital assets 864,460,707 8,242,759 872,703,466 73,778,535
Restricted for:Capital projects 181,529,967 - 181,529,967 384,895 Public safety 2,456,910 - 2,456,910 - Judiciary programs 1,453,176 1,453,176 - Solid waste management activities - 2,392,990 2,392,990 - Other purposes - - - 3,413,179
Unrestricted 22,522,735 5,477,529 28,000,264 (13,923,079)
Total net position 1,072,423,495$ 16,113,278$ 1,088,536,773$ 63,653,530$
Discretely Presented
Component Units

CHATHAM COUNTY, GEORGIA STATEMENT OF ACTIVITIES
FOR THE YEAR ENDED JUNE 30, 2015
The notes to the basic financial statements are an integral part of this statement. D-2
Program Revenues
Functions/Programs ExpensesCharges for
Services
Operating Grants and
Contributions
Capital Grants and
Contributions
Primary government:
Governmental Activities:
General Government 44,742,008$ 8,011,193$ 372,291$ -$
Judiciary 34,014,080 6,696,584 3,037,876 -
Public Safety 90,749,438 5,722,415 3,699,020 52,903
Public Works 74,736,144 932,024 33,476 3,989,810
Health and Welfare 10,992,259 27,921 - -
Culture and Recreation 12,760,485 766,623 50,943 -
Housing and Development 3,080,182 722,768 - -
Interest on Long-term debt 1,004,330 - - -
Total governmental activities 272,078,926 22,879,528 7,193,606 4,042,713
Business-type activities:
Environmental services - Solid waste 3,612,473 1,980,457 - -
Other services:
Water and Sewer 2,809,031 1,999,526 - -
Parking 450,180 435,274 - -
Building Safety and Regulatory Services 1,303,518 956,878 - -
Total business-type activities 8,175,202 5,372,135 - - Total primary government 280,254,128$ 28,251,663$ 7,193,606$ 4,042,713$
Component Units:
Chatham Area Transit Authority 23,761,843$ 5,051,568$ 6,135,046$ 5,559,426$
Chatham County Board of Health 12,585,172 2,943,491 10,134,224 -
Live Oak Public Libraries 10,848,027 270,194 1,102,720 -
Total component units 47,195,042$ 8,265,253$ 17,371,990$ 5,559,426$
General revenues:
Taxes:
Property taxes, levied for general purposes
Property taxes, levied for unincorporated area
Property taxes, levied for transportation purposes
Sales taxes for general purposes
Special purpose local option sales taxes
Other taxes
Allotments for participating governments
Grants and contributions not restricted to specific programs
Unrestricted investment earnings
Miscellaneous
Transfers
Total general revenues and transfers
Change in net position
Net position - beginning as restatedNet position - ending

D-3
Governmental Activities
Business-type Activities Total
(36,358,524)$ (36,358,524)$
(24,279,620) (24,279,620)
(81,275,100) (81,275,100)
(69,780,834) (69,780,834)
(10,964,338) (10,964,338)
(11,942,919) (11,942,919)
(2,357,414) (2,357,414)
(1,004,330) (1,004,330)
(237,963,079) (237,963,079)
- (1,632,016) (1,632,016)
- (809,505) (809,505)
- (14,906) (14,906)
- (346,640) (346,640)
- (2,803,067) (2,803,067) (237,963,079) (2,803,067) (240,766,146)
(7,015,803)$
492,543
(9,475,113)
(15,998,373)
130,399,687 - 130,399,687 -
18,624,947 - 18,624,947 -
- 584,193 584,193 8,787,231
15,375,903 - 15,375,903 -
66,886,005 - 66,886,005 -
12,138,748 - 12,138,748 -
- - - 8,068,596
- - - 8,899,766
557,889 14,306 572,195 1,469
611,244 42,167 653,411 900,876
(1,325,989) 1,325,989 - -
243,268,434 1,966,655 245,235,089 26,657,938
5,305,355 (836,412) 4,468,943 10,659,565
1,067,118,140 16,949,690 1,084,067,830 52,993,965 1,072,423,495$ 16,113,278$ 1,088,536,773$ 63,653,530$
Net (Expense) Revenue and Changes in Net Position
Discretely Presented
Component Units
Primary Government


FUND FINANCIAL STATEMENTS

CHATHAM COUNTY, GEORGIA GOVERNMENTAL FUNDS
BALANCE SHEET JUNE 30, 2015
The notes to the basic financial statements are an integral part of this statement. D-4
General FundSpecial Service
District Sales Tax I Sales Tax II
ASSETSCash and investments 45,440,226$ 12,278,738$ 11,679,315$ 4,930,032$ Receivables 12,010,871 2,330,892 - 178,752 Due from other funds 1,028,863 - - - Inventories 103,304 - - - Prepaid items 397,760 39,833 - - Restricted cash 16,238 - - -
Total assets 58,997,262$ 14,649,463$ 11,679,315$ 5,108,784$
LIABILITIES, DEFERRED INFLOWS OF RESOURCESAND FUND BALANCES
Liabilities:Accounts payable 4,341,975$ 4,744,445$ 123,624$ 32,786$ Due to other funds - - - - Other payables 1,609,296 106,085 - -
Total liabilities 5,951,271 4,850,530 123,624 32,786
Deferred inflows of resources:Unavailable property taxes 8,571,441 917,918 - - Unavailable revenue 73,449 27,430 - 118,889
Total deferred inflows of resources 8,644,890 945,348 - 118,889
Total liabilities and deferred inflows of resources 14,596,161 5,795,878 123,624 151,675
Fund balances:Nonspendable 501,065 39,833 - - Restricted 16,238 - 11,555,691 4,957,109 Committed 42,637,808 7,621,172 - - Assigned for:
Purposes of fund - 1,192,580 - - Unassigned 1,245,990 - - -
Total fund balances 44,401,101 8,853,585 11,555,691 4,957,109 Total liabilities, deferred inflows of resources
and fund balances 58,997,262$ 14,649,463$ 11,679,315$ 5,108,784$

D-5
Sales Tax III Sales Tax IV Sales Tax V Sales Tax VI
Other Governmental
Funds Total
33,635,762$ 36,769,024$ 71,812,360$ 20,377,265$ 36,003,983$ 272,926,705$ 2,586,149 365,550 - 5,924,184 2,273,604 25,670,002
- - - - - 1,028,863 - - - - - 103,304 - - - - - 437,593 - - - - 107,050 123,288
36,221,911$ 37,134,574$ 71,812,360$ 26,301,449$ 38,384,637$ 300,289,755$
86,498$ 69,343$ 421,308$ 3,605,440$ 3,412,023$ 16,837,442$ - - - - 1,028,863 1,028,863
3,459 9,952 12,102 - 10,430 1,751,324 89,957 79,295 433,410 3,605,440 4,451,316 19,617,629
- - - - - 9,489,359 2,586,149 336,400 - - 73,877 3,216,194
2,586,149 336,400 - - 73,877 12,705,553
2,676,106 415,695 433,410 3,605,440 4,525,193 32,323,182
- - - - - 540,898 33,545,805 36,718,879 71,378,950 22,696,009 4,081,254 184,949,935
- - - - 3,299,777 53,558,757
- - - - 26,478,413 27,670,993 - - - - - 1,245,990
33,545,805 36,718,879 71,378,950 22,696,009 33,859,444 267,966,573
36,221,911$ 37,134,574$ 71,812,360$ 26,301,449$ 38,384,637$ 300,289,755$

CHATHAM COUNTY, GEORGIA GOVERNMENTAL FUNDS
RECONCILIATION OF TOTAL GOVERNMENTAL FUND BALANCES TO NET POSITION OF GOVERNMENTAL ACTIVITIES
JUNE 30, 2015
The notes to the basic financial statements are an integral part of this statement. D-6
Total fund balances, governmental funds 267,966,573$
Amounts reported for governmental activities in the Statement of Net Position are different because:
Capital assets used in governmental activities are not current financial resources and therefore are not reported in this fund financial statement, but are reported in the governmental activities of the Statement of Net Position 887,869,400
Other long-term assets are not available to pay for current-period expenditures and therefore are deferred in the funds. 12,451,772
Deferrred outflows and inflows of resources related to pensions are applicable to future periods and, therefore, are not reported in the governmental fund financial statements. 5,371,560
Some liabilities, (such as Notes Payable, Capital Lease Contract Payable, Long-term Compensated Absences, and Bonds Payable), are not due and payable in the current period and are not included in the fund financial statement, but are included in the governmental activities of the Statement of Net Position:
Capital leases $ (4,301,351)Contractual Obligations (21,435,410)Pollution Control Facilities (29,934)Compensated Absences (11,287,712)Claims and Judgements (2,388,930) (39,443,337)
Net pension liability is not due and payable in the current period and, therefore, is not reported in the fund financial statements (46,309,068)
Net OPEB liability not reported in fund statements (30,985,294)
Interest payable on long-term obligations is not due and payable in the current period and therefore is not reported in the governmental funds. (271,259)
Internal service funds are used by management to charge the cost of certain activities such as insurance to individual funds. The assets and liabilities of the internal service funds are included in governmental activities in the statement of net position. 15,773,148
Net Position of Governmental Activities in the Statement of Net Position 1,072,423,495$


CHATHAM COUNTY, GEORGIA GOVERNMENTAL FUNDS
STATEMENT OF REVENUES, EXPENDITURES, AND CHANGES IN FUND BALANCES
FOR THE YEAR ENDED JUNE 30, 2015
The notes to the basic financial statements are an integral part of this statement. D-7
General FundSpecial Service
District Sales Tax I Sales Tax II
REVENUESProperty taxes 129,897,129$ 18,646,807$ -$ -$ Local option sales tax 15,375,903 - - - Other taxes 2,156,792 8,307,620 - - Penalties and interest 1,301,052 220,863 - - Licenses and permits 912,612 - - - Intergovernmental 2,579,968 680,712 151,823 312,436 Charges for services 11,486,732 263,394 - - Fees and fines 3,114,571 1,382,185 - - Investment income 523,846 11,744 38,831 5,360 Other revenue 983,833 76,332 - -
Total revenues 168,332,438 29,589,657 190,654 317,796
EXPENDITURESCurrent:
General government 38,842,382 2,316,188 - - Judiciary 29,499,732 2,073,707 - - Public safety 63,924,812 14,419,400 - - Public works 1,009,001 7,621,082 - - Health and welfare 10,264,179 - - - Culture and recreation 11,692,164 - - - Housing and development 658,985 1,240,734 - -
Debt service:Principal 1,466,661 - - - Interest and other charges 823,260 - - -
Capital outlay - - 2,231,209 424,155 Intergovernmental - - - -
Total expenditures 158,181,176 27,671,111 2,231,209 424,155 Excess (deficiency) of revenuesover (under) expenditures 10,151,262 1,918,546 (2,040,555) (106,359)
OTHER FINANCING SOURCES (USES)Proceeds from long-term debt, net - - - - Premium on bond issuanceIssurance of capital leases - - - - Issuance of bonds - - - - Payment to refunded bond escrow agent - - - - Sale of capital assets - - - - Transfers in 4,620,903 791,215 - - Transfers out (9,651,228) (1,433,276) - -
Total other financing sources (uses) (5,030,325) (642,061) - - Net change in fund balances 5,120,937 1,276,485 (2,040,555) (106,359)
Fund balances - beginning 39,280,164 7,577,100 13,596,246 5,063,468 Fund balances - ending 44,401,101$ 8,853,585$ 11,555,691$ 4,957,109$

D-8
Sales Tax III Sales Tax IV Sales Tax V Sales Tax VI
Other Governmental
Funds Total
-$ -$ -$ -$ -$ 148,543,936$ - - - - - 15,375,903 - - 17,126,942 50,618,272 1,582,429 79,792,055 - - - - - 1,521,915 - - - - 722,768 1,635,380
2,394,518 254,369 658,925 - 5,506,045 12,538,796 - - - - 4,271,039 16,021,165 - - - - 1,176,567 5,673,323
193,047 403,391 694,288 19,566 15,594 1,905,667 2,142 7,362 0 0 2,159,657 3,229,326
2,589,707 665,122 18,480,155 50,637,838 15,434,099 286,237,466
- - - - 237,159 41,395,729 - - - - 2,429,303 34,002,742 - - - - 7,954,913 86,299,125 - - - - 546,102 9,176,185 - - - - - 10,264,179 - - - - 10,627 11,702,791 - - - - 1,246,940 3,146,659
- - - - - 1,466,661 - - - - 309,738 1,132,998
2,762,443 6,337,507 13,743,241 71,478 4,565,770 30,135,803 - - 12,490,193 27,870,351 - 40,360,544
2,762,443 6,337,507 26,233,434 27,941,829 17,300,552 269,083,416
(172,736) (5,672,385) (7,753,279) 22,696,009 (1,866,453) 17,154,050
- - - - - -
- - - - 4,301,351 4,301,351 - - - - 9,840,000 9,840,000 - - (9,550,000) (9,550,000) - - - - - - - - - - 5,744,052 11,156,170 - (4,000,000) - - (1,672,655) (16,757,159) - (4,000,000) - - 8,662,748 (1,009,638)
(172,736) (9,672,385) (7,753,279) 22,696,009 6,796,295 16,144,412 33,718,541 46,391,264 79,132,229 - 27,063,149 251,822,161 33,545,805$ 36,718,879$ 71,378,950$ 22,696,009$ 33,859,444$ 267,966,573$

CHATHAM COUNTY, GEORGIA RECONCILIATION OF THE STATEMENT OF REVENUES,
EXPENDITURES, AND CHANGES IN FUND BALANCES OF GOVERNMENTAL FUNDS TO THE STATEMENT OF ACTIVITIES
FOR THE YEAR ENDED JUNE 30, 2015
The notes to the basic financial statements are an integral part of this statement. D-9
Net change in fund balances - total governmental funds: 16,144,412$
Amounts reported for Governmental Activities in the Statement of Activities are different because:
Governmental funds report outlays for capital assets as expenditures because such outlays use current financial resources. In contrast, the Statement of Activities reports only a portion of the outlay as expense. The outlay is allocated over the assets' estimated useful lives as depreciation expense for the period.This is the amount by which capital outlays $16,726,172 is less than depreciation $24,079,002 in the current period.
The net effect of various miscellaneous transactions involving capital assets is to increase net position. The County received $145,301 in capital contributions and recorded ($3,783,722) related to disposals. (3,638,421)
Governmental funds do not present revenues that are not available to pay current obligations. In contrast, such revenues are reported in the Statement of Activities when earned.
Deferred inflows of resources (1,736,869)
Governmental funds report debt proceeds as current financial resources. In contrast, the Statement of Activities treats such issuance of debt as a liability. Governmental funds report repayment of debt principal as an expenditure, In contrast, the Statement of Activities treats such repayments as a reduction in long-term liabilities. This is the amount by which payments exceeded proceeds. (3,124,690)
Governmental funds report the effect of bond issuance costs and discounts when debt is first issued, whereas these amounts are deferred and amortized in the statement of activities. Interest is recognized as an expenditure in the governmental funds when it is due. In the statement of activities, interest expense is recognized as it accrues, regardless of when it is due. The net effect of these differences follows:
Amortization of bond discounts/premiums $ 20,605 Interest expense - debt obligations 108,064 128,669
Some expenses reported in the statement of activities do not require the use of current financial resources and therefore are not reported as expenditures in governmental funds:
Compensated absences $ 520,566 Claims and judgements (1,703,930) (1,183,364)
In the statement of activities, pension expense represents the change in net pension liability from the beginning of the year to the end of the year. In the governmental funds, however, pension expense is measured by the amount of finanical resources used (amount actually paid). This is the amount by which pension contributions paid in the current period exceeded the change in net pension liability 5,008,084
The current year's increase in the net OPEB liability creates a balance sheet item while increasing net expenses of the functions on the governmentwide statements (4,500,021)
Internal service funds are used by management to charge the costs of certain activities such as insurance to individual funds. The net revenue (expense) of the internal service funds is reported with governmental activities. 5,560,385
Change in net position of governmental activities 5,305,355$
(7,352,830)

CHATHAM COUNTY, GEORGIA PROPRIETARY FUNDS
STATEMENT OF FUND NET POSITION JUNE 30, 2015
The notes to the basic financial statements are an integral part of this statement. D-10
Governmental
Business-type Activities - Enterprise Funds Activities
Solid Waste Fund
Other Enterprise
Funds TotalInternal Service
Funds
ASSETS AND DEFERRED OUTFLOWS
OF RESOURCES
Current assets:
Cash and investments 3,027,728$ 4,322,677$ 7,350,405$ 19,273,461$
Receivables 80,693 579,961 660,654 230,477
Prepaid Expenses - - - 135,706
Restricted cash - 301,829 301,829 -
Total current assets 3,108,421 5,204,467 8,312,888 19,639,644
Non-current assets:
Restricted cash 4,939,649 - 4,939,649 -
Capital assets,
net of accumulated depreciation 2,826,344 5,416,415 8,242,759 -
Total non-current assets 7,765,993 5,416,415 13,182,408 -
Total assets 10,874,414 10,620,882 21,495,296 19,639,644
Deferred outflows of resources
Related to pensions 64,843 73,614 138,457 15,504
Total assets and deferred
outflows of resources 10,939,257 10,694,496 21,633,753 19,655,148
LIABILITIES AND DEFERRED INFLOWS
OF RESOURCES
Current Liabilities:
Accounts payable 63,194 317,603 380,797 618,551
Payable from restricted assets - 301,829 301,829 -
Other accrued expenses 18,265 24,325 42,590 3,825
Current portion of long-term liabilities 136,248 15,816 152,064 -
Total current liabilities 217,707 659,573 877,280 622,376
Non-current liabilities:
Due in more than one year 2,543,183 142,342 2,685,525 3,157,321
Net pension liability 411,339 466,974 878,313 98,351
Net OPEB obligation 481,752 562,312 1,044,064 -
Total non-current liabilities 3,436,274 1,171,628 4,607,902 3,255,672
Total liabilities 3,653,981 1,831,201 5,485,182 3,878,048
Deferred inflows of resources
Related to pensions 16,529 18,764 35,293 3,952
Total liabilities and deferred
inflows of resources 3,670,510 1,849,965 5,520,475 3,882,000
NET POSITION
Net investment in capital assets 2,826,344 5,416,415 8,242,759 -
Restricted for solid waste
management activites 2,392,990 - 2,392,990 -
Unrestricted 2,049,413 3,428,116 5,477,529 15,773,148
Total net position 7,268,747$ 8,844,531$ 16,113,278$ 15,773,148$

CHATHAM COUNTY, GEORGIA PROPRIETARY FUNDS
STATEMENT OF REVENUES, EXPENSES, AND CHANGES IN FUND NET POSITION
FOR THE YEAR ENDED JUNE 30, 2015
The notes to the basic financial statements are an integral part of this statement. D-11
GovernmentalBusiness-type Activities - Enterprise Funds Activities
Solid Waste Fund
Other Enterprise
Funds TotalInternal Service
Funds
OPERATING REVENUESCharges for services 1,980,457$ 3,391,678$ 5,372,135$ 24,861,164$ Miscellaneous - 23,772 23,772 -
Total operating revenues 1,980,457 3,415,450 5,395,907 24,861,164
OPERATING EXPENSESPersonal services 1,298,095 1,468,828 2,766,923 - Contractual services 1,123,355 1,568,731 2,692,086 23,582,484 Supplies 350,777 394,100 744,877 - Interdepartment charges 532,964 748,435 1,281,399 - Depreciation 307,282 382,635 689,917 -
Total operating expenses 3,612,473 4,562,729 8,175,202 23,582,484 Operating income (loss) (1,632,016) (1,147,279) (2,779,295) 1,278,680
NON-OPERATING REVENUES (EXPENSES)Other taxes 584,193 - 584,193 - Interest and investment revenue 10,464 3,842 14,306 6,705 Gain (loss) on sale of capital assets 18,395 - 18,395 -
Total non-operating revenue (expenses) 613,052 3,842 616,894 6,705
Income (loss) before contributions and transfers (1,018,964) (1,143,437) (2,162,401) 1,285,385
Transfers in 1,079,698 366,291 1,445,989 6,048,895 Transfers out - (120,000) (120,000) (1,773,895)
Change in net position 60,734 (897,146) (836,412) 5,560,385 Total net position - beginning as restated 7,208,013 9,741,677 16,949,690 10,212,763 Total net position - ending 7,268,747$ 8,844,531$ 16,113,278$ 15,773,148$

CHATHAM COUNTY, GEORGIA PROPRIETARY FUNDS
STATEMENT OF CASH FLOWS FOR THE YEAR ENDED JUNE 30, 2015
The notes to the basic financial statements are an integral part of this statement. D-12
GovernmentalBusiness-type Activities - Enterprise Funds Activities
Solid Waste Fund
Other Enterprise
Funds TotalInternal Service
Funds
Cash flows from operating activities:Other cash received 1,969,029$ -$ 1,969,029$ 2,681,808$ Cash received from customers - 3,619,057 3,619,057 - Cash received from other funds for services - - - 22,486,417 Cash payments to employees for services (1,276,601) (1,328,516) (2,605,117) -
Cash payments to suppliers for goods and services (2,165,607) (2,623,212) (4,788,819) (24,496,394) Net cash provided (used) by operating activities (1,473,179) (332,671) (1,805,850) 671,831
Cash flows from noncapital financing activities:Other taxes 584,193 - 584,193 - Transfers in 1,079,698 366,291 1,445,989 6,048,895 Transfers out - (120,000) (120,000) (1,773,895)
Net cash provided (used) by noncapital financing activities 1,663,891 246,291 1,910,182 4,275,000
Cash flows from capital and related financing activities:
Sale of capital assets 18,395 - 18,395 - Acquisitions and construction of capital assets (1,102,366) (137,000) (1,239,366) -
Net cash (used) by capital and related financing activities (1,083,971) (137,000) (1,220,971) -
Cash flows from investing activities:Interest earned on cash and investments 10,464 3,842 14,306 6,705
Net cash provided (used) by investing activities 10,464 3,842 14,306 6,705
Increase (decrease) in cash and cash equivalents (882,795) (219,538) (1,102,333) 4,953,536 Cash and cash equivalents, beginning of year 8,850,172 4,844,044 13,694,216 14,319,925 Cash and cash equivalents, end of year 7,967,377$ 4,624,506$ 12,591,883$ 19,273,461$
Reconciliation of operating income to net cash provided by (used in) operating activities:
Operating income (loss) (1,632,016)$ (1,147,279)$ (2,779,295)$ 1,278,680$ Adjustments to reconcile operating income
to net cash provided by operating activities:Depreciation 307,282 382,635 689,917 -
Change in assets and liabilities:(Increase) decrease in accounts receivables (11,428) 206,989 195,561 489,951 (Increase) decrease in prepaid items - - - 94,469 (Increase) decrease in deferred outflows (64,843) (73,614) (138,457) (15,504) Increase (decrease) in accounts/noncurrent payables (158,511) 178,239 19,728 (1,179,717) Increase (decrease) in net pension liability 2,962 3,363 6,325 - Increase (decrease) in OPEB obligations 66,846 98,232 165,078 - Increase (decrease) in deferred inflows 16,529 18,764 35,293 3,952
Total adjustments 158,837 814,608 973,445 (606,849) Net cash provided (used) by operating activities (1,473,179)$ (332,671)$ (1,805,850)$ 671,831$

CHATHAM COUNTY, GEORGIA FIDUCIARY FUNDS
STATEMENT OF FIDUCIARY NET POSITION JUNE 30, 2015
The notes to the basic financial statements are an integral part of this statement. D-13
Agency Funds
Pension (and Other Employee Benefit)
Trust FundsASSETSCash $ 46,162,530 $ 10,438,245 Receivables:
Interest and dividend - 561,766 Sale of investments - 912,524 Accounts - 80,107
Investments, at fair value:U.S. government and agency obligations - 18,892,222 Municipal bonds - 214,920 Mortgage backed securities - 4,981,136 Corporate bonds - 33,408,405 Domestic stocks - 70,022,476 Common / collective trust - 55,025,297 International equity funds - 20,443,652 Index funds - 37,865,612
Total Investments - 240,853,720 Total assets 46,162,530 252,846,362
LIABILITIES Accounts payable - 2,023,886 Due to others 46,162,530 -
Total liabilities 46,162,530$ 2,023,886
NET POSITIONRestricted for pensions 207,844,150 Restricted for OPEB 42,978,326
Total net position 250,822,476$

CHATHAM COUNTY, GEORGIA FIDUCIARY FUNDS
STATEMENT OF CHANGES IN FIDUCIARY NET POSITION FOR THE YEAR ENDED JUNE 30, 2015
The notes to the basic financial statements are an integral part of this statement. D-14
Pension (and Other Employee Benefit)
Trust FundsADDITIONSContributions:
Employer 24,023,611$ Plan members 2,815,227
Total contributions 26,838,838 Investment earnings:
Net appreciation (depreciation) in fair value of investments 4,297,559 Interest 2,605,218 Dividends 2,046,848
Total 8,949,625 Less investment expense 917,550
Net investment income 8,032,075
Total additions 34,870,913
DEDUCTIONSBenefits - Pension 13,165,951 Risk management 6,658,210 Refunds of contributions 546,320 Administrative expense 1,121,241
Total deductions 21,491,722 Change in net position 13,379,191
Net position - beginning 237,443,285 Net position - ending 250,822,476$


CHATHAM COUNTY, GEORGIA COMBINING STATEMENT OF NET POSITION
DISCRETELY PRESENTED COMPONENT UNITS FOR THE YEAR ENDED JUNE 30, 2015
D -15 The notes to the basic financial statements are an integral part of this statement
Chatham Area
Transit Authority
Chatham County Board
of Health
Live Oak Public Libraries Total
ASSETS AND DEFERRED OUTFLOWS OF RESOURCES
Cash and investments 1,185,310$ 6,737,739$ 1,677,539$ 9,600,588$
Receivables 5,544,966 1,203,987 171,711 6,920,664
Internal balances - - - -
Prepaid items 314,838 15,979 13,185 344,002
Inventories 229,427 - - 229,427
Other - 70,529 70,529
Capital assets:Land, improvements, and
construction in progress 6,286,872 - 1,812,702 8,099,574
Other capital assets,
net of depreciation 40,777,145 436,708 25,039,707 66,253,560
Total assets 54,338,558 8,394,413 28,785,373 91,518,344
Deferred outflows of resources
Related to pensions - 1,423,624 605,293 2,028,917
Total assets and deferred outflows of resources 54,338,558 9,818,037 29,390,666 93,547,261
LIABILITIES AND DEFERRED
INFLOW OF RESOURCES
Accounts payable 1,317,307 1,213,719 16,637 2,547,663
Other liabilities 3,356,846 - 127,841 3,484,687
Noncurrent liabilities:Due within one year 1,233,541 110,217 418,429 1,762,187
Due in more than one year 3,187,801 440,868 537,712 4,166,381
Proportionate share of collective net pension liability - 8,772,696 5,025,848 13,798,544
Net OPEB Obligation 277,454 - - 277,454
Total liabilities 9,372,949 10,537,500 6,126,467 26,036,916
Deferred inflows of resources
Related to pensions - 2,141,114 1,715,701 3,856,815
TOTAL LIABILITIES AND DEFERRED INFLOWS
OF RESOURCES 9,372,949 12,678,614 7,842,168 29,893,731
NET POSITIONNet investment in
capital assets 46,529,418 436,708 26,812,409 73,778,535
Restricted for:Capital projects - - 384,895 384,895 Other purposes - 2,924,997 488,182 3,413,179
Unrestricted (1,563,809) (6,222,282) (6,136,988) (13,923,079)
Total net position 44,965,609$ (2,860,577)$ 21,548,498$ 63,653,530$

CHATHAM COUNTY, GEORGIA COMBINING STATEMENT OF ACTIVITIES
DISCRETELY PRESENTED COMPONENT UNITS FOR THE YEAR ENDED JUNE 30, 2015
D -16 The notes to the basic financial statements are an integral part of this statement
Program Revenues
Functions/Programs ExpensesCharges for
Services
Operating Grants and
Contributions
Capital Grants and
Contributions
Component Units:
Chatham Area Transit Authority 23,761,843$ 5,051,568$ 6,135,046$ 5,559,426$
Chatham County Board of Health 12,585,172 2,943,491 10,134,224 -
Live Oak Public Libraries 10,848,027 270,194 1,102,720 -
Total component units 47,195,042$ 8,265,253$ 17,371,990$ 5,559,426$
General revenues:
Taxes:
Property taxes, levied for transportation purposes
Allotments for participating governments
Grants and contributions not restricted to specific programs
Unrestricted investment earnings
Miscellaneous
Total general revenues and transfers
Change in net position
Net position - beginning as restatedNet position - ending

D-17
Chatham Area Transit Authority
Chatham County Board
of HealthLive Oak Public
Libraries Total
(7,015,803)$ -$ -$ (7,015,803)$
- 492,543 492,543
- - (9,475,113) (9,475,113)
(7,015,803) 492,543 (9,475,113) (15,998,373)
8,787,231 - - 8,787,231
- - 8,068,596 8,068,596
- - 8,899,766 8,899,766
- - 1,469 1,469
13 859,296 41,567 900,876
8,787,244 859,296 17,011,398 26,657,938
1,771,441 1,351,839 7,536,285 10,659,565
43,194,168 (4,212,416) 14,012,213 52,993,965 44,965,609$ (2,860,577)$ 21,548,498$ 63,653,530$
Net (Expenses) Rvenues and Changes in Net Position


CHATHAM COUNTY, GEORGIA Notes to the Basic Financial Statements
D- 18
I. SUMMARY OF SIGNIFICANT ACCOUNTING POLICIES
The financial statements of Chatham County, Georgia are prepared in accordance with generally accepted accounting principles (GAAP). The Governmental Accounting Standards Board (GASB) is responsible for establishing GAAP for state and local governments through its pronouncements (Statements and Interpretations). The County exclusively follows the standards set forth by the GASB and has implemented accounting standards as set forth in GASB Statement Number 68. The more significant accounting policies established in GAAP and used by the County are discussed below.
A. Reporting entity
The County is a political subdivision of the State of Georgia and is governed by a nine member Board of County Commissioners. Eight members represent a geographical district within the County while the Chairman represents the County at large. There are additional officials elected countywide. State law pertaining to county government provides for the independent election of these county officials. The officials are all part of the County's legal entity. These elected officials are the Sheriff, Tax Commissioner, State Court Judges, Magistrate Court Judge, Probate Court Judge, and Superior Court Clerk. The offices of the independently elected officials are not separate from the County and therefore are reported as part of the primary government. The State constitution and State law pertaining to County government provide for the independent election of the Superior Court Judges and the District Attorney. The cost of operations of the Superior Court Judges and the District Attorney Offices is shared with the State of Georgia. Only that portion of the cost for which the County is responsible is reported in these financial statements. On January 31, 2005, the County entered into an intergovernmental agreement with the Georgia Circuit Public Defender Office of the Eastern Judicial Circuit to provide for criminal indigent defense. Under the agreement, the County reimburses the State for the salaries and operating costs for twenty-seven employees. In addition, the County supplements the salaries of the Chief Public Defender and four Level IV Public Defenders. Only the portion of the costs for which the County is responsible is reported in these financial statements.
Generally accepted accounting principles define the reporting entity and provide parameters to use in determining which potential component units should be included in a primary government’s financial statements. Inclusion is based on financial accountability or the fact that exclusion would make the financial statements misleading or incomplete. The financial reporting entity consists of (a) primary government, (b) organizations for which the primary government is financially accountable and (c) other organizations for which the nature and significance of their relationship with the primary government are such that exclusion would cause the reporting entity's financial statements to be misleading or incomplete. The nucleus of a financial reporting entity usually is a primary government; however, a governmental organization other than a primary government (such as a component unit, a joint venture, a jointly governed organization, or another stand alone government) serves as the nucleus for its own reporting entity when it issues separate financial statements. The County has met the criteria for classification as a primary government. The County has a separately elected governing body, is legally separate, and is fiscally independent of other state and local governments. All funds, organizations, institutions, agencies, departments, and officials that are not legally separate of the primary government, for financial reporting purposes, are part of the primary government and are included in the financial statements of the County.

CHATHAM COUNTY, GEORGIA Notes to the Basic Financial Statements
D- 19
1. Discretely Presented Component Units.
Chatham Area Transit Authority (Authority) - Financial information for the Authority is reported as part of the primary government as a major discretely presented component unit. The Authority’s majority governing body is appointed by the governing body of the primary government and there is a financial benefit/burden relationship between the County and the Authority. The County Commission must approve the millage rate which has significant impact on the programs and level of service provided by the Authority. Complete financial statements of the Chatham Area Transit Authority can be obtained directly from the administrative offices at Chatham Area Transit Authority, P. O. Box 9118, Savannah, Georgia 31412. Live Oak Public Libraries – The Libraries meet the requirements for inclusion as a discretely presented non major component unit; therefore, its financial information is reported together with, but separately from, the primary government in the government-wide financial statements. The County’s Board of Commissioners appoints a majority of the Libraries’ board members and provides a majority of funding for the operations of the Libraries; therefore, the Libraries are deemed to have a financial benefit/burden relationship with the County. Complete financial statements can be obtained directly from Live Oak Public Libraries, 2002 Bull Street, Savannah, Georgia 31401. Chatham County Board of Health - The Board of Health meets the requirements for inclusion as a discretely presented non major component unit under a determination made by the State of Georgia; therefore, its financial information is reported together with, but separately from, the primary government as a discretely presented component unit. The Board of Health is a legally separate entity with the County appointing a voting majority of the entity’s Board and the ability to impose its will on the Board. Complete financial statements can be obtained directly from Chatham County Board of Health, P.O. Box 14257, Savannah, Georgia 31416-1257. 2. Joint Venture Under Georgia law, the County is a member of the Coastal Regional Commission of Georgia (CRC) and is required to pay annual dues. During the year ending June 30, 2015, the County paid $87,194 in such dues. Membership in a CRC is required by the Official Code of Georgia Annotated (OCGA) Section 50-8-34 which provides for the organizational structure of the CRC in Georgia. The total council membership is 39, inclusive of 5 members from Chatham County. OCGA 50-8-39.1 provides that the member governments are liable for any debts or obligations of a CRC. Separate financial statements may be obtained from Coastal Regional Commission of Georgia, 1181 Coastal Dr. SW, Darien, Georgia 31305.
B. Government-wide and Fund Financial Statements The basic financial statements include both government-wide and fund financial statements. Government-wide statements focus on the County as a whole, and primary activities are categorized as either governmental or business-type. In the government-wide Statement of Net Position, both the governmental and business-type activities columns are presented on a consolidated basis by column, and are reflected on a full accrual, economic resource basis, incorporating long-term assets and receivables as well as long-term debt and obligations. The government-wide Statement of Activities reflects both the gross and net cost by functional category (general government, judiciary, public safety, public works, etc.). Gross expenses (including depreciation) are reduced by related program revenues, charges for services, and operating and capital grants. Program revenues are directly associated with the source function or business-type activity. Program revenues include i) charges for services, ii) operating grants and contributions, and iii) capital grants and contributions.

CHATHAM COUNTY, GEORGIA Notes to the Basic Financial Statements
D- 20
Operating grants include operating-specific and discretionary grants while the capital grants reflect capital- specific grants. Charges for services include charges to customers or applicants who purchase, use, or directly benefit from goods, services, or privileges provided by a function or segment. The net cost (by function or business-type activity) is normally covered by general revenue (property, sales and other taxes, intergovernmental revenues, investment income, etc.). While activities of discretely presented component units are reported in the County’s government-wide financial statements, separate columns are utilized so that the activities of these component units can be viewed independently from those of the primary government. The government-wide focus is more on the sustainability of the County as an entity and the change in aggregate financial position resulting from the activities of the fiscal period. In the process of aggregating data for the Statement of Net Position and the Statement of Activities, some amounts reported as interfund activity and balances in the funds are eliminated or reclassified in the government-wide financial statements. Eliminations have been made in the Statement of Activities to remove the “doubling-up” effect of internal service fund activity. Interfund services provided and used are not eliminated in the process of consolidation. Also, the County allocates indirect cost to each of its funds. The indirect costs are eliminated in the government-wide financial statements. Fund financial statements focus on individual major funds in either the governmental or business-type categories. Non-major funds (by category or fund type) are summarized into a single column. Major governmental funds in the fund financial statements are presented on a current financial resources measurement focus and modified accrual basis of accounting. This is the manner in which these funds are budgeted. This presentation is deemed most appropriate to (a) demonstrate legal and covenant compliance, (b) demonstrate the source and use of liquid resources, and (c) demonstrate how the County’s actual experience conforms to the budget or fiscal plan. Since the governmental fund statements are presented on a different measurement focus and basis of accounting than the government-wide statements, reconciliation is presented following each statement. The reconciliation briefly explains the adjustments necessary to transform the fund based financial statements into the governmental column of the government-wide presentation. Internal service funds (which traditionally provide services primarily to other funds of the government) are presented in summary form as part of proprietary fund financial statements. Since the principal users of the internal services are the County’s governmental activities, financial statements of internal service funds are consolidated into the governmental column when presented at the government-wide level. To the extent possible, the cost of these services is reflected in the appropriate functional activity (general government, judiciary, public safety, public works, etc.). The County’s fiduciary funds are presented in the fund financial statements by type (trust and agency). Since by definition these assets are being held for the benefit of a third party (other local governments, private parties, pension participants, etc.) and cannot be used to address activities or obligations of the government, these funds are not incorporated into the government-wide statements. C. Basis of Presentation
The financial transactions of the County are recorded in individual funds. Each fund is accounted for by providing a separate set of self-balancing accounts that comprises its assets, liabilities, reserves, fund equity, revenues, and expenditures/expenses. The various funds are reported by generic classification within the financial statements. Major funds are separately presented within the basic financial statements. Major funds represent the government’s most important funds and are determined based on percentages of assets, liabilities, revenues, and expenditures/expenses. Governments may also choose to report other funds as major funds if the fund is
CHATHAM COUNTY, GEORGIA Notes to the Basic Financial Statements
D- 21
particularly important to financial statement users. The non-major funds are combined in a column in the fund financial statements and detailed in the combining section. The County uses the following fund types: 1. Governmental Funds: The focus of governmental fund measurement (in the fund financial statements) is upon determination of financial position and changes in financial position (sources, uses, and balances of financial resources) rather than upon net income. The following is a description of the governmental funds of the County: a. General Fund is the general operating fund of the County. It is used to account for all financial resources except those required to be accounted for in another fund. b. Special Revenue Funds are used to account for the proceeds of specific revenue sources that are legally restricted to expenditures for specified purposes. The major fund (Special Service District) is used to account for special levy ad valorem taxes, its major revenue stream, and for other activities for the unincorporated area of the County. c. Debt Service Funds are used to account for the accumulation of funds for the periodic payment of principal and interest on governmental contractual obligations. d. Capital Projects Funds are used to account for financial resources to be used for the acquisition or construction of major capital facilities (other than those financed by Business-type/Proprietary Funds). The County displays six major funds, Sales Tax I, Sales Tax II, Sales Tax III, Sales Tax IV, Sales Tax V and Sales Tax VI. These funds account for the proceeds of a special one cent sales tax adopted by referendum and related expenditures for roads, drainage and other improvements. Although the Sales Tax I and Sales Tax II funds did not meet the fiscal criteria for a major fund in 2015, the County chose to continue their presentation as major funds due to the high level of public interest in their activities. 2. Proprietary Funds:
Proprietary Funds are reported using the economic resources measurement focus. The generally accepted accounting principles applicable are those similar to businesses in the private sector. The following is a description of the Proprietary Funds of the County: a. Enterprise Funds are required to be used to account for operations for which a fee is charged to external users for goods or services and the activity (a) is financed with debt that is solely secured by a pledge of the net revenues, (b) has third party requirements that the cost of providing services, including capital costs, be recovered with fees and charges, or (c) has a pricing policy designed for the fees and charges to recover similar costs. The major funds (Chatham Area Transit Authority and Solid Waste Management Fund) account for business-type activities for transportation services and solid waste collection and disposition. b. Internal Service Funds are used to account for the financing of goods or services provided by an activity to other departments or funds of the County on a cost-reimbursement basis. The County’s internal service funds are used to account for the financing of certain risk management services, such as health insurance claims, worker’s compensation claims, and catastrophic claims that are not covered by insurance. The County also maintains an internal service fund for computer replacement. 3. Fiduciary Funds: Fiduciary funds are used to report assets held in a trustee or agency capacity for others and therefore are not available to support County programs. The reporting focus (economic resources measurement focus) of trust

CHATHAM COUNTY, GEORGIA Notes to the Basic Financial Statements
D- 22
funds is upon net position and changes in net position. The funds employ accounting principles similar to proprietary funds. Since agency funds report only assets and liabilities, they do not have a measurement focus; however, receivable and payable balances in the agency funds are recognized on the accrual basis of accounting. Trust and agency funds are used to account for activities that are custodial in nature. The County has one pension trust fund that accounts for the retirement benefits of the County’s employees. Effective July 1, 2007, transactions related to retiree healthcare and other post-employment benefits, including activities related to the pre-funding of retiree healthcare, were recorded in the OPEB Trust Fund. There are ten agency funds, nine of which account for the receipts and disbursements of funds by the tax commissioner and various clerks of court, and the tenth is the flex benefit plan, which accounts for employee withholdings for dependent and medical care under section 125 of the IRS code. 4. Non-Current Governmental Assets/Liabilities:
Information on the County’s capital assets and long-term debt is incorporated into the Statement of Net Position and also disclosed within these notes. D. Basis of Accounting Basis of accounting refers to the point at which revenues or expenditures/expenses are recognized in the accounts and reported in the financial statements. It relates to the timing of the measurements made, regardless of the measurement focus applied. 1. Accrual: All proprietary, internal service, pension trust, and agency funds are accounted for using the accrual basis of accounting. Revenues are recognized when earned and expenses are recognized when incurred. 2. Modified Accrual: All governmental funds are accounted for using the modified accrual basis of accounting. Under the modified accrual basis of accounting, revenues are recorded when susceptible to accrual; i.e., both measurable and available. “Available” means collectible within the current period or soon enough thereafter to be used to pay liabilities of the current period, usually 60 days. Revenues considered susceptible to accrual are property taxes, charges for services, and investment income. In applying the “susceptible to accrual” concept to intergovernmental revenues, the provider should recognize liabilities and expenses and the recipient should recognize receivables and revenue when the applicable eligibility requirements, including time requirements, are met. Resources transmitted before the eligibility requirements are met should, under most circumstances, be reported as advances by the provider and a liability by the recipient. Expenditures are generally recognized under the modified accrual basis of accounting when the related liability is incurred. The exception to this general rule is that principal and interest on general obligation long-term debt is recognized when due. E. Assets, Liabilities, and Fund Equity
1. Deposits and Investments
The County has defined Cash and Cash Equivalents to include cash on hand, demand deposits, and cash with fiscal agent. Additionally, each fund’s equity in the County’s investment pool is considered to be a cash equivalent since the funds can deposit or effectively withdraw cash at any time without prior notice or penalty. Investments are stated at fair value (quoted market price or the best estimate thereof). The County operates a linked zero balance cash system with five zero balance accounts. All deposits are made in the collection account, and all disbursements are made from the accounts payable account, the jurors account, insurance account and the payroll account. The bank each day automatically moves all funds from the collection account to an interest bearing super NOW account (master funding account). The County

CHATHAM COUNTY, GEORGIA Notes to the Basic Financial Statements
D- 23
allocates investment earnings of the cash and investment pool to each participating fund on a monthly basis in accordance with the funds' average equity balance in the pool for the month. 2. Receivables In the fund financial statements, material receivables in governmental funds include revenue accruals such as property taxes, grants, and other similar intergovernmental revenues since they are usually both measurable and available. Non-exchange transactions collectible, but not available, are included in the Deferred Inflows of Resources section of the balance sheet on the fund financial statements in accordance with the modified accrual basis, but are not included on the government-wide financial statements in accordance with the accrual basis. Accounts receivable comprise the majority of proprietary fund receivables. Allowances for uncollectible accounts receivable are based upon historical trends and the periodic aging of accounts receivable. The major receivable for the County is property taxes receivable. Property taxes are levied on all taxable real, public utilities, and personal property (including vehicles) located within the County. Assessed values for property tax purposes are determined by the Chatham County Board of Tax Assessors for all property except public utilities and motor vehicles. Assessed value is set at 40% of market value. Public utility and motor vehicle assessed values are established by the State of Georgia. Property taxes are levied by the last quarter of the year in which they are assessed, or as soon after as deemed practical. Taxes are due and payable when levied. Chatham County may place liens on property once the related tax payments become delinquent. A lien on such property becomes enforceable 60 days after final notification on delinquency of property taxes. Property tax millage rates are usually adopted in July and tax bills are rendered by September 15.
3. Inventories and Prepaid Items Inventories are stated at cost on the basis of "first in, first out" (FIFO) method of accounting. Inventory in the General and Enterprise Funds consists of expendable supplies held for consumption. Costs are recorded as expenditures at the time inventory is used (consumption method). Reported inventories in the General Fund are equally offset by nonspendable fund balance, which indicates that the inventories do not constitute "available spendable resources" even though they are a component of net current assets. Certain payments to vendors reflect costs applicable to future accounting periods and are recorded as prepaid items. 4. Restricted Assets Governmental Funds – Chatham Emergency Management Agency Fund restricted funds were generated from contributions by private industry for use in a separate local emergency planning commission in the amount of
The property tax calendar is as follows:
Beginning of fiscal year for taxes January 1, 2015First installment real property tax bills rendered (based on prior year digest) April 1, 2015First installment real property tax payment due June 1, 2015Millage rate adopted by resolution June 26, 2015County tax digest approved by the State of Georgia for collection July 28, 2015Second installment real and personal property tax bills rendered September 15, 2015Second installment real property tax payment due November 15, 2015Tax sales 2006-2014 delinquent real property tax and other assessments Various
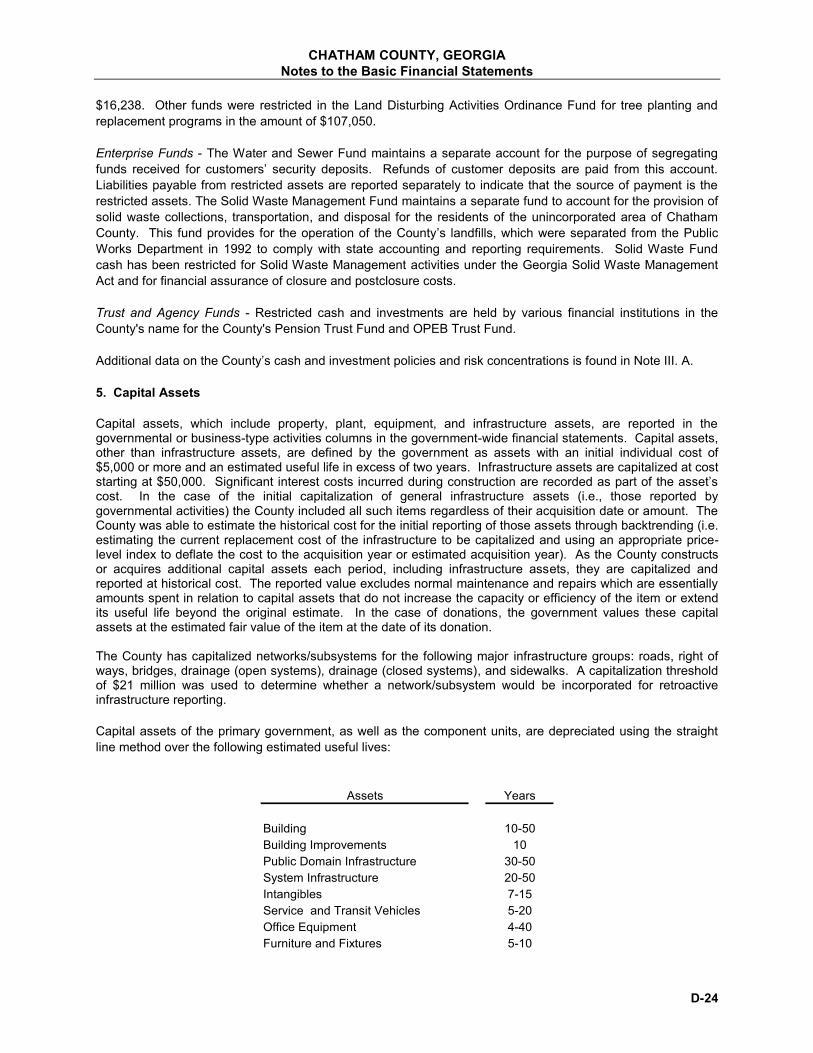
CHATHAM COUNTY, GEORGIA Notes to the Basic Financial Statements
D- 24
$16,238. Other funds were restricted in the Land Disturbing Activities Ordinance Fund for tree planting and replacement programs in the amount of $107,050. Enterprise Funds - The Water and Sewer Fund maintains a separate account for the purpose of segregating funds received for customers’ security deposits. Refunds of customer deposits are paid from this account. Liabilities payable from restricted assets are reported separately to indicate that the source of payment is the restricted assets. The Solid Waste Management Fund maintains a separate fund to account for the provision of solid waste collections, transportation, and disposal for the residents of the unincorporated area of Chatham County. This fund provides for the operation of the County’s landfills, which were separated from the Public Works Department in 1992 to comply with state accounting and reporting requirements. Solid Waste Fund cash has been restricted for Solid Waste Management activities under the Georgia Solid Waste Management Act and for financial assurance of closure and postclosure costs. Trust and Agency Funds - Restricted cash and investments are held by various financial institutions in the County's name for the County's Pension Trust Fund and OPEB Trust Fund. Additional data on the County’s cash and investment policies and risk concentrations is found in Note III. A. 5. Capital Assets Capital assets, which include property, plant, equipment, and infrastructure assets, are reported in the governmental or business-type activities columns in the government-wide financial statements. Capital assets, other than infrastructure assets, are defined by the government as assets with an initial individual cost of $5,000 or more and an estimated useful life in excess of two years. Infrastructure assets are capitalized at cost starting at $50,000. Significant interest costs incurred during construction are recorded as part of the asset’s cost. In the case of the initial capitalization of general infrastructure assets (i.e., those reported by governmental activities) the County included all such items regardless of their acquisition date or amount. The County was able to estimate the historical cost for the initial reporting of those assets through backtrending (i.e. estimating the current replacement cost of the infrastructure to be capitalized and using an appropriate price-level index to deflate the cost to the acquisition year or estimated acquisition year). As the County constructs or acquires additional capital assets each period, including infrastructure assets, they are capitalized and reported at historical cost. The reported value excludes normal maintenance and repairs which are essentially amounts spent in relation to capital assets that do not increase the capacity or efficiency of the item or extend its useful life beyond the original estimate. In the case of donations, the government values these capital assets at the estimated fair value of the item at the date of its donation. The County has capitalized networks/subsystems for the following major infrastructure groups: roads, right of ways, bridges, drainage (open systems), drainage (closed systems), and sidewalks. A capitalization threshold of $21 million was used to determine whether a network/subsystem would be incorporated for retroactive infrastructure reporting. Capital assets of the primary government, as well as the component units, are depreciated using the straight line method over the following estimated useful lives:
Assets Years
Building 10-50Building Improvements 10Public Domain Infrastructure 30-50System Infrastructure 20-50Intangibles 7-15Service and Transit Vehicles 5-20Office Equipment 4-40Furniture and Fixtures 5-10

CHATHAM COUNTY, GEORGIA Notes to the Basic Financial Statements
D- 25
6. Long-Term Liabilities In the government-wide financial statements and proprietary fund types in the fund financial statements, long-term debt and other long-term obligations are reported as liabilities in the applicable governmental activities, business-type activities, or proprietary fund type Statement of Net Position. In the fund financial statements, governmental fund types recognize bond premiums and discounts, as well as bond issuance costs during the current period. The face amount of debt issued is reported as other financing sources while discounts on debt issuances are reported as other financing uses. Issuance costs, whether or not withheld from the actual debt proceeds received, are reported as debt service expenditures. 7. Claims, Judgments, and Compensated Absences The liability for claims and judgements and compensated absences has been accrued. The total liability for proprietary funds is recorded in the proprietary fund type. The County’s policy is to permit employees to accumulate earned but unused vacation, holiday and sick pay benefits and compensatory time. The accumulated benefits will be liquidated in future years as employees elect to use them. In the normal course of business, all payments of these accumulated benefits will be funded from appropriations in the year they are to be paid. All compensated absences are accrued when incurred in the government-wide and proprietary fund financial statements. A liability for these amounts is reported in governmental funds only if they have matured, for example, as a result of employee resignations and retirements. In accordance with the Fair Labor Standards Act, employees may receive compensatory time off in lieu of overtime pay. Unused compensatory time may be banked up to 480 hours for law enforcement and emergency response personnel and 240 hours for other personnel. Non-exempt employees will be paid for accumulated compensatory time at separation. The potential liability for compensatory time at June 30, 2015 is $136,775. 8. Equity Classifications Fund equity at the governmental fund financial reporting level is classified as “fund balance”. Fund equity for all other reporting is classified as “net position”. Fund balance is reported in the governmental funds financial statements and generally represents the difference between current assets and current liabilities. Fund balance classifications represent a hierarchy based primarily on the extent to which the County is bound to honor constraints on specific purposes for which amounts in those funds can be spent. The Board of Commissioners has formally adopted a Policy on Fund Balance Classification & Disbursement of Constrained Amounts. The policy defines categories within overall fund balance and outlines authorizations for appropriating and classifying amounts. In accordance with this policy, fund balances are classified as follows:
a. Nonspendable – Fund balances are classified as nonspendable when amounts cannot be spent because they are either i) in nonspendable form or ii) they are legally or contractually required to be maintained intact. The County includes items that are not expected to be converted to cash such as inventories and prepaid amounts. Based on a review of each fund’s accounts, the Finance Director has been authorized by the Board to determine the nonspendable amount of fund balance for annual disclosure purposes.
b. Restricted – Fund balances are reported as restricted when their use is restricted for specific purposes including i) constraints on funds externally imposed by creditors, grantors, contributors, or laws or regulations of other governments, or ii) constraints imposed by law through constitutional provisions or enabling legislation. Based on a review of each fund’s accounts, the Finance Director has been authorized by the Board to determine the restricted amount of fund balance for annual disclosure purposes.

CHATHAM COUNTY, GEORGIA Notes to the Basic Financial Statements
D- 26
c. Committed – Fund balances are reported as committed if their use is for a specific purpose as approved by formal action on the Board of Commissioners (majority vote). Amounts committed cannot be used for any other purpose unless the Board of Commissioners removes or changes the specific use by approving such action through resolution at a Commission meeting. Budget resolutions are considered a plan for specific use.
d. Assigned – Fund balances are reported as assigned when constrained by the County’s intent to use the funds for specific purposes that are neither restricted nor committed. Assigned fund balance includes i) governmental funds, other than the General Fund, that are not classified as nonspendable, restricted or committed, and ii) amounts in the General Fund intended for a specific use identified by either the County Manager or Finance director, and iii) amounts appropriated to eliminate a projected budget deficit in the subsequent year. Based upon a review of each fund’s accounts, the Finance Director has been authorized by the Board in the county’s financial policies on fund balance classification, to determine the assigned amount of fund balance for annual disclosure purposes.
e. Unassigned – Fund balances are reported as unassigned when the balances do not meet any of the above four criterion for classification. The County reports positive unassigned fund balance in only the General Fund. Negative unassigned fund balances may be reported in all governmental funds.
For purposes of fund balance disbursement, unless otherwise approved by the Board of Commissioners, the County will expend restricted fund balance when expenditure is incurred for which both restricted and unrestricted fund balance is available. Next the County will expend committed fund balance when expenditure is paid for which unrestricted fund balance is available. The County would next disburse fund balance assigned for purposes of the fund before disbursing other assigned fund balance amounts. In the General Fund, the County would disburse unassigned fund balance prior to disbursing fund balance committed for financial policy reserve levels or amounts assigned to eliminate subsequent year’s budget deficit. Net position represents the difference between assets and liabilities. There are three classifications of net position: a. Net investment in capital assets consists of capital assets including restricted capital assets, net of
accumulated depreciation and reduced by the outstanding balances of any bonds, mortgages, notes, or other borrowings that are attributable to the acquisition, construction, or improvement of those assets.
b. Restricted net position consist of net position with constraints placed on the use either by (1) external groups such as creditors, grantors, contributions, or laws or regulations of other governments, or (2) law through constitutional provisions or enabling legislation.
c. Unrestricted net position consist of all other net positions that do not meet the definition of “restricted” or “net investment in capital assets”.
F. Revenues, Expenditures, and Expenses
1. Operating and Non-operating Revenues and Expenses
Operating revenues and expenses for proprietary funds are those that result from providing services and producing and delivering goods and or services. Also included are all revenues and expenses not related to capital and related financing, non-capital financing, or investing activities. For the County’s blended component unit, grants for specific transit activities are reported as operating revenues. All revenues and expenses not meeting this definition are reported as nonoperating revenues and expenses. When both restricted and unrestricted resources are available for use, the County’s policy is to use restricted resources first, then unrestricted resources as needed. 2. Expenditures/Expenses In the government-wide financial statements, expenses are classified by function for governmental activities. Administrative overhead charges are made to various functions and are included in direct expenses. In the fund financial statements, governmental fund expenditures are classified by character i.e. current (further classified by function), debt service, and capital outlay. Proprietary fund expenses are classified as operating and non-operating.

CHATHAM COUNTY, GEORGIA Notes to the Basic Financial Statements
D- 27
In the fund financial statements, governmental funds report expenditures of current financial resources. Proprietary funds report expenses relating to use of economic resources. 3. Interfund Transactions Interfund transactions are reflected as either loans, services provided, reimbursement, or transfers. Loans are reported as receivables and payables as appropriate and are subject to elimination upon consolidation. Services provided, deemed to be at market or near market rates, are treated as revenues and expenditures/expenses. Reimbursements are when one fund incurs a cost, charges the appropriate benefiting fund and reduces its related cost as a reimbursement. All other interfund transactions are treated as transfers. Transfers between governmental or proprietary funds are netted as part of the reconciliation to the government-wide columnar presentation. 4. Use of Estimates The preparation of financial statements in conformity with generally accepted accounting principles requires management to make estimates and assumptions that may affect the amounts reported in the financial statements and the related notes. Accordingly, actual results could differ from these estimates. 5. Internal Service Fund Consolidation Internal service fund revenues and expenses are consolidated as part of governmental activities. Although these funds provide services to both governmental and business-type activities, the proportionate share to business-type activities is immaterial. II. STEWARDSHIP, COMPLIANCE, AND ACCOUNTABILITY A. Budget Budget to actual expenditures are monitored by the County on an ongoing basis. Biweekly agenda items and quarterly financial reports are presented to the Board of Commissioners. Budget transfers or amendments related to cost overruns may be proposed up to the amount of available contingency funds. III. DETAILED NOTES ON ALL FUNDS A. Deposits and Investments General: The County maintains a cash and investment pool utilized by the majority of the County’s funds. The six major capital project funds – Sales Tax I, Sales Tax II, Sales Tax III, Sales Tax IV, Sales Tax V, and Sales Tax VI – maintain their own individual bank accounts and investments. The cash and investments of the Chatham County Employees’ Retirement Plan (CCERP) are also held separately and reported within the Pension Trust Fund. Cash and investments intended for payment of other post-employment benefits are held separately and reported in the Other Post-Employment Benefit Trust Fund. Deposits: Custodial Credit Risk for deposits is the risk that, in the event of bank failure, a government’s deposits may not be returned to it. At June 30, 2015 all of the County’s deposits were either covered by federal depository insurance or collateralized through the Georgia Public Funds Pledging Pool, a multiple financial institution collateral pool administered by the Georgia Bankers Association for the State of Georgia. Georgia law governs collateral requirements and forms of collateral under O.C.G.A. Section 45-8-12 which is incorporated by reference within the County’s Investment Policy. The County has no custodial credit risk policies requiring additional collateral. In summary, Georgia law states:
All deposits shall be collateralized within 10 days of deposit by a surety bond, a guarantee of insurance, or collateral.
The face value of any surety bond, guarantee of insurance, or collateral shall be at least 110% of the public funds being secured, net of deposit insurance.

CHATHAM COUNTY, GEORGIA Notes to the Basic Financial Statements
D- 28
If a depository elects the pooled method (O.C.G.A. Section 45-8-13.11), the aggregate market value of pledged securities may not be less than 110% of the daily pool balance.
Authorized security for deposits enumerated under law includes surety bonds, FDIC insurance, obligations of the United States or the State of Georgia, obligations of Georgia counties or municipalities, bonds of any Georgia public authority, industrial revenue bonds of any Georgia development authority, and obligations of any subsidiary corporation of the United States government fully guaranteed by the United States (such as Federal Home Loan Bank, Federal National Mortgage Association, etc.). Investments: In its investment of both public and pension trust funds, the County follows state statutes and adopted investment policies. As of June 30, 2015 the investments of the Primary Government, OPEB and the CCERP were:
Under state law, investments of the County’s public funds may be placed in obligations of (or obligations guaranteed by) the U.S. government, obligations of agencies of corporations in the U.S. government, obligations of any state or any political subdivision of any state, certificates of deposit or time deposits of financial institutions with deposits insured by FDIC, prime bankers acceptances, repurchase agreements, and the Georgia Fund 1. During the year the County invested public funds in certificates of deposits and time deposits of local banks, U.S. Government obligations, obligations of agencies guaranteed by the U.S. Government, obligations of the state of Georgia political subdivisions, and the Georgia Fund 1. State law also governs the investment of retirement funds (O.C.G.A. 47-20-84) and post-employment benefit funds (O.C.G.A. 47-20-10h and 47-20-10.1) and limits investments to maximum concentrations by investment
AverageType of Investment Credit Rating Fair Value Less than 1 1-3 4-5 Greater than 5
Primary Government:Georgia Fund I Aaa 84,528,255$ 84,528,255$ -$ -$ -$ US Government/Agency Sec Aaa 78,646,162 - 54,054,880 22,367,277 2,224,005 Municipal Bonds NR - - - Mortgage Backed Securities Aaa 56,923,576 28,333,786 27,594,124 995,666 Municipal Bonds A1 8,655,709 - 1,053,350 3,982,272 3,620,087
OPEB Trust Fund: Index Funds NR 37,865,612 37,865,612
Pension Trust Fund:US Government/Agency Sec Aaa 18,892,222 - 2,914,777 2,412,195 13,565,250 Mortgage Backed Securities Aaa 4,981,136 527,198 1,228,302 462,407 2,763,229 Municipal Bonds A 214,920 214,920 Corporate Bonds Various A 18,258,290 2,261,767 3,241,104 3,194,919 9,560,500 Various Aa 8,318,385 638,540 3,628,948 1,915,453 2,135,444 Various Baa 6,831,730 1,958,517 531,641 1,748,265 2,593,307 Domestic Stock NR 70,022,476 70,022,476 - - - Common Collective Trust NR 55,025,297 55,025,297 - - - International Equity Funds NR 20,443,652 20,443,652 - - - Total Investments 469,607,422$ 273,271,314$ 94,986,788$ 63,676,912$ 37,672,408$
Maturities in Years

CHATHAM COUNTY, GEORGIA Notes to the Basic Financial Statements
D- 29
category (at cost). The County’s defined benefit pension plan qualifies as a “large retirement system”, a designation which allows the plan additional investments in equity securities. The Georgia Fund 1 is considered to be a 2a7-like-pool that operates in a manner consistent with the SEC’s Rule 2a7 of the Investment Company Act of 1940. Georgia Fund 1 was created under O.C.G.A. 36-83-8 and is managed by the Office of the State Treasurer. The pool is not registered with the SEC as an investment company. The fair value of the pool is the same as the value of the pool shares. As a public fund, Georgia Fund I is exempt from any disclosure of custodial credit risk. Deposit and investment transactions are subject to a variety of risks. The County’s adopted investment policies seek to promote the safety of principal, provide adequate liquidity for operational needs, earn market rates of return on investments consistent with liquidity needs and investment quality, and conform to legal requirements. Interest rate risk is the risk that the changes in interest rates will adversely affect the value of an investment. The County’s Investment Policy states that the County will structure its portfolio to meet cash requirements for ongoing operations, thereby avoiding the need to sell securities prior to their maturity. The Policy also emphasizes the purchase of shorter term or more liquid investments. The Policy does not place formal limits on investment maturities. Policies of the CCERP limit short-term investments to specified securities: money market accounts, direct obligations of the U.S. Government with maturities of 1 year or less, and commercial paper maturing within 270 days that are rated A-1 or higher by Standard & Poor ’s or P-1 by Moody’s Investor Services. Credit risk is the risk that an issuer or counterparty to an investment will not fulfill its obligations. The County’s Investment Policy seeks to minimize credit risk through diversification of investments within the choices allowed under state statutes. CCERP policies minimize credit risk by setting a target average credit quality of “A” or higher for the bond portfolio. Investments in all corporate fixed income securities are limited to an investment grade of “BAA” or higher as rated by Moody’s or “BBB” or higher as rated by Standard & Poor’s. All of the County’s investments in U.S. Treasury and Agency securities carry the explicit guarantee of the U.S. government. U.S. Agency securities underlie repurchase agreements. Foreign currency risk is the risk that exchange rates may effect the valuation of an investment. The Pension Plan has investments in one international equity fund (various currencies) subject to foreign currency risk. The fair value of these funds as of June 30, 2015 was $20,443,652. State law limits the Pension Plan’s investment in foreign equities, and the County has not adopted additional policies. Concentration of credit risk is the risk of loss attributed to the magnitude of an investment in a single issuer. Disclosures are required for any issuer that represents 5% of more of total investments, exclusive of mutual funds, external investment pools, and investments issued or guaranteed by the U.S. government. The County’s Investment Policy places maximum limits on investment of public funds as follows:
Bankers’ Acceptances maturing within 270 days and eligible for purchase by the Federal Reserve 20% Certificates of Deposit 20% U.S. Treasury Obligations 100%
OTFS-Georgia Fund 1 (liquidity pool) 80% OTFS-GEAP (intermediate pool) 50% Obligations of Georgia and its political subdivisions 25% Repurchase agreements collateralized by US Government
Securities 25% Collateralized instruments offered by approved County depository bank(s) 100% Interests or securities in no-load, open-end mutual funds as provided for in OCGA 36-82-7 (bond proceeds only) 100% Mortgage pass-throughs/REMICS/CMOs/other mortgage-backed Securities (other than high-risk* derivatives) issued by a US Government Agency or Instrumentality 25% U.S. Government agencies or instrumentalities 100%

CHATHAM COUNTY, GEORGIA Notes to the Basic Financial Statements
D- 30
Local community investment opportunities 10% *CMOs must pass the FFIEC (or surviving and mutually agreed upon equivalent) tests one and two. In addition, the CCERP’s Investment Policy seeks a diversified portfolio of fully negotiable, equity, fixed income, and money market securities, with the following maximum investment limits, stated at cost: Equity securities 55% Foreign equity assets 15% Domestic bonds (including TIPs) 30% Prohibited investments are also specified in the policy. The County’s Pension Board follows State law in its investment of assets of the OPEB Trust Fund. Current investments are divided between index funds concentrating in fixed income and domestic equities. Deposits and investments are reconciled between the financial statements and note disclosure as follows:
B. Receivables Receivables as of year end for the government’s individual major funds and non-major, internal service, and fiduciary funds in the aggregate including the applicable allowance for uncollectible accounts, are as follows:
Basic financial statements:Cash and investments 299,550,571$ Restricted cash 5,364,766Trust and agency funds 297,454,495
Total 602,369,832$
Notes to financial statements:Cash on hand 52,165$ Deposits 132,710,245Investments 469,607,422
Total 602,369,832$
Inter- Gross Allowance for NetReceivables: Taxes Accounts governmental Receivables Uncollectibles ReceivablesGeneral 9,902,293$ 162,858$ 2,101,720$ 12,166,871$ (156,000)$ 12,010,871$ Special Service District 1,176,382 487,265 685,245 2,348,892 (18,000) 2,330,892 Sales Tax I - - - - - - Sales Tax II - - 178,752 178,752 - 178,752 Sales Tax III - - 2,586,149 2,586,149 - 2,586,149 Sales Tax IV - - 365,550 365,550 - 365,550 Sales Tax V - - - - - Sales Tax VI - - 5,924,184 5,924,184 - 5,924,184 Solid Waste - 80,693 - 80,693 - 80,693 Nonmajor Governmental - 775,219 1,499,385 2,274,604 (1,000) 2,273,604 Internal Service - 160,926 69,551 230,477 - 230,477 Nonmajor Enterprise - 579,961 - 579,961 - 579,961 Fiduciary Fund - 1,483,157 71,240 1,554,397 - 1,554,397 Total 11,078,675$ 3,730,079$ 13,481,776$ 28,290,530$ (175,000)$ 28,115,530$

CHATHAM COUNTY, GEORGIA Notes to the Basic Financial Statements
D- 31
Chatham Area Transit Authority had a total of $5,544,966 in receivables at June 30, 2015. C. Capital Assets Capital assets activity for the year ended June 30, 2015 was as follows: Primary Government
Beginning Ending Balance Increases Decreases Balance
Governmental Activities:Non-Depreciable Assets:Land 46,657,468$ 28,145$ -$ 46,685,613$ Right of Ways 340,259,516 722,455 1,105,000 339,876,971 Construction in Progress 11,298,199 7,142,380 5,625,565 12,815,014Depreciable Assets:Buildings and Improvements 295,427,115 1,046,722 4,746,053 291,727,784Machinery and Equipment 53,286,549 3,446,656 5,350,714 51,382,491Infrastructure 489,447,163 8,214,808 - 497,661,971Intangible Assets 5,092,661 3,000,874 - 8,093,535Total 1,241,468,671 23,602,040 16,827,332 1,248,243,379
Accumulated Depreciation:Buildings and Improvements (61,133,838) (7,990,815) (1,067,722) (68,056,931)Machinery and Equipment (41,877,379) (3,044,349) (5,245,321) (39,676,407)Infrastructure (236,032,209) (12,758,005) - (248,790,214)Intagible Assets (3,564,594) (285,833) - (3,850,427)Total Accumulated Depreciation (342,608,020) (24,079,002) (6,313,043) (360,373,979)Total Governmental Activities 898,860,651 (476,962) 10,514,289 887,869,400
Business-Type Activities:Non-Depreciable Assets:Land 1,931,687 - - 1,931,687Construction in Progress 207,077 - 207,077 - Depreciable Assets:Buildings and Improvements 3,576,692 - - 3,576,692Plant 10,638,644 301,610 - 10,940,254Machinery and Equipment 4,604,529 1,144,830 254,657 5,494,702Total 20,958,629 1,446,440 461,734 21,943,335
Accumulated Depreciation:Buildings and Improvements (2,432,587) (141,465) - (2,574,052)Plant (7,139,388) (261,415) - (7,400,803)Machinery and Equipment (3,693,344) (287,036) (254,659) (3,725,721)Total Accumulated Depreciation (13,265,319) (689,916) (254,659) (13,700,576)Total Business-Type Activities 7,693,310 756,524 207,075 8,242,759Total Capital Assets 906,553,961$ 279,562$ 10,721,364$ 896,112,159$

CHATHAM COUNTY, GEORGIA Notes to the Basic Financial Statements
D- 32
Depreciation expense was charged to governmental activities as follows:
In the prior year, the Chatham Area Transit Authority was a blended component unit of the County. It was determined in this year they are now a discretely presented component unit; therefore, the beginning balance of the capital assets was reduced by $47,882,764. See below for a breakdown of the component unit capital assets. Chatham Area Transit Authority – Discretely Presented Component Unit
Beginning Ending Balance Increases Disposals Transfers Balance
Non-Depreciable Assets: Land $ 6,175,878 $ - $ - $ - $ 6,175,878 Construction in Progress 2,083,089 43,328 - (2,015,423) 110,994 Depreciable Assets: Buildings and Improvements 27,336,228 2,183,223 - 205,875 29,725,326 Transit Vehicles 35,007,178 379,864 - - 35,387,042 Service Vehicles 279,921 - - - 279,921 Shop Equipment 480,485 81,700 - - 562,185 Furniture & Equipment 1,435,303 782,492 - 1,809,548 4,027,343 Total 72,798,082 3,470,607 - 76,268,689
Accumulated Depreciation: Buildings and Improvements (4,869,930) (884,490) - - (5,754,420) Transit Vehicles (19,076,635) (2,974,553) - - (22,051,188) Service Vehicles (194,771) (27,488) - - (222,259) Shop Equipment (443,660) (11,075) - - (454,735) Furniture & Equipment (330,322) (391,748) - - (722,070) Total Accumulated Depreciation (24,915,318) (4,289,354) - - (29,204,672) Total Governmental Activities $ 47,882,764 $ (818,747) $ - $ - $ 47,064,017
General government 3,955,698$ Judiciary 300,142 Public safety 5,268,539 Public works 12,702,732 Culture and recreation 761,643 Health and welfare 1,090,248
Total depreciation expense 24,079,002$

CHATHAM COUNTY, GEORGIA Notes to the Basic Financial Statements
D- 33
The County has active construction projects as of June 30, 2015. At year-end the government’s major commitments are as follows:
At fiscal year end, the County has encumbered amounts that will be honored in the subsequent fiscal year for the following major governmental funds: General Fund $ 3,071,154 Special Service District 312,031 Total $ 3,383,185
ContractBalance
June 30, 2015Sales Tax I 1,083,044$ Sales Tax II 94,301Sales Tax III 685,748Sales Tax IV 2,518,275Sales Tax V 8,040,546Sales Tax VI 276,032Nonmajor Governmental 3,988,824Total 16,686,770$
Beginning Ending Balance Increases Disposals Balance
Non-Depreciable Assets:Land 1,812,702$ -$ -$ 1,812,702$ Total Non-Depreciable Assets 1,812,702 - - 1,812,702Depreciable Assets:Buildings and Improvements 23,707,570 8,600,000 (242,384) 32,065,186Furniture & Equipment 1,314,216 207,550 - 1,521,766Total 25,021,786 8,807,550 (242,384) 33,586,952
Accumulated Depreciation:Buildings and Improvements (7,113,552) (740,331) 210,320 (7,643,563)Furniture & Equipment (772,801) (130,881) - (903,682)Total Accumulated Depreciation (7,886,353) (871,212) 210,320 (8,547,245)Governmental Activity Capital Assets, Net 18,948,135$ 7,936,338$ (32,064)$ 26,852,409$
Live Oak Public Library - Discretely Presented Component Unit

CHATHAM COUNTY, GEORGIA Notes to the Basic Financial Statements
D- 34
D.Interfund receivables, payables and transfers Interfund receivable and payable balances at June 30, 2015 are as follows:
These balances represent loans between the borrower fund and the lender fund. These balances resulted from the time lag between the dates that 1) interfund goods and services are provided or reimbursable expenditures occur, 2) transactions are recorded in the accounting system, and 3) payments between funds are made. Interfund receivables and payables are reported in the fund financial statements; however, they are eliminated in the government-wide financial statements if the interfund loan is between governmental funds. A summary of interfund transfers by fund type is as follows:
Interfund transfers are used to 1) move revenues from the fund where they are authorized for collection by statute or budget to the fund where statute or budget requires expenditure, 2) move receipts restricted to debt service from the funds collecting the receipts to the debt service fund as debt service payments become due, and 3) use unrestricted revenues collected to finance various programs accounted for in other funds in accordance with budgetary authorizations. Interfund transfers are eliminated in the government-wide financial statements if the interfund transfer is within the governmental fund group.
Receivable Fund Payable Fund AmountGeneral Fund Nonmajor Governmental $1,028,863 Total 1,028,863$
Receiving Fund: Paying Fund: AmountMajor Funds General Special Service District 239,463$ General Sales Tax IV 4,000,000 General Nonmajor Governmental 381,440 Special Service District Nonmajor Governmental 791,215 Solid Waste General 1,079,698 Nonmajor Funds Governmental General 317,893 Governmental Special Service District 332,522 Capital Project Fund General 2,253,638 Capital Project Fund Special Service District 220,000 Capital Project Fund Nonmajor Governmental 500,000 Capital Project Fund Enterprise Fund 120,000 Debt Service Fund General 2,000,000 Enterprise Fund Special Service District 366,291 Internal Service Fund General 4,000,000 Internal Service Fund Special Service District 275,000 Internal Service Fund Internal Service Fund 1,773,894 Total 18,651,054$

CHATHAM COUNTY, GEORGIA Notes to the Basic Financial Statements
D- 35
In 2011, O.C.G.A. 48-8-123 was inacted thereby changing how counties can declare previously funded projects that are no longer feasible. During the November 2013 SPLOST Referendum, the voters approved a repurposing of sales tax for two projects deemed to be infeasible. A transfer of $4,000,000 was made from Sales Tax IV to the General Fund and used for a onetime millage rollback for tax year 2015. All of the remaining projects will be completed as required in the referendum for SLPOST IV. E. Short-term Debt Chatham Area Transit Authority, a discretely presented component unit, has a $1,500,000 line of credit agreement with a bank for working capital. The bank made advances on the line of credit in order to provide the Authority with operating funds throughout the year. Interest is payable monthly at LIBOR market index rate plus 1.50%. A schedule of changes in short-term debt follows:
In December 2014, the Authority refinanced $5,000,000 of its outstanding line of credit with a five year term loan payable in annual principal installments of $1,000,000. F. Capital Leases The County has entered into a lease agreement as lessee for financing the acquisition of radio and communication equipment. This lease agreement qualifies as a capital lease for accounting purposes. During this fiscal year, the lease proceeds were placed in escrow since the equipment was not purchased until fiscal year 2016. The future minimum lease obligations and the net present value of these minimum lease payments as of June 30, 2015 were as follows:
Beginning Ending Fund: Balance Increases Decreases Balance Chatham Area Transit Authority Enterprise Fund $ 7,000,000 $________-_ $5,500,000 $ 1,500,000 Total $ 7,000,000 $ - $5,500,000 $ 1,500,000
Year Ending GovernmentalJune 30 Activities
2016 655,730$ 2017 655,730 2018 655,730 2019 655,730 2020 655,730
2021-2022 1,256,818 Total minimum lease payments 4,535,468 Less: amount representing interest (234,117) Present value of minimum lease payments 4,301,351$

CHATHAM COUNTY, GEORGIA Notes to the Basic Financial Statements
D- 36
G. Long -term debt
Schedule of Contractual Obligations
Information on each of these contractual obligations is shown below: Governmental Activities: (1) Downtown Savannah Authority Revenue Refunding Bonds (Chatham County Projects), Series 2005A: In November 2005 the County issued bonds through the Downtown Savannah Authority in the amount of $6,075,000. The bonds bear interest ranging between 3.00% and 5.00% with final maturity in 2020. Proceeds of the bond issue were used to i) partially refund and redeem the outstanding Downtown Savannah Authority Revenue Bonds, Series 1999 in the amount of $5,845,000 and ii) pay related costs of issuance. The bonds were issued at a premium of $221,126. Remaining balance for the 2005A Series at June 30, 2015 was $3,295,000. The refunding provided a reduction in total future debt service payments of $322,407 with most of the savings occurring within the first year. The transaction generated an economic gain (difference between the present values of the old and new debt service payments) of $243,373. Pursuant to the bond issue, the County entered into an intergovernmental contract with the Downtown Savannah Authority whereby the County has an unconditional obligation to provide sufficient funds for debt service payments and related paying agent or bond registrar fees. The County is authorized to exercise its powers of taxation to the extent necessary to pay the amounts required by contract. (2) Mosquito Control Facility: On February 2001, the County entered into an intergovernmental agreement with the Savannah Airport Commission (SAC). Under terms of the agreement the County contracted to reimburse the SAC for the design and construction costs of a Mosquito Control Facility. The County occupied the Mosquito Control Facility on January 1, 2003. The County will repay SAC $4,596,057 over thirty years at an interest rate of 6.08%. Monthly payments of $27,793 began January 1, 2003 and will conclude on December 1, 2032. The County is also leasing an approximately 7.7 acre site (land lease) where the facility was built for fifty years with annual rental based on the appraised value of the land multiplied by a 12% factor. Rental rates for the
Average Original AmountPurpose Issue Date Interest Rates Amount OutstandingGovernmental Activities:(1) Downtown Savannah Authority Series 2005A November 2005 3.00 - 5.00% 6,075,000$ 3,295,000$ (2) Mosquito Control Facility January 2003 6.08% 4,596,057 3,587,423(3) Downtown Savannah Authority Series 2009 August 2009 3.81% 2,400,000 1,970,000(4) Downtown Savannah Authority Series 2011 November 2011 1.91% 2,680,000 2,680,000(5) Downtown Savannah Authority (Chatham County Projects) Series 2014 October 2014 2.38% 9,840,000 9,840,000
Total 25,591,057$ 21,372,423$

CHATHAM COUNTY, GEORGIA Notes to the Basic Financial Statements
D- 37
land lease will be amended and modified every five years based upon a reappraisal of the value of the land. At inception, the agreement specified an annual land rental of $36,342. Effective January 1, 2008 the annual land rental rate was amended to $38,496 based on the new market valuation. The Savannah Airport Commission voted to implement the new market valuation incrementally over a five-year period ($1,600 divided by 5 years = $320 increase per year). In addition the Commission agreed to decrease the ground lease rate factor from 12% to 10%. (3) Downtown Savannah Authority Revenue Bonds (Chatham County – Union Mission Project), Series 2009: In August 2009 the County issued bonds through the Downtown Savannah Authority in the amount of $2,400,000. The bonds bear interest at 3.81% per annum, and will be repaid annually, with final maturity on July 1, 2029. The bonds were sold to Wachovia Bank, N.A. through a private placement transaction, and no premium or discount was recorded at issuance. The bank has the option to “put” or sell the bonds to the Downtown Savannah Authority on July 1, 2019 and July 1, 2024. Proceeds from the bond sale were used to i) acquire land and improvements for a health and shelter care facility and ii) pay related bond issuance costs. The County entered into an intergovernmental agreement with the Downtown Savannah Authority whereby the County has an unconditional obligation to provide sufficient funds for debt service payments and related paying agent or bond registrar fees. The County is authorized to exercise its powers of taxation to the extent necessary to pay the amounts required under the contract. (4) Downtown Savannah Authority Revenue Bonds (Chatham County – Union Mission Project), Series 2011: In November 2011 the County issued bonds through the Downtown Savannah Authority in the amount of $2,680,000. The bonds bear interest at a rate of 1.91% per annum with interest payments due on April 1 and October 1 each year. The bonds were sold to SunTrust Bank through a private placement transaction, and no premium or discount was recorded at issuance. The bonds mature on October 1, 2016. Proceeds from the bond sale were used to i) acquire land and improvements located at 125 Fahm Street, Savannah, Georgia, and ii) pay related bond issuance costs. The County entered into an intergovernmental agreement with the Downtown Savannah Authority whereby the County has an unconditional obligation to make payments to the Authority as the principal and interest become due and payable. The County is authorized to exercise its power of taxation to the extent necessary to pay the amounts required under the contract.
(5) Downtown Savannah Authority Revenue Refunding Bonds (Chatham County Projects), Series 2014: In October 2014 the County issued bonds through the Downtown Savannah Authority in the amount of $9,840,000. The bonds bear interest at 2.375% with final maturity in 2026. Proceeds of the bond issue were used to i) advance refund all of the outstanding Downtown Savannah Authority Revenue Refunding and Improvment Bonds, Series 2005 in the amount of $9,550,000 and ii) pay related costs of issuance. The proceeds were deposited into an irrevocable escrow to be called on the first allowable call date of January 1, 2015. Thus, none of the 2005 Bond Series remained outstanding at June 30, 2015. The refunding provided a reduction in total future debt service payments of $1,129,201. The transaction generated an economic gain (difference between the present values of the old and new debt service payments) of $1,002,523. Pursuant to the bond issue, the County entered into an intergovernmental contract with the Downtown Savannah Authority whereby the County has an unconditional obligation to provide sufficient funds for debt service payments and related paying agent or bond registrar fees. The County is authorized to exercise its powers of taxation to the extent necessary to pay the amounts required by the contract. A summary of annual debt service requirements to maturity for contractual obligations follows:

CHATHAM COUNTY, GEORGIA Notes to the Basic Financial Statements
D- 38
Annual Debt Service Requirements to Maturity
Other Long Term Liabilities:
Governmental Activities: (1) Pollution Control Facilities Financing Chatham County, under court order, had agreements with various county municipalities regarding the financing of pollution control facilities. The only outstanding agreement is with the City of Pooler which began in 1984 for $349,230. Annual payments and the schedule by years for the future minimum payments under this agreement are:
Business-Type Activities:
(2) Closure and Postclosure Care Cost for Solid Waste Enterprise Fund: The Georgia Comprehensive Solid Waste Management Act effective January 1, 1992 requires the County to strengthen solid waste management practices and to achieve a 25 percent reduction in the amount of solid
Year Ending Governmental ActivitiesJune 30 Principal Interest
2016 1,608,666$ 729,159$ 2017 4,351,085 646,122 2018 1,723,968 560,607 2019 1,792,344 498,948 2020 1,851,244 431,169 2021-2025 6,235,457 1,430,499 2026-2030 3,037,968 537,319 2031-2033 771,691 62,083
Total 21,372,423$ 4,895,906$
Fiscal City ofYear Pooler
2016 9,978$ 2017 9,9782018 9,978
Total 29,934$

CHATHAM COUNTY, GEORGIA Notes to the Basic Financial Statements
D- 39
waste disposed of in landfills and by thermal combustion units by the year 1996. This act requires the County to further comply with the cost reporting mandate in capturing and reporting costs for local solid waste operations, direct costs for solid waste collecting, handling and disposal, indirect administrative costs, such as for shared central services, billable cost, (external and internal), costs for debt retirement, and interest expenses. State and federal laws and regulations require the County to place a final cover on the Wilmington Island landfill, Dillion landfill, Chevis landfill, Sharon Park landfill and Thomas Avenue landfill sites when each stops accepting waste and to perform certain maintenance and monitoring functions at these sites for thirty years after closure. Although closure and postclosure care costs will be paid only near or after the date that these landfills stop accepting waste, the County reports a portion of these closure and postclosure care costs as an operating expense in each period based on landfill capacity of the landfills. The $2,546,659 reported as the landfill closure and postclosure care liability at June 30, 2015 represents the cumulative amount reported to date based on the use of the percentage of the estimated capacity of the landfills. The percentage of landfill capacity used at June 30, 2015 is estimated to be 100%. The County has closed all the landfills. The actual cost of closure and postclosure care may fluctuate annually due to inflation, changes in technology, or changes in environmental laws and regulations. The County has set aside $2,546,659 for financial assurance of closure and postclosure. Changes in Long-Term Liabilities The following is a summary of long-term obligation transactions of the County for the year ended June 30, 2015:
Beginning Ending Due WithinBalance Additions Reductions Balance One Year
Governmental Activities:Capital Leases -$ 4,301,351$ -$ 4,301,351$ 594,799$ Contractual Obligations 22,539,106 9,840,000 11,006,683 21,372,423 1,608,666 Pollution Control Facilities 39,912 - 9,978 29,934 9,978 Compensated Absences 11,808,278 8,460,924 8,981,490 11,287,712 1,128,771 Claims & Judgements 685,000 1,803,930 100,000 2,388,930 721,000 Unamortized Amounts: Discounts (18,206) - (2,621) (15,585) - Premium 101,798 - 23,225 78,573 -
Total Governmental Activities 35,155,888$ 24,406,205$ 20,118,755$ 39,443,338$ 4,063,214$
Business-Type Activities:Closure and Postclosure Cost 2,669,630$ -$ 122,971$ 2,546,659$ 122,971$ Compensated Absences 278,835 259,969 247,874 290,930 29,093
Total Business-Type Activities 2,948,465$ 259,969$ 370,845$ 2,837,589$ 152,064$
Primary Government

CHATHAM COUNTY, GEORGIA Notes to the Basic Financial Statements
D- 40
Chatham Area Transit Authority – Discretely Presented Component Unit
Beginning Ending Due Within Balance Additions Reductions Balance One Year
Long-term debt $ - $ 5,000,000 $ 1,000,000 $ 4,000,000 $ 1,000,000 Compensated Absences 363,161 58,181 - 421,342 233,541 Other post-employment benefits 207,263 109,784 39,593 277,454
$ 570,424 $ 5,167,965 $ 1,039,593 $ 4,698,796 $ 1,233,541
Capital leases, contractual obligations, pollution control facilities, compensated absences, and claims & judgments are generally liquidated by the general and special service district funds, except for the Chatham County Hospital Authority Revenue Bonds contractual obligation that is liquidated by the debt service fund. Bond Issuance costs are expensed in the year that they are incurred. H. Fund Equity The County’s governmental funds show the following fund equity accounts: Non-spendable – The following fund balances are non-spendable because they are allocated at the governmental fund level for:
General Fund Inventories $ 103,304 Prepaid items 397,760 Total $ 501,065 Special Service District Fund Prepaid items $ 39,833 Total $ 39,833
Restricted – The following fund balances are shown as restricted at the governmental fund level:
General Fund
Restricted by ordinance for the local emergency planning committee (LEPC) $ 16,238 Total $ 16,238 Special Revenue Funds
Restricted for public safety due to legal restrictions on use of funds: Inmate Welfare Fund $ 422,769 Confiscated Revenue Fund 1,423,734 Emergency Telephone System Fund 594,169 Total $ 2,440,672
Restricted court fees under state law for juvenile court supervision, victim witness programs, drug abuse treatment and the DUI Court. $ 1,453,176 Capital Projects Funds Restricted for capital project expenditures approved through public referendum: Sales Tax I Fund $ 11,555,691 Sales Tax II Fund 4,957,109 Sales Tax III Fund 33,545,805

CHATHAM COUNTY, GEORGIA Notes to the Basic Financial Statements
D- 41
Sales Tax IV Fund 36,718,879 Sales Tax V Fund 71,378,950 Sales Tax VI Fund 22,696,009
Total $ 180,852,443
Capital project expenditures restricted by bond covenants $ 187,406 Committed – The following fund balances are committed at the governmental fund level for: General Fund
For Emergency Management Agency $ 143,286 Financial policy three month reserve level $ 42,494,522 Total $ 42,637,808
Special Revenue Funds Financial policy two month reserve level
Special Service District $ 7,621,172 Street Lighting Fund 323,743
Land Bank Fund 61,004 Land Disturbing Activities Ordinance Fund 809,516 Total $ 8,815,435
Debt Service Fund Future debt service $ 2,105,514
In accordance with adopted financial policies, the Board of Commissioners has committed fund balance to cover two months of expenditures in its major operating funds. The amount of committed fund balance is modified each year based upon the adopted budget for these funds. During the budget process, the Board may also redirect these funds for expenditure. Assigned – The following fund balances are assigned: For Purposes of the Fund: Special Service District $ 1,192,580 Capital Projects Funds For Purposes of the Fund: Capital Improvement Fund $ 26,453,896 Capital Improvement Bond Fund 24,517 Total $ 26,478,413 Unassigned – Unassigned fund balance in the General Fund was $1,245,990 at year end. There was no unassigned fund balance in other funds. I. Restricted Net Position Financial statements prepared on the accrual basis of accounting (proprietary funds and government-wide statements) show restrictions of net position as follows: Restricted for Capital Projects – Capital Projects Funds – The restriction represents amounts to be used for capital project expenditures as legally restricted through public referendum or contractual obligation. Restricted for Solid Waste Management Activities – Enterprise Fund – These amounts are legally restricted for certain uses as specified by State statutes and local ordinance.

CHATHAM COUNTY, GEORGIA Notes to the Basic Financial Statements
D- 42
Restricted for Public Safety – The restriction represents amounts restricted by State law for law enforcement purposes. Restricted for Judiciary Programs – The restriction represents court fees as restricted by State law for certain programs. The use of fees collected for digital image transmission is restricted for the technology improvements within the Clerk of Superior Court’s office by the Georgia Superior Court Clerk’s Cooperative Authority. Restricted for Other Purposes – The use of fees collected from private industry is restricted for use by the Local Emergency Planning Commission. J. Net Investment in Capital Assets Net investment in capital assets, in the government-wide statement of net position as of June 30, 2015 is as follows: Governmental
Activities
Business-Type Activities Net Investment in Capital Assets: Net Capital Assets $(887,869,400) $(8,242,759) Less Capital Related Debt 25,736,761 - Less Capital Improvements Reported in Accounts Payable
2,185,205. -
-
Unspent Bond Proceeds (4,513,273) - Net Investment in Capital Assets $(864,460,707) $(8,242,759)
K. Restatement of Net Position on Entity-wide Financial Statements Beginning balances were restated due to changing Chatham Area Transit from a blended component unit to a discretely presented component unit and the presentation of net pension liability as required by GASB 68. These changes are summarized below:
ChathamBusiness- Area Solid Other Internal
Governmental Type Transit Waste Enterprise ServiceActivities Activities Authority Fund Funds Funds
Beginning net position as previously reported at June 30, 2014 1,116,055,920$ 61,015,846$ 43,194,168$ 7,616,390$ 10,205,288$ 10,310,406$
De-blend Chatham Area Transit Authority Component Unitas disclosed in Note 1.A.1 - Reporting Entity (43,194,168) (43,194,168) - - -
Adjust prior year pension asset for contributions in excessof ARC (2,894,545) - - - - -
Implementation of GASBS 68:Net pension liability (measurement date) - County Plan (45,448,125) (871,988) - (408,377) (463,611) (97,643) Net pension liability (measurement date) - GEMA Plan (607,168) - - - - - Deferred outflows - contributions made after the
measurement date 12,058 - - - - -
Total prior period adjustments (48,937,780) (44,066,156) (43,194,168) (408,377) (463,611) (97,643)
Net position as restated, July 1, 2014 1,067,118,140$ 16,949,690$ -$ 7,208,013$ 9,741,677$ 10,212,763$
Chatham Chatham TotalArea County Live Oak Discretely
Transit Board of Public Presented Authority Health Libraries Component Untis
Beginning net position as previously reported at June 30, 2014 -$ 5,719,902$ 20,361,947$ 26,081,849$
De-blend Chatham Area Transit Authority Component Unitas disclosed in Note 1.A.1 - Reporting Entity 43,194,168 - - 43,194,168
Implementation of GASBS 68:Net pension liability (measurement date) DPCU - (10,904,541) (6,867,812) (17,772,353) Deferred outflows - contributions made after the
measurement date 972,223 518,078 1,490,301
Total prior period adjustments 43,194,168 (9,932,318) (6,349,734) 26,912,116
Net position as restated, July 1, 2014 43,194,168$ (4,212,416)$ 14,012,213$ 52,993,965$
Discretely Presented Component Units
Primary Government

CHATHAM COUNTY, GEORGIA Notes to the Basic Financial Statements
D- 43
IV. OTHER INFORMATION Pension Plans The County maintains a cost-sharing multiple-employer pension plan to provide retirement benefits to employees of the County. The Chatham Emergency Management Agency (CEMA) an agency of the County participates in a separate cost-sharing multiple-employer pension plan administered by the Georgia Municipal Employees Benefit System. Separate plan disclosures are provided herein. The combined proportionate share of the net pension liability for the two plans is:
Chatham County CEMA Total Primary
Government
Total pension liability $244,341,197 $1,862,212 $246,203,409
Plan fiduciary net postion 197,685,160 1,232,517 198,917,677
Proportionate share of net position liability $ 46,656,037 $ 629,695 $ 47,285,732 A. The Chatham County Employees' Retirement Plan (CCERP) Chatham County administers a cost-sharing multiple-employer defined benefit pension plan. The plan assets shall be used only for the payment of benefits to the members of the plan, in accordance with the terms of the plan. 1. Summary of Significant Accounting Policies: Basis of Accounting. CCERP financial statements are prepared using the accrual basis of accounting. Plan member contributions are recognized in the period in which the contributions are due. Employer contributions to the plan are recognized when due and the employer has made a formal commitment to provide the contributions. Benefits and refunds are recognized when due and payable in accordance with the terms of the plan. Method Used to Value Investments. Investments are reported at fair value. Short term investments are reported at cost, which approximates fair value. Securities traded on a national or international exchange are valued at the last reported sales price at current exchange rates. Investments that do not have an established market are reported at estimated fair value. See note III.A. for additional information related to the Pension Trust Fund investments.
2. Plan Description and Contribution Information Plan Description Plan Administration: The Chatham County Employees' Retirement Plan (Plan) is a single-employer defined benefit pension plan that covers all County employees and former employees now employed within the Savannah-Chatham Metropolitan Police Department. The plan provides retirement, disability, and death benefits to plan members and their beneficiaries. Article IX of the Chatham County Employees' Retirement Plan defines the authority of the Pension Board including their ability to establish and amend the benefit provisions of the plan. Management of the CCERP is vested in the Pension Board, which consists of the Commission Chairman, the

CHATHAM COUNTY, GEORGIA Notes to the Basic Financial Statements
D- 44
County Manager, the Finance Director, the Human Resources Director, two general employees, two retirees and one citizen at large appointed by the Board of Commissioners. The County administers the Plan, and the County's responsibility includes pension disbursements and general administration of the Plan under the authority of the Chatham County Pension Board. The Pension Board has contracted with Regions Trust to act as custodian of the assets of the Plan. The accounting and financial reporting functions are performed by the County Finance Department. The County’s General Fund bears most of the Plan’s administrative costs. The Plan's audited financial statement is included in the County's Comprehensive Annual Financial Report as a Pension Trust Fund. The Plan does not issue a stand-alone financial report. The benefit provisions and all other related plan requirements are established and may be amended by County Ordinance. The Pension Plan is actuarially evaluated every year. Membership of the plan consisted of the following as of July 1, 2015, the date of the last actuarial evaluation:
Benefits provided. For employees hired prior to July 1, 2013 benefits vest after five years of service. For employee hired after that date benefits vest after 10 years of service. For general employees normal retirement age is 62 and for peace officer’s employee’s normal retirement age is 55. County employees who retire at normal retirement age are entitled to 2 percent of the final average earnings for each of the first 30 years of credited service plus one percent of final average earnings for the remaining number of years of credited service. Employees who are age 55 with 25 or more years of service have the reduced benefit from 30 years of service in lieu of age. The plan also provides for occupational and non-occupational disability. Members may also retire with unreduced benefits with 25 years of credited service. The plan also provides incentives for early retirements with reduced benefits of a 3 percent per year penalty for early retirement. Full benefits are equal to the average of the highest three years of covered earnings. Cost-of-living adjustments (COLA) are provided at the discretion of the Pension Board. Contributions. The annual contribution amounts are actuarially determined. Effective July 1, 2007, the Plan requires contributions of 3.5% by the employee. The County contributes such additional amounts as are necessary, based on actuarial valuations, to provide the plan with sufficient assets to meet future benefit payments. In 2015, the County contributed $14,200,405 (23.7% of covered payroll), and the contributions paid by employees totaled $2,171,448. The total payroll for employees covered under the plan for the year ended June 30, 2015 was $59.873 million. 3. Investments Investment Policy. The primary investment objective of the Chatham County Employees’ Pension Fund is the preservation of invested capital. The secondary objective is to achieve moderate long-term real growth of the assets while minimizing the volatility of the returns. The Pension Board seeks to create a conservative, well diversified and balanced portfolio of high quality equity, fixed income and money market securities. The Board has determined that one or more outside investment managers shall be retained to assure that all investments are managed in both a prudent and professional manner and in compliance with the stated investment guidelines. The following was the Board’s adopted asset allocation policy as of June 30, 2015:
Disabled employees, retirees and beneficiaries receiving benefits 655
Terminated plan members entitled to but not
yet receiving benefits 71
Active plan members
1,475
Total membership
2,201

CHATHAM COUNTY, GEORGIA Notes to the Basic Financial Statements
D- 45
Asset Class
Target Allocation
Actual Allocation
Large Cap Equity
39.00%
39.20% Mid Cap Equity
8.00%
9.00% Small Cap Equity
8.00%
8.20% International Equity
15.00%
14.20% Fixed Income
30.00%
28.10% Cash & Equivalent
0.00%
1.30%
100.00%
100.00%
Rate of Return. For the year ended June 30, 2015, the annual money-weighted rate of return on pension plan investments, net of pension plan investment expense, was 3.11%. The money-weighted rate of return expresses investment performance, net of investment expense, adjusted for the changing amounts actually invested. 4. Net Pension Liability Net components of the net pension liability of the County at June 30, 2015, were as follows:
Total Pension Liability
$256,897,829
Fiduciary net Position
207,844,150
Net Pension Liability
$ 49,053,679
Ratio of Fiduciary Net Position to Total Pension Liability
80.91%
5. Changes in the Net Pension Liability
Increase (Decrease)
Total Pension
Plan Fiduciary
Net Pension
Liability
Net Position
Liability
(a)
(b)
(a) - (b)
Balances - beginning of year
$248,009,413
$198,933,310
$49,076,103
Service cost
5,708,826
-
5,708,826 Interest
19,265,284
-
19,265,284
Changes in benefit terms
-
-
- Difference between expected and
actual experience
(2,373,423)
-
(2,373,423) Changes in assumptions
-
-
-
Contributions - employer
-
14,310,940
(14,310,940) Contributions - member
-
2,226,111
(2,226,111)
Net investment income
-
6,339,164
(6,339,164) Benefit payments, including refunds
of member contributions
(13,712,271)
(13,712,271)
- Administrative expense
-
(253,104)
253,104
Net changes
8,888,416
8,910,840
(22,424) Balances - end of year
$256,897,829
$207,844,150
$49,053,679

CHATHAM COUNTY, GEORGIA Notes to the Basic Financial Statements
D- 46
Actuarial Assumptions. The actuarial valuations use the entry age normal actuarial cost method. The Plan changed from the aggregate actuarial cost method to the entry age normal method on July 1, 2003. The Plan’s amortization method is level dollar with closed amortization periods. The equivalent single amortization period is 12 years, based on all of the current amortizations. The actuarial assumptions include a 7.8% investment rate of return (net of administrative expenses). Salary progression rates are based on actual compensation increases from 2005 to 2015. The rates range from .5% to 3% depending on age and years of service. An inflation factor of 3% is included in the assumptions for salary growth purposes. The assumptions do not include postretirement benefit increases. The actuarial value of assets was determined using techniques that smooth the effects of short-term volatility in the market value of investments over a five-year period. Gains or losses are recognized at 20% per year. The County amortized the July 1, 2003 unfunded actuarial accrued liability over 30 years (20 remaining), increases or decreases in the actuarial accrued liability due to plan amendments over 20 years, actuarial gains/losses over 15 years, and changes in the actuarial accrued liability due to assumptions changes over 30 years. Assumption changes for retired members only are amortized over 10 years. Mortality rates were based on the RP-2000 Healthy Annuitant Mortality Table projected to 2008 and updated to reflect actual large governmental plan experience through 2010. The table includes a margin for future improvement in the life expectancy. Disability mortality rates were based on the RP-2000 Disabled Retiree Mortality Table projected to 2008 and updated to reflect actual large government plan experience through 2010. The table includes a margin for future improvement in life expectancy. The valuation interest rate remained 7.8% based on analysis performed by the investment consultant. The actuarial assumptions used in the July 1, 2014 valuation were based on the results of the last actuarial experience study dated August 26, 2015. The July 1, 2014 is the actuarial valuation date upon which the total pension liability is based. The result was rolled forward using standard actuarial techniques to the measurement date. Long-term expected rate of return. Dahab Associates, investment consultants for the Chatham County Employee Retirement Plan, recommended to the Pension Board a series of rates of long-term investment return expectations. The chart below indicates the asset class, index and the long term expected returns (arithmetic averages not adjusted for inflation) for the past 20 years as of June 30, 2015.
Asset Class
Index
Long-term expected
rate of return
Large Cap Equity
Russell 1000
10.7%
Mid Cap Equity
Russell Midcap
13.1%
International Equity
MSCI ACWI Ex US
7.9%
Small Cap Equity
Russell 2000
11.6%
Fixed Income
Barclays Gov/Credit
5.7%
Inflation
CPI
3.0%
Discount rate. Based on the 39% Large Cap Equity, 8% Mid Cap Equity, 8% Small Cap Equity, 15% International Equity, and 30% Fixed Income policy target allocation of the Plan, it is expected to achieve a combined long-term return of 7.8%.

CHATHAM COUNTY, GEORGIA Notes to the Basic Financial Statements
D- 47
Projected cash flows. The projection of cash flows used to determine the discount rate assumed the County would contribute 22.97% of payroll. Chatham County has, since July 1, 2003, followed a policy of funding each year an amount at least equal to the normal cost plus an amount sufficient to amortize the unfunded actuarial accrued liability in accordance with the Public Retirement Systems Standards Law. This allows the amortization of July 1, 2003 unfunded actuarial accrued liability over 30 years, increases or decreases in actuarial accrued liability due to plan amendments over 20 years, actuarial gains/losses over 15 years, and changes in the actuarial accrued liability due to assumption changes over 30 years. If the plan amendment applies to retired members only, the change is amortized over 10 years. The resulting contribution can be reduced by prior year contributions in excess of the amount determined in accordance with the policy. Periods of projected benefit payments. Projected future benefit payments for all current plan members were projected through 2111. Sensitivity analysis. The following presents the net pension liability of the Plan, calculated using the discount rate of percent, as well as what the Plans net pension liability would be if it were calculated using a discount rate that is 1- percentage-point lower or 1-percentage-point higher than the current rate:
1% Decrease (6.8%)
Current Discount Rate
(7.8%)
1% Increase (8.8%)
Plan's Net Pension Obligation $75,941,642
$49,053,679
$26,116,237
5. Pension Liabilities, Pension Expense, and Deferred Outflows of Resources and Deferred Inflows of Resources At June 30, 2015, the County (primary government) and the Live Oak Library System (discretely presented component unit) reported their proportionate share of the net pension liability as follows:
Discretely
Presented
Primary
Component
Government
Unit
County
Library
Total pension liability
$ 244,341,197
$489,187
Plan fiduciary net postion
197,685,160
395,778
Proportionate share of net pension liability
$ 46,656,037
$ 93,409 The County’s and Library’s proportion of the net pension liability was based on the historical employer contributions. At June 30, 2015 the County’s and Library’s proportion was 95.112208% and .190421% respectively which was an increase for the County of .727956 and a decrease for the Library of .006073 from its proportion measured as of June 30, 2014. For the year ended June 30, 2015, the County and Library recognized pension expense of $8,467,354 and $16,326, respectively. Each employer reported its proportion of deferred outflows of resources and deferred inflows of resources related to pensions from the following sources:

CHATHAM COUNTY, GEORGIA Notes to the Basic Financial Statements
D- 48
Deferred Outflows
Deferred Inflows
of Resources
of Resources
Discretely
Discretely
Presented
Presented
Primary
Component
Primary
Component
Government
Unit
Government
Unit
County
Library
County
Library
Differences between expected and actual -
-
$1,874,804
3,753
experience Net difference between projected and
actual
earnings on pension plan investments
7,058,122
14,132
-
-
Changes in proportion
296,701
-
-
2,475
Proportionate share of net position
$7,354,823
$14,132
$1,874,804
$6,228
Amounts reported as deferred outflows of resources and deferred inflows of resources related to pensions will be recognized in pension expense as follows:
Year ended June 30:
Primary Government County
Discretely Presented Component Unit - Library
2016
$ 1,442,468
$ 2,262 2017
1,442,468
2,262
2018
1,442,468
2,262 2019
1,442,470
2,262
2020
(289,855)
(1,144)
$ 5,480,019
$ 7,904
B. Georgia Emergency Management Agency Retirement Plan (GEMARP)
For purposes of measuring the net pension liability, deferred outflows of resources and deferred inflows of resources related to pensions, and pension expense, information about the fiduciary net position of the Georgia Emergency Management Agency Retirement Plan (GEMARP), and additions to/deductions from fiduciary net position have been determined on the same basis as they are reported by GEMARP. For this purpose, benefit payments (including refunds of employee contributions) are recognized when due and payable in accordance with the benefit terms. Investments are reported at fair value.
1. Plan Description
The Georgia Municipal Employees Benefit System (GMEBS) administers the various retirement systems and retirement programs. The GEMARP is a cost–sharing multiple-employer defined benefit pension plan as defined in Governmental Accounting Standards Board (GASB) Statement No. 67, Financial Reporting for Pension Plans. Employers’ proportionate shares were calculated on the basis of recommended employer contributions. Although GASB 68 encourages the use of the employer’s projected long-term contribution effort to the retirement plan, allocating on the basis of employer contributions is considered acceptable.

CHATHAM COUNTY, GEORGIA Notes to the Basic Financial Statements
D- 49
The GMEBS issues a publicly available financial report that includes financial statements and required supplementary information for GMEBS. That report may be obtained by writing to GMEBS, 201 Pryor St. S.W., Atlanta, Georgia 30303.
2. Membership
Participation in the Plan is considered mandatory for all eligible employees who satisfy the eligibility conditions specified in the adoption agreement.
3. Benefits Provided
Benefits are fully vested after 5 years of service. Participants become eligible to retire at age 62, with 5 years or age 55 with 10 years of participation in the plan with reduced benefits. Upon eligibility to retire, generally participants are entitled to an annual benefit in the amount of 1.00% of final average earnings up to a participant’s amount of covered compensation, plus 1.75% of final average earnings in excess of the participant’s covered compensation, all multiplied by the participant’s years of total credited service.
4. Contributions The County’s policy is to contribute the actuarially determined amount as recommended by GMEBS. The Board of Trustees of GMEBS has adopted an actuarial funding policy for determination of annual contributions and the systematic funding of liabilities arising under the plan. The annual recommended contribution is the sum of 1) the normal cost, 2) the closed level dollar amortization of the unfunded actuarial accrued liability over a period that ranges from 10 to 30 years based on the funding policy adopted by the GMEBS Board of Trustees, and 3) interest on these amounts from the valuation date to the date contributions are paid (assumed monthly). Ongoing plans in compliance with GMEBS funding policy are ultimately projected to have no unfunded benefits under this amortization method. Plans where the unfunded liability is not projected to be fully amortized have special funding rules apply such that the unfunded liability is ultimately projected to decline to zero. The recommended contribution is 11.27% of expected payroll. The required contribution amount is invoiced to CEMA on a quarterly basis. The quarterly amount for fiscal year 2015 was $12,058.
5. Pension Liabilities, Pension Expense, and Deferred Outflows of Resources and Deferred Inflows of Resources Related to Pensions
At June 30, 2015, CEMA reported a liability of $629,695 for its proportionate share of the net pension liability. The net pension liability was measured as of March 31, 2015, and the total pension liability used to calculate the net pension liability was determined by an actuarial valuation as of July 1, 2015. CEMA’s proportion of the net pension liability was based on the recommended employer contributions. At June 30, 2015, CEMA’s proportion was 43.7554 percent.

CHATHAM COUNTY, GEORGIA Notes to the Basic Financial Statements
D- 50
Changes in the net pension liability:
Increase (Decrease)
Total Pension
Plan Fiduciary
Net Pension
Liability
Net Position
Liability
(a)
(b)
(a) - (b)
Balances - beginning of year
$ 1,841,256
$ 1,234,088
$ 607,168
Service cost
18,996
-
18,996 Interest
137,879
-
137,879
Changes in benefit terms
-
-
- Difference between expected and
actual experience
12,537
-
12,537 Changes in assumptions
-
-
-
Contributions - employer
-
34,492
(34,492) Contributions - member
-
-
-
Net investment income
-
92,062
(92,062) Benefit payments, including refunds
of member contributions
(124,389)
(124,389)
- Administrative expense
-
(3,735)
3,735
Other
(24,066)
-
(24,066)
Net changes
20,957
(1,570)
22,527 Balances - end of year
$ 1,862,213
$ 1,232,518
$ 629,695
For the year ended June 30, 2015, CEMA recognized pension expense of $62,820. At June 30, 2015, the District reported deferred outflows of resources and deferred inflows of resources related to pensions from the following sources:
Deferred DeferredOutflows of Inflows ofResources Resources
Differences between expected and actual experience 6,269$ -$
Net difference between projected and actualinvestment earnings - 39
Changes in assumptions - 12,033
Contributions subsequent to the measurement date 12,058
Total 18,327$ 12,072$

CHATHAM COUNTY, GEORGIA Notes to the Basic Financial Statements
D- 51
$12,058 reported as deferred outflows of resources related to pensions resulting from CEMA contributions subsequent to the measurement date will be recognized as a reduction of the net pension liability in the year ended June 30, 2016. Other amounts reported as deferred outflows of resources and deferred inflows of resources will be recognized in pension expense as follows: Measurement period ending June 30,
2016 (5,775)$ 2017 (10) 2018 (9) 2019 (9)
Net Balance of deferred outflows/(inflows) of resources (5,803)$
6. Actuarial Assumptions and Methods
Actuarial valuations involved estimates of the reported amounts and assumptions about the probability of occurrence of events far into the future. Examples include assumptions about future employment, mortality, and future salary increases. Amounts determined during the valuation process are subject to continual revision as actual results are compared with past expectations and new estimates are made about the future. The mortality an economic actuarial assumptions used in the July 1, 2015 valuation were approved by the Board in December, 2014 based on the results of an actuarial experience study for the period January 1, 2010 throught June 30, 2014 conducted by the actuary.
Actuarail Cost method Entry Age Actuarial assumptions: Investment rate of return 7.75% Projected salary increases Service based merit increases Inflation rate 3.25% Benefit Adjustments 2.00% Mortality rates were based on the RP-2000 Combined Healthy Mortality Table with sex-distinct rates, set forward two years for males and one year for females. RP-2000 Disabled Retiree Mortality Table with sex-distinct rates was used for disabled beneficiaries.
7. Long-Term Expected Rate of Return
The long-term expected rate of return on pension plan investments was determined using a building-block method in which best-estimate ranges of expected future real rates of return (expected returns, net of pension plan investment expense and inflation) are developed for each major asset class. These ranges are combined to produce the long-term expected rate of return by weighting the expected future real rates of return by the target asset allocation percentage and by adding expected inflation. The difference between the resulting rate and the rate on the ongoing basis is a margin for adverse deviation. Best estimates of arithmetic real rates of return for each major asset class included in the pension plan’s target asset allocation as of March 31, 2015 are summarized in the following table:

CHATHAM COUNTY, GEORGIA Notes to the Basic Financial Statements
D- 52
Long TermTarget Long Term ExpectedAsset Expected Nominal Real
Asset Class Allocation Rate of Return Rate of Return
Domestic equity 50.0% 5.95% 9.20%International equity 15.0% 6.45% 9.70%Fixed income 25.0% 1.55% 4.80%Real estate 10.0% 3.75% 7.00%Cash 0.0%
Total 100.0%
8. Discount Rate
The discount rate used to measure the total pension liability was 7.75 percent. The projection of cash flows used to determine the discount rate assumed that contributions from participating employers will be made based on the actuarially determined rates. Based on those assumptions, the fiduciary net position was projected to be available to make all projected future benefit payments of current plan members. Therefore, the long-term expected rate of return on pension plan investments was applied to all periods of projected benefit payments to determine the total pension liability. 9. Sensitivity of the Proportionate Share of the Net Pension Liability to Changes in the Discount Rate The following table represents the collective net pension liability of the participating employers calculated using the discount rate of 7.75 percent, as well as what employers’ net pension liability would be if it were calculated using a discount rate that is 1.00 percent lower (6.75 percent) or 1.00 percent higher (8.75 percent) than the current rate:
1% Decrease (6.75%)
Discount Rate (7.75%)
1% Increase (8.75%)
Proportionate share of the net pension liability 795,457$ 629,692$ 487,284$
C. Pensions with a Special Funding Situation: The following pension plans are all cost-sharing, multiple employer defined benefit plans. Below is a list of the plans presented:
Employees Retirement System - (ERS)Georgia Judicial Retirement System - (GJRS)Sheriffs’ Retirement Fund of Georgia - (SRFG)Judges of the Probate Courts Retirement Fund of Georgia - (JPCRF)Magistrates Retirement Fund of Georgia - (MRF) Peace Officers’ Annuity and Benefit Fund of Georgia - (POAB)
The employer contributions are funded by the State on behalf of the local county employer. Since the County does not contribute directly to the plans, there is no net pension liability or deferred inflows or outflows to report in the financial statements of the County. GASB Statement No. 68, Accounting and Financial Reporting for Pensions requires participating employers and nonemployers contributing entities to recognize their proportional share of collective net pension liability and pension expense. The following table summarizes the proportional share of the collective net pension liability for each of the plans.

CHATHAM COUNTY, GEORGIA Notes to the Basic Financial Statements
D- 53
ERS GJRS SRFG JPCRF MRF POAB Total
County's proportionate share ofthe collective net pension liability -$ -$ -$ -$ -$ -$ -$
State's proportionate share of thecollective net pension liabilityassociated with the County (709,232) 124,539 (116,505) (74,064) (252,127) (1,027,389)
Chatham County State Court 2,079,680 2,079,680 Chatham County Tax Officials 1,342,009 1,342,009
Total net pension liability (asset) 3,421,689$ (709,232)$ 124,539$ (116,505)$ (74,064)$ (252,127)$ 2,394,300$
Pension revenue and expensefor State support 368,329$ (67,373)$ 13,029$ (54,638)$ (22,564)$ (9,336)$ 227,447$
The basic financial statements for all of the pension plans are prepared on the accrual basis of accounting. Contributions from the employers, nonemployers, and members are recognized when due, based on statutory requirements. Benefit payments (including refunds of employee contributions) are recognized when due and payable in accordance with the benefit terms.
Sensitivity of the State’s proportionate share of the net pension liability to changes in the discount rate. The following presents the State’s proportionate share of the net pension liability (asset) calculated using the discount rate in the table, as well as what the State’s proportionate share of the net pension liability (asset) would be if it were calculated using a discount rate that is 1-percentage point lower or 1-percentage-point higher than the current rate:
CurrentDiscount 1% Discount 1%
Pension Plan: Rate Decrease Rate Increase
ERS 7.50% 4,989,501 3,421,689 2,087,115 GJRS 7.50% (226,235) (709,232) (1,128,444) SRFG 6.50% 197,018 124,539 63,177 JPCRF 7.00% (80,174) (116,505) (147,679) MRF 7.00% N/A (74,064) N/APOAB 7.00% 554,747 (241,470) (932,010)
N/A - the information is not readily available
Net Pension Liability (Asset)
General Information about the Pension Plans Each plan and fund, including benefit and contribution provisions, was established and can be amended by state law. The following summarizes authorizing legislation and the plan descriptions of each retirement fund: 1. Employees Retirement System (ERS). The ERS was established by the Georgia General Assembly during the 1949 Legislative Session for the purpose of providing retirement allowances for employees of the State of Georgia and its political subdivisions. Detailed information about the pension plan’s fiduciary net position is available in the separately issued Employees’ Retirement System of Georgia financial report at www.ers.ga.gov. Benefits provided. Retirement benefits paid to members are based upon the monthly average of the member’s highest 24 consecutive calendar months, multiplied by the number of years of creditable service, multiplied by the applicable benefit factor. Annually, postretirement cost-of-living adjustments may also be made to members’ benefits, provided the members were hired prior to July 1, 2009. The normal retirement pension is payable monthly for life; however, options are available for distribution of the member’s monthly pension, at reduced rates, to a designated beneficiary upon the member’s death. Death and disability benefits are also available through ERS.
CHATHAM COUNTY, GEORGIA Notes to the Basic Financial Statements
D- 54
Contributions and Vesting. Member contributions under the old plan are 4% of annual compensation, up to $4,200, plus 6% of annual compensation in excess of $4,200. Under the old plan, the state pays member contributions in excess of 1.25% of annual compensation. Under the old plan, these state contributions are included in the members’ accounts for refund purposes and are used in the computation of the members’ earnable compensation for the purpose of computing retirement benefits. Member contributions under the new plan and GSEPS are 1.25% of annual compensation. The state is required to contribute at a specified percentage of active member payrolls, determined annually by actuarial valuation. The state contributions are not at any time refundable to the member or his/her beneficiary. Members become vested after ten years of membership service. Upon termination of employment, member contributions with accumulated interest are refundable upon request by the member. However, if an otherwise vested member terminates and withdraws his/her member contribution, the member forfeits all rights to retirement benefits. The net pension liability was measured as of June 30, 2014, and the total pension liability used to calculate the net pension liability was determined by an actuarial valuation as of June 30, 2013. An expected total pension liability is determined as of June 30, 2014 using standard roll-forward techniques. The roll forward calculation adds the annual normal cost (also called service cost), subtracts the actual benefit payments and refunds for the plan year, and then applies the expected investment rate of return for the year. Actuarial assumptions. The total pension liability was determined by an actuarial valuation as of June 30, 2013. Using the following actuarial assumptions, applied to all periods included in the measurement: Inflation 3.0%Salary increases 5.45-9.25%, including inflationInvestment rate of return 7.50%, net of pension plan investment expense,
including inflation Mortality rates were based on the RP-2000 Combined Mortality Table for the period after service retirement, for dependent beneficiaries, and for deaths in active service, and the RP-2000 Disabled Mortality Table set back eleven years for males for the period after disability retirement. The actuarial assumptions used in the June 30, 2013 valuation were based on the results of an actuarial experience study for the period July 1, 2004 – June 30, 2009. The long-term expected rate of return on pension plan investments was determined using a log-normal distribution analysis in which best-estimate ranges of expected future real rates of return (expected nominal return, net of pension plan investment expense and the assumed rate of inflation) are developed for each major asset class. These ranges are combined to produce the long-term expected rate of return by weighting the expected future real rates of return by the target asset allocation percentage and by adding expected inflation. Discount rate. The discount rate used to measure the total pension liability was 7.50 percent. The projection of cash flows used to determine the discount rate assumed that plan member contributions will be made at the current contribution rate, contributions from employers will be made at rates equal to the difference between actuarially determined contribution rates and the member rate. Based on those assumptions, the pension plan’s fiduciary net position was projected to be available to make all projected future benefit payments of current plan members. Therefore, the long-term expected rate of return on pension plan investments was applied to all periods of projected benefit payments to determine the total pension liability. 2. Georgia Judicial Retirement System (GJRS) The GJRS was established by the Georgia General Assembly in 1998 for the purpose of providing retirement allowances for judges and solicitors generals of the state courts and juvenile court judges in Georgia, and their survivors and other beneficiaries, superior court judges of the state of Georgia, and district attorneys of the state of Georgia. Detailed information about the pension plan’s fiduciary net position is available in the separately issued Employees’ Retirement System of Georgia financial report that can be obtained at www.ers.ga.gov. Benefits provided. The normal retirement of GJRS is age 60, with 16 years of creditable service; however, a member may retire at age 60 with a minimum of 10 years of creditable service. Annual retirement benefits paid to members are computed as 66 2/3% of state paid salary at retirement for district attorneys and superior court judges and 66 2/3% of the average over 24 consecutive months for trial judges and solicitors, plus 1% for each year of credited service over 16 years, not to exceed 24 years. Early retirement benefits paid to members are

CHATHAM COUNTY, GEORGIA Notes to the Basic Financial Statements
D- 55
computed as the pro rata portion of the normal retirement benefit, based on service not to exceed 16 years. Death, disability, and spousal benefits are also available. Contributions and Vesting. Members are required to contribute 7.5% of their annual salary. Those who became members prior to July 1, 2012 must also contribute an additional 2.5% of their annual salary if spousal benefit is elected. Employer contributions are actuarially determined and approved and certified by the GJRS Board of Trustees. Pursuant to O.C.G.A. 47-23-81 the employer contributions of state court judges and solicitors are funded by the State of Georgia on behalf of the local county employers and pursuant to O.C.G.A 47-23-82 the employer contributions for juvenile court judges are funded by the State on behalf of local county employers. Employer and nonemployer contributions required for fiscal year 2014 were based on the June 30, 2011 actuarial valuation. Members become vested after ten years of creditable service. Upon termination of employment, member contributions with accumulated interest are refundable upon request by the member. However, if an otherwise vested member terminates and withdraws his/her member contributions, the member forfeits all rights to retirement benefits. The net pension liability was measured as of June 30, 2014, and the total pension liability used to calculate the net pension liability was determined by an actuarial valuation as of June 30, 2013. An expected total pension liability is determined as of June 30, 2014 using standard roll-forward techniques. The roll forward calculation adds the annual normal cost (also called service cost), subtracts the actual benefit payments and refunds for the plan year, and then applies the expected investment rate of return for the year. Actuarial assumptions. The total pension liability was determined by an actuarial valuation as of June 30, 2013. Using the following actuarial assumptions, applied to all periods included in the measurement:
Inflation 3.0%Salary increases 6.00%, including inflationInvestment rate of return 7.50%, net of pension plan investment expense,
including inflation
Mortality rates were based on the RP-2000 Combined Mortality Table for the period after service retirement, for dependent beneficiaries, and for deaths in active service, and the RP-2000 Disabled Mortality Table set back eleven years for males for the period after disability retirement. The actuarial assumptions used in the June 30, 2013 valuation were based on the results of an actuarial experience study for the period July 1, 2004 – June 30, 2009. The long-term expected rate of return on pension plan investments was determined using a log-normal distribution analysis in which best-estimate ranges of expected future real rates of return (expected nominal return, net of pension plan investment expense and the assumed rate of inflation) are developed for each major asset class. These ranges are combined to produce the long-term expected rate of return by weighting the expected future real rates of return by the target asset allocation percentage and by adding expected inflation. Discount rate. The discount rate used to measure the total pension liability was 7.50 percent. The projection of cash flows used to determine the discount rate assumed that plan member contributions will be made at the current contribution rate, contributions from employers will be made at rates equal to the difference between actuarially determined contribution rates and the member rate. Based on those assumptions, the pension plan’s fiduciary net position was projected to be available to make all projected future benefit payments of current plan members. Therefore, the long-term expected rate of return on pension plan investments was applied to all periods of projected benefit payments to determine the total pension liability.
3. Sheriffs’ Retirement Fund of Georgia (SRFG): The Sheriffs' Retirement Fund of Georgia (the Fund) was created in 1963 by an act of the Georgia Legislature (the Act) to provide retirement benefits for sheriffs who qualify under the Act. Each of the 159 counties in the state of Georgia has a sheriff who is eligible to be a member of the Fund. Detailed information about the pension plan’s fiduciary net position is available in the separately issued Sheriffs’ Retirement Fund of Georgia financial report that can be obtained at www.georgiasheriffs.org.

CHATHAM COUNTY, GEORGIA Notes to the Basic Financial Statements
D- 56
Benefits provided. SRFG provides retirement as well as death benefits. Benefit provisions are established by statute and may be amended only by the General Assembly of Georgia. A member must have terminated his or her service as sheriff to receive benefits. The monthly benefit is a single life annuity payable in monthly payments for the life of a member. The maximum monthly payment at June 30, 2014 is equal to $140.18 per month (plus 1/12 of this amount for each month of any partial year) for each full year of creditable service up to a maximum of $4,205.40 per month. The Board of Commissioners is authorized to provide for increases effective as of January 1 and July 1 of each year up to 11/2% of the maximum monthly retirement benefit then in effect. Contributions and Vesting. Normal retirement is at age 55 provided the member has at least four years of credited service as a sheriff after and including January 1, 1961. The credited service requirement is eight years for a sheriff who first or again becomes an active member on or after July 1, 1988. SRFG is funded by member and nonemployer contributing entity contributions. Contribution provisions are established by statue and may be amended only by the General Assembly of Georgia. Member contribution requirements are set forth in Official Code of Georgia Annotated (O.C.G.A.) 47-16-43 and are not actuarially determined. Each member must contribute $45 per month, to be paid no later than the tenth day of each month, with a maximum payment period of thirty years. Nonemployer contributions consist of court fines and forfeitures collected and remitted by the courts directly to SRFG in accordance with O.C.G.A. 47-16-60 and 47-16-61. These court fines and forfeitures are considered to be made by the State of Georgia as the nonemployer contributing entity. For each criminal and quasi-criminal case involving the violation of State of Georgia laws, county ordinances, or municipal ordinances, a sum based upon the scale set forth below is collected and remitted to SRFG. For fines or bond forfeitures in excess of $5, in any court where a sheriff of a superior court acts as a sheriff the fee is $2. In addition, the amounts required to be collected by the applicable courts and remitted to SRFG are for civil actions, cases or proceedings filed in superior courts is $1. For civil actions, cases or proceedings filed in state courts and magistrate courts where a sheriff of the superior courts acts as a sheriff in those courts is $1. The net pension liability was measured as of June 30, 2014, and the total pension liability used to calculate the net pension liability was determined by an actuarial valuation as of June 30, 2014. Actuarial assumptions. The total pension liability was determined by an actuarial valuation as of June 30, 2014, using the following actuarial assumptions, applied to all periods included in the measurement:
Inflation 3.0%Salary increases N/AInvestment rate of return 6.50%, net of pension plan investment expense,
including inflation
Mortality rates were based on the 1983 Group Annuity Mortality Table for the period after retirement, for dependent beneficiaries, and for deaths in active service. The actuarial assumptions used in the June 30, 2014 valuation were based on the results of the most recent actuarial experience study. The long-term expected rate of return on pension plan investments was determined using a log-normal distribution analysis in which best-estimate ranges of expected future real rates of return (expected returns, net of pension plan investment expense and the assumed rate of inflation) are developed for each major asset class. These ranges are combined to produce the long-term expected rate of return by weighting the expected future real rates of return by the target asset allocation percentage and by adding expected inflation. Discount rate. The discount rate used to measure the total pension liability was 6.50 percent. The projection of cash flows used to determine the discount rate assumed that plan member contributions (dues) will be made at the current contribution rate, contributions from nonemployers (from court fines and forfeitures) will continue to be made at the current rates. Based on those assumptions, the pension plan’s fiduciary net position was projected to be available to make all projected future benefit payments of current plan members. Therefore, the long-term expected rate of return on pension plan investments was applied to all periods of projected benefit payments to determine the total pension liability.

CHATHAM COUNTY, GEORGIA Notes to the Basic Financial Statements
D- 57
4. Judges of the Probate Courts Retirement Fund of Georgia (JPCRF) Plan description. The Judges of the Probate Courts Retirement Fund of Georgia (Fund) was created in 1958 by the General Assembly of Georgia for the purpose of paying retirement benefits to judges of the probate courts of the State of Georgia. Detailed information about the pension plan’s fiduciary net position is available in the separately issued Judges of the Probate Courts Retirement Fund of Georgia financial report that can be obtained at www.pjrf.georgia.gov. Benefits provided. JPCRF provides retirement as well as death benefits. Benefit provisions are established by statute and may be amended only by the General Assembly of Georgia. A member must have terminated his or her service as official capacity as a judge of probate court or as an employee of the Board of Commissioners to receive benefits. Members approved for retirement benefits prior to July 1, 1996, are paid a monthly benefit equal to 5% of his or her average monthly net earnings (subject to a salary cap) for each year served up to, but not exceeding, a total of 20 years, with exceptions. The benefit for members approved for retirement benefits on or after July 1, 1996, is equal to 5% of his or her final monthly net earnings (subject to a salary cap) for each year served up to, but not exceeding, a total of 20 years with exceptions. The Board is authorized to provide for increase in benefits being paid up to 1.5% in a six month period and can increase the salary caps in effect up to 3% annually. These benefits are payable for the lifetime of the member. Members may elect, as an alternate to the benefit described above, to receive an actuarially reduced benefit in the form of a Joint and Survivor Annuity. Contributions and Vesting. Members prior to July 1, 1995, are eligible for retirement at age 60 and must have served at least four years as a regularly qualified and commissioned probate judge, secretary-treasurer or qualified employee of the Board of Commissioners of the Fund. Members on or after July 1, 1995, are eligible for retirement at age 60 and must have served at least eight years. SRFG is funded by member and nonemployer contributing entity contributions. Contribution provisions are established by statue and may be amended only by the General Assembly of Georgia. Member contribution requirements are set forth in Official Code of Georgia Annotated (O.C.G.A.) 47-11-40 and are not actuarially determined. Each member must contribute $105 per month with a maximum payment period of twenty years. Nonemployer contributions consist of court fines, forfeitures and fees collected and remitted by the courts directly to JPCRF in accordance with O.C.G.A. 47-11-50 and 47-11-51. These court fines, forfeitures and fees are considered to be made by the State of Georgia as the nonemployer contributing entity. For each criminal and quasi-criminal case involving the violation of State of Georgia traffic laws which is before a judge of the probate court and in which case a fine is collected or a bond is forfeited, $3.00 is collected and paid to JPCRF. For fees associated with various services, the applicable fees are collected and paid to JPCRF are $2 for civil filings, 20% of fee for marriage licenses and $1 for pistol licenses. The net pension liability was measured as of June 30, 2014, and the total pension liability used to calculate the net pension liability was determined by an actuarial valuation as of June 30, 2014. Actuarial assumptions. The total pension liability was determined by an actuarial valuation as of June 30, 2014, using the following actuarial assumptions, applied to all periods included in the measurement: Inflation 3.0%Salary increases N/AInvestment rate of return 7.00%, net of pension plan investment expense,
including inflation Mortality rates were based on the RP 2014 Healthy Mortality Table with generational mortality projection using Scale MP 2014 healthy lives and the RP 2014 Disabled Retiree Mortality Table with generational mortality projection using Scale MP 2014 for disabled lives. The actuarial assumptions used in the June 30, 2014 valuation were based on the results of the most recent actuarial experience study. The long-term expected rate of return on pension plan investments was calculated by the Fund’s investment manager as 6.66% using a Monte Carlo simulation in which best-estimate ranges of expected future real rates of return (expected nominal returns, net of pension plan investment expense and the assumed rate of inflation) are

CHATHAM COUNTY, GEORGIA Notes to the Basic Financial Statements
D- 58
developed for each major asset class. These ranges are combined to produce the long-term expected rate of return by weighting the expected future real rates of return by the target asset allocation percentage. The Fund’s administrator determined that 7.00% was a reasonable assumption for the long-term rate of return on plan assets based on the calculation by the Fund’s investment manager. Discount rate. The discount rate used to measure the total pension liability was 7.00 percent. The projection of cash flows used to determine the discount rate assumes revenues will remain level. Based on those assumptions, the pension plan’s fiduciary net position was projected to be available to make all projected future benefit payments of current plan members. Therefore, the long-term expected rate of return on pension plan investments was applied to all periods of projected benefit payments to determine the total pension liability. 5. Magistrates Retirement Fund of Georgia (MRF) The Magistrates Retirement Fund of Georgia (Fund) was created in 2006 by the General Assembly of Georgia for the purpose of paying retirement benefits to chief magistrates of the magistrate courts of the State of Georgia. Detailed information about the pension plan’s fiduciary net position is available in the separately issued Magistrates Retirement Fund of Georgia financial report that can be obtained at www.mrf.georgia.gov . Benefits provided: The Member shall be paid a monthly sum equal to 4% of his or her average final monthly compensation for each year served by the member up to, but not exceed, a total of 20 years; provided, however that the final annual compensation used for calculating a benefit shall not exceed $42,781.22 or the amount fixed in the following schedule according to county population, whichever amount is higher:
Contributions and Vesting. In order for a Member to be eligible for benefits, he or she must have served as a regularly qualified and commissioned Chief Magistrate or as the Secretary-Treasurer and have been a member of the retirement fund for at least eight (8) years; fully complied with OCGA §47-25-1 et seq; terminated his or her official capacity as a Chief Magistrate or the Secretary-Treasurer; attained the age of 60 years; filed with the board his or her application for such retirement within a period of 90 days or as soon thereafter as possible, after reaching the age of 60 years or after termination of his or her official capacity as a Chief Magistrate or as the Secretary-Treasurer, whichever may occur last in point of time; and had his or her application for retirement approved by the Board. Once accepted for membership, a Member must pay dues on or before the 10th day of the month. Dues are 3.42% of the monthly base as established in O.C.G.A.§47-25-81(a). The net pension liability was measured as of June 30, 2014, and the total pension liability used to calculate the net pension liability was determined by an actuarial valuation as of June 30, 2014. Maximum average compensation used to calculate retirement benefits changed from a uniform maximum of $42,781 to maximums that vary according to the county’s population. In addition, part-time chief magistrates are eligible to participate in the plan effective July 1, 2014. No past service benefits were granted to these members. The increase in the collective total pension liability resulting from these changes is included in pension expense in the current period. Actuarial assumptions. The collective total pension liability was determined by an actuarial valuation as of June 30, 2014, using the following actuarial assumptions, applied to all periods included in the measurement:
Inflation 3.0%Salary increases N/AInvestment rate of return 7.00%, net of pension plan investment expense,
including inflation Mortality rates were based on the RP 2014 Healthy Mortality Table with generational mortality projection using Scale MP 2014 healthy lives and the RP 2014 Disabled Retiree Mortality Table with generational mortality projection using Scale MP 2014 for disabled lives. The actuarial assumptions used in the June 30, 2014 valuation were based on the results of the most recent actuarial experience study. The long-term expected rate of return on pension plan investments was calculated by the Fund’s investment manager as 6.43% using a Monte Carlo simulation in which best-estimate ranges of expected future real rates of

CHATHAM COUNTY, GEORGIA Notes to the Basic Financial Statements
D- 59
return (expected nominal returns, net of pension plan investment expense and the assumed rate of inflation) are developed for each major asset class. These ranges are combined to produce the long-term expected rate of return by weighting the expected future real rates of return by the target asset allocation percentage. The Fund’s administrator determined that 7.00% was a reasonable assumption for the long-term rate of return on plan assets based on the calculation by the Fund’s investment manager. Discount rate. The discount rate used to measure the total pension liability was 7.00 percent. The projection of cash flows used to determine the discount rate assumes revenues will remain level. Based on those assumptions, the pension plan’s fiduciary net position was projected to be available to make all projected future benefit payments of current plan members. Therefore, the long-term expected rate of return on pension plan investments was applied to all periods of projected benefit payments to determine the total pension liability. 6. Peace Officers’ Annuity and Benefit Fund of Georgia (POAB): The Peace Officers’ Annuity and Benefit Fund of Georgia (Fund) was created in 1950 by the General Assembly of Georgia to provide retirement benefits to peace officers. Detailed information about the pension plan’s fiduciary net position is available in the separately issued Peace Officers’ Annuity and Benefit Fund of Georgia financial report that can be obtained at www.poab.georgia.gov .
Benefits provided. POAB provides retirement as well as death benefits. Title 47 of the O.C.G.A assigns the authority to establish and amend the provisions of the fund to the State Legislature. A member must have terminated his or her active employment as a peace officer to receive benefits. The monthly benefit is a single life annuity payable in monthly payments for the life of the member only. The monthly payment amount at June 30, 2014, was $24.41 per month (plus 1/12 of this amount for each month of any partial year) for each full year of creditable service up to a maximum of 30 years of total service. The Board of Trustees is authorized to provide for increase effective as of January 1 and July 1 of each year up to 1.5% of the maximum monthly retirement benefit then in effect. Members may elect, as an alternate to the benefit described above, to receive a 100% joint life annuity payable during the life of the member of the member’s spouse, or a contingency life annuity with a 50% monthly payment to the surviving spouse. The amount of the benefit for these options is an actuarially reduced portion of the single life annuity benefit described above. Contributions and Vesting. A member is eligible to receive retirement benefits with 30 years of service, regardless of age. A member is also eligible to receive retirement benefits at age 55 with 10 years of service; however, members joining on or after July 1, 2010, must have 15 years of sevice to be eligible for benefits. A member must have terminated his or her active employment as a peace officer to receive benefits. POAB is funded by member and nonemployer contributing entity contributions. Contribution provisions are established by statue and may be amended only by the General Assembly of Georgia. Member contribution requirements are set forth in Official Code of Georgia Annotated (O.C.G.A.) 47-17-44 and are not actuarially determined. Each member must contribute $20 per month, to be paid no later than the tenth day of each month. Nonemployer contributions consist of court fines and forfeitures collected and remitted by the courts directly to POAB in accordance with O.C.G.A. 47-17-60. These court fines and forfeitures are considered to be made by the State of Georgia as the nonemployer contributing entity The net pension liability was measured as of June 30, 2014, and the total pension liability used to calculate the net pension liability was determined by an actuarial valuation as of June 30, 2014. Actuarial assumptions. The collective total pension liability was determined by an actuarial valuation as of June 30, 2014, using the following actuarial assumptions, applied to all periods included in the measurement:
Inflation 3.0%Salary increases N/AInvestment rate of return 7.00%, net of pension plan investment expense,
including inflation Mortality rates were based on the RP-2000 Combined Healthy Mortality Table with blue collar adjustment projected on a fully generational mortality basis using Scale AA for healthy lives and the RP 2000 Disabled Mortality Table for disabled lives. The actuarial assumptions used in the June 30, 2014 valuation were based on the results of the most recent actuarial experience study.

CHATHAM COUNTY, GEORGIA Notes to the Basic Financial Statements
D- 60
The long-term expected rate of return on pension plan investments was calculated by the Fund’s investment manager as 6.66% using a Monte Carlo simulation in which best-estimate ranges of expected future real rates of return (expected nominal returns, net of pension plan investment expense and the assumed rate of inflation) are developed for each major asset class. These ranges are combined to produce the long-term expected rate of return by weighting the expected future real rates of return by the target asset allocation percentage. The Fund’s administrator determined that 7.00% was a reasonable assumption for the long-term rate of return on plan assets based on the calculation by the Fund’s investment manager. Discount rate. The discount rate used to measure the total pension liability was 7.00 percent. The projection of cash flows used to determine the discount rate assumes revenues will remain level. Based on those assumptions, the pension plan’s fiduciary net position was projected to be available to make all projected future benefit payments of current plan members. Therefore, the long-term expected rate of return on pension plan investments was applied to all periods of projected benefit payments to determine the total pension liability. D. Post-employment Benefits Other Than Pensions (OPEB) The County maintains a single-employer defined benefit OPEB plan (the Chatham County OPEB Plan) to provide medical and life insurance benefits to its retirees. 1. Summary of Significant Accounting Policies: Basis of Accounting - The County has implemented the requirements of Statements 43 and 45 of the Governmental Accounting Standards Board on a prospective basis to the basic financial statements presented herein, and, accordingly, no net OPEB liability existed at the transition date. Financial statements for the Plan are prepared using the accrual basis of accounting. Plan member contributions are recognized in the period in which the contributions are due. Employer contributions to the Plan are recognized when due. Benefits and claims are recognized when due and payable in accordance with the terms of the plan. Method Used to Value Investments - Investments are reported at fair value. Short term investments are reported at cost, which approximates fair value. Securities traded on a national or international exchange are valued at the last reported sales price at current exchange rates. Investments that do not have an established market are reported at estimated fair value. 2. Plan Description The Chatham County OPEB Plan is a single-employer defined benefit plan that provides medical and life insurance benefits upon retirement to the County’s retirees and their spouses and/or dependents. Retirees may chose from two medical plans administered by Blue Cross Blue Shield of Georgia. Medicare eligible retirees receive secondary coverage through the County. The County also provides a life insurance benefit of $10,000 for all retirees. Participation in the Plan is voluntary. Benefit levels, contribution rates and eligibility provisions of the Plan are determined by the Chatham County Board of Commissioners. The Plan does not provide for automatic or ad hoc postretirement benefit increases. Membership of the plan consisted of the following as of July 1, 2014, the last full valuation date: Retirees and beneficiaries currently receiving benefits 557 Active plan participants 1,426 Total 1,983

CHATHAM COUNTY, GEORGIA Notes to the Basic Financial Statements
D- 61
For the plan year, eligibility for life insurance and retiree medical coverage was available upon retirement upon attainment of any one of the following age and service combinations:
Law Enforcement &
Emergency Medical
Service Employees General Employees
Age 55 with any service, or Age 62 with any service, or
Age 50 & 15 years of service, or Age 55 & 10 years of service, or
Any age with 25 years of service. Any age with 25 years of service.
The County administers the Plan, and the County’s responsibility includes claims administration and general administration. The County’s General Fund bears most of the administrative costs of the Plan. The Plan is actuarially evaluated every two years. Calculations are based on benefits provided and in effect at the valuation date and the pattern of cost-sharing in place between the County and its plan members.
3. Investments Investment authority for the Plan is the responsibility of the County’s Pension Board through an agreement between the Pension Board and the Chatham County Board of Commissioners. In March 2008, the Chatham County Board of Commissioners established a trust under Section 115 of the United States Internal Revenue Code to further the Board’s purpose of providing adequate funding for post-retirement benefits. The Board also entered into an agreement granting the Pension Board investment authority over the assets of the trust. Activities of the Plan are reported on the County’s Comprehensive Annual Financial Report as a Trust Fund, Chatham County OPEB Trust Fund. The Plan does not issue a stand-alone financial report. Benefit provisions and all other related plan requirements are established annually by the Board of Commissioners. 4. Contributions Funding for the Plan is derived from two sources: member contributions and employer contributions. Member contributions are set annually by the Board. Annual contributions of Plan members for the current fiscal year were as follows: Retiree, under 65 $ 604 Retiree + Family, under 65 $1,469 Retiree, 65 and over $ 419 Retiree + Family, 65 and over $1,187 Contributions paid by retirees in the current fiscal year totaled $589,116. The County contributes annually an amount equal to the pay-as-you-go cost of retiree healthcare. Subject to budgetary constraints, the County contributes additional amounts to the Plan for advance funding of future liabilities. The Annual OPEB Cost is actuarially determined. In 2015 the County contributed $9,712,670 or 16.22% of the covered payroll for employees of $59,873,000 under the plan for the year ended June 30, 2015.

CHATHAM COUNTY, GEORGIA Notes to the Basic Financial Statements
D- 62
5. Annual OPEB Cost and Net OPEB Obligation The County’s annual OPEB cost and net OPEB obligation for the past three years is shown below: Annual Percentage of Annual Net OPEB Plan Year Ended OPEB Cost OPEB Cost Contributed Obligation June 30, 2013 13,663,000 70.2% 22,424,226 June 30, 2014 14,423,000 65.8% 27,364,259 June 30, 2015 15,881,000 64.0% 32,029,358 The Net OPEB Obligation was developed as follows, based on an actuarial valuation date of July 1, 2013: Annual Required Contribution $15,351,000 Interest on Unfunded ARC 1,862,000 Adjustment of ARC ( 1,333,000) Annual OPEB Cost 15,880,000 Actual Contribution ( 9,712,671) Increase in OPEB Obligation 6,167,329 Net OPEB Obligation(asset), beg of year 25,862,029 Net OPEB Obligation at year end $32,029,358
6. Funded Status and Funding Progress
Schedule of Funding Progress
(dollars in thousands)
Total Ratio of the Unfunded
Actuarial Actuarial Actuarial Unfunded Annual Actuarial Liability to
Valuation Value of Accrued Actuarial Funded Covered Annual Covered
Date Assets Liability Liability Ratio Payroll Payroll
July 1, 2014 $38,510 $123,683 ($135,173) 22.27% $59,825 225.71%
Six years of data is shown in the Required Supplementary Information section. As the Plan gains experience the schedules found in the Required Supplementary Information section will show multi-year trend information about whether the actuarial value of plan assets is decreasing over time relative to the actuarial accrued liability for benefits 7. Actuarial Assumptions and Methods
Actuarial valuations involve estimates of the value of reported amounts and assumptions about the probability of events far into the future. As such, actuarial calculations reflect a long-term perspective. Actuarially determined amounts are subject to continual revision as actual results are compared to past expectations and new estimates are made about the future. Actuarial methods and assumptions used include techniques that are designed to reduce short-term volatility in actuarial accrued liabilities and the actuarial value of assets. The Plan uses the projected unit credit actuarial cost method, and the amortization period for the unfunded actuarial accrued liability is open at 30 years calculated on a level percentage of payroll basis. The investment return assumption or discount rate is assumed to be 7.2% based on the funding policy currently in place. Upon full annual funding of the Annual OPEB Cost, an 8.5% rate would be assumed. The health care cost trend rate (medical and pharmacy) is 6.2%. Full participation by the eligible population is assumed. The valuation does

CHATHAM COUNTY, GEORGIA Notes to the Basic Financial Statements
D- 63
not use a core inflation rate directly, although inflation trends are reviewed to ensure consistency in the selection of the discount rate and the medical trend rate. Calculations are based on the types of benefits provided under the plan at the time of each valuation and on the pattern of cost sharing between the employer and plan members to that point. The County has not entered into any long-term contracts for contributions to the Plan with any party, and, accordingly, there were not amounts of contractually required contributions outstanding at the report date. 8. Unpaid Claims The OPEB Trust Fund pays health claims and administrative costs related to providing health care benefits for the County’s retirees. Incurred but not reported claims totaling $410,000 have been accrued as a liability in the OPEB Trust Fund. The fund’s claims experience was: Incurred Unpaid Claims Claims Actual Unpaid Fiscal Beginning Including Claim Claims End Year of Year IBNRs Payments of Year 2013 270,367 4,553,504 4,584,998 238,873 2014 238,873 5,234,839 5,312,630 161,082 2015 161,082 6,313,100 6,064,182 410,000 9. Chatham Area Transit Authority Post-employment Benefits – Discretely Presented Component Unit
Chatham Area Transit maintains a single-employer defined benefit postemployment life and healthcare plan for its retired employees. Plan benefit provisions and contribution requirements are established and may be amended by the Authority, subject to negotiations between it and the Amalgamated Transit Union. The Annual OPEB Cost, percentage of cost contributed and Net OPEB Obligation were:
Annual Percentage of Annual Net OPEB
Plan Year Ended OPEB Cost OPEB Cost Contributed Obligation
June 30, 2013 16,059 66% 140,134 June 30, 2014 105,836 36% 207,263
June 30, 2015 109,784 36% 277,454
As of July 1, 2014, the actuarial accrued liability for benefits was $1,213,275 and the actuarial value of assets was zero, resulting in an unfunded actuarial accrued liability of $1,213,275.
Further details on the CAT plan can be obtained from the Chatham Area Transit Authority. Retirement Plan – Chatham County Board of Health (Discretely Presented Component Unit) Plan description: – ERS is a cost-sharing multiple-employer defined benefit pension plan established by the Georgia General Assembly during the 1949 Legislative Session for the purpose of providing retirement allowances for employees of the State of Georgia and its political subdivisions. ERS is directed by a Board of Trustees. Title 47 of the O.C.G.A. assigns the authority to establish and amend the benefit provisions to the State Legislature. ERS issues a publicly available financial report that can be obtained at www.ers.ga.gov/formspubs/formspubs. Benefits provided: The ERS Plan supports three benefit tiers: Old Plan, New Plan, and Georgia State Employees’ Pension and Savings Plan (GSEPS). Employees under the old plan started membership prior to July 1, 1982 and are subject to plan provisions in effect prior to July 1, 1982. Members hired on or after July 1,

CHATHAM COUNTY, GEORGIA Notes to the Basic Financial Statements
D- 64
1982 but prior to January 1, 2009 are new plan members subject to modified plan provisions. Effective January 1, 2009, new state employees and rehired state employees who did not retain membership rights under the Old or New Plans are members of SEPS. ERS members hired prior to January 1, 2009 also have the option to irrevocably change their membership to GSEPS. Under the old plan, the new plan, and GSEPS, a member may retire and receive normal retirement benefits after completion of 10 years of creditable service and attainment of age 60 or 30 years of creditable service regardless of age. Additionally, there are some provisions allowing for early retirement after 25 years of creditable service for members under age 60. Retirement benefits paid to members are based upon the monthly average of the member’s highest 24 consecutive calendar months, multiplied by the number of years of creditable service, multiplied by the applicable benefit factor. Annually, postretirement cost-of living adjustments may also be made to members’ benefits, provided the members were hired prior to July 1, 2009. The normal retirement pension is payable monthly for life; however, options are available for distribution of the member’s monthly pension, at reduced rates, to a designated beneficiary upon the member’s death. Death and disability benefits are also available through ERS. Contributions: Member contributions under the old plan are 4% of annual compensation, up to $4,200, plus 6% of annual compensation in excess of $4,200. Under the old plan, the state pays member contributions in excess of 1.25% of annual compensation. Under the old plan, these state contributions are included in the members’ accounts for refund purposes and are used in the computation of the members’ earnable compensation for the purpose of computing retirement benefits. Member contributions under the new plan and GSEPS are 1.25% of annual compensation. The Center’s contractually required contribution rate, actuarially determined annually, for the year ended June 30, 2015 was 21.96% of annual covered payroll for old and new plan members and 18.87% for GSEPS members. The Center’s contributions to ERS totaled $853,374 for the year ended June 30, 2015 and $645,036 for the measurement period ended June 30, 2014. Contributions are expected to finance the costs of benefits earned by employees during the year, with an additional amount to finance any unfunded accrued liability. Pension Liabilities, Pension Expense, and Deferred Outflows of Resources and Deferred Inflows of Resources Related to Pensions At June 30, 2015, the Center reported a liability for it’s proportionate share of the net pension liability. The net pension liability was measured as of June 30, 2014. The total pension liability used to calculate the net pension liability was based on an actuarial valuation as of June 30, 2013. An expected total pension liability as of June 30, 2014 was determined using standard roll-forward techniques. The Center’s proportion of the net pension liability was based on contributions to ERS during the fiscal year ended June 30, 2014. At June 30 2014, the Employer’s proportion was 0.15518%, which was an increase (decrease) of .006094% from its proportion measured as of June 30, 2013. For the year ended June 30, 2015, the Center recognized pension expense of $469,179. At June 30, 2015, the Center reported deferred outflows of resources and deferred inflows of resources of the District related to pensions from the following sources:

CHATHAM COUNTY, GEORGIA Notes to the Basic Financial Statements
D- 65
Deferred Outflows of Rescouces
Deferred Inflows of Resources
Differences between expected and actual experience
$ -
$ -
Net difference between projected and actual earningson pension plan investments
-
2,141,114
Changes in propotion and differences between employer contributions and proportionate share of contributions
274,308
-
Employer contributions subsequent to the measurement date
1,149,316
-
Proportionate share of net postion
$ 1,423,624
$ 2,141,114
The District’s contributions subsequent to the measurement date of $1,149,316 are reported as deferred outflows of resources and will be recognized as a reduction of the net pension liability in the year ended June 30, 2016. Other amounts reported as deferred outflows of resources and deferred inflows of resources related to pensions will be recognized in pension expense as follows: Year ended June 30 2016 $ (386,836) 2017 (432,413) 2018 (535,279) 2019 (535,278) 2020 - Thereafter - Actuarial assumptions: The total pension liability as of June 30, 2014 was determined by an actuarial valuation as of June 30, 2013 using the following actuarial assumptions, applied to all periods included in the measurement:: Inflation 3.00% Salary increases 5.45-9.25%, including inflation Investment rate of return 7.50%, net of pension plan investment expense, including inflation Mortality rates were based on the RP-2000 Combined Mortality Table for the periods after service retirement, for dependent beneficiaries, and for deaths in active service, and the RP-2000 Disabled Mortality Table set back eleven years for males for the period after disability retirement. The actuarial assumptions used in the June 30, 2013 valuation were based on the results of an actuarial experience study for the period July 1, 2004 – June 30, 2009. The long-term expected rate of return on pension plan investments was determined using a log-normal distribution analysis in which best-estimate ranges of expected future real rates of return (expected nominal returns, net of pension plan investment expense and the assumed rate of inflation) are developed for each major asset class. These ranges are combined to produce the long-term expected rate of return by weighting the expected future real rates of return by the target asset allocation percentage and by adding expected inflation. The target allocation and best estimates of arithmetic real rates of return for each major
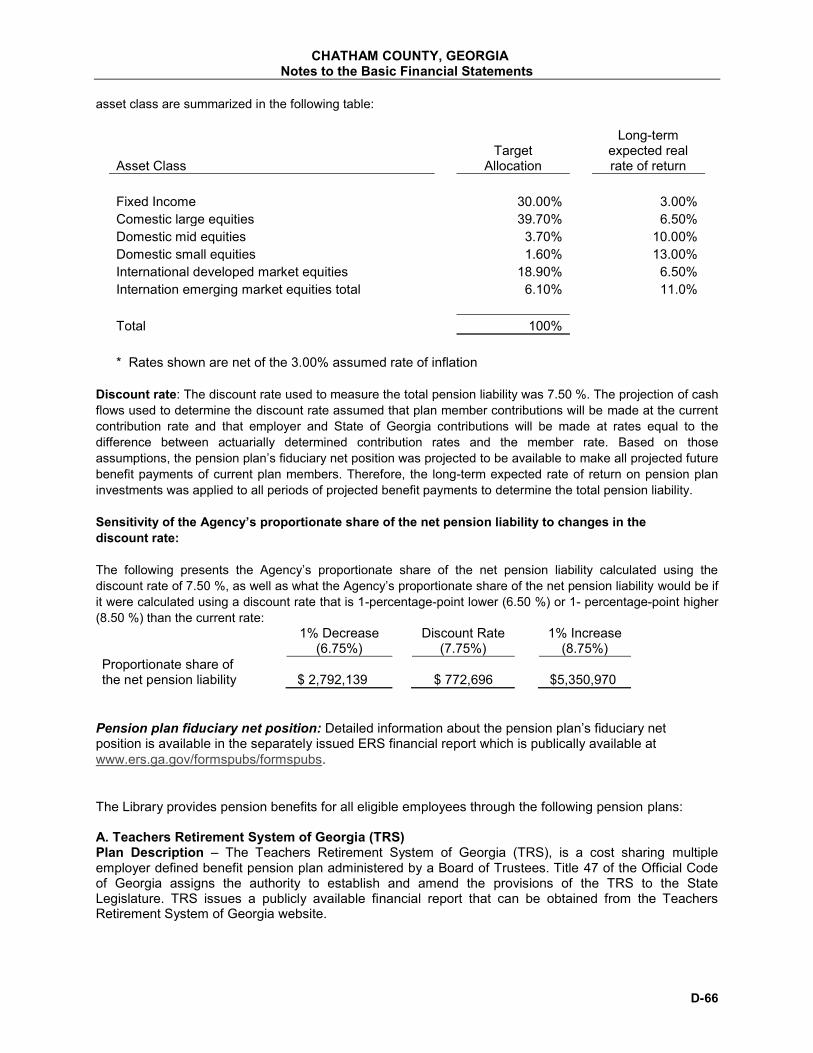
CHATHAM COUNTY, GEORGIA Notes to the Basic Financial Statements
D- 66
asset class are summarized in the following table:
Asset Class
Target Allocation
Long-term expected real rate of return
Fixed Income
30.00%
3.00% Comestic large equities
39.70%
6.50%
Domestic mid equities
3.70%
10.00% Domestic small equities
1.60%
13.00%
International developed market equities
18.90%
6.50% Internation emerging market equities total
6.10%
11.0%
Total
100%
* Rates shown are net of the 3.00% assumed rate of inflation
Discount rate: The discount rate used to measure the total pension liability was 7.50 %. The projection of cash flows used to determine the discount rate assumed that plan member contributions will be made at the current contribution rate and that employer and State of Georgia contributions will be made at rates equal to the difference between actuarially determined contribution rates and the member rate. Based on those assumptions, the pension plan’s fiduciary net position was projected to be available to make all projected future benefit payments of current plan members. Therefore, the long-term expected rate of return on pension plan investments was applied to all periods of projected benefit payments to determine the total pension liability. Sensitivity of the Agency’s proportionate share of the net pension liability to changes in the discount rate: The following presents the Agency’s proportionate share of the net pension liability calculated using the discount rate of 7.50 %, as well as what the Agency’s proportionate share of the net pension liability would be if it were calculated using a discount rate that is 1-percentage-point lower (6.50 %) or 1- percentage-point higher (8.50 %) than the current rate:
1% Decrease (6.75%)
Discount Rate (7.75%)
1% Increase (8.75%)
Proportionate share of the net pension liability $ 2,792,139
$ 772,696
$5,350,970
Pension plan fiduciary net position: Detailed information about the pension plan’s fiduciary net position is available in the separately issued ERS financial report which is publically available at www.ers.ga.gov/formspubs/formspubs. The Library provides pension benefits for all eligible employees through the following pension plans: A. Teachers Retirement System of Georgia (TRS) Plan Description – The Teachers Retirement System of Georgia (TRS), is a cost sharing multiple employer defined benefit pension plan administered by a Board of Trustees. Title 47 of the Official Code of Georgia assigns the authority to establish and amend the provisions of the TRS to the State Legislature. TRS issues a publicly available financial report that can be obtained from the Teachers Retirement System of Georgia website.
CHATHAM COUNTY, GEORGIA Notes to the Basic Financial Statements
D- 67
Benefits provided - TRS provides service retirement, disability retirement and survivors’ benefits. A member is eligible for normal service retirement after 30 years of creditable service, regardless of age, or after 10 years of service and attainment of age 60. A member is eligible for early retirement after 25 years of creditable service. Normal retirement benefits are determined as 2% of the average of the employee’s two highest paid consecutive years of service times the number years of creditable service up to forty years. Early retirementbenefits are reduced by the lesser of one-twelfth of 7% for each month the member is below age 60 or by 7% for each year or fraction thereof by which the member has less than 30 years of service. Retirement benefits are payable monthly for life. A member may elect to receive a partial lump-sum distribution in addition to a reduced monthly retirement benefit. Disability retirement benefits are determined in the same manner as normal retirement benefits, using a percentage of salary formula. At least ten years of creditable service is required to qualify for disability retirement benefits. Death benefits are based on the employee’s creditable service (minimum of ten years of service) and compensation up to the date of death. Contributions – TRS is funded by member and employer contributions as adopted and amended by the Board of Trustees. Member contributions are limited by State law to not less than 5% or more than 6% of a member's annual compensation. For the fiscal year ended June 30, 2015, employees of the Library who are covered by TRS were required to contribute 6% of their annual compensation to the TRS. The Library’s required contribution rate, actuarially determined, for the year ended June 30, 2015 was 13.15% of annual salary for participating employees. The Library’s contributions to the plan for the year ended June 30, 2015 were $534,646. B. Employees’ retirement system of Georgia (ERS) Plan Description – The Employees’ Retirement System of Georgia (ERS) is a cost sharing multiple employer defined benefit pension plan administered by a Board of Trustees. Title 47 of the Official Code of Georgia assigns the authority to establish and amend the provisions of the ERS to the State Legislature. ERS issues a publicly available financial report that can be obtained from the Employees’ retirement System of Georgia website. Benefits provided - The ERS Plan supports three benefit tiers: Old Plan, New Plan, and Georgia State Employees’ Pension and Savings Plan (GSEPS). Employees under the old plan started membership prior to July 1, 1982 and are subject to plan provisions in effect prior to July 1, 1982. Members hired on or after July 1, 1982 but prior to January 1, 2009 are new plan members subject to modified plan provisions. Effective January 1, 2009, new state employees and rehired state employees who did not retain membership rights under the Old or New Plans are members of GSEPS. ERS members hired prior to January 1, 2009 also have the option to irrevocably change their membership to GSEPS. Under the old plan, the new plan, and GSEPS, a member may retire and receive normal retirement benefits after completion of 10 years of creditable service and attainment of age 60 or 30 years of creditable service regardless of age. Additionally, there are some provisions allowing for early retirement after 25 years of creditable service for members under age 60. Retirement benefits paid to members are based upon the monthly average of the member’s highest 24 consecutive calendar months, multiplied by the number of years of creditable service, multiplied by the applicable benefit factor. Annually, postretirement cost-of-living adjustments may also be made to members’ benefits, provided the members were hired prior to July 1, 2009. The normal retirement pension is payable monthly for life; however, options are available for distribution of the member’s monthly pension, at reduced rates, to a designated beneficiary upon the member’s death. Death and disability benefits are also available through ERS. Contributions - Member contributions under the old plan are 4% of annual compensation, up to $4,200, plus 6% of annual compensation in excess of $4,200. Under the old plan, the state pays member contributions in excess of 1.25% of annual compensation. Under the old plan, these state contributions are included in the members’ accounts for refund purposes and are used in the computation of the members’ earnable compensation for the purpose of computing retirement benefits. Member contributions under the new plan and GSEPS are 1.25% of annual compensation. The Library’s

CHATHAM COUNTY, GEORGIA Notes to the Basic Financial Statements
D- 68
contractually required contribution rate, actuarially determined, for the year ended June 30, 2015 was 21.96%. The Library’s contributions to the plan for the year ended June 30, 2015 were $10.817. C. Chatham County Employees’ Retirement Plan (CCERP) Plan Description – Custodial and certain other personnel of the Library are covered by the Chatham County Employees’ Retirement Plan (CCERP), which is a single-employer defined benefit plan. CCERP provides retirement, disability and death benefits to plan members and their beneficiaries. Article IX of the Chatham County Employees’ Retirement Plan assigns the Pension Board with the authority to establish and amend the benefit provisions of the Plan. The Plan is administrated by Chatham County and reported in the County’s Comprehensive Annual Financial Report. Contributions – Contributions to the Plan are actuarially determined. Covered employees are required to contribute 3.5% of their annual covered salary to the Plan. The required employer contribution rate is 18.23% of current year covered payroll. The Library’s contributions to the plan for the year ended June 30, 2015 were $27,251. Pension Liabilities, Pension Expense, and Deferred Outflows of Resources and Deferred Inflows of Resources Related to Pensions At June 30, 2015, the Library reported a liability for its proportionate share of the net pension liability for TRS, ERS and CCERP, totaling $5,025,848. The net pension liability was measured as of June 30, 2014. The total pension liability used to calculate the net pension liability was based on an actuarial valuation as of June 30, 2013. An expected total pension liability as of June 30, 2014 was determined using standard rollforward techniques. The Library’s proportion of the net pension liability was based on contributions to TRS, ERS and CCERP during the fiscal year ended June 30, 2014. At June 30 2014, the Library’s TRS proportion was .038328%, which was an increase of .000107% from its proportion measured as of June 30, 2013. At June 30 2014, the Library’s ERS proportion was .002405%, which was an increase of .000109% from its proportion measured as of June 30, 2013. At June 30 2014, the Library’s CCERP proportion was .190421%, which was a decrease of .006073% from its proportion measured as of June 30, 2013. For the year ended June 30, 2015, the Library recognized pension expense as follows: TRS $ 335,369 ERS 7,542 CCERP 16,326 $ 359,237 At June 30, 2015, the Library reported deferred outflows of resources and deferred inflows of resources related to pensions from the following sources:

CHATHAM COUNTY, GEORGIA Notes to the Basic Financial Statements
D- 69
Library contributions subsequent to the measurement date to the various plans are reported as deferred outflows of resources and will be recognized as a reduction of the net pension liability in the year ended June 30, 2016. Other amounts reported as deferred outflows of resources and deferred inflows of resources related to pensions will be recognized in pension expense as follows: Year Ended June 30 TRS ERS CCERP
2016 (418,574)$ (3,470)$ 2,262$ 2017 (418,574)$ (4,283)$ 2,262$ 2018 (418,574)$ (5,504)$ 2,262$ 2019 (418,574)$ (5,504)$ 2,262$ 2020 1,381$ -$ (1,144)$
Actuarial assumptions - The total pension liability as of June 30, 2014 was determined by an actuarial valuation using the following actuarial assumptions, applied to all periods included in the measurement: Teachers Retirement System: Inflation 3.00% Salary increases 3.75% - 7.00% average, including inflation Investment rate of return including inflation 7.50% net of pension plan investment expense Mortality rates were based on the RP-2000 Combined Mortality Table for the males or females set back two years for males and set back three years for females. The actuarial assumptions used in the June 30, 2013 valuation were based on the results of an actuarial experience study for the period July 1, 2004 – June 30, 2009. Employees’ Retirement System: Inflation 3.00% Salary increases 5.45% - 9.25% average, including inflation Investment rate of return 7.50% net of pension plan investment expense including inflation Mortality rates were based on the RP-2000 Combined Mortality Table for the periods after service retirement, for dependent beneficiaries, and for deaths in active service, and the RP-2000 Disabled Mortality Table set back eleven years for males for the period after disability retirement.
Deferred Outflows of Rescouces
Deferred Inflows of Resources
Deferred Outflows of Rescouces
Deferred Inflows of Resources
Deferred Outflows of Rescouces
Deferred Inflows of Resources
Differences between expected and actual experience - $ 1,688,107 $ - $ 22,016 $ 14,132 $ 3,753 $
Net difference between projected and actual earningson pension plan investments - - - - - -
Changes in propotion and differences between employer contributions and proportionate share of contributions 15,192 - 3,255 - 1,825
Employer contributions subsequent to the measurement date 534,646 - 10,817 - 27,251 - Proportionate share of net postion 549,838 $ 1,688,107 $ 14,072 $ 22,016 $ 41,383 $ 5,578 $
TRS ERS CCERP

CHATHAM COUNTY, GEORGIA Notes to the Basic Financial Statements
D- 70
The actuarial assumptions used in the June 30, 2013 valuation were based on the results of an actuarial experience study for the period July 1, 2004 – June 30, 2009. The long-term expected rate of return on TRS and ERS investments was determined using a log-normal distribution analysis in which best-estimate ranges of expected future real rates of return (expected nominal returns, net of pension plan investment expense and theassumed rate of inflation) are developed for each major asset class. These ranges are combined to produce the long-term expected rate of return by weighting the expected future real rates of return by the target asset allocation percentage and by adding expected inflation. The target allocation and best estimates of arithmetic real rates of return for each major asset class are summarized in the following table:
Asset Class
Target Allocation
Long-term expected real rate of return
Fixed Income
30.0%
3.0% Comestic large equities
39.7%
6.5%
Domestic mid equities
3.7%
10.0% Domestic small equities
1.6%
13.0%
International developed market equities
18.9%
6.5% International emerging market equities 6.1% 11%
Total
100.0%
* Rates shown are net of the 3.00% assumed rate of inflation Discount rate - The discount rate used to measure the total pension liability was 7.50%. The projection of cash flows used to determine the discount rate assumed that plan member contributions will be made at the current contribution rate and that employercontributions will be made at rates equal to the difference between actuarially determined contribution rates and the member rate. Based on those assumptions, the pension plan’s fiduciary net position was projected to be available to make all projected future benefit payments of current plan members. Therefore, the long- term expected rate of return on pension plan investments was applied to all periods of projected benefit payments to determine the total pension liability. Chatham County Employees’ Retirement Plan: Inflation 3.00% Salary increases 3.50% - 6.00% average, including inflation Investment rate of return 7.80% net of pension plan investment expense including inflation Mortality rates were based on the RP-2000 Healthy Annuitant Mortality Table projected to 2008 and updated to reflect actual large governmental plan experience through 2010. Disability mortality rates were based on the RP-2000 Disabled Retiree Mortality Table projected to 2008 and updated to reflect actual large government plan experience through 2010. The target allocation and best estimates of arithmetic real rates of return for each major asset class are summarized in the following table:

CHATHAM COUNTY, GEORGIA Notes to the Basic Financial Statements
D- 71
Asset Class
Target Allocation
Long-term expected real rate of return
Fixed Income
30.0%
3.0% Domestic large equities 39.0%
6.5%
Domestic mid equities
8.0%
10.0% Domestic small equities
8.0%
13.0%
International equities
15.0%
6.5%
Total
100.0%
* Rates shown are net of the 3.00% assumed rate of inflation Discount rate - The discount rate used to measure the total pension liability was 7.80%. The projection of cash flows used to determine the discount rate assumed that plan member contributions will be made at the current contribution rate and that employer contributions will be made at rates equal to the difference between actuarially determined contribution rates and the member rate. Sensitivity of the Library’s proportionate share of the net pension liability to changes in the discount rate The following presents the Library’s proportionate share of the net pension liability calculated using the discount rate of 7.50 % for TRS and ERS and a 7.80% discount rate for CCERP, as well as what the Library’s proportionate share of the net pension liability wouldbe if it were calculated using a discount rate that is 1-percentage-point lower or 1-percentage-point higher than the current rate:
1% Decrease (6.5%)
Discount Rate (7.5%)
1% Increase (8.5%)
Teachers Retirement System Library's Proportionate share of the net pension liability
$ 8,923,594
$ 842,237
$ 1,481,325
Employee's Retirement System Library's Proportionate share of the net pension liability
$ 131,533
$ 90,202
$ 55,020
1% Decrease (6.8%)
Discount Rate (7.8%)
1% Increase (8.8%)
Chatham County Employees Retirement Plan
Library's Proportionate share of the net pension liability
$ 144,609
$ 93,409
$ 49,731 E. Risk Management Chatham County is exposed to various risks of loss related to torts, theft of, damage to, and destruction of assets, errors and omissions, injuries to employees, and natural disasters. The County has established the Claims and Judgments account within the Risk Management Fund, an internal service fund, to account for and finance its uninsured risks of loss. The claims liability is disclosed based on the requirements of Governmental Accounting Standards Board Statement No. 10, which requires that a liability for claims be reported if information prior to the issuance of the financial statements indicates that it is probable that a liability has been incurred at the date of the financial statements and the amount of the loss can be reasonably estimated. Because actual claims liabilities depend upon such complex factors as inflation, changes in legal doctrines, and damage awards, the process used in computing claims liability does not necessarily result in an exact amount. Claims liability is reevaluated

CHATHAM COUNTY, GEORGIA Notes to the Basic Financial Statements
D- 72
periodically to take into consideration recently settled claims, the frequency of claims, and other economic and social factors. Liabilities for incurred losses to be settled by fixed or reasonably determined payments over a long period of time are reported at their present value using expected future investment yield assumptions ranging from 4 to 6 %. During 2015, there were no annuity contracts purchased. Group Health: The County has established a Health Insurance Internal Service Fund whereby premiums paid by other funds are available to pay health claims and administrative costs. Program reserves and Incurred But Not Reported (IBNR) claims of $820,000 have been accrued as a liability in the Health Insurance Internal Service Fund based primarily upon the provider’s projections. Interfund premiums are based upon the Health Insurance Fund's prior year’s claims experience. The Group Health Internal Service Fund’s total net position as of June 30, 2015 is $4,909,407. The County retains the first $175,000 of each health claim. Specific Excess Insurance is purchased for each claim that exceeds the $175,000 per claim retention, and Aggregate Excess Insurance is purchased for aggregate annual claims that exceed 125% of the insurance provider's annual projections.
It is estimated that all of the claims will be paid the following year. Workers Compensation: Workers Compensation is administered in the Risk Management Fund. The Worker's Compensation program retains the first $750,000 of each incurred claim. The County purchases Specific Excess Insurance for each individual claim that exceeds the $750,000 retention. Only one claim has exceeded the commercial excess coverage in the past three fiscal years. The liability reported for Incurred But Not Reported (IBNR) claims and program reserves for June 30, 2015 totaled $2,337,321.
It is estimated that $800,000 will be paid during the following year.
Unpaid Incurred Unpaid Claims Claims Actual Claims
Fiscal Beginning Including Claim End ofYear of Year IBNRs Payments Year2013 1,202,364 16,335,785 16,526,377 1,011,772 2014 1,011,772 19,347,602 19,327,259 1,032,115 2015 1,032,115 12,310,644 12,522,759 820,000
Unpaid Incurred UnpaidClaims Claims Actual Claims
Fiscal Beginning Including Claim End ofYear of Year IBNRs Payments Year
2013 2,859,563 934,142 995,828 2,527,877 2014 2,527,877 832,181 1,092,999 2,267,059 2015 2,267,059 2,199,840 2,129,578 2,337,321

CHATHAM COUNTY, GEORGIA Notes to the Basic Financial Statements
D- 73
disposition of claims and judgments will not have a material adverse effect on the financial position of the County. The County participates in a number of Federal and State assisted grant programs. Grant amounts received and receivables are subject to audit by grantor agencies. The amount, if any, of expenditures, which may be disallowed by the granting agencies, cannot be determined at this time. The County expects such amounts, if any, to be immaterial. G. Financial Guarantees In May 2012 the Chatham County Hospital Authority issued the Series 2012A Seven Mill Tax Pledge Refunding and Improvement Revenue Bonds totaling $163,880,000. Debt service on the Series 2012A bonds is secured by and payable from payments or prepayments made by Memorial Health University Medical Center, Inc. under a loan agreement with the Authority, and from monies and investments held by the bond trustee. The Series 2012A bonds are special limited obligations of the Chatham County Hospital Authority pursuant to an intergovernmental contract by and between Chatham County and the Authority. The Authority has no taxing power. In the event that the Hospital defaults under the loan agreement, the County is obligated to make payments sufficient to pay the principal and interest on the Series 2012A bonds to the extent necessary and subject to the seven mill limitation specified by the Georgia Hospital Authorities Law. The County has not levied a millage rate pertaining to the bond issue. At June 30, 2015, the outstanding amount of the bonds totaled $163,880,000.

CHATHAM COUNTY, GEORGIA Notes to the Basic Financial Statements
D- 74
H. Trust Fund Statements Financial statements for each of the County’s trust funds are shown herein, and are provided as a supplement to the plan disclosures found in IV A and IV B of the notes to the basic financial statements:
Pension Trust Fund
OPEB Trust Fund TOTAL
ASSETSCash 4,680,596$ 5,757,649$ 10,438,245$ Receivables:
Interest and dividend 561,766 - 561,766
Sale of investments 912,524 - 912,524
Accounts 67,274 12,833 80,107
Investments, at fair value: - - -
Total Investments before JE to allocate U.S. government and agency obligations 18,892,222 - 18,892,222
Mortgage backed securities 4,981,136 - 4,981,136
Corporate bonds 33,408,405 - 33,408,405
Domestic stocks 70,022,476 - 70,022,476
Common/collective trust 55,025,297 - 55,025,297
Index Funds 37,865,612 37,865,612 Municipal Bonds 214,920 - 214,920
International equity funds 20,443,652 - 20,443,652
Other asset back sequrities - - -
Total Investments 202,988,108 37,865,612 240,853,720
Total assets 209,210,268 43,636,094 252,846,362
LIABILITIESAccounts payable 1,366,118 657,768 2,023,886
Due to others - - -
Total liabilities 1,366,118 657,768 2,023,886
NET POSITIONHeld in trust for pension and other employee benefits 207,844,150$ 42,978,326$ 250,822,476$
CHATHAM COUNTY, GEORGIAPENSION (AND OTHER POST EMPLOYEE BENEFIT) TRUST FUNDS
COMBINING STATEMENT OF PLAN NET POSITION June 30, 2015

CHATHAM COUNTY, GEORGIA Notes to the Basic Financial Statements
D- 75
Pension Trust Fund
OPEB Trust Fund TOTAL
ADDITIONSContributions:
Employer 14,310,940$ 9,712,671$ 24,023,611$
Plan members 2,226,111 589,116 2,815,227
Total contributions 16,537,051 10,301,787 26,838,838Investment earnings:
Net appreciation (depreciation) 3,609,628 687,931 4,297,559
in fair value of investments
Interest 1,982,850 622,368 2,605,218
Dividends 1,664,236 382,612 2,046,848
Total 7,256,714 1,692,911 8,949,625
Less investment expense 917,550 - 917,550
Net investment income 6,339,164 1,692,911 8,032,075
Total additions 22,876,215 11,994,698 34,870,913
DEDUCTIONS
Benefits 13,165,951 - 13,165,951
Risk management - 6,658,210 6,658,210
Refunds of contributions 546,320 - 546,320
Administrative expense 253,104 868,137 1,121,241
Total deductions 13,965,375 7,526,347 21,491,722 Change in net position 8,910,840 4,468,351 13,379,191
Net position - beginning 198,933,309 38,509,975 237,443,285
Net position - ending 207,844,149$ 42,978,326$ 250,822,476$
CHATHAM COUNTY, GEORGIAFIDUCIARY FUNDS
STATEMENT OF CHANGES IN FIDUCIARY NET POSITIONFor the year ended June 30, 2015

REQUIRED SUPPLEMENTARY INFORMATION OTHER THAN MD&A

CHATHAM COUNTY, GEORGIA GENERAL FUND
BUDGETARY COMPARISON SCHEDULE FOR THE YEAR ENDED JUNE 30, 2015
(Continued)
E-1
VARIANCE WITHBUDGETED AMOUNTS FINAL BUDGET
ACTUAL POSITIVEORIGINAL FINAL AMOUNTS (NEGATIVE)
RESOURCES (Inflows)Property taxes 127,573,471$ 133,573,471$ 129,897,129$ (3,676,342)$ Local option sales tax 13,550,000 14,450,000 15,375,903 925,903 Other taxes 1,645,000 2,060,000 2,156,792 96,792 Penalties and interest on delinquent taxes 1,475,800 1,475,800 1,301,052 (174,748) Licenses and permits 1,026,000 1,026,000 912,612 (113,388) Intergovernmental 1,952,571 1,956,341 2,579,968 623,627 Charges for services 10,600,676 10,711,868 11,486,732 774,864 Fines and fees 2,986,520 2,986,520 3,114,571 128,051 Investment income 130,000 130,000 523,846 393,846 Other revenue 433,380 517,975 983,833 465,858 Transfers from other funds 4,250,000 4,631,440 4,620,903 (10,537) Amounts available for appropriation 165,623,418 173,519,415 172,953,341 (566,074)
CHARGES TO APPROPRIATIONS (Outflows)GENERAL GOVERNMENT
County Commissioners 925,260 1,217,194 656,450 560,744 Youth Commission 50,000 50,000 50,001 (1) County Clerk 96,205 98,719 91,905 6,814 County Manager 1,205,787 1,230,438 1,203,850 26,588 Elections 775,167 809,179 747,567 61,612 Voter Registration 783,520 800,980 647,400 153,580 Finance 2,300,123 2,360,715 2,164,731 195,984 Professional Services 126,442 227,702 114,385 113,317 Purchasing 677,984 698,847 642,332 56,515 County Attorney 1,061,075 1,368,794 1,186,440 182,354 Information Communication Systems 2,825,772 3,452,989 3,271,880 181,109 Communications 696,748 758,958 620,820 138,138 Human Resources 1,245,211 1,317,720 1,264,950 52,770 Temporary Pool 100,000 100,000 51,779 48,221 Tax Commissioner 5,277,021 5,375,729 4,960,997 414,732 Tax Assessor 5,108,951 5,229,670 4,904,997 324,673 Board of Equalization 204,597 207,081 133,257 73,824 ADA Compliance 120,367 119,430 117,558 1,872 Internal Audit 454,495 468,267 461,142 7,125 Building Maintenance and Operations 2,987,917 3,130,080 2,958,375 171,705 Fleet Operations 677,947 817,870 817,808 62 Utilities 1,150,000 1,150,000 866,010 283,990 Public Information 130,209 131,113 118,206 12,907 Administrative Services 1,080,581 1,137,059 1,137,014 45

CHATHAM COUNTY, GEORGIA GENERAL FUND
BUDGETARY COMPARISON SCHEDULE FOR THE YEAR ENDED JUNE 30, 2015
(Continued)
E-2
VARIANCE WITHBUDGETED AMOUNTS FINAL BUDGET
ACTUAL POSITIVEORIGINAL FINAL AMOUNTS (NEGATIVE)
GENERAL GOVERNMENT (Continued)Building Safety and Regulatory Services 131,292$ 134,667$ 129,140$ 5,527$ Pensioners' Health Insurance 5,345,700 5,345,700 5,345,700 - Special Appropriations 217,000 547,006 154,330 392,676 Vacant positions (1,100,000) (1,100,000) - (1,100,000) Other 2,635,896 671,279 627,017 44,262 Energy Excise Tax to Municipalities 232,860 687,860 684,449 3,411 Teleride 2,537,000 2,711,900 2,711,892 8 Contingencies 2,975,668 629,855 - 629,855
Total General Government 43,036,795 41,886,801 38,842,382 3,044,419
JUDICIARYCourt Administrator 3,593,990 3,655,649 3,591,900 63,749 Court Expenditures 728,600 869,800 869,778 22 Alternative Dispute Resolution 197,995 200,666 98,613 102,053 Superior Court Clerk 2,848,640 2,928,144 2,857,563 70,581 District Attorney 6,088,700 6,273,238 6,058,533 214,705 Victim Witness Program 747,525 768,910 768,912 (2) State Court Judge 1,435,620 1,555,453 1,478,462 76,991 State Court Clerk 1,418,545 1,399,445 1,341,250 58,195 DUI Court 251,515 257,935 251,098 6,837 Magistrate Court 1,491,425 1,521,042 1,508,219 12,823 Probate Court 881,070 908,228 880,670 27,558 Probate Court Filing Fees 195,000 240,000 238,845 1,155 Juvenile Court 5,064,425 5,332,352 5,332,302 50 Grand Jury 21,830 21,830 12,978 8,852 Law Library 120,105 125,682 115,483 10,199 Public Defenders Office 2,703,528 2,724,915 2,663,626 61,289 Panel Attorneys 1,424,224 101,889 79,103 22,786 Indigent Defense Unit - 1,352,487 1,352,397 90
Total Judiciary 29,212,737 30,237,665 29,499,732 737,933

CHATHAM COUNTY, GEORGIA GENERAL FUND
BUDGETARY COMPARISON SCHEDULE FOR THE YEAR ENDED JUNE 30, 2015
(Continued)
E-3
VARIANCE WITHBUDGETED AMOUNTS FINAL BUDGET
ACTUAL POSITIVEORIGINAL FINAL AMOUNTS (NEGATIVE)
PUBLIC SAFETYCounter Narcotics Team 4,593,305$ 4,623,489$ 4,507,710$ 115,779$ Marine Police Patrol 792,625 792,625 671,621 121,004 Sheriff's Office 10,264,490 10,639,513 10,608,899 30,614 Detention Center 43,414,110 45,528,067 44,711,583 816,484 Emergency Medical Service 951,515 1,075,686 940,431 135,255 County Coroner 315,000 329,863 314,542 15,321 Animal Control 1,136,670 1,109,470 1,008,818 100,652 Chatham Emergency Management Agency 1,032,007 1,106,636 1,101,689 4,947 Hazardous Materials 50,000 59,540 59,519 21
Total Public Safety 62,549,722 65,264,889 63,924,812 1,340,077
PUBLIC WORKSPublic Works 710,000 771,487 584,626 186,861 Bridge Operations and Maintenance 473,481 482,941 424,375 58,566
Total Public Works 1,183,481 1,254,428 1,009,001 245,427
HEALTH AND WELFAREIndigent Health Center 4,872,710 4,651,910 4,332,434 319,476 Health Department 1,267,544 1,267,544 1,267,544 - Chatham County Safety Net Planning 80,000 80,000 80,000 - Mosquito Control 3,657,653 3,724,320 3,461,561 262,759 Mosquito Control Restricted Contingency 254,270 254,270 - 254,270 Family and Children Services 723,040 723,040 723,040 - Greenbriar Children's Home 369,600 369,600 369,600 - Summer Bonanza 30,000 30,000 30,000 - Other Health Services - - - -
Total Health and Welfare 11,254,817 11,100,684 10,264,179 836,505
CULTURE AND RECREATIONFrank G Murray Community Center 147,566 153,147 132,380 20,767 Recreation Department 3,367,069 3,450,567 3,318,152 132,415 Aquatic Center Pool 1,051,926 1,074,504 1,036,050 38,454 Weightlifting Center 269,680 269,934 269,482 452 Tybee Pier and Pavilion 24,090 24,090 20,053 4,037 Georgia Forestry 49,100 49,100 42,579 6,521 Library 6,865,865 6,873,468 6,873,468 -
Total Culture and Recreation 11,775,296 11,894,810 11,692,164 202,646

CHATHAM COUNTY, GEORGIA GENERAL FUND
BUDGETARY COMPARISON SCHEDULE FOR THE YEAR ENDED JUNE 30, 2015
(Concluded)
E-4
VARIANCE WITHBUDGETED AMOUNTS FINAL BUDGET
ACTUAL POSITIVEORIGINAL FINAL AMOUNTS (NEGATIVE)
HOUSING AND DEVELOPMENTCo-Operative Extension Service 189,350$ 190,184$ 150,880$ 39,304$ Coastal Soil and Water 600 600 - 600 Chatham Apprentice Program 206,653 209,760 199,678 10,082 Community Outreach 209,071 227,880 185,836 42,044 Bamboo Farm 127,780 127,780 122,591 5,189
Total Housing and Development 733,454 756,204 658,985 97,219
DEBT SERVICEPrincipal 1,466,665 1,466,665 1,466,661 4 Interest and other charges 1,005,785 1,090,300 823,260 267,040
Total Debt Service 2,472,450 2,556,965 2,289,921 267,044
Transfers to other funds 3,404,666 10,590,351 9,651,228 939,123
Total charges to appropriations 165,623,418 175,542,797 167,832,404 7,710,393
Excess (deficiency) of resources overcharges to appropriations - (2,023,382) 5,120,937 7,144,319
Fund balance, beginning of year 39,280,164 39,280,164 39,280,164 -
Fund balance, end of year 39,280,164$ 37,256,782$ 44,401,101$ 7,144,319$
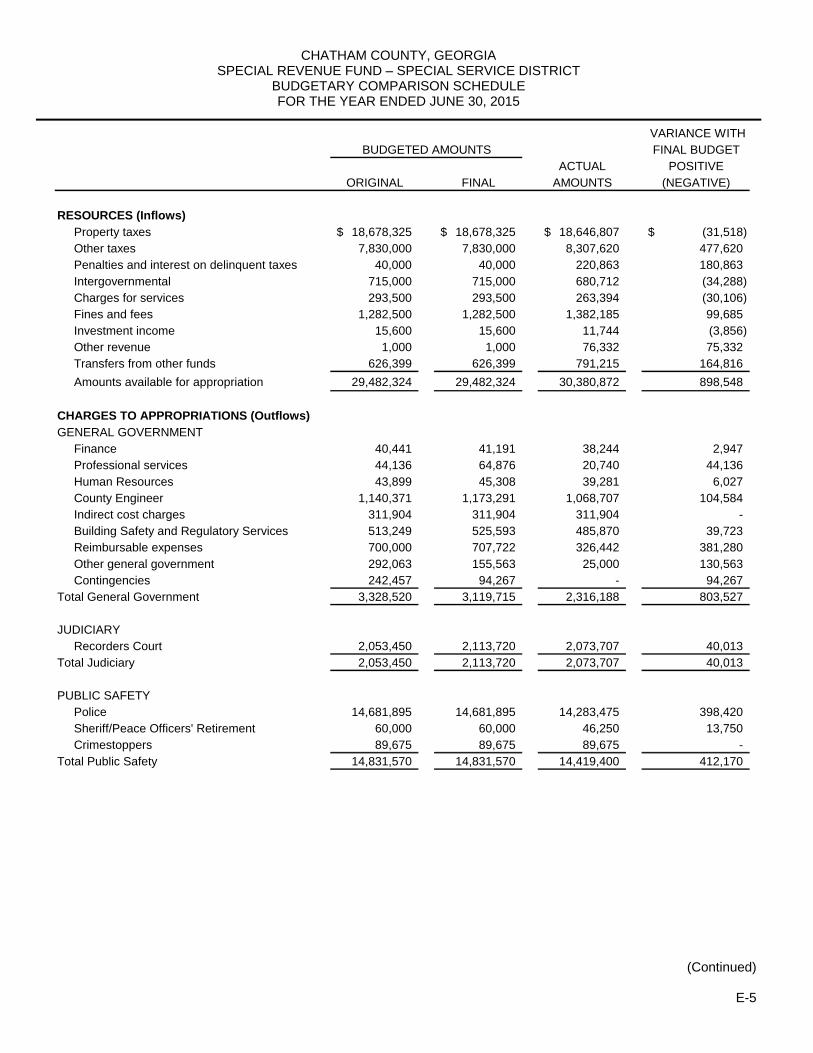
CHATHAM COUNTY, GEORGIA SPECIAL REVENUE FUND – SPECIAL SERVICE DISTRICT
BUDGETARY COMPARISON SCHEDULE FOR THE YEAR ENDED JUNE 30, 2015
(Continued)
E-5
VARIANCE WITHBUDGETED AMOUNTS FINAL BUDGET
ACTUAL POSITIVEORIGINAL FINAL AMOUNTS (NEGATIVE)
RESOURCES (Inflows)Property taxes 18,678,325$ 18,678,325$ 18,646,807$ (31,518)$ Other taxes 7,830,000 7,830,000 8,307,620 477,620 Penalties and interest on delinquent taxes 40,000 40,000 220,863 180,863 Intergovernmental 715,000 715,000 680,712 (34,288) Charges for services 293,500 293,500 263,394 (30,106) Fines and fees 1,282,500 1,282,500 1,382,185 99,685 Investment income 15,600 15,600 11,744 (3,856) Other revenue 1,000 1,000 76,332 75,332 Transfers from other funds 626,399 626,399 791,215 164,816
Amounts available for appropriation 29,482,324 29,482,324 30,380,872 898,548
CHARGES TO APPROPRIATIONS (Outflows)GENERAL GOVERNMENT
Finance 40,441 41,191 38,244 2,947 Professional services 44,136 64,876 20,740 44,136 Human Resources 43,899 45,308 39,281 6,027 County Engineer 1,140,371 1,173,291 1,068,707 104,584 Indirect cost charges 311,904 311,904 311,904 - Building Safety and Regulatory Services 513,249 525,593 485,870 39,723 Reimbursable expenses 700,000 707,722 326,442 381,280 Other general government 292,063 155,563 25,000 130,563 Contingencies 242,457 94,267 - 94,267
Total General Government 3,328,520 3,119,715 2,316,188 803,527
JUDICIARYRecorders Court 2,053,450 2,113,720 2,073,707 40,013
Total Judiciary 2,053,450 2,113,720 2,073,707 40,013
PUBLIC SAFETYPolice 14,681,895 14,681,895 14,283,475 398,420 Sheriff/Peace Officers' Retirement 60,000 60,000 46,250 13,750 Crimestoppers 89,675 89,675 89,675 -
Total Public Safety 14,831,570 14,831,570 14,419,400 412,170

CHATHAM COUNTY, GEORGIA SPECIAL REVENUE FUND – SPECIAL SERVICE DISTRICT
BUDGETARY COMPARISON SCHEDULE FOR THE YEAR ENDED JUNE 30, 2015
(Concluded)
E-6
VARIANCE WITHBUDGETED AMOUNTS FINAL BUDGET
ACTUAL POSITIVEORIGINAL FINAL AMOUNTS (NEGATIVE)
PUBLIC WORKSCounty Engineer - Traffic Lights 231,122$ 233,822$ 173,955$ 59,867$ Public Works 6,056,653 8,030,118 7,402,022 628,096 Fell Street Pump Maintenance 29,000 45,200 45,105 95
Total Public Works 6,316,775 8,309,140 7,621,082 688,058
HOUSING AND DEVELOPMENTMetropolitan Planning Commission 943,540 943,540 943,540 - SAGIS 210,000 210,000 210,000 - Coastal Area Regional Development Center 87,200 87,200 87,194 6
Total Housing and Development 1,240,740 1,240,740 1,240,734 6
DEBT SERVICEPrincipal 96,000 - - -
Total Debt Service 96,000 - - -
Transfers to other funds 1,615,269 1,615,269 1,433,276 181,993
Total charges to appropriations 29,482,324 31,230,154 29,104,387 2,125,767
Excess (deficiency) of resources overcharges to appropriations - (1,747,830) 1,276,485 3,024,315
Fund balance, beginning of year 7,577,100 7,577,100 7,577,100 -
Fund balance, end of year 7,577,100$ 5,829,270$ 8,853,585$ 3,024,315$

CHATHAM COUNTY, GEORGIA Notes to Required Supplementary Information
E – 7
A. Budgets and Budgetary Accounting The County follows these procedures in establishing the budgetary data reflected in this report. 1. Departments submit detailed budget requests to the Budget Office, which reviews, compiles
the requests, and makes recommendations to the County Manager. 2. The County Manager submits a proposed budget to the Board of County Commissioners no
later than the first week in May. 3. The Board of County Commissioners holds such public workshops as it deems necessary and
holds an advertised public hearing on the proposed budget at which the first reading of the budget resolution occurs. The budget is finally adopted at a regular Board meeting upon the second reading of the budget resolution prior to June 30th.
4. Annual budgets are adopted for the general fund, special revenue funds and debt service funds
for legal budgetary control. Project length budgets are adopted for capital projects funds. Annual budgets are also adopted for other funds as a management tool.
5. Budgets for previously mentioned governmental fund types are maintained on a basis
consistent with generally accepted accounting principles. The proprietary funds adopt budgets as a management tool. Since these budgets are not a required disclosure item, they are not presented herein.
6. The County Manager, Finance Director and Budget Officer are authorized to transfer budgeted
amounts within departments. The Board of Commissioners may transfer amounts between departments and approve appropriations of additional resources in accordance with Georgia State Laws.
7. Supplemental and decreases in budget appropriations were properly approved by the County
Commissioners. For the year ended June 30, 2015, the following supplemental and decrease in appropriations were approved:
8. The level of legal budgetary control (the level at which expenditures may not exceed
appropriations) is at the department level.
Original Supplemental Supplemental FinalFund Type Appropriations Appropriations Decreases Appropriations
General 165,623,418$ 9,919,377$ -$ 175,542,795$ Special Revenue 40,700,462 9,558,903 - 50,259,365$ Debt Service - 16,566,260 - 16,566,260$
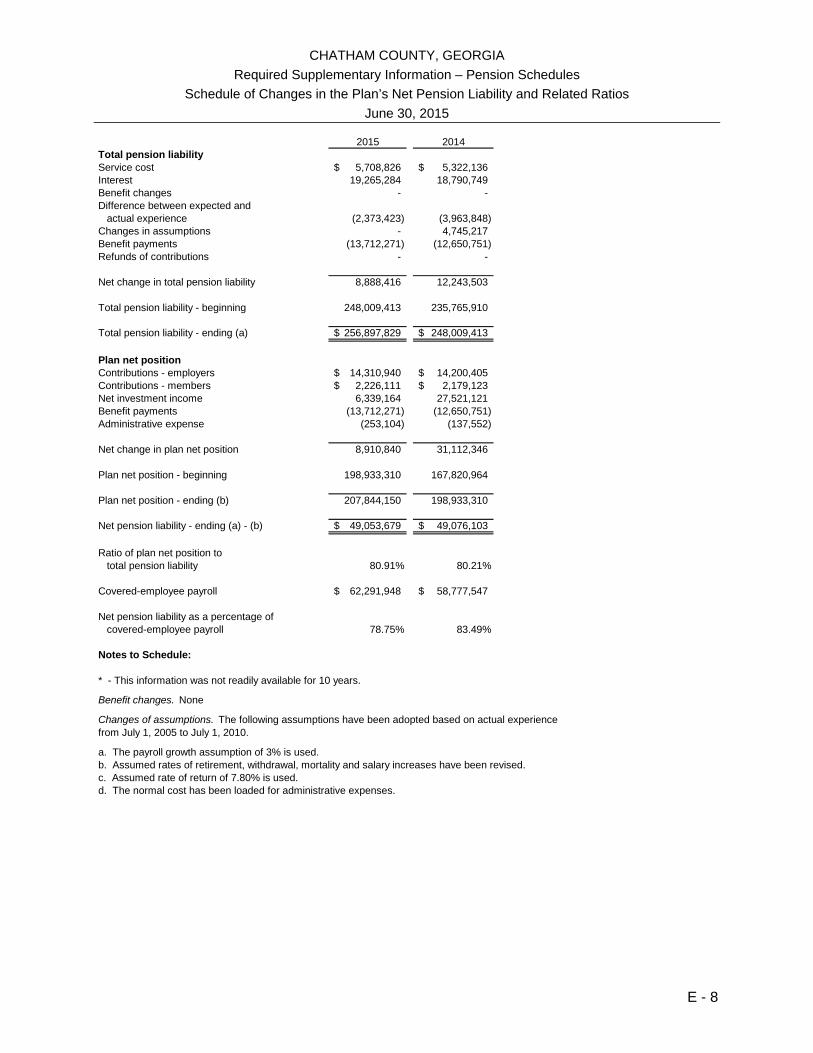
CHATHAM COUNTY, GEORGIA
Required Supplementary Information – Pension Schedules
Schedule of Changes in the Plan’s Net Pension Liability and Related Ratios
June 30, 2015
E - 8
2015 2014
Total pension liabilityService cost 5,708,826$ 5,322,136$ Interest 19,265,284 18,790,749 Benefit changes - - Difference between expected and
actual experience (2,373,423) (3,963,848) Changes in assumptions - 4,745,217 Benefit payments (13,712,271) (12,650,751) Refunds of contributions - -
Net change in total pension liability 8,888,416 12,243,503
Total pension liability - beginning 248,009,413 235,765,910
Total pension liability - ending (a) 256,897,829$ 248,009,413$
Plan net positionContributions - employers 14,310,940$ 14,200,405$ Contributions - members 2,226,111$ 2,179,123$ Net investment income 6,339,164 27,521,121 Benefit payments (13,712,271) (12,650,751) Administrative expense (253,104) (137,552)
Net change in plan net position 8,910,840 31,112,346
Plan net position - beginning 198,933,310 167,820,964
Plan net position - ending (b) 207,844,150 198,933,310
Net pension liability - ending (a) - (b) 49,053,679$ 49,076,103$
Ratio of plan net position tototal pension liability 80.91% 80.21%
Covered-employee payroll 62,291,948$ 58,777,547$
Net pension liability as a percentage ofcovered-employee payroll 78.75% 83.49%
Notes to Schedule:
* - This information was not readily available for 10 years.
Benefit changes. None
Changes of assumptions. The following assumptions have been adopted based on actual experiencefrom July 1, 2005 to July 1, 2010.
a. The payroll growth assumption of 3% is used.b. Assumed rates of retirement, withdrawal, mortality and salary increases have been revised.c. Assumed rate of return of 7.80% is used.d. The normal cost has been loaded for administrative expenses.

CHATHAM COUNTY, GEORGIA
Required Supplementary Information – Pension Schedules
Schedule of Employer Contributions
June 30, 2015
E - 9
2015 2014
Actuarially determined contribution 13,931,114$ 13,598,810$
Contributions in relation to the actuariallydetermined contribution 14,310,940 14,200,405
Contribution deficiency (excess) (379,826)$ (601,595)$
Covered-employee payroll 62,291,948$ 58,777,547$
Contributions as a percentage of covered-employee payroll 22.97% 24.16%
Notes to Schedule
Valuation date:Actuarially determined contribution rates are calculated as of June 30, one yearprior to the end of the fiscal year in which contributions are reported.
Method and assumptions used in calculations of actuarially determined contributions:The actuarially determined contribution rates are determined on an annual basis. The following actuarial methods and assumptions were used to determine contributionrates reported in that schedule:
Actuarial cost method Entry age
Amortization method Level percentage of payroll, closed
Remaining amortization period 10 years
Asset valuation method Adjusted market value
Inflation 3 percent
Salary increase Variable, 3% to 5%
Investment rate of return 7.8 percent, compounded annuallyPost retirement benefit increases N/A

CHATHAM COUNTY, GEORGIA
Required Supplementary Information – Pension Schedules
Schedule of Investment Returns
June 30, 2015
E - 10
2015 2014
Annual money-weighted rate ofreturn, net of investment expense 3.11% 16.37%

CHATHAM COUNTY, GEORGIA
Required Supplementary Information – Pension Schedules
Schedule of County’s Proportionate Share of Net Pension Liability
June 30, 2015
E - 11
State's proportionateof the net pension
County's proportion County's proportionate liability (asset)of the net pension of the net pension associated with
Pension Plan liability (asset) liability (asset) the County Total
Employees Retirement System - (ERS)2015 0.00% -$ 3,421,689$ 3,421,689$
Georgia Judicial Retirement System - (GJRS)2015 0.00% - (709,232) (709,232)
Sheriffs’ Retirement Fund of Georgia - (SRFG)2015 0.00% - 124,539 124,539
Judges of the Probate Courts Retirement Fund of Georgia - (JPCRF)2015 0.00% - (116,505) (116,505)
Magistrates Retirement Fund of Georgia - (MRF) 2015 0.00% - (74,064) (74,064)
Peace Officers’ Annuity and Benefit Fund of Georgia - (POAB)2015 0.00% - (252,127) (252,127)
County's proportionate shareof the net pension liability (asset) Plan fiduciary net position
County's covered- as a percentage of its as a percentage of the Pension Plan employee payroll covered-employee payroll total pension liability
Employees Retirement System - (ERS)2015 2,130,926$ 0.00% 77.99%
Georgia Judicial Retirement System - (GJRS)2015 771,778 0.00% 114.37%
Sheriffs’ Retirement Fund of Georgia - (SRFG)2015 N/A N/A 81.88%
Judges of the Probate Courts Retirement Fund of Georgia - (JPCRF)2015 N/A N/A 131.22%
Magistrates Retirement Fund of Georgia - (MRF) 2015 N/A N/A 151.09%
Peace Officers’ Annuity and Benefit Fund of Georgia - (POAB)2015 N/A N/A 103.75%

Chatham County, Georgia Required Supplementary Information – OPEB Schedules
June 30, 2015 ______________________________________________________________________________
E - 12
Schedule of Valuation Details June 30, 2015
Valuation Date: July 1, 2014 Actuarial Cost Method: Projected Unit Credit Amortization Method: Level Percentage of Payroll Remaining Amortization Period: 29 years Asset Valuation Method: Market value Investment Return Assumption: 7.2% Health Care Cost Trend Rate: 6.2% current year, declines over 70 years to an
ultimate rate of 3.8 % by 2082 Population information: Retirees & current beneficiaries 557 Active plan participants 1,426 Total 1,983
Schedule of Employer Contributions 2008-2015
Year Ended Annual
Contribution Percentage of Annual OPEB
Cost Contributed June 30, 2008 $ 7,946,124 81.60% June 30, 2009 7,650,296 74.70% June 30, 2010 8,631,286 80.60% June 30, 2011 8,324,229 61.29% June 30, 2012 8,900,420 65.65% June 30, 2013 June 30, 2014 June 30, 2015
9,585,646 9,482,967 9,712,671
70.16% 65.75% 63.27%
Schedule of Funding Progress(dollar amounts in thousands)
2007 - 2014
UAAL as a Actuarial Percentage
Actuarial Accrued Unfunded Annual of Actuarial Value of Liability (AAL) AAL Funded Covered Covered Valuation Assets - Entry Age (UAAL) Ratio Payroll Payroll
Date (a) (b) (b-a) (a/b) (c) ((b-a)/c)
07/01/2007 4,143 91,817 87,674 4.51% 64,280 136.40% 07/01/2008 7,943 99,598 91,655 7.98% 63,973 143.30% 07/01/2009 12,713 108,094 95,381 11.76% 63,436 150.36% 07/01/2010 18,549 137,316 118,767 13.51% 62,754 189.26% 07/01/2011 18,676 137,316 118,640 13.60% 62,754 189.06% 07/01/2012 23,301 144,525 121,224 16.12% 61,180 198.14% 07/01/2013 30,375 156,864 126,489 19.36% 60,251 209.94% 07/01/2014 38,510 173,683 135,173 22.17% 59,873 225.71%


SUPPLEMENTARY DATA – COMBINING FUND FINANCIAL STATEMENTS AND SCHEDULES


NONMAJOR FUNDS NONMAJOR GOVERNMENTAL FUNDS
SPECIAL REVENUE FUNDS: The Special Revenue Funds are used to account for proceeds of specific revenue sources (other than expendable trusts, or for major capital projects) that are legally restricted to expenditure for specified purposes. Street Lighting Fund - To account for the Special assessments levied for street lighting services. Inmate Welfare Fund – To account for the operation of the inmate jail commissary. Confiscated Revenue Fund - To account for funds received from participation in drug related cases. Restricted Court Fees Fund – To account for the legally restricted court fine and fee collections for victim witness fees, drug surcharge fees, and juvenile court supervision. This fund also accounts for activities of the State DUI Court. Emergency Telephone System Fund - To account for funds generated from telephone subscriber surcharge fees for operation of the emergency 911 system. Land Bank Fund - To account for funds generated from the sale of surplus land.
Land Disturbing Activities Ordinance Fund - To account for fees generated under the Land Disturbing Ordinance. Multiple Grant Fund – To account for grants of the County. Child Support Recovery Unit – To account for operations of the Child Support Recovery Unit under the Eastern Circuit District Attorney which is funded by a grant from State of Georgia Department of Human Resources. Hotel/Motel Tax Fund – To account for the hotel/motel taxes collected. DEBT SERVICE FUND:
The Debt Service Fund is used to account for the accumulation of resources for, and the payment of, long-term debt principal, interest, related costs and certain contractual obligations. CAPITAL PROJECTS FUNDS: Capital Projects Funds are used to account for financial resources to be used for the acquisition or construction of major capital facilities. Capital Improvement Program - To account for the construction and acquisition of major capital projects which cost in excess of $ 10,000. Capital Improvement Bond Fund (Series 1999) - To account for the proceeds of the $9,300,000 DSA Revenue Bonds, Series 1999 to be used for construction, improvement and replacement for specific capital projects. Capital Improvement Bond Fund (Series 2005) – To account for the proceeds of the $29,055,000 DSA Revenue Bonds, Series 2005 to be used for refunding of existing debt, construction and capital improvements to buildings.

CHATHAM COUNTY, GEORGIA NONMAJOR GOVERNMENTAL FUNDS
COMBINING BALANCE SHEET JUNE 30, 2015
F-1
Special Revenue Funds
Street Lighting
Inmate Welfare Fund
Confiscated Revenue
FundRestricted Court Fees
Emergency Telephone
System Land Bank
ASSETSCash and investments 362,427$ 344,996$ 1,738,684$ 1,511,587$ 1,062,017$ 60,125$ Receivable, net 5,488 173,644 960 28,186 587,480 879 Restricted cash - - - - - -
Total assets 367,915$ 518,640$ 1,739,644$ 1,539,773$ 1,649,497$ 61,004$
LIABILITIES, DEFERRED INFLOWS OF RESOURCESAND FUND BALANCES
Liabilities:Accounts payable 44,083$ 95,871$ 315,910$ 84,421$ 1,055,328$ -$ Due to other funds - - - - - - Other payables - - - 2,176 - -
- Total liabilities 44,083 95,871 315,910 86,597 1,055,328 -
Deferred inflows of resources:Unavailable revenues 89 - - - - -
Total liabilities and deferred inflows of resources 44,172 95,871 315,910 86,597 1,055,328 -
Fund balances:Restricted - 422,769 1,423,734 1,453,176 594,169 - Committed 323,743 - - - - 61,004 Assigned for purposes of the fund - - - - - -
Total fund balances 323,743 422,769 1,423,734 1,453,176 594,169 61,004 Total liabilities, deferred inflows of resources
and fund balances 367,915$ 518,640$ 1,739,644$ 1,539,773$ 1,649,497$ 61,004$

F-2
Capital Projects
Land Disturbing Activities
Ordinance Multiple
Grant Fund Child Support Enforcement
Hotel/Motel Tax Fund
Capital Improvement
Program
Capital Improvement Bond Fund
2005 Series Capital
Improvement Bond Fund Debt Service
Total Other Governmental
Funds
721,548$ -$ -$ 7,205$ 27,877,957$ 24,517$ 187,406$ 2,105,514$ 36,003,983$ - 691,688 591,468 166,225 27,586 - - - 2,273,604
107,050 - - - - - - - 107,050 828,598$ 691,688 591,468$ 173,430$ 27,905,543$ 24,517$ 187,406$ 2,105,514$ 38,384,637$
10,828$ 138,943$ 41,562$ 173,430$ 1,451,647$ -$ -$ -$ 3,412,023$ - 478,957 549,906 - - - - - 1,028,863
8,254 - - - - - - - 10,430
19,082 617,900 591,468 173,430 1,451,647 - - - 4,451,316
- 73,788 - - - - - - 73,877
19,082 691,688 591,468 173,430 1,451,647 - - - 4,525,193
- - - - - - 187,406 - 4,081,254 809,516 - - - - - - 2,105,514 3,299,777
- - - - 26,453,896 24,517 - - 26,478,413 809,516 - - - 26,453,896 24,517 187,406 2,105,514 33,859,444
828,598$ 691,688$ 591,468$ 173,430$ 27,905,543$ 24,517$ 187,406$ 2,105,514$ 38,384,637$

CHATHAM COUNTY, GEORGIA NONMAJOR GOVERNMENTAL FUNDS
COMBINING STATEMENT OF REVENUES, EXPENDITURES, AND CHANGES IN FUND BALANCES FOR THE YEAR ENDED JUNE 30, 2015
F-3
Special Revenue Funds
Street Lighting
Inmate Welfare Fund
Confiscated Revenue
FundRestricted Court Fees
Emergency Telephone
System Land Bank
REVENUESOther taxes -$ -$ -$ -$ -$ -$ Licenses and permits - - - - - - Intergovernmental - - - 181,999 - - Charges for services 589,339 1,036,873 - - 2,644,827 - Fees and fines - - 570,442 606,125 - - Investment income - - 568 - 849 - Other revenue - - 7,639 - - 31,999
Total revenues 589,339 1,036,873 578,649 788,124 2,645,676 31,999
EXPENDITURESCurrent:
General government - - - - - - Judiciary - - - 715,364 - - Public safety - 1,060,868 508,403 - 3,145,220 - Public works 546,102 - - - - - Culture and recreation - - - - - - Housing and development - - - - - 1,096
Debt service:Interest and other charges - - - - - -
Capital outlay - - - - - - Total expenditures 546,102 1,060,868 508,403 715,364 3,145,220 1,096
Excess (deficiency) of revenues over (under) expenditures 43,237 (23,995) 70,246 72,760 (499,544) 30,903
OTHER FINANCING SOURCES (USES)Issuance of capital leases - - - - - - Issuance of bonds - - - - - - Payment to refunded bond escrow agent - - - - - - Transfers in - - - 13,837 476,043 - Transfers out - - - (500,000) - -
Total other financing sources and uses - - - (486,163) 476,043 - Net change in fund balances 43,237 (23,995) 70,246 (413,403) (23,501) 30,903
Fund balances - beginning 280,506 446,764 1,353,488 1,866,579 617,670 30,101 Fund balances - ending 323,743$ 422,769$ 1,423,734$ 1,453,176$ 594,169$ 61,004$

F-4
Capital Projects
Land Disturbing Activities
OrdinanceMultiple Grant
FundChild Support Enforcement
Hotel/Motel Tax Fund
Capital Improvement
Program
Capital Improvement Bond Fund
2005 Series Capital
Improvement Bond Fund Debt Service
Total Other Governmental
Funds
-$ -$ -$ 1,582,429$ -$ -$ -$ -$ 1,582,429$ 722,768 - - - - - - - 722,768
- 2,416,974 2,624,639 - 282,433 - - - 5,506,045 - - - - - - - - 4,271,039 - - - - - - - - 1,176,567
265 - - - 8,822 - 5,090 - 15,594 - - - - 2,119,676 - - 343 2,159,657
723,033 2,416,974 2,624,639 1,582,429 2,410,931 - 5,090 343 15,434,099
- 237,159 - - - - - - 237,159 - 1,713,939 - - - - - - 2,429,303 - 455,249 2,785,173 - - - - - 7,954,913 - - - - - - - - 546,102 - 10,627 - - - - - - 10,627
454,630 - - 791,214 - - - - 1,246,940
- - - - - - - 309,738 309,738 - - - - 4,555,694 4,250 5,826 - 4,565,770
454,630 2,416,974 2,785,173 791,214 4,555,694 4,250 5,826 309,738 17,300,552
268,403 - (160,534) 791,215 (2,144,763) (4,250) (736) (309,395) (1,866,453)
- - - - 4,301,351 - - - 4,301,351 - - - - - - - 9,840,000 9,840,000 - - - - - - - (9,550,000) (9,550,000) - - 160,534 - 3,093,638 - - 2,000,000 5,744,052 - - - (791,215) (381,440) - - - (1,672,655) - - 160,534 (791,215) 7,013,549 - - 2,290,000 8,662,748
268,403 - - - 4,868,786 (4,250) (736) 1,980,605 6,796,295 541,113 - - - 21,585,110 28,767 188,142 124,909 27,063,149 809,516$ -$ -$ -$ 26,453,896$ 24,517$ 187,406$ 2,105,514$ 33,859,444$

CHATHAM COUNTY, GEORGIA SPECIAL REVENUE FUND – STREET LIGHTING
BUDGETARY COMPARISON SCHEDULE FOR THE YEAR ENDED JUNE 30, 2015
F-5
VARIANCE WITH
BUDGETED AMOUNTS FINAL BUDGET
ACTUAL POSITIVE
ORIGINAL FINAL AMOUNTS (NEGATIVE)
REVENUES
Charges for services 705,184$ 705,184$ 589,339$ (115,845)$
Total revenues 705,184 705,184 589,339 (115,845)
EXPENDITURES
Current:
Public works 705,184 985,690 546,102 439,588
Total expenditures 705,184 985,690 546,102 439,588
Net change in fund balance - (280,506) 43,237 323,743
Fund balance, beginning of year - 280,506 280,506 -
Fund balance, end of year -$ -$ 323,743$ 323,743$

CHATHAM COUNTY, GEORGIA SPECIAL REVENUE FUND – INMATE WELFARE FUND
BUDGETARY COMPARISON SCHEDULE FOR THE YEAR ENDED JUNE 30, 2015
F-6
VARIANCE WITH
BUDGETED AMOUNTS FINAL BUDGET
ACTUAL POSITIVE
ORIGINAL FINAL AMOUNTS (NEGATIVE)
REVENUES
Charges for services 909,000$ 909,000$ 1,036,873$ 127,873$
Total revenues 909,000 909,000 1,036,873 127,873
EXPENDITURES
Current:
Public safety 909,000 1,355,764 1,060,868 294,896
Total expenditures 909,000 1,355,764 1,060,868 294,896
Net change in fund balance - (446,764) (23,995) 422,769
Fund balance, beginning of year - 446,764 446,764 -
Fund balance, end of year -$ -$ 422,769$ 422,769$

CHATHAM COUNTY, GEORGIA SPECIAL REVENUE FUND – CONFISCATED REVENUE FUND
BUDGETARY COMPARISON SCHEDULE FOR THE YEAR ENDED JUNE 30, 2015
F-7
VARIANCE WITH
BUDGETED AMOUNTS FINAL BUDGET
ACTUAL POSITIVE
ORIGINAL FINAL AMOUNTS (NEGATIVE)
REVENUES
Fines and fees 151,000$ 151,000$ 570,442$ 419,442$
Investment income - - 568 568
Other - - 7,639 7,639
Total revenues 151,000 151,000 578,649 427,649
EXPENDITURES
Current:
Public safety 151,000 1,504,488 508,403 996,085
Total expenditures 151,000 1,504,488 508,403 996,085
Net change in fund balance - (1,353,488) 70,246 1,423,734
Fund balance, beginning of year - 1,353,488 1,353,488 -
Fund balance, end of year -$ -$ 1,423,734$ 1,423,734$

CHATHAM COUNTY, GEORGIA SPECIAL REVENUE FUND – RESTRICTED COURT FEES
BUDGETARY COMPARISON SCHEDULE FOR THE YEAR ENDED JUNE 30, 2015
F-8
VARIANCE WITH
BUDGETED AMOUNTS FINAL BUDGET
ACTUAL POSITIVE
ORIGINAL FINAL AMOUNTS (NEGATIVE)
REVENUES
Intergovernmental -$ -$ 181,999$ 181,999$
Fines and fees 457,500 457,500 606,125 148,625
Total revenues 457,500 457,500 788,124 330,624
EXPENDITURES
Current:
Judiciary 457,500 1,837,916 715,364 1,122,552
Total expenditures 457,500 1,837,916 715,364 1,122,552
Excess (deficiency) of revenues
over expenditures - (1,380,416) 72,760 1,453,176
OTHER FINANCING SOURCES (USES)
Transfers in - 13,837 13,837 -
Transfers out - (500,000) (500,000) -
Total other financing sources (uses) - (486,163) (486,163) -
Net change in fund balance - (1,866,579) (413,403) 1,453,176
Fund balance, beginning of year - 1,866,579 1,866,579 -
Fund balance, end of year -$ -$ 1,453,176$ 1,453,176$

CHATHAM COUNTY, GEORGIA SPECIAL REVENUE FUND – EMERGENCY TELEPHONE SYSTEM
BUDGETARY COMPARISON SCHEDULE FOR THE YEAR ENDED JUNE 30, 2015
F-9
VARIANCE WITH
BUDGETED AMOUNTS FINAL BUDGET
ACTUAL POSITIVE
ORIGINAL FINAL AMOUNTS (NEGATIVE)
REVENUES
Charges for services 2,690,172$ 2,690,177$ 2,644,827$ (45,350)$
Investment income - - 849 849
Total revenues 2,690,172 2,690,177 2,645,676 (44,501)
EXPENDITURES
Current:
Public safety 3,376,795 3,994,465 3,145,220 849,245
Total expenditures 3,376,795 3,994,465 3,145,220 849,245
Excess (deficiency) of revenues
over expenditures (686,623) (1,304,288) (499,544) 804,744
OTHER FINANCING SOURCES (USES)
Transfers in 686,623 686,618 476,043 (210,575)
Total other financing sources (uses) 686,623 686,618 476,043 (210,575)
Net change in fund balance - (617,670) (23,501) 594,169
Fund balance, beginning of year - 617,670 617,670 -
Fund balance, end of year -$ -$ 594,169$ 594,169$

CHATHAM COUNTY, GEORGIA SPECIAL REVENUE FUND – LAND BANK BUDGETARY COMPARISON SCHEDULE FOR THE YEAR ENDED JUNE 30, 2015
F-10
VARIANCE WITH
BUDGETED AMOUNTS FINAL BUDGET
ACTUAL POSITIVE
ORIGINAL FINAL AMOUNTS (NEGATIVE)
REVENUES
Other -$ -$ 31,999$ 31,999$
Total revenues - - 31,999 31,999
EXPENDITURES
Current:
Housing and development 1,096 30,101 1,096 29,005
Total expenditures 1,096 30,101 1,096 29,005
Net change in fund balance (1,096) (30,101) 30,903 61,004
Fund balance, beginning of year 1,096 30,101 30,101 -
Fund balance, end of year -$ -$ 61,004$ 61,004$
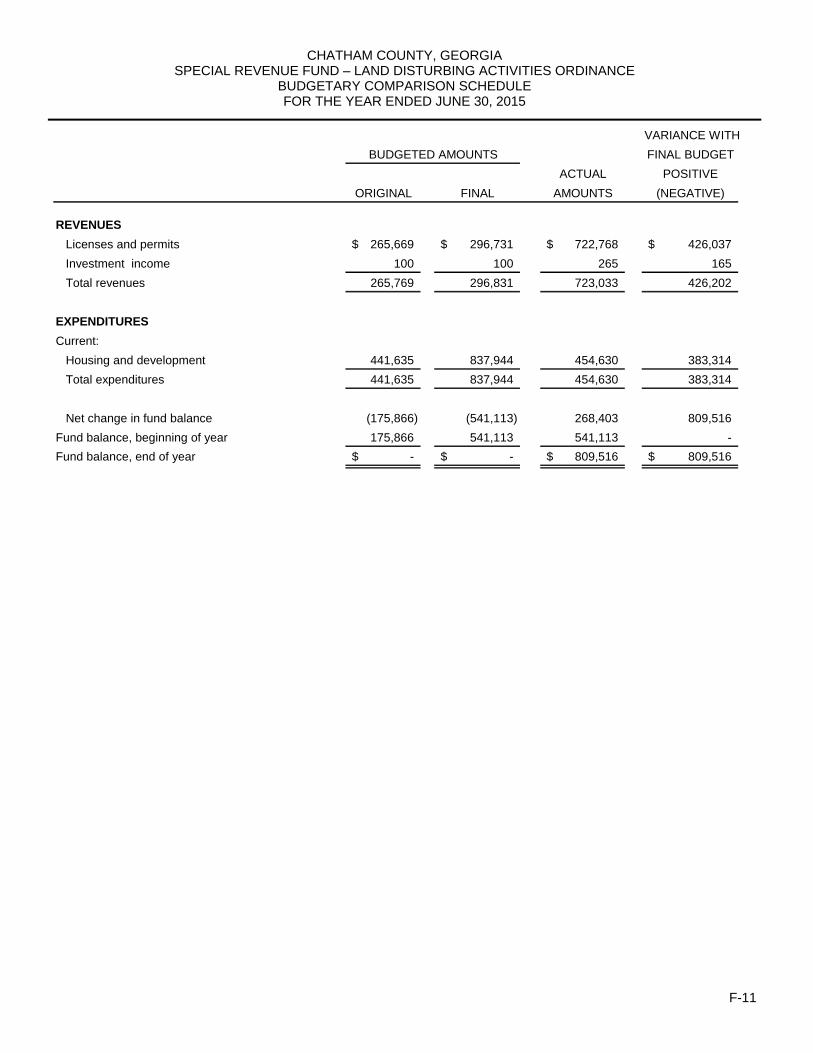
CHATHAM COUNTY, GEORGIA SPECIAL REVENUE FUND – LAND DISTURBING ACTIVITIES ORDINANCE
BUDGETARY COMPARISON SCHEDULE FOR THE YEAR ENDED JUNE 30, 2015
F-11
VARIANCE WITH
BUDGETED AMOUNTS FINAL BUDGET
ACTUAL POSITIVE
ORIGINAL FINAL AMOUNTS (NEGATIVE)
REVENUES
Licenses and permits 265,669$ 296,731$ 722,768$ 426,037$
Investment income 100 100 265 165
Total revenues 265,769 296,831 723,033 426,202
EXPENDITURES
Current:
Housing and development 441,635 837,944 454,630 383,314
Total expenditures 441,635 837,944 454,630 383,314
Net change in fund balance (175,866) (541,113) 268,403 809,516
Fund balance, beginning of year 175,866 541,113 541,113 -
Fund balance, end of year -$ -$ 809,516$ 809,516$

CHATHAM COUNTY, GEORGIA SPECIAL REVENUE FUND – MULTIPLE GRANT FUND
BUDGETARY COMPARISON SCHEDULE FOR THE YEAR ENDED JUNE 30, 2015
F-12
VARIANCE WITH
BUDGETED AMOUNTS FINAL BUDGET
ACTUAL POSITIVE
ORIGINAL FINAL AMOUNTS (NEGATIVE)
REVENUES
Revenue from other governmental units 937,562$ 3,414,477$ 2,416,974$ (997,503)$
Other - - - -
Total revenues 937,562 3,414,477 2,416,974 (997,503)
EXPENDITURES
Current:
General government - 262,000 237,159 24,841
Judiciary 660,162 2,290,448 1,713,939 576,509
Public safety 277,400 862,029 455,249 406,780
Culture and recreation - - 10,627 (10,627)
Total expenditures 937,562 3,414,477 2,416,974 997,503
Net change in fund balance - - - -
Fund balance, beginning of year - - - -
Fund balance, end of year -$ -$ -$ -$

CHATHAM COUNTY, GEORGIA SPECIAL REVENUE FUND – CHILD SUPPORT ENFORCEMENT
BUDGETARY COMPARISON SCHEDULE FOR THE YEAR ENDED JUNE 30, 2015
F-13
VARIANCE WITH
BUDGETED AMOUNTS FINAL BUDGET
ACTUAL POSITIVE
ORIGINAL FINAL AMOUNTS (NEGATIVE)
REVENUES
Revenue from other governmental units 2,843,240$ 2,843,240$ 2,624,639$ (218,601)$
Other 0 0 - -
Total revenues 2,843,240 2,843,240 2,624,639 (218,601)
EXPENDITURES
Current:
Public safety 2,985,568 2,985,568 2,785,173 200,395
Total expenditures 2,985,568 2,985,568 2,785,173 200,395
Excess (deficiency) of revenues
over expenditures (142,328) (142,328) (160,534) (18,206)
OTHER FINANCING SOURCES (USES)
Transfers in 142,328 142,328 160,534 18,206
Total other financing sources (uses) 142,328 142,328 160,534 18,206
Net change in fund balance - - - -
Fund balance, beginning of year - - - -
Fund balance, end of year -$ -$ -$ -$

CHATHAM COUNTY, GEORGIA SPECIAL REVENUE FUND – HOTEL/MOTEL TAX FUND
BUDGETARY COMPARISON SCHEDULE FOR THE YEAR ENDED JUNE 30, 2015
F-14
VARIANCE WITH
BUDGETED AMOUNTS FINAL BUDGET
ACTUAL POSITIVE
ORIGINAL FINAL AMOUNTS (NEGATIVE)
REVENUES
Taxes:
Hotel/motel taxes 1,252,798$ 1,582,798$ 1,582,429$ (369)$
Total revenues 1,252,798 1,582,798 1,582,429 (369)
EXPENDITURES
Current:
Housing and development 626,399 791,219 791,214 5
Total expenditures 626,399 791,219 791,214 5
Excess (deficiency) of revenues
over expenditures 626,399 791,579 791,215 (364)
OTHER FINANCING SOURCES (USES)
Transfers out (626,399) (791,579) (791,215) 364
Total other financing sources (uses) (626,399) (791,579) (791,215) 364
Net change in fund balance - - - -
Fund balance, beginning of year - - - -
Fund balance, end of year -$ -$ -$ -$

CHATHAM COUNTY, GEORGIA DEBT SERVICE FUND
BUDGETARY COMPARISON SCHEDULE FOR THE YEAR ENDED JUNE 30, 2015
F-15
VARIANCE WITH
BUDGETED AMOUNTS FINAL BUDGET
ACTUAL POSITIVE
ORIGINAL FINAL AMOUNTS (NEGATIVE)
REVENUES
Other -$ -$ 343$ 343$
Total revenues - - 343 343
EXPENDITURES
Debt Service:
Bond principal retirement - 2,300,000 - 2,300,000
Interest and fiscal charges - 414,909 309,738 105,171
Total expenditures - 2,714,909 309,738 2,405,171
Excess (deficiency) of revenues
over expenditures - (2,714,909) (309,395) 2,405,514
OTHER FINANCING SOURCES (USES)
Issuance of capital leases 4,301,351 - (4,301,351)
Issuance of bonds 9,840,000 9,840,000 -
Payment to refunded bond escrow agent (9,550,000) (9,550,000) -
Transfers in 2,300,000 2,000,000 (300,000)
Transfers out - (4,301,351) - 4,301,351
Total other financing sources (uses) - 2,590,000 2,290,000 (300,000)
Net change in fund balance - (124,909) 1,980,605 2,105,514
Fund balance, beginning of year - 124,909 124,909 -
Fund balance, end of year -$ -$ 2,105,514$ 2,105,514$

NONMAJOR PROPRIETARY FUNDS
ENTERPRISE FUNDS: Enterprise Funds are used to account for operations (a) that are financed and operated in a manner similar to private business enterprises where the intent of the governing body is that the costs (expenses, including depreciation) of providing goods or services to the general public on a continuing basis be financed or recovered primarily through user charges; or (b) where the governing body has decided that periodic determination of revenues earned, expenses incurred, and/or net income is appropriate for capital maintenance, public policy, management control, accountability, or other purposes. Water and Sewer Fund - To account for the provision of water and sewer services to the residents of the County. All activities necessary to provide such services are accounted for in this fund. Parking Garage Fund - To account for parking services. Building Safety & Regulatory Services Fund – To account for the collection of permits, plan reviews, inspections and zoning fees.
INTERNAL SERVICE FUNDS INTERNAL SERVICE FUNDS: Internal Service Funds are used to account for the financing of goods or services provided by one department or agency to other departments or agencies of the governmental unit, or to other governmental units, on a cost reimbursement basis. Health Insurance Fund - To account for the claims arising from employee medical costs for which the County is self-insured. Catastrophic Claims Fund - To account for catastrophic claims in excess of $100,000. Risk Management Fund – To account for workers compensation claims and other risk management activities. Computer Replacement Fund - To account for the replacement of desktop and laptop computers within the County departments every four years.

CHATHAM COUNTY, GEORGIA NONMAJOR ENTERPRISE FUNDS
COMBINING STATEMENT OF NET POSITION JUNE 30, 2015
F-16
Water and Sewer Fund
Parking Garage Fund
Building Safety and Regulatory Services Total
ASSETS AND DEFERRED OUTFLOWSOF RESOURCESCurrent assets:
Cash and investments 1,956,641$ 1,477,147$ 888,889$ 4,322,677$ Receivables 579,230 28 703 579,961 Restricted cash 301,829 - - 301,829
Total current assets 2,837,700 1,477,175 889,592 5,204,467
Capital assets:Capital assets (net of accumulated
depreciation) 3,913,399 1,309,410 193,606 5,416,415 Total assets 6,751,099 2,786,585 1,083,198 10,620,882
Deferred outflows of resources
Related to pensions 21,747 4,599 47,268 73,614
Total assets and deferred
outflows of resources 6,772,846 2,791,184 1,130,466 10,694,496
LIABILITIES AND DEFERRED INFLOWSOF RESOURCESCurrent liabilities:
Accounts payable 316,306 571 726 317,603 Payable from restricted assets 301,829 - - 301,829 Other accrued expenses 8,771 647 14,907 24,325 Current portion of long-term liabilities 6,618 792 8,406 15,816
Total current liabilities 633,524 2,010 24,039 659,573
Non-current liabilities:Due in more than one year 59,561 7,124 75,657 142,342 Net pension liability 137,952 29,173 299,849 466,974 Net OPEB Obligation 130,592 43,530 388,190 562,312
Total non-current liabilities 328,105 79,827 763,696 1,171,628 Total liabilities 961,629 81,837 787,735 1,831,201
Deferred inflows of resources
Related to pensions 5,543 1,172 12,049 18,764
Total liabilities and deferred
inflows of resources 967,172 83,009 799,784 1,849,965
NET POSITION Net Investment in capital assets 3,913,399 1,309,410 193,606 5,416,415 Unrestricted 1,892,275 1,398,765 137,076 3,428,116
Total net position 5,805,674$ 2,708,175$ 330,682$ 8,844,531$

CHATHAM COUNTY, GEORGIA NONMAJOR ENTERPRISE FUNDS
COMBINING STATEMENT OF REVENUES, EXPENSES, AND CHANGES IN FUND NET POSITION FOR THE YEAR ENDED JUNE 30, 2015
F-17
Water and Sewer Fund
Parking Garage Fund
Building Safety and Regulatory Services Total
OPERATING REVENUESCharges for services 1,999,526$ 435,274$ 956,878$ 3,391,678$ Miscellaneous 23,772 - - 23,772
Total operating revenues 2,023,298 435,274 956,878 3,415,450
OPERATING EXPENSESPersonal services 498,721 119,415 850,692 1,468,828 Contractual services 1,494,178 37,223 37,330 1,568,731 Other supplies and expenses 330,936 24,179 38,985 394,100 Interdepartmental charges 181,249 196,144 371,042 748,435 Depreciation 303,947 73,219 5,469 382,635
Total operating expenses 2,809,031 450,180 1,303,518 4,562,729 Operating income (loss) (785,733) (14,906) (346,640) (1,147,279)
NON-OPERATING REVENUES (EXPENSES)Interest and investment revenue 2,659 1,183 - 3,842
Total non-operating revenue(expenses) 2,659 1,183 - 3,842
Income (loss) before transfers (783,074) (13,723) (346,640) (1,143,437)
Transfers in - - 366,291 366,291 Transfers out - (120,000) - (120,000)
Change in net position (783,074) (133,723) 19,651 (897,146) Total net position - beginning as restated 6,588,748 2,841,898 311,031 9,741,677 Total net position - ending 5,805,674$ 2,708,175$ 330,682$ 8,844,531$

CHATHAM COUNTY, GEORGIA NONMAJOR ENTERPRISE FUNDS
COMBINING STATEMENT OF CASH FLOWS FOR THE YEAR ENDED JUNE 30, 2015
F-18
Water and Sewer Fund
Parking Garage Fund
Building Safety and Regulatory Services Total
Cash flows from operating activities:Cash received from customers 2,226,905$ 435,274$ 956,878$ 3,619,057$ Cash payments to employees for services (478,583) (116,820) (733,113) (1,328,516) Cash payments to suppliers for goods and services (1,815,053) (268,634) (539,525) (2,623,212)
Net cash provided (used) by operating activities (66,731) 49,820 (315,760) (332,671)
Cash flows from noncapital financing activities:Transfers in - - 366,291 366,291 Transfers out - (120,000) - (120,000)
Net cash provided (used) by noncapital financing activities - (120,000) 366,291 246,291
Cash flows from capital and related financing activities:Acquisitions and construction of capital assets (137,000) - - (137,000)
Net cash (used) by capital and related financing activities (137,000) - - (137,000)
Cash flows from investing activities:Interest earned on cash and investments 2,659 1,183 - 3,842
Net cash provided (used) by investing activities 2,659 1,183 - 3,842
Net increase (decrease) in cash and cash equivalents (201,072) (68,997) 50,531 (219,538) Cash and cash equivalents, beginning of year 2,459,542 1,546,144 838,358 4,844,044 Cash and cash equivalents, end of year 2,258,470$ 1,477,147$ 888,889$ 4,624,506$
Reconciliation of operating income to net cash provided by (used in) operating activities:
Operating income (loss) (785,733)$ (14,906)$ (346,640)$ (1,147,279)$ Adjustments to reconcile operating income
to net cash provided by operating activities:Depreciation 303,947 73,219 5,469 382,635
Change in assets and liabilities:(Increase) decrease in accounts receivables 206,989 - - 206,989 (Increase) decrease in deferred outflows (21,747) (4,599) (47,268) (73,614) Increase (decrease) in accounts payable
and other accrued liabilities 205,838 (11,088) (16,511) 178,239 Increase (decrease) in net pension liability 994 210 2,159 3,363 Increase (decrease) in net OPEB obligations 17,438 5,812 74,982 98,232 Increase (decrease) in deferred inflows 5,543 1,172 12,049 18,764
Total adjustments 719,002 64,726 30,880 814,608 Net cash provided (used) by operating activities (66,731)$ 49,820$ (315,760)$ (332,671)$

CHATHAM COUNTY, GEORGIA INTERNAL SERVICE FUNDS
COMBINING STATEMENT OF NET POSITION JUNE 30, 2015
F-19
Health Insurance
Risk Management
FundCatastrophic
Claims
Computer Replacement
Fund TotalASSETS AND DEFERREDOUTFLOWS OF RESOURCESCurrent assets:
Cash and investments 10,381,149$ 8,470,426$ -$ 421,886$ 19,273,461$ Receivable, net 73,120 157,357 - - 230,477 Prepaid Expenses - 135,706 - - 135,706
Total assets 10,454,269 8,763,489 - 421,886 19,639,644
Deferred outflows of resourcesRelated to pensions 6,243 9,261 - - 15,504
Total assets and deferred outflows of resources 10,460,512 8,772,750 - 421,886 19,655,148
LIABILITIES AND DEFERREDINFLOWS OF RESOURCESCurrent Liabilities:
Accounts payable 383,371 24,708 - 210,472 618,551Other accrued expenses 1,796 2,029 - - 3,825
Noncurrent Liabilities:Claims payable 820,000 2,337,321 - - 3,157,321Net pension liability 39,605 58,746 - - 98,351
Total liabilities 1,244,772 2,422,804 - 210,472 3,878,048
Deferred inflows of resourcesRelated to pensions 1,591 2,361 - - 3,952
Total liabilities and deferred inflows of resources 1,246,363 2,425,165 - 210,472 3,882,000
NET POSITIONUnrestricted 9,214,149 6,347,585 - 211,414 15,773,148
Total net position 9,214,149$ 6,347,585$ -$ 211,414$ 15,773,148$

CHATHAM COUNTY, GEORGIA INTERNAL SERVICE FUNDS
COMBINING STATEMENT OF REVENUES, EXPENSES, AND CHANGES IN FUND NET POSITION FOR THE YEAR ENDED JUNE 30, 2015
F-20
Health Insurance
Risk Management
FundCatastrophic
Claims
Computer Replacement
Fund TotalOPERATING REVENUES
Employee contributions 3,124,143$ -$ -$ -$ 3,124,143$ Employer contributions 19,362,274 - - - 19,362,274 Other 1,316,880 629,550 - - 1,946,430 Charges for services - - - 428,317 428,317 Total operating revenues 23,803,297 629,550 - 428,317 24,861,164
OPERATING EXPENSESRisk management 16,828,369 3,634,443 - - 20,462,812 Information services - - - 287,287 287,287 Administrative fees 2,629,617 202,768 - - 2,832,385
Total operating expenses 19,457,986 3,837,211 - 287,287 23,582,484 Operating income (loss) 4,345,311 (3,207,661) - 141,030 1,278,680
NON-OPERATING REVENUES (EXPENSES)Interest and investment revenue (expense) 1,752 4,953 - - 6,705
Total non-operating revenue (expenses) 1,752 4,953 - - 6,705 Income (loss) before transfers 4,347,063 (3,202,708) - 141,030 1,285,385
Transfers in - 6,048,895 - - 6,048,895 Transfers out - - (1,773,895) - (1,773,895)
Change in net position 4,347,063 2,846,187 (1,773,895) 141,030 5,560,385 Total net position - beginning as restated 4,867,086 3,501,398 1,773,895 70,384 10,212,763 Total net position - ending 9,214,149$ 6,347,585$ -$ 211,414$ 15,773,148$

CHATHAM COUNTY, GEORGIA INTERNAL SERVICE FUNDS
COMBINING STATEMENT OF CASH FLOWS FOR THE YEAR ENDED JUNE 30, 2015
F-21
Health Insurance
Risk Management
FundCatastrophic
Claims
Computer Replacement
Fund Total
Cash flows from operating activities:Employee and employer contributions 22,486,417$ -$ -$ -$ 22,486,417$ Other 1,316,880 936,611 - 428,317 2,681,808 Risk management fees 182,890 - - - 182,890 Payment of claims, fees and expenses (20,639,448) (3,751,387) - (288,449) (24,679,284)
Net cash provided (used) by operating activities 3,346,739 (2,814,776) - 139,868 671,831
Cash flows from noncapital financing activities:Transfers in - 6,048,895 - - 6,048,895 Transfers out - - (1,773,895) - (1,773,895)
Net cash provided (used) by noncapital financing activities - 6,048,895 (1,773,895) - 4,275,000
Cash flows from investing activities:Interest earned on cash and investments 1,752 4,953 - - 6,705
Net cash provided (used) by investing activities 1,752 4,953 - - 6,705
Net increase (decrease) in cash and cash equivalents 3,348,491 3,239,072 (1,773,895) 139,868 4,953,536 Cash and cash equivalents, beginning of year 7,032,658 5,231,354 1,773,895 282,018 14,319,925 Cash and cash equivalents, end of year 10,381,149$ 8,470,426$ -$ 421,886$ 19,273,461$
Reconciliation of operating income to net cash provided by (used in) operating activities:
Operating income (loss) 4,345,311$ (3,207,661)$ -$ 141,030$ 1,278,680$ Adjustments to reconcile operating income
to net cash provided by operating activities:Change in assets and liabilities:
(Increase) decrease in other receivables 182,890 307,061 - - 489,951 (Increase) decrease in prepaids - 94,469 94,469 (Increase) decrease in deferred outflows (6,243) (9,261) (15,504) Increase (decrease) in accounts / noncurrent payables (1,176,810) (1,745) - (1,162) (1,179,717) Increase (decrease) in deferred inflows 1,591 2,361 3,952
Total adjustments (998,572) 392,885 - (1,162) (606,849) Net cash provided (used) by operating activities 3,346,739$ (2,814,776)$ -$ 139,868$ 671,831$


FIDUCIARY FUNDS
TRUST FUNDS: Pension Trust Fund – To account for the public employee retirement plan. Other Post-Employment Benefit (OPEB) Fund – To account for transactions related to retiree healthcare and other post-employment benefits, including activities related to the prefunding of retiree healthcare. AGENCY FUNDS: Agency Funds are used to account for assets held by a governmental unit in a trustee capacity as an agent for individuals, private organizations and other governmental units. Tax Commissioner - To account for all real, personal, tangible, and intangible recording taxes collected and forwarded to the County and other governmental bodies. Flexible Benefit Plan - To provide eligible Employees with a means of (1) selecting benefits from a "cafeteria" which are best to his/her family's needs and (2) paying for certain types of expenses with PRE-TAX income dollars (referred to as Flexible Dollars), thus reducing taxable income and increasing net take-home pay. The following agency funds are used to account for fines, fees, and other monies collected by the courts and remitted to other parties in accordance with court orders: Clerk of Superior Court Registry of Superior Court Clerk’s Office State Court Sheriff’s Office of State and Superior Court Clerk’s Office Magistrate Court Probate Court Juvenile Court Superior Court Administrator

CHATHAM COUNTY, GEORGIA PENSION (AND OTHER EMPLOYEE BENEFIT) TRUST FUNDS
COMBINING STATEMENT OF PLAN NET POSITION JUNE 30, 2015
F-22
Pension Trust Fund
OPEB Trust Fund Total
ASSETSCash $ 4,680,596 $ 5,757,649 10,438,245$ Receivables:
Interest and dividend 561,766 - 561,766 Sale of investments 912,524 - 912,524 Accounts 67,274 12,833 80,107
Investments:U.S. government and agency obligations 18,892,222 - 18,892,222 Municipal bonds 214,920 - 214,920 Mortgage backed securities 4,981,136 - 4,981,136 Corporate bonds 33,408,405 - 33,408,405 Domestic stocks 70,022,476 - 70,022,476 Common / collective trust 55,025,297 - 55,025,297 International equity funds 20,443,652 - 20,443,652 Index funds - 37,865,612 37,865,612
Total Investments 202,988,108 37,865,612 240,853,720 Total assets 209,210,268 43,636,094 252,846,362
LIABILITIES Accounts payable 1,366,118 657,768 2,023,886
Total liabilities 1,366,118 657,768 2,023,886
NET POSITIONHeld in trust for pension and other employee benefits 207,844,150$ 42,978,326$ 250,822,476$
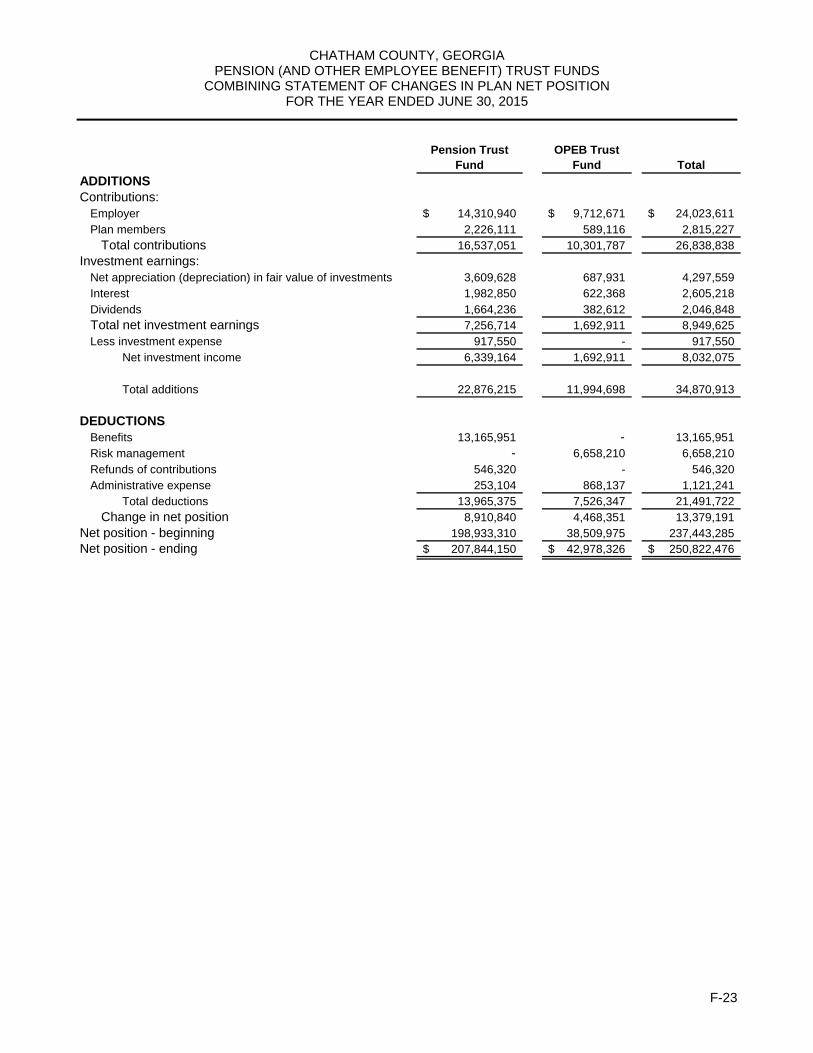
CHATHAM COUNTY, GEORGIA PENSION (AND OTHER EMPLOYEE BENEFIT) TRUST FUNDS
COMBINING STATEMENT OF CHANGES IN PLAN NET POSITION FOR THE YEAR ENDED JUNE 30, 2015
F-23
Pension Trust
FundOPEB Trust
Fund Total
ADDITIONSContributions:
Employer 14,310,940$ 9,712,671$ 24,023,611$ Plan members 2,226,111 589,116 2,815,227
Total contributions 16,537,051 10,301,787 26,838,838 Investment earnings:
Net appreciation (depreciation) in fair value of investments 3,609,628 687,931 4,297,559 Interest 1,982,850 622,368 2,605,218 Dividends 1,664,236 382,612 2,046,848 Total net investment earnings 7,256,714 1,692,911 8,949,625 Less investment expense 917,550 - 917,550
Net investment income 6,339,164 1,692,911 8,032,075
Total additions 22,876,215 11,994,698 34,870,913
DEDUCTIONSBenefits 13,165,951 - 13,165,951 Risk management - 6,658,210 6,658,210 Refunds of contributions 546,320 - 546,320 Administrative expense 253,104 868,137 1,121,241
Total deductions 13,965,375 7,526,347 21,491,722 Change in net position 8,910,840 4,468,351 13,379,191
Net position - beginning 198,933,310 38,509,975 237,443,285 Net position - ending 207,844,150$ 42,978,326$ 250,822,476$

CHATHAM COUNTY, GEORGIA AGENCY FUNDS
COMBINING STATEMENT OF CHANGES IN ASSETS AND LIABILITIES FOR THE YEAR ENDED JUNE 30, 2015
F-24
Balance Balance
July 1, 2014 Additions Deductions June 30, 2015
TAX COMMISSIONER
Assets:Cash and investments 14,728,825$ 256,267,873$ 233,480,020$ 37,516,678$
Total Assets 14,728,825$ 256,267,873$ 233,480,020$ 37,516,678$
Liabilities:Due to others 14,728,825$ 256,267,873$ 233,480,020$ 37,516,678$
Total Liabilities 14,728,825$ 256,267,873$ 233,480,020$ 37,516,678$
CLERK OF SUPERIOR COURT
Assets:Cash and investments 551,839$ 4,839,715$ 4,844,267$ 547,287$
Total Assets 551,839$ 4,839,715$ 4,844,267$ 547,287$
Liabilities:
Due to others 551,839$ 4,839,715$ 4,844,267$ 547,287$
Total Liabilities 551,839$ 4,839,715$ 4,844,267$ 547,287$
REGISTRY OF SUPERIOR COURT
Assets:Cash and investments 4,974,346$ 5,822,988$ 5,216,931$ 5,580,403$
Total Assets 4,974,346$ 5,822,988$ 5,216,931$ 5,580,403$
Liabilities:Due to others 4,974,346$ 5,822,988$ 5,216,931$ 5,580,403$
Total Liabilities 4,974,346$ 5,822,988$ 5,216,931$ 5,580,403$
CLERK'S OFFICE STATE COURT
Assets:Cash and investments 123,039$ 1,395,165$ 1,385,253$ 132,951$
Total Assets 123,039$ 1,395,165$ 1,385,253$ 132,951$
Liabilities:Due to others 123,039$ 1,395,165$ 1,385,253$ 132,951$
Total Liabilities 123,039$ 1,395,165$ 1,385,253$ 132,951$
(Continued)

CHATHAM COUNTY, GEORGIA AGENCY FUNDS
COMBINING STATEMENT OF CHANGES IN ASSETS AND LIABILITIES FOR THE YEAR ENDED JUNE 30, 2015
F-25
Balance BalanceJuly 1, 2014 Additions Deductions June 30, 2015
SHERIFF'S OFFICE STATE AND SUPERIOR COURTS
Assets:Cash and investments 1,804,280$ 4,201,818$ 4,146,678$ 1,859,420$
Total Assets 1,804,280$ 4,201,818$ 4,146,678$ 1,859,420$
Liabilities:Due to others 1,804,280$ 4,201,818$ 4,146,678$ 1,859,420$
Total Liabilities 1,804,280$ 4,201,818$ 4,146,678$ 1,859,420$
CLERK'S OFFICE MAGISTRATE COURT
Assets:Cash and investments 95,259$ 1,834,229$ 1,836,395$ 93,093$
Total Assets 95,259$ 1,834,229$ 1,836,395$ 93,093$
Liabilities:Due to others 95,259$ 1,834,229$ 1,836,395$ 93,093$
Total Liabilities 95,259$ 1,834,229$ 1,836,395$ 93,093$
PROBATE COURT
Assets:Cash and investments 10$ 9,935$ -$ 9,945$
Total Assets 10$ 9,935$ -$ 9,945$
Liabilities:Due to others 10$ 9,935$ -$ 9,945$
Total Liabilities 10$ 9,935$ -$ 9,945$
JUVENILE COURT
Assets:Cash and investments 7,851$ 34,806$ 36,128$ 6,529$
Total Assets 7,851$ 34,806$ 36,128$ 6,529$
Liabilities:Due to others 7,851$ 34,806$ 36,128$ 6,529$
Total Liabilities 7,851$ 34,806$ 36,128$ 6,529$
(Continued)

CHATHAM COUNTY, GEORGIA AGENCY FUNDS
COMBINING STATEMENT OF CHANGES IN ASSETS AND LIABILITIES FOR THE YEAR ENDED JUNE 30, 2015
F-26
Balance BalanceJuly 1, 2014 Additions Deductions June 30, 2015
SUPERIOR COURT ADMINISTRATOR
Assets:Cash and investments 302,068$ 299,861$ 249,402$ 352,527$
Total Assets 302,068$ 299,861$ 249,402$ 352,527$
Liabilities:Due to others 302,068$ 299,861$ 249,402$ 352,527$
Total Liabilities 302,068$ 299,861$ 249,402$ 352,527$
FLEX BENEFIT PLAN
Assets:Cash and investments 94,155$ 718,118$ 748,576$ 63,697$
Total Assets 94,155$ 718,118$ 748,576$ 63,697$
Liabilities:Due to others 94,155$ 718,118$ 748,576$ 63,697$
Total Liabilities 94,155$ 718,118$ 748,576$ 63,697$
TOTAL
Assets:Cash and investments 22,681,672$ 275,424,508$ 251,943,650$ 46,162,530$
Total Assets 22,681,672$ 275,424,508$ 251,943,650$ 46,162,530$
Liabilities:Due to others 22,681,672$ 275,424,508$ 251,943,650$ 46,162,530$
Total Liabilities 22,681,672$ 275,424,508$ 251,943,650$ 46,162,530$
(Concluded)

G - 1
COMMENT RELATIVE TO STATISTICAL SECTION Statistical tables differ from financial statements because they usually cover more than one fiscal year and may present non-accounting data. These reflect social and economic data, financial trends, and the fiscal capacity of the government. The tables are un-audited due to the nature of the information contained therein.


This part of the Chatham County's comprehensive annual financial report presents detailedinformation as a context for understanding what the information in the financial statements, note disclosures, and required supplementary information says about the government's overallfinancial health.
Contents Page
Financial Trends G-3
These schedules contain trend information to help the reader understandhow the government's financial performance and well-being have changedover time.
Revenue Capacity G-12
These schedules contain information to help the reader assess the govern-ment's most significant local revenue source, the property tax.
Debt Capacity G-21
These schedules present information to help the reader assess the afforda-bility of the government's current levels of outstanding debt and the govern-ment's ability to issue additional debt in the future.
Demographic and Economic Information G-25
These schedules offer demographic and economic indicators to help thereader understand the environment within which the government's financialactivities take place.
Operating Information G-27
These schedules contain service and infrastructure data to help the readerunderstand how the information in the government's financial report relatesto the services the government provides and the activities it performs.
STATISTICAL SECTION
G-2

G-3
Fiscal Year
2006 2007 2008 2009 2010
Governmental activities
Net Investment in Capital Assets 678,740,933$ 696,028,733$ 713,145,139$ 729,614,543$ 758,599,615$
Restricted 169,451,499 189,088,649 207,390,200 240,733,031 265,588,109
Unrestricted 42,827,583 50,055,974 59,152,523 65,110,178 68,874,739
Total governmental activities net position 891,020,015$ 935,173,356$ 979,687,862$ 1,035,457,752$ 1,093,062,463$
Business-type activities
Net Investment in Capital Assets 28,911,730$ 28,956,177$ 27,537,903$ 31,191,580$ 28,986,827$
Restricted 3,807,712 3,234,176 3,452,123 3,566,728 3,357,430
Unrestricted 5,838,624 7,318,244 7,100,798 8,643,967 7,772,723
Total business-type activities net position 38,558,066$ 39,508,597$ 38,090,824$ 43,402,275$ 40,116,980$
Primary government
Net Investment in Capital Assets 707,652,663$ 2 724,984,910$ 740,683,042$ 760,806,123$ 787,586,442$
Restricted 173,259,211 192,322,825 210,842,323 244,299,759 268,945,539
Unrestricted 48,666,207 57,374,218 66,253,321 73,754,145 76,647,462
Total primary government net position 929,578,081$ 974,681,953$ 1,017,778,686$ 1,078,860,027$ 1,133,179,443$
Fiscal Year
2011 2012 2013 2014 2015
Governmental activities
Net Investment in Capital Assets 783,384,110$ 858,665,930$ 875,718,908$ 872,404,763$ 864,460,707$
Restricted 265,594,545 199,540,812 181,855,679 186,408,358 185,440,053
Unrestricted 57,155,402 49,946,078 48,534,211 57,242,799 22,522,735
Total governmental activities net position 1,106,134,057$ 1,108,152,820$ 1,106,108,798$ 1,116,055,920$ 1,072,423,495$
Business-type activities
Net Investment in Capital Assets 33,164,137$ 40,815,977$ 50,923,079$ 54,966,073$ 8,242,759$
Restricted 2,905,368 2,780,353 2,794,914 2,736,253 2,392,990
Unrestricted 8,279,323 11,383,808 8,423,667 3,313,520 5,477,529
Total business-type activities net position 44,348,828$ 54,980,138$ 62,141,660$ 61,015,846$ 16,113,278$ *
Primary government
Net Investment in Capital Assets 816,548,247$ 899,481,907$ 926,641,987$ 927,370,836$ 872,703,466$
Restricted 268,499,913 202,321,165 184,650,593 189,144,611 187,833,043
Unrestricted 65,434,725 61,329,886 56,957,878 60,556,319 28,000,264
Total primary government net position 1,150,482,885$ 1,163,132,958$ 1,168,250,458$ 1,177,071,766$ 1,088,536,773$
* Variance from prior years reflects the removal of Chatham Area Transit as a blended component unit for fiscal year 2015.
Chatham County, Georgia
Net Position by Component
(accrual basis of accounting)
Last Ten Fiscal Years

* Retroactive infrastructure reporting occurred in 2006 G-4
0
200
400
600
800
1000
1200
1400
2006* 2007 2008 2009 2010 2011 2012 2013 2014 2015
Ne
t Po
sitio
n in
Mill
ion
s
Year
Chatham County, GeorgiaTotal Government Net Position
Last Ten Fiscal Years
Net Investment in Capital Assets Restricted Net Position Unrestricted Net Position

G-5
Chatham County, Georgia
Change in Net Position
Last Ten Fiscal Years
Fiscal Year
2006 2007 2008 2009
Expenses
Governmental activities:
General government 26,628,117$ 31,378,123$ 36,273,315$ 41,390,534$
Judiciary 22,706,196 24,177,726 27,166,934 28,081,609
Public safety 58,527,308 63,510,567 69,967,038 70,319,328
Public works 47,283,087 59,577,210 45,916,050 31,865,047
Health & Welfare 12,715,744 9,510,033 11,009,709 11,235,644
Culture and Recreation 13,069,470 14,430,717 10,893,167 14,557,184
Housing and development 2,888,091 3,893,952 3,966,632 3,486,707
Interest on long-term debt 2,391,033 1,853,056 1,744,059 1,586,223
Total governmental activities expenses 186,209,046 208,331,384 206,936,904 202,522,276
Business-type activities:
Environmental Services-Solid Waste 3,013,304 2,386,961 2,716,415 2,753,251
Transportation Services-Bus 15,820,334 16,800,605 17,542,383 18,399,887
Recreation Services-Golf 859,989 944,428 845,951 19,321
Other Services-Water & Sewer 1,829,210 1,734,867 2,332,897 2,449,676
Other Services-Parking 220,922 282,492 280,300 282,531
Other Services-Building Safety&Reg Serv 1,460,642 1,372,667 1,659,874 1,762,668
Total business-type activities expenses 23,204,401 23,522,020 25,377,820 25,667,334
Total primary government expenses 209,413,447$ 231,853,404$ 232,314,724$ 228,189,610$
Program Revenues
Governmental activities:
Charges for services:
General Government 6,149,689$ 7,144,308$ 6,894,489$ 7,038,775$
Judiciary 6,449,303 6,876,140 6,107,013 5,889,247
Public Safety 4,424,964 4,520,152 4,675,567 5,449,195
All Other Services 1,486,074 1,219,505 2,113,296 1,891,073
Operating grants and contributions 4,930,727 4,655,009 4,718,898 4,948,290
Capital grants and contributions 1,233,710 11,483,299 1,165,703 14,745,626
Total governmental activities program revenues 24,674,467 35,898,413 25,674,966 39,962,206
Business-type activities:
Charges for services:
Transportation - Bus System 4,134,209 4,272,812 4,581,017 3,361,718
Water & Sewer 1,658,568 1,922,083 1,848,202 1,894,733
All Other Services 3,314,076 2,651,658 2,834,551 1,952,802
Operating grants and contributions 1,410,159 3,135,668 1,288,094 3,879,731
Capital grants and contributions 4,015,642 1,396,623 1,130,809 5,260,943
Total business-type activities program revenues 14,532,654 13,378,844 11,682,673 16,349,927 Total primary government program revenues 39,207,121$ 49,277,257$ 37,357,639$ 56,312,133$
Net (expense)/revenue
Governmental activities (161,534,579)$ (172,432,971)$ (181,261,938)$ (162,560,070)$
Business-type activities (8,671,747) (10,143,176) (13,695,147) (9,317,407) Total primary government net (expense) (170,206,326)$ (182,576,147)$ (194,957,085)$ (171,877,477)$
General Revenues and Other Changes
in Net Position
Governmental activities:
Taxes
Property taxes 104,165,430$ 117,172,970$ 128,541,648$ 136,671,942$
Sales taxes 10,757,985 11,131,700 11,320,293 10,099,667
Special purpose local option sales taxes 60,501,173 63,129,402 63,927,742 56,649,500
Other taxes 7,551,652 8,837,226 8,678,131 8,724,781
Contributions not restricted for specific prog 3,931,963 3,996,029 4,000,200 4,138,932
Unrestricted investment earnings 7,520,599 11,683,260 10,373,448 4,480,682
Miscellaneous 2,691,205 4,601,500 3,412,435 2,876,528
Transfers (3,280,940) (3,965,774) (4,477,453) (5,312,072)
Total governmental activities 193,839,067 216,586,313 225,776,444 218,329,960
Business-type activities:
Taxes 5,608,939 6,410,747 7,239,064 7,602,999
Contributions not restricted for specific prog - - - -
Unrestricted investment earnings 648,245 712,810 560,859 203,759
Miscellaneous 18,731 4,375 - 1,510,028
Transfers 3,280,940 3,965,774 4,477,453 5,312,072
Total business-type activities 9,556,855 11,093,706 12,277,376 14,628,858 Total primary government 203,395,922$ 227,680,019$ 238,053,820$ 232,958,818$
Change in Net Position
Governmental activities 32,304,488$ 44,153,342$ 44,514,506$ 55,769,890$
Business-type activities 885,108 950,530 (1,417,771) 5,311,451 Total primary government 33,189,596$ 45,103,872$ 43,096,735$ 61,081,341$
* Variance from prior years reflects the removal of Chatham Area Transit as a blended component unit for fiscal year 2015.

G-6
Fiscal Year
2010 2011 2012 2013 2014 2015
40,142,519$ 41,113,211$ 38,222,886$ 40,192,252$ 40,945,542$ 44,742,008$
29,869,363 31,862,612 33,077,342 32,294,958 34,250,520 34,014,080
78,673,805 78,630,167 82,017,018 82,319,160 90,381,447 90,749,438
22,221,382 49,114,045 64,247,447 66,645,960 76,564,482 74,736,144
11,652,725 11,214,405 12,594,263 11,772,799 11,817,249 10,992,259
12,118,894 12,530,062 11,694,459 12,090,624 12,427,844 12,760,485
2,778,599 3,001,435 2,863,021 2,748,006 2,840,861 3,080,182
1,432,163 1,203,628 1,156,132 1,377,963 997,546 1,004,330
198,889,450 228,669,565 245,872,568 249,441,722 270,225,491 272,078,926
2,881,772 3,018,094 3,131,130 3,269,306 3,269,247 3,612,473
18,183,426 19,980,095 20,004,165 22,804,966 24,120,405 -
21,421 - - - - -
2,679,367 2,699,907 2,798,991 3,068,287 2,335,339 2,809,031
287,934 307,880 382,021 417,469 481,516 450,180
1,328,181 1,099,670 1,118,281 1,087,369 1,177,062 1,303,518
25,382,101 27,105,646 27,434,588 30,647,397 31,383,569 8,175,202 *
224,271,551$ 255,775,211$ 273,307,156$ 280,089,119$ 301,609,060$ 280,254,128$
6,833,044$ 7,148,633$ 6,702,952$ 7,425,280$ 7,865,265$ 8,011,193$
5,816,833 6,979,559 6,352,925 7,319,262 6,722,988 6,696,584
5,273,114 6,540,653 6,138,624 5,277,933 5,502,407 5,722,415
1,933,033 1,991,625 2,055,154 1,989,101 2,399,162 2,449,336
5,877,512 5,600,070 6,044,905 7,268,442 6,228,108 7,193,606
11,242,146 8,762,045 1,601,810 4,319,524 10,892,860 4,042,713
36,975,682 37,022,585 28,896,370 33,599,542 39,610,790 34,115,847
3,607,722 3,682,967 5,041,372 4,897,747 4,799,251 -
2,342,055 2,342,445 2,568,036 2,391,040 2,010,562 1,999,526
2,479,426 3,370,715 3,183,795 3,006,262 3,466,160 3,372,609
995,974 2,373,347 2,971,667 2,605,747 3,155,718
6,633,637 6,965,122 13,204,967 14,033,940 3,695,904
16,058,814 18,734,596 26,969,837 26,934,736 17,127,595 5,372,135 *53,034,496$ 55,757,181$ 55,866,207$ 60,534,278$ 56,738,385$ 39,487,982$
(161,913,768)$ (191,646,980)$ (216,976,198)$ (215,842,180)$ (230,614,701)$ (237,963,079)$
(9,323,287) (8,371,050) (464,751) (3,712,661) (14,255,974) (2,803,067) *(171,237,055)$ (200,018,030)$ (217,440,949)$ (219,554,841)$ (244,870,675)$ (240,766,146)$
135,014,252$ 128,364,185$ 132,050,472$ 131,796,403$ 152,267,395$ 149,024,634$
10,140,321 10,400,703 11,033,575 11,862,493 14,015,693 15,375,903
56,969,395 58,430,283 61,976,814 61,817,942 62,304,760 66,886,005
8,472,967 8,620,498 9,037,342 10,133,527 12,580,176 12,138,748
- - - - - -
2,220,501 262,493 203,600 158,618 127,667 557,889
3,663,979 3,742,532 8,325,208 1,667,244 2,973,993 611,244
2,698,374 (3,635,197) (3,632,050) (3,638,069) (3,707,861) (1,325,989)
219,179,789 206,185,497 218,994,961 213,798,158 240,561,823 243,268,434
7,365,560 7,040,098 7,225,676 7,059,897 8,979,841 584,193
- - - - - -
32,822 15,252 13,171 19,043 14,326 14,306
1,337,984 1,676,815 225,164 157,174 428,132 42,167
(2,698,374) 3,635,197 3,632,050 3,638,069 3,707,861 1,325,989
6,037,992 12,367,362 11,096,061 10,874,183 13,130,160 1,966,655 *225,217,781$ 218,552,859$ 230,091,022$ 224,672,341$ 253,691,983$ 245,235,089$
57,266,021$ 14,538,517$ 2,018,763$ (2,044,022)$ 9,947,122$ 5,305,355$
(3,285,295) 3,996,312 10,631,310 7,161,522 (1,125,814) (836,412) *53,980,726$ 18,534,829$ 12,650,073$ 5,117,500$ 8,821,308$ 4,468,943$

G-7
-10
0
10
20
30
40
50
60
70
2006 2007 2008 2009 2010 2011 2012 2013 2014 2015
Net
Po
siti
on
in M
illi
on
s
Year
Chatham County, GeorgiaChange in Net PositionLast Ten Fiscal Years
Governmental Activities Business-Type Activities


G-8
2006 2007 2008 2009 2010
General FundReserved 2,202,127$ 2,814,403$ 3,211,614$ 3,569,949$ 3,697,001$ Unreserved 14,500,833 20,173,244 20,643,756 26,291,110 26,765,482 NonspendableRestrictedCommittedAssigned Unassigned
Total General Fund 16,702,960$ 22,987,647$ 23,855,370$ 29,861,059$ 30,462,483$
Special Service DistrictReserved 215,801$ 534,767$ 635,702$ 676,611$ 586,877$ Unreserved 8,588,678 10,044,579 10,094,085 7,136,648 6,092,597 NonspendableCommittedAssigned
Total Special Service District 8,804,479$ 10,579,346$ 10,729,787$ 7,813,259$ 6,679,474$
All other governmental fundsReserved 1,193,937$ 1,130,387$ 1,087,973$ 1,185,865$ 1,288,440$ Unreserved, reported in
Special Revenue funds 590,083 573,016 918,602 539,802 614,330 Capital Projects funds 190,836,999 205,491,350 225,340,221 263,516,748 279,473,457
NonspendableRestricted
Special Revenue fundsCapital Projects funds
CommittedDebt Service fundSpecial Revenue funds
Assigned Capital Projects funds
Total all other governmental funds 192,621,019$ 207,194,753$ 227,346,796$ 265,242,415$ 281,376,227$
* Fiscal year 2011 reflects implementation of GASB 54
Chatham County, GeorgiaFund Balances of Governmental Funds
Last Ten Fiscal Years(modified accrual basis of accounting)
Fiscal Year

G-9
2011 * 2012 2013 2014 2015
-$ -$ -$ -$ -$ - - - - -
391,592 193,723 393,391 175,186 501,065 27,469 32,051 819,621 20,342 16,238
25,263,637 26,255,266 27,275,919 27,741,295 42,637,808 - 3,376,713 - - -
8,294,469 5,448,960 5,546,028 11,343,341 1,245,990
33,977,167$ 35,306,713$ 34,034,959$ 39,280,164$ 44,401,101$
-$ -$ -$ -$ -$ - - - - -
17,745 - 18,869 - 39,833 4,461,857 4,643,661 4,883,873 4,914,704 7,621,172 2,550,093 1,937,011 375,139 2,662,396 1,192,580
7,029,695$ 6,580,672$ 5,277,881$ 7,577,100$ 8,853,585$
-$ -$ -$ -$ -$
- - - - - - - - - - - - - 26,667 -
4,017,412 - - - - 261,549,664 199,508,761 181,036,058 182,347,724 184,933,697
107,956 85,191 122,476 124,909 2,105,514 - - - 851,720 1,194,263
17,479,627 17,689,732 17,698,901 21,613,877 26,478,413
283,154,659$ 217,283,684$ 198,857,435$ 204,964,897$ 214,711,887$
Fiscal Year

G-10
(modified accrual basis of accounting)
Fiscal Year 2006 2007 2008 2009 2010
Revenues
Property tax 104,352,737$ 116,150,102$ 125,521,319$ 133,397,243$ 132,728,556$ Local option sales tax 10,582,405 11,340,317 11,264,839 10,711,764 10,269,046 Other taxes 67,567,352 73,143,916 72,377,755 70,169,978 65,442,362 Penalties and Interest 1,540,502 1,357,969 1,372,762 2,001,759 2,572,596 Licenses and permits 1,222,548 1,179,107 1,605,962 1,361,049 1,422,555 Homeowners tax relief grant 3,931,963 3,996,029 4,000,200 4,138,932 - Revenue from other gov't units 8,013,138 7,909,650 7,220,809 19,898,333 11,018,104 Charges for services 11,486,708 11,869,879 12,690,690 13,439,295 13,004,389 Fines and fees 5,404,765 5,779,874 5,090,674 5,051,395 4,929,272 Investment Income 6,805,336 11,412,977 11,284,540 4,500,136 2,251,592 Other revenue 1,753,418 2,670,657 2,475,578 989,803 1,145,464
Total revenues 222,660,872 246,810,477 254,905,128 265,659,687 244,783,936
Expenditures
General government 25,758,655 28,550,112 33,329,080 37,072,462 38,755,542 Judiciary 21,751,337 23,304,201 26,137,105 28,035,246 28,709,020 Public safety 55,809,616 60,604,208 66,708,288 70,327,890 71,908,210 Public works 5,975,556 6,461,241 7,013,356 7,503,887 7,658,085 Health and Welfare 9,304,219 9,414,523 10,185,649 10,417,256 10,762,012 Culture and recreation 9,155,539 9,323,037 10,158,944 11,255,735 10,783,734 Housing and development 2,845,698 3,179,079 3,955,423 3,492,920 2,780,122 Capital Outlay 54,077,355 71,710,508 62,734,320 41,958,305 47,761,784 Debt Service
Principal 4,139,581 3,841,360 3,989,548 4,986,053 4,074,131 Interest 1,560,742 1,908,476 1,815,755 1,680,278 1,535,220
Intergovernmental
Total expenditures 190,378,298 218,296,745 226,027,468 216,730,032 224,727,860
Excess of revenues over (under) expenditures 32,282,574 28,513,732 28,877,660 48,929,655 20,056,076
Other financing sources (uses)
Transfers in 16,122,395 11,470,537 11,581,007 11,408,332 4,430,811 Transfers out (22,307,997) (18,630,923) (19,526,460) (19,555,914) (11,285,436) Settlement Proceeds - - - - -Sale of Capital Assets - - - 202,707 -Capital Leases 265,000 1,279,942 238,000 - - Debt Issuance Proceeds - - - - 2,400,000 Premium on Debt issuance 221,126 - - - -Debt Issuance Refunding Proceeds 6,075,000 - - - -Payment to Refunded Bond Escrow Agent (6,291,317) - - - -
Total other financing sources (uses) (5,915,793) (5,880,444) (7,707,453) (7,944,875) (4,454,625)
Net change in fund balances 26,366,781$ 22,633,288$ 21,170,207$ 40,984,780$ 15,601,451$
Debt services as a percentage of noncapital expenditures 3.2% 3.1% 3.0% 3.5% 3.0%
Chatham County, GeorgiaChanges in Fund Balances of Governmental Funds
Last Ten Fiscal Years

G-11
Fiscal Year2011 2012 2013 2014 2015
132,415,641$ 132,965,834$ 133,544,932$ 151,696,506$ 148,543,936$ 10,384,895 11,166,793 11,862,493 14,015,693 15,375,903 67,050,781 71,014,156 72,175,002 75,729,434 79,792,055 3,470,785 2,619,584 1,820,780 1,772,218 1,521,915 1,254,008 1,367,458 1,388,524 1,549,099 1,635,380
- - - - - 13,989,989 8,223,973 11,890,917 12,532,760 12,538,796 15,492,151 15,152,443 14,606,807 15,395,600 16,021,165 5,795,626 5,193,608 6,043,970 6,474,114 5,673,323 1,501,744 1,208,657 281,188 1,386,858 1,905,667 2,408,167 1,063,767 2,163,457 875,230 3,229,326
253,763,787 249,976,273 255,778,070 281,427,512 286,237,466
36,429,663 35,744,923 37,441,057 37,005,925 41,395,729 29,465,768 30,383,750 31,542,185 32,415,221 34,002,742 73,517,089 76,310,930 80,886,657 85,159,777 86,299,125 7,272,206 7,126,435 7,270,013 7,596,506 9,176,185
10,090,748 11,378,764 10,963,523 10,851,959 10,264,179 10,821,117 10,591,068 10,905,769 11,150,909 11,702,791 2,928,801 2,803,766 2,746,450 2,807,469 3,146,659
43,618,341 96,040,412 54,416,115 37,057,612 30,135,803
4,277,976 1,767,982 1,577,241 1,584,650 1,466,661 1,337,649 1,220,089 1,106,880 1,038,907 1,132,998
22,889,490 38,279,706 31,884,904 34,840,050 40,360,544
242,648,848 311,647,825 270,740,794 261,508,985 269,083,416
11,114,939 (61,671,552) (14,962,724) 19,918,527 17,154,050
7,204,185 5,134,281 6,965,142 7,985,695 11,156,170 (13,039,382) (11,133,181) (13,003,211) (14,252,336) (16,757,159)
- - - - -- - - - - - - - - 4,301,351 - 2,680,000 - - - - - - - -- - - - 9,840,000 - - - - (9,550,000)
(5,835,197) (3,318,900) (6,038,069) (6,266,641) (1,009,638)
5,279,742$ (64,990,452)$ (21,000,793)$ 13,651,886$ 16,144,412$
2.7% 1.4% 1.2% 1.1% 1.0%

G-12
Special PurposeLocal Option
Fiscal Year Property Tax General Sales Tax Sales Tax Other Taxes Total
2006 104,165,430 10,757,985 60,501,173 7,551,652 182,976,240
2007 117,172,970 11,131,700 63,129,402 8,837,226 200,271,298
2008 128,541,648 11,320,293 63,927,742 8,678,131 212,467,814
2009 136,671,942 10,099,667 56,649,500 8,724,781 212,145,890
2010 135,014,252 10,140,321 56,969,395 8,472,967 210,596,935
2011 128,364,185 10,400,703 58,430,283 8,620,498 205,815,669
2012 132,050,472 11,003,575 61,976,814 9,037,342 214,068,203
2013 131,796,403 11,862,493 61,817,942 10,133,527 215,610,365
2014 152,267,395 14,015,693 62,304,760 12,580,176 241,168,024
2015 149,024,634 15,375,903 66,886,005 12,138,748 243,425,290
(accrual basis of accounting)
Chatham County, GeorgiaGovernmental Activities Tax Revenues By Source
Last Ten Fiscal Years


G-13
Consolidated County(General Fund), Chatham Area Transit Authority & Unincorporated County Digests
FiscalYear Less: Total Taxable
Ended Residential Commercial Motor Tax Exempt AssessedJune 30 Property Property Vehicles Other Real Property Value
Consolidated County (General Fund) Digest:
2006 6,686,669,784 4,272,421,397 541,145,780 316,897,015 2,737,009,482 9,080,124,494
2007 7,815,086,276 4,788,280,472 584,847,980 321,696,198 3,179,281,578 10,330,629,348
2008 8,511,821,885 5,161,677,053 617,291,700 314,856,764 3,465,188,057 11,140,459,345
2009 8,175,750,944 5,471,813,298 642,274,660 315,321,367 3,282,404,810 11,322,755,459
2010 7,632,936,591 5,367,205,198 576,195,090 318,841,813 2,914,272,177 10,980,906,515
2011 6,784,829,675 5,537,313,621 577,043,990 307,549,363 2,687,252,473 10,519,484,176
2012 6,615,204,379 5,732,643,055 616,388,070 290,820,582 2,695,589,558 10,559,466,528
2013 6,744,574,664 5,995,070,899 653,925,150 293,856,255 2,892,750,353 10,794,676,615
2014 6,784,682,074 6,404,472,261 549,492,390 291,363,820 3,066,153,800 10,963,856,745
2015 6,809,318,800 7,098,326,556 368,337,530 299,569,731 3,163,364,651 11,412,187,966
Chatham Area Transit Authority Digest:
2006 5,436,024,456 3,667,029,321 448,517,100 269,749,480 2,361,278,193 7,460,042,164
2007 6,284,370,985 4,064,277,921 488,333,370 263,616,477 2,733,221,126 8,367,377,627
2008 6,785,890,131 4,337,828,800 503,797,180 248,087,788 2,969,751,770 8,905,852,129
2009 6,536,815,427 4,563,237,889 519,266,560 246,824,916 2,821,339,441 9,044,805,351
2010 6,092,871,013 4,456,464,236 460,257,660 247,013,573 2,493,245,574 8,763,360,908
2011 5,472,936,253 4,562,861,220 460,894,390 238,860,217 2,334,741,216 8,400,810,864
2012 5,318,780,438 4,740,326,881 493,824,400 231,998,082 2,344,969,790 8,439,960,011
2013 5,422,176,674 4,968,832,478 523,227,170 235,029,889 2,534,420,451 8,614,845,760
2014 5,460,680,221 5,279,617,995 438,002,930 235,882,422 2,677,325,450 8,736,858,118
2015 5,459,157,122 5,865,975,640 291,948,950 239,788,752 2,742,504,182 9,114,366,282
Unincorporated County (Special Service District Fund) Digest:
2006 3,281,502,516 1,513,513,942 216,108,460 152,992,991 1,451,260,336 3,712,857,573
2007 3,734,376,567 1,709,310,895 237,971,560 161,439,494 1,682,145,961 4,160,952,555
2008 3,994,481,502 1,832,441,859 247,125,300 138,181,968 1,831,887,780 4,380,342,849
2009 3,866,273,381 2,027,630,456 256,600,920 139,832,893 1,825,788,413 4,464,549,237
2010 3,605,303,804 2,055,161,200 229,710,340 141,244,951 1,672,268,855 4,359,151,440
2011 3,286,176,928 2,219,147,677 233,001,840 134,925,951 1,600,685,426 4,272,566,970
2012 3,236,149,049 2,356,833,081 243,905,610 129,088,808 1,664,574,482 4,301,402,066
2013 3,291,794,866 2,562,620,700 259,351,490 134,960,172 1,837,556,874 4,411,170,354
2014 3,315,575,441 2,699,021,316 211,813,540 135,549,075 1,953,640,045 4,408,319,327
2015 3,296,192,430 2,890,458,657 152,878,800 129,411,540 2,008,305,510 4,460,635,917
Source: Information is from three separate digests provided by Chatham County Board of Assessors. The Consolidated Digest does not include Chatham Area Transit Authority and the Unincorporated Digest.
Real Property Personal Property
Chatham County, GeorgiaAssessed Value and Estimated Actual Value of Taxable Property
Last Ten Fiscal Years

G-14
Assessed Total Estimated Value as a Direct Actual Percentage of
Tax Rate Taxable Value Actual Value
10.837 22,700,311,235 40%
10.537 25,826,573,370 40%
10.537 27,851,148,363 40%
10.537 28,306,888,648 40%
10.537 27,452,266,288 40%
11.109 26,298,710,440 40%
11.109 26,398,666,320 40%
11.908 26,986,691,538 40%
11.543 27,409,641,863 40%
11.543 28,530,469,915 40%
0.820 18,650,105,410 40%
0.820 20,918,444,068 40%
0.820 22,264,630,323 40%
0.820 22,612,013,378 40%
0.820 21,908,402,270 40%
0.859 21,002,027,160 40%
0.859 21,099,900,028 40%
1.000 21,537,114,400 40%
1.000 21,842,145,295 40%
1.000 22,785,915,705 40%
3.475 9,282,143,933 40%
3.475 10,402,381,388 40%
3.475 10,950,857,123 40%
3.475 11,161,373,093 40%
3.475 10,897,878,600 40%
3.590 10,681,417,425 40%
3.590 10,753,505,165 40%
4.130 11,027,925,885 40%
4.130 11,020,798,318 40%
4.130 11,151,589,793 40%

G-15
0
2000
4000
6000
8000
10000
12000
14000
16000
2006 2007 2008 2009 2010 2011 2012 2013 2014 2015
Ass
esse
d V
alu
e in
Mil
lio
ns
Year
Chatham County, Georgia Total Taxable Assessed Value and Exemptions
(Consolidated Digest General Fund)Last Ten Fiscal Years
Exemptions Taxable Value


G-16
City of Savannah
County
Chatham TotalDebt Area Direct &
Fiscal General Service Transit Total Board of OverlappingYear Fund Fund Authority County Education City State Rates
2006 10.837 0.820 11.657 15.817 12.70 0.25 40.424
2007 10.537 0.820 11.357 13.795 12.50 0.25 37.902
2008 10.537 0.820 11.357 13.404 12.50 0.25 37.511
2009 10.537 0.820 11.357 13.404 12.50 0.25 37.511
2010 10.537 0.820 11.357 14.131 13.00 0.25 38.738
2011 11.109 0.859 11.968 14.631 12.50 0.25 39.349
2012 11.109 0.859 11.968 14.631 12.50 0.20 39.299
2013 11.908 1.000 12.908 15.881 12.48 0.15 41.419
2014 11.543 1.000 12.543 15.881 12.48 0.10 41.004
2015 11.543 1.000 12.543 16.631 12.48 0.05 41.704
Other incorporated areas are shown with year 2015 millage rates as follows:
General Muncipality M & O Transit School State Rate Total
City of Savannah 11.543 1.000 16.631 0.050 12.480 41.704Tybee Island 11.543 1.000 16.631 0.050 4.044 33.268City of Pooler 11.543 0.000 16.631 0.050 4.019 32.243Town of Thunderbolt 11.543 0.000 16.631 0.050 6.288 34.512City of Garden City 11.543 1.000 16.631 0.050 3.883 33.107City of Port Wentworth 11.543 1.000 16.631 0.050 4.571 33.795City of Bloomingdale 11.543 0.000 16.631 0.050 0.000 28.224City of Vernonburg 11.543 0.000 16.631 0.050 0.000 28.224
Source: Chatham County Board of Assessors
Chatham County, Georgia Property Tax Rates
Last Ten Fiscal Years

G-17
Chatham County, Unincorporated
County
Chatham TotalArea Direct &
General Special Transit Total Board of OverlappingFund Service Authority County Education State Rates
10.837 3.475 0.820 15.132 15.817 0.25 31.199
10.537 3.475 0.820 14.832 13.795 0.25 28.877
10.537 3.475 0.820 14.832 13.404 0.25 28.486
10.537 3.475 0.820 14.832 13.404 0.25 28.486
10.537 3.475 0.820 14.832 14.131 0.25 29.213
11.109 3.590 0.859 15.558 14.631 0.25 30.439
11.109 3.590 0.859 15.558 14.631 0.20 30.389
11.908 4.130 1.000 17.038 15.881 0.15 33.069
11.543 4.130 1.000 16.673 15.881 0.10 32.654
11.543 4.130 1.000 16.673 16.631 0.05 33.354

G-18
0
2
4
6
8
10
12
14
16
18
2006 2007 2008 2009 2010 2011 2012 2013 2014 2015
Mil
ls L
evie
d
Year
Chatham County, Georgia County Government Property Tax Rates
Last Ten Fiscal Years
CAT Special Revenue General

G-19
Percentage of Percentage ofTaxable Total Taxable Taxable Total Taxable
Assessed Assessed Assessed AssessedTaxpayer Value Rank Value Value Rank Value
Southern LNG 225,999,220$ 1 1.98% -$ 0.00%
International Paper 148,386,408 2 1.30% 192,055,321 2 2.12% Georgia Power/Savannah Electric 137,937,369 3 1.21% 120,806,261 3 1.33%
Gulfstream 127,653,580 4 1.12% 347,468,251 1 3.83% Weyerhauser 72,656,508 5 0.64% 51,067,971 7 0.56%
Imperial Savannah/Savannah Foods 65,849,295 6 0.58% 43,230,367 9 0.48%
HH Savannah LLC 56,455,736 7 0.49% - - Walmart 61,680,157 8 0.54% 54,073,223 6 0.60% Colonial Oil 48,910,385 9 0.43% - -
Komastu 47,375,009 10 0.42% -
Kerr-McGee (Kemira) - - 74,193,648 5 0.82%
Southern Bell - - 42,909,157 10 0.47%
Southern Energy - - 74,838,340 4 0.82%
Home Depot - - 49,234,781 8 0.54%
Sub-Total 992,903,667$ 8.70% 1,049,877,320$ 11.56%
All Others 10,419,284,299 91.30% 8,030,247,174 88.44%
Total 11,412,187,966$ * 100.00% 9,080,124,494$ * 100.00%
Source: Chatham County Board of Assessors(*) Valuations do not include mobile homes and motor vehicles.
2015 2006
Chatham County, GeorgiaPrincipal Property Taxpayers
Current Year and Nine Years Ago

G-20
Year Total Tax Collections in Ended Levy Amount Percentage of Levy Subsequent Years Amount Percentage of Levy
2006 100,840,116$ 28,658,157$ 28.42% 72,181,959$ 100,840,116$ 100.00%
2007 112,522,372 32,673,326 29.04% 79,849,046 112,522,372 100.00%
2008 121,333,526 35,548,608 29.30% 85,760,158 121,308,766 99.98%
2009 127,368,781 40,659,138 31.92% 86,678,359 127,337,497 99.98%
2010 124,202,634 41,045,731 33.05% 83,113,634 124,159,365 99.97%
2011 125,170,688 40,237,699 32.15% 84,862,622 125,100,321 99.94%
2012 123,666,155 40,597,893 32.83% 82,952,928 123,550,821 99.91%
2013 138,082,756 40,640,310 29.43% 97,329,269 137,969,579 99.92%
2014 119,876,214 45,358,027 37.84% 73,802,152 119,160,179 99.40%
2015 50,159,660 * 41,432,878 82.60% - 41,432,878 82.60%
* Tax Levy for 2015 is for First Installment Billing Only. Source: Chatham County Tax Commissioner(Includes Real and Personal Property Only)
Chatham County, GeorgiaProperty Tax Levies and Collections
Last Ten Fiscal Years
Fiscal Year of the Levy Total Collections to DateCollected within the
Consolidated Digest

G-21
2007 2008 2009 2010 2011 2012 2013 2014 2015Residential 65.93% 65.77% 65.10% 65.09% 65.07% 64.05% 64.48% 63.86% 60.09%Transitional 0.01% 0.01% 0.01% 0.01% 0.01% 0.01% 0.01% 0.01% 0.01%Historical 0.02% 0.01% 0.01% 0.01% 0.01% 0.01% 0.01% 0.01% 0.01%Agricultural 3.22% 3.12% 2.64% 2.50% 2.46% 2.40% 2.38% 2.57% 2.95%Conservation Use 6.93% 7.24% 7.21% 7.79% 7.98% 8.36% 8.60% 8.79% 9.07%FLPA 0.00% 0.00% 0.00% 0.22% 0.22% 0.75% 0.75% 0.77% 1.62%Commercial 17.25% 17.24% 17.81% 17.04% 16.88% 17.22% 16.38% 16.85% 18.02%Industrial 6.32% 6.27% 6.90% 6.77% 6.38% 6.14% 6.32% 6.08% 7.14%Public Utility 0.33% 0.34% 0.32% 0.58% 1.00% 1.06% 1.06% 1.09% 1.11%
100.00% 100.00% 100.00% 100.00% 100.00% 100.00% 100.00% 100.00% 100.00%
Source: Chatham County Board of Assessor's Office.
Chatham County, GeorgiaCategory of Land Use
Current Year and Eight Years Ago

G-22
Total Percentage DebtFiscal Contractual Capital Contractual Capital Primary of Personal PerYear Obligations Leases Obligations Leases Government Income Capita
2006 39,780,761$ 2,179,520$ 6,258,179$ 75,021$ 48,293,481$ 0.073% 190
2007 36,532,009 2,876,831 5,494,937 34,773 44,938,550 0.079% 177
2008 33,148,959 2,518,310 4,692,415 156,382 40,516,066 0.089% 160
2009 29,621,343 1,069,852 - 110,888 30,802,083 0.124% 121
2010 28,333,873 693,169 - 63,111 29,090,153 0.131% 115
2011 24,391,247 367,797 - 12,829 24,771,873 0.154% 98
2012 25,727,466 57,898 - - 25,785,364 0.146% 95
2013 24,203,175 4,561 - - 24,207,736 0.172% 88
2014 22,621,856 - - - 22,621,856 0.191% 80
2015 21,435,412 4,301,351 - - 25,736,763 0.177% 91
Source: Chatham County Finance DepartmentChatham Area Transit
Business-Type Activities
Chatham County, GeorgiaRatios of Outstanding Debt by Type
Last Ten Fiscal Years
Governmental Activities

G-23
Percentage of General Less: Amounts Estimated Actual
Fiscal Obligation Available in Debt Taxable Value of PerYears Bonds Service Fund Total Property Capita
2006 -$ -$ -$ - -$
2007 - - - - -
2008 - - - - -
2009 - - - - -
2010 - - - - -
2011 - - - - -
2012 - - - - -
2013 - - - - -
2014 - - - - -
2015 - - - - -
Source: Chatham County Finance Department
Chatham County, GeorgiaRatios of General Bonded Debt Outstanding
Last Ten Fiscal Years

G-24
EstimatedEstimated Share of
Percentage Overlapping Governmental Unit Debt Outstanding Applicable Debt
Chatham County Georgia: General Obligation Bonded Debt -$ 100.00% -$
Capital Leases 4,301,351 100.00% 4,301,351
Contractual Obligations: Downtown Savannah Authority (Chatham County Projects) Series 2005A 3,357,988 100.00% 3,357,988 Downtown Savannah Authority (Union Mission) Series 2009 1,970,000 100.00% 1,970,000 Downtown Savannah Authority (Union Mission) Series 2011 2,680,000 100.00% 2,680,000 Downtown Savannah Authority (Chatham County Projects) Series 2014 9,840,000 100.00% 9,840,000 Mosquito Control Facility 3,587,423 100.00% 3,587,423
Direct Debt 25,736,762 25,736,762
City of Savannah, Georgia: General Obligation Bonded Debt - 100.00% -
Capital Leases - 100.00% - Contractual Obligations: Resource Recovery Development Authority 14,500,000 100.00% 14,500,000 Downtown Savannah Authority (Parking Improvements) 25,055,000 100.00% 25,055,000 Downtown Savannah Authority (Stormwater Project) 25,365,000 100.00% 25,365,000 Downtown Savannah Authority (Capital Improvement Projects) 5,755,000 100.00% 5,755,000
Chatham-Savannah School Board: General Obligation Bonded Debt 40,240,000 100.00% 40,240,000
Capital Leases 8,574,798 100.00% 8,574,798
Contractual Obligations Downtown Savannah Authority (Energy Management) 4,467,430 100.00% 4,467,430
Overlapping Debt 123,957,228 123,957,228
Total 149,693,990$ 149,693,990$
Source: Chatham County, City of Savannah and Chatham-Savannah School Board
Chatham County, GeorgiaDirect and Overlapping Governmental Activities Debt
As of June 30, 2015

G-25
Fiscal Year2006 2007 2008 2009 2010
Debt limit 1,113,679,071$ 1,275,695,215$ 1,376,702,033$ 1,368,711,462$ 1,304,040,029$
Total net debt applicable to limit - - - - -
Legal debt margin 1,113,679,071$ 1,275,695,215$ 1,376,702,033$ 1,368,711,462$ 1,304,040,029$
Total net debt applicable to the limit as a percentage of debt limit n/a n/a n/a n/a n/a
Fiscal Year2011 2012 2013 2014 2015
Debt limit 1,221,843,313$ 1,217,982,514$ 1,242,748,173$ 1,257,933,388$ 1,295,650,427$
Total net debt applicable to limit - - - - -
Legal debt margin 1,221,843,313$ 1,217,982,514$ 1,242,748,173$ 1,257,933,388$ 1,295,650,427$
Total net debt applicable to the limit as a percentage of debt limit n/a n/a n/a n/a n/a
Legal Debt Margin Calculation for Fiscal Year 2015
Assessed value 14,575,552,617$
Less: Exemptions for Bond Purposes (1,619,048,350)
Total assessed value 12,956,504,267
Debt Limit ( 10% of net assessed value) 1,295,650,427
General Obligation Bonds -
Amount set aside for repayment of general obligation debt -Total Net Debt Applicable to Limit -
Legal Debt Margin 1,295,650,427$
The Constitutional debt limitation applies to all general obligation bonds authorized. Additional general obligationbonds may be authorized to be issued if so approved bya majority of those voting in an election held for that purpose.Chatham County has no general obligation bonds authorizedbut unissued.
Chatham County, GeorgiaLegal Debt Margin Information
Last Ten Fiscal Years

G-26
Total Per CapitaFiscal Personal Personal Median SchoolYear Population Income Income Age Enrollment
2006 250,539 8,637,582,564 34,476 34.8 41,225
2007 253,044 9,122,742,288 36,052 34.8 41,273
2008 251,120 9,504,892,000 37,850 34.8 40,244
2009 253,631 9,695,805,868 38,228 34.9 41,152
2010 256,992 9,701,448,000 37,752 34.0 42,061
2011 265,128 10,009,112,256 37,752 34.0 41,588
2012 271,544 10,251,329,088 37,752 34.0 43,253
2013 276,434 11,523,704,158 41,687 34.0 42,454
2014 281,218 12,181,238,888 43,316 34.0 43,505
2015 283,379 12,937,101,487 45,653 34.0 44,442
Sources: Savannah Area Chamber of CommerceGeorgia Department of LaborUS Department of LaborBureau of Labor Statistics
Chatham County, GeorgiaDemographic and Economic Statistics
Last Ten Fiscal Years

G-27
State USChatham County Chatham County Unemployment Unemployment Unemployment
Employment Unemployment Rate Rate Rate
124,858 5,202 4.6 4.7 4.4
127,871 5,310 4.2 4.6 4.6
125,919 7,556 6.2 6.2 5.8
119,555 11,052 8.7 9.7 9.3
117,559 11,776 9.0 10.2 9.6
120,617 12,231 9.1 9.8 8.9
121,927 12,612 9.4 9.6 8.4
124,381 12,002 8.8 8.6 7.6
127,413 11,211 8.1 8.3 6.3
131,342 8,272 6.3 6.1 5.3

G-28
Percentage PercentageNumber of of Total County Number of of Total County
Employer Employees Rank Employment Employees Rank Employment
Civilian:
Gulfstream Aerospace Corporation 10,126 1 7.85% 5,000 2 4.05%
Memorial Health University Health Center 5,000 2 3.88% 5,351 1 4.34%
St. Joseph's/Candler 3,304 3 2.56% 3,300 3 2.68%
South Coast Medical Group 601 4 0.47%
International Paper 600 5 0.47%
JCB Americas, Inc. 600 6 0.47%
Goodwill Industries of the Coastal Empire 560 7 0.43%
Georgia Power Company - Coastal Region 473 8 0.37%
Imperial Sugar 450 9 0.35%
Brasseler USA, Inc. 420 10 0.33%
Wal-Mart 2,182 4 1.77%
Georgia-Pacific Corporation 1,420 6 1.15%
Kroger 1,200 7 0.97%
International Paper 970 9 0.79%
The Home Depot 776 10 0.63%
Momentum Resources II, Inc. 1,438 5 1.17%
Eastern Personnel Services 1,000 8 0.81%
Total 22,134 17.16% 22,637 18.36%
Government, Military & Education:
Savannah-Chatham Board of Education 4,808
Ft. Stewart/Hunter Army Airfield 4,637
City of Savannah 2,795
Savannah College of Art and Design 1,590 Chatham County 1,573
Georgia Port Authority 988
Armstrong Atlantic State University 602
US Army Corp of Engineers 600
Savannah State University 586
Source: Savannah Economic Development Authority Savannah Area Chamber of Commerce Georgia Department of Labor
Chatham County, GeorgiaPrincipal Employers
Current Year and Nine Years Ago
2015 2006

G-29
Year Institutions2006 18 4,418 2007 20 4,596 2008 20 4,653 2009 22 4,882 2010 21 4,683 2011 21 4,471 2012 21 4,839 2013 21 4,644 2014 22 4,966 2015 21 5,802
Source: Federal Deposit Insurance Corporation, Summary of Deposits.
Chatham County, GeorgiaSummary of Banking Deposits
Last Ten Fiscal Years
(in millions)Total Deposits as of June 30
Banking Deposits
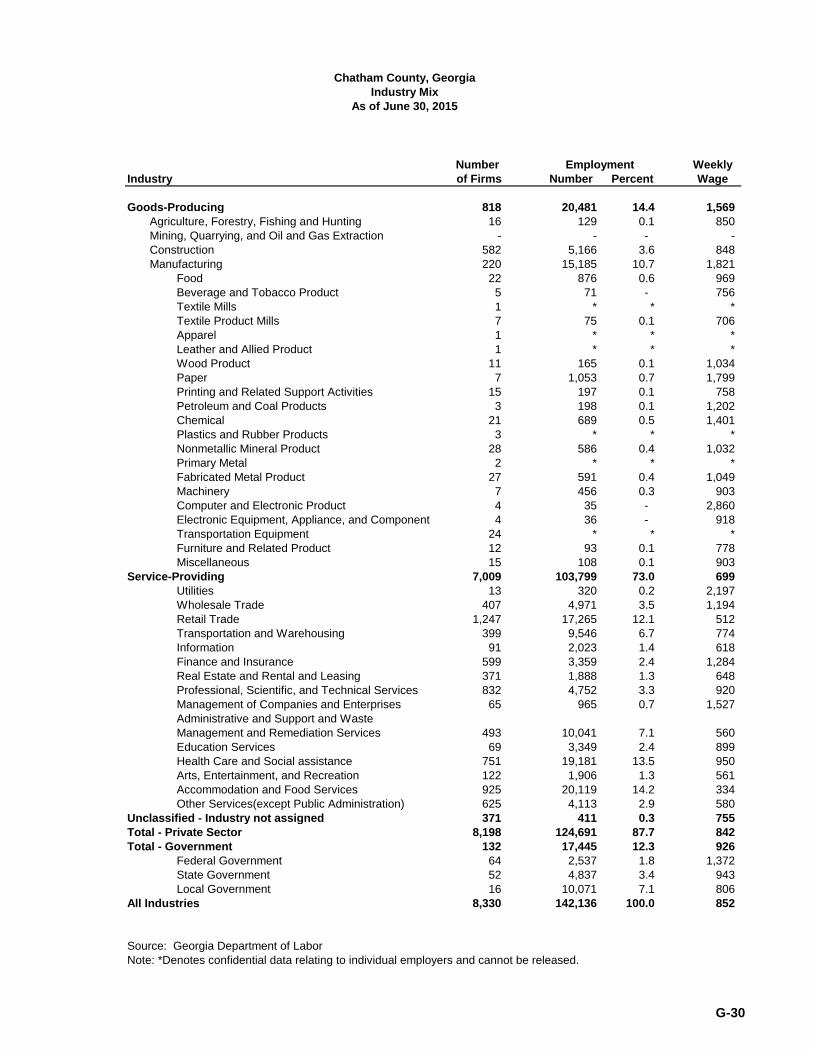
G-30
Number Weeklyof Firms Number Percent Wage
Goods-Producing 818 20,481 14.4 1,569 Agriculture, Forestry, Fishing and Hunting 16 129 0.1 850 Mining, Quarrying, and Oil and Gas Extraction - - - - Construction 582 5,166 3.6 848 Manufacturing 220 15,185 10.7 1,821
Food 22 876 0.6 969 Beverage and Tobacco Product 5 71 - 756 Textile Mills 1 * * *Textile Product Mills 7 75 0.1 706 Apparel 1 * * *Leather and Allied Product 1 * * *Wood Product 11 165 0.1 1,034 Paper 7 1,053 0.7 1,799 Printing and Related Support Activities 15 197 0.1 758 Petroleum and Coal Products 3 198 0.1 1,202 Chemical 21 689 0.5 1,401 Plastics and Rubber Products 3 * * *Nonmetallic Mineral Product 28 586 0.4 1,032 Primary Metal 2 * * *Fabricated Metal Product 27 591 0.4 1,049 Machinery 7 456 0.3 903 Computer and Electronic Product 4 35 - 2,860 Electronic Equipment, Appliance, and Component 4 36 - 918 Transportation Equipment 24 * * *Furniture and Related Product 12 93 0.1 778 Miscellaneous 15 108 0.1 903
Service-Providing 7,009 103,799 73.0 699 Utilities 13 320 0.2 2,197 Wholesale Trade 407 4,971 3.5 1,194 Retail Trade 1,247 17,265 12.1 512 Transportation and Warehousing 399 9,546 6.7 774 Information 91 2,023 1.4 618 Finance and Insurance 599 3,359 2.4 1,284 Real Estate and Rental and Leasing 371 1,888 1.3 648 Professional, Scientific, and Technical Services 832 4,752 3.3 920 Management of Companies and Enterprises 65 965 0.7 1,527 Administrative and Support and WasteManagement and Remediation Services 493 10,041 7.1 560 Education Services 69 3,349 2.4 899 Health Care and Social assistance 751 19,181 13.5 950 Arts, Entertainment, and Recreation 122 1,906 1.3 561 Accommodation and Food Services 925 20,119 14.2 334 Other Services(except Public Administration) 625 4,113 2.9 580
Unclassified - Industry not assigned 371 411 0.3 755 Total - Private Sector 8,198 124,691 87.7 842 Total - Government 132 17,445 12.3 926
Federal Government 64 2,537 1.8 1,372 State Government 52 4,837 3.4 943 Local Government 16 10,071 7.1 806
All Industries 8,330 142,136 100.0 852
Source: Georgia Department of LaborNote: *Denotes confidential data relating to individual employers and cannot be released.
IndustryEmployment
As of June 30, 2015
Chatham County, GeorgiaIndustry Mix
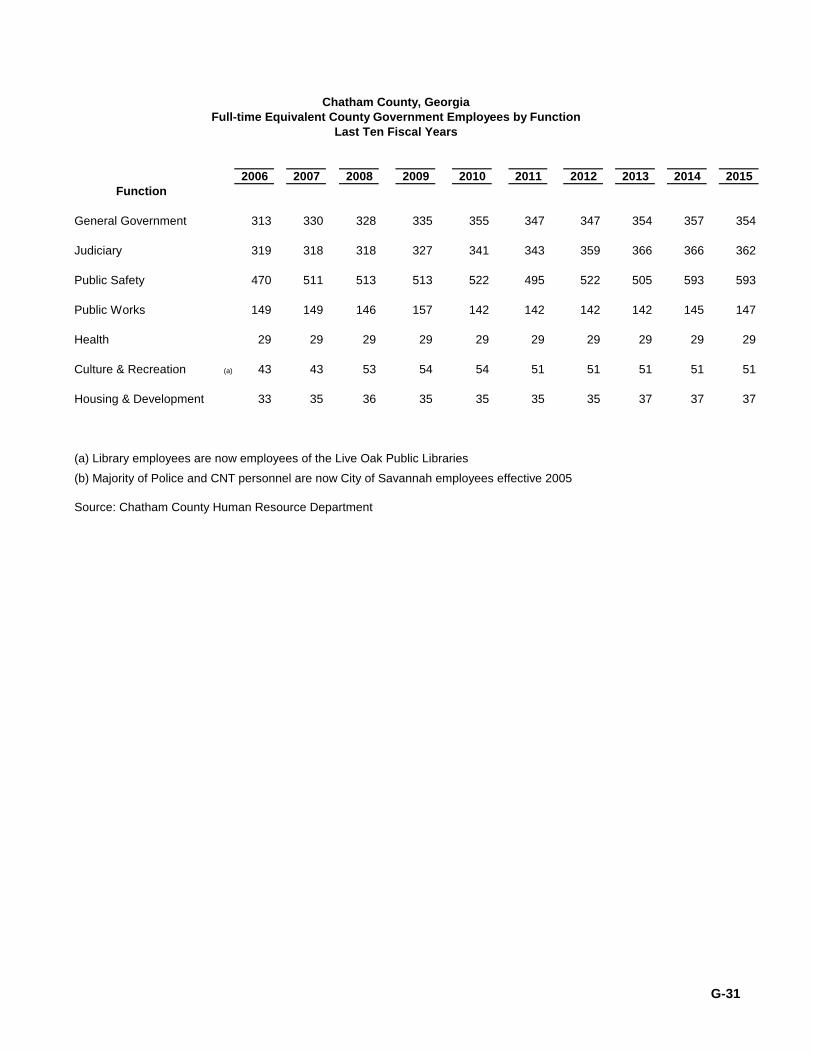
G-31
2006 2007 2008 2009 2010 2011 2012 2013 2014 2015Function
General Government 313 330 328 335 355 347 347 354 357 354
Judiciary 319 318 318 327 341 343 359 366 366 362
Public Safety 470 511 513 513 522 495 522 505 593 593
Public Works 149 149 146 157 142 142 142 142 145 147
Health 29 29 29 29 29 29 29 29 29 29
Culture & Recreation (a) 43 43 53 54 54 51 51 51 51 51
Housing & Development 33 35 36 35 35 35 35 37 37 37
(a) Library employees are now employees of the Live Oak Public Libraries
(b) Majority of Police and CNT personnel are now City of Savannah employees effective 2005
Source: Chatham County Human Resource Department
Chatham County, GeorgiaFull-time Equivalent County Government Employees by Function
Last Ten Fiscal Years

G-32
Year Commercial Residential 2007 49 4492008 92 2292009 34 1272010 49 1222011 44 1702012 33 1732013 13 2022014 48 1702015 9 177
Source: Chatham County Building Safety and Regulatory Services Department.
Chatham County, GeorgiaNew Construction Residential Building Permits
Last Nine Fiscal Years
New Construction (Unincorporated Area)

G-33
2006 2007 2008 2009 2010 2011 2012 2013 2014 2015
General Government
Real Property Reviews 32,000 32,000 42,000 42,000 42,000 42,000 42,000 42,000 42,000 42,000Tax Bills Generated 200,000 205,000 206,000 201,000 201,700 241,000 210,000 218,000 245,000 246,000
JudiciaryMarriage Licenses 2,350 2,965 2,917 3,091 3,037 3,374 3,349 3,181 3,310 3,480Pistol Permits 1,950 1,365 1,918 3,287 2,269 2,269 2,475 3,886 3,382 3,858
Public Safety-Sheriff
Meals Served 1,895,555 1,950,000 2,999,952 2,435,423 1,916,517 2,347,857 2,465,250 2,102,654 1,989,729 1,642,278Inmates Booked 19,723 20,200 22,005 22,553 19,348 19,964 20,780 18,706 17,940 16,368Avg Daily Jail Population 1,532 1,625 2,160 1,823 1,791 1,933 2,029 1,706 1,470 1,493
Public Works
Bridge Openings 5,134 6,156 5,500 5,780 6,143 7,129 5,060 5,458 2,574 2,319Yard Waste Recycled (in tons) 15,600 29,015 32,631 31,635 36,869 32,282 17,499 22,075 27,485 19,195Other Recyclables (in tons) 1,671 1,128 994 1,249 1,026 1,058 705 963 628 1,243Water & Sewer New Connections 82 54 43 17 21 17 11 29 31 21Average Water Daily Consumption 1,104,000 1,240,064 959,000 1,038,813 959,748 1,112,276 1,147,598 1,086,530 729,868 665,514
Culture and Recreation
Aquatic Center Admissions 85,246 78,396 37,895 103,749 112,148 108,913 107,803 123,043 131,073 128,723
Sources: Chatham County Board of Assessors; Chatham County Probate Court; Chatham County Detention Center; Chatham County Public Works; and Chatham County Aquatic Center.
Function
Chatham County, GeorgiaOperating Indicators by Function
Last Ten Fiscal Years

G-34
Function 2006 2007 2008 2009 2010 2011 2012 2013 2014 2015
Judicial Courthouse 2 2 2 2 2 2 2 2 3 3
Public Safety: Sheriff Stations 1 1 1 1 1 1 1 1 1 1 Jail 1 1 1 1 1 1 1 1 1 1 Patrol Units 245 245 175 175 175 175 175 175 175 175 CNT Headquarters 1 1 1 1 1 1 1 1 1 1
Public Works: Solid Waste Collection Trucks 14 16 16 16 16 16 16 16 16 16 Highways & Streets Street Lights 5720 5720 5720 5720 5795 5795 5795 5795 6100 6100 Traffic Signals 42 42 42 42 48 48 48 48 141 141 Miles of Streets/Roads 310 318 318 365 398 398 1300 1300 2300 2300
Culture & Recreation Parks Acreage 1900 1900 1900 1900 1900 1900 1900 1900 1900 1900 Parks 22 22 22 22 22 22 22 22 29 29 Swimming Pools 2 2 2 2 2 2 2 2 3 3 Tennis Courts 19 22 22 24 24 24 24 24 24 24 Community Centers 1 1 1 2 2 2 2 2 4 4 Sports Complex 5 9 9 9 9 9 9 9 9 9
Sources: Various county departmentsNote: No capital asset indicators are available for the general government function.
Chatham County, GeorgiaCapital Asset Statistics by Function
Last Ten Fiscal Years

CHATHAM COUNTY, GEORGIA CHILD SUPPORT ENFORCEMENT PROGRAM INFORMATION
JUNE 30, 2015
H-1
SUMMARY STATEMENT:
The Child Support Enforcement Office for the Eastern Judicial Circuit of Georgia is responsible for the enforcement of criminal and civil child support laws. This includes locating absent parents, determiningpaternity, and establishing and enforcing child support orders. The office has 13,578 child support cases.Cases are serviced repeatedly throughout the year.
SCHEDULE OF VEHICLES
Make Model Year VINFord F150 4x4 1997 1FTDF18W1VLA19466Ford Crown Victoria 2005 2FAFP71W85X112366Ford Explorer 2006 1FMEU62E06ZA24000Ford Crown Victoria 2009 1FMCU493X9KB3664Ford Fusion 2010 3FAHP0GA9AR424460Ford Fusion 2010 3FAHP0GA0AR424461

CHATHAM COUNTY, GEORGIA CHILD SUPPORT ENFORCEMENT PROGRAM INFORMATION
SCHEDULE OF SALARIES AND TRAVEL JUNE 30, 2015
H-2
NAME SALARIES TRAVEL NAME SALARIES TRAVEL
BUCK $ 36,279 $ MILES 50,306 $COOK 5,957 MITCHELL $ 17,115COREY 47,268 MOORE 7,969DANIEL 9,907 NEWTON 29,419DRESCHER 100,998 279 NORTH 47,289EDENFIELD 69,234 PAGE 24,325ERWIN 39,141 PITTMAN 23,672ETHERIDGE 35,210 92 POWERS 35,006FAIRLEY 8,863 PROUGH 8,785FIELDS 28,988 RAWLS 21,433FITZGERALD 49,801 449 ROBERTS 30,894GIBBS 41,685 ROVOLIS 59,405HARRISON 35,188 SCHARNIKOV 18,053HOWELL 2,567 SCOTT 11,244HUTSON 45,642 SHIELDS 30,506JARRELL 43,803 20 SIMMONS 40,024JOHNSON III 45,151 STEPTOE 57,506KELLY 5,340 SYLVESTER 30,396KNIGHT 22,649 THORTON 14,169KRAPF 30,737 VANVLECK 60,621 591LOWE 76,151 VARNEDOE 17,349MALICK 2,840 WHITTAKER 30,751MANER 1,082 WRIGHT, R 31,507MANKER 37,806MCINTOSH 2,720MCMILLAN 40,007MCNAMAR 31,588
$ 1,594,339 $ 1,431

CHATHAM COUNTY, GEORGIA SCHEDULE OF CONTRACT REVENUES AND EXPENDITURES
FOR THE YEAR ENDED JUNE 30, 2015
H-3
Cash Basis Due from Total Total Contract Contract Award Revenue State of Georgia Revenues Expenditures
DRUG COURT441-93-1435AAJ $ 194,750 $ 178,530 $ 16,220 $ 194,750 $ 194,750
CSRU42700-401-0000020346 $ 2,963,262 $ 2,033,172 $ 591,467 $ 2,624,639 $ 2,785,173
Note: The total revenues and expenditures for the CSRU include the local portion in the amount of $160,534.

CHATHAM COUNTY, GEORGIA SCHEDULE OF PROJECTS CONSTRUCTED
WITH SPECIAL SALES TAX PROCEEDS FOR THE YEAR ENDED JUNE 30, 2015
H-4
ORIGINAL EXPENDITURES
ESTIMATED ESTIMATED PRIOR CURRENTPROJECT COST COST YEARS YEAR TOTAL
Sales Tax I (1985-1993):Administrative Annex Entry Road $ - $ 407,744 $ 407,744 $ - $ 407,744 Airport Road and Bridge - 385,193 385,193 - 385,193 Area Beautification - 517,435 517,435 - 517,435 Bay Street Viaduct 300,000 886,674 886,674 - 886,674 Bourne Avenue 437,000 4,332,608 4,332,608 - 4,332,608 Brampton Road 958,000 51,055 51,055 - 51,055 Bryan Woods Road 500,000 53,684 53,684 - 53,684 Chatham Parkway: Garrard to US 17 4,899,000 3,659,714 3,659,714 - 3,659,714 Chatham Parkway: US 17 to US 80 3,400,000 3,445,334 3,445,334 - 3,445,334 Crossroads Parkway - 2,652,823 2,652,823 - 2,652,823 Staley Avenue Overpass 1,500,000 3,546,381 3,546,381 - 3,546,381 Deptford Cul-de-Sac - 122,315 122,315 - 122,315 Distribution to Municipalities I 1,050,000 1,050,000 1,050,000 - 1,050,000 Distribution to Municipalities II 10,676,000 10,676,000 10,676,000 - 10,676,000 Eli Whitney Blvd - 1,186 1,186 - 1,186 Gateway Savannah Beautification - 125,000 125,000 - 125,000 Gulfstream Road at SR21 - 131,349 131,349 - 131,349 Henderson Blvd - 916,292 916,292 - 916,292 Henderson Blvd II - 285,275 285,275 - 285,275 Interchange: I95 at Airport - 2,551 2,551 - 2,551 Interchange: Southwest Bypass- Abercorn 900,000 7,362 7,362 - 7,362 Interchange: Talmadge-Hutchinson Isl 2,800,000 16,277,433 16,277,433 - 16,277,433 Interchange: US 80- Islands Exp 3,000,000 11,373,236 11,373,236 - 11,373,236 Interchange: US 80-Johnny Mercer 3,400,000 151,991 151,991 - 151,991 Jimmy Deloach Pkwy 12,200,000 17,706,114 17,706,114 - 17,706,114 Jimmy Deloach/I-95 - 160,074 160,074 - 160,074 Johnny Mercer: Bryan Woods- US 80 1,533,000 1,599,066 1,599,066 - 1,599,066 Johnny Mercer: Bryan Woods to Sapelo - 480,614 480,614 - 480,614 Mall Blvd Widening - 244,098 244,098 - 244,098 Montgomery Crossroads 7,803,000 8,159,670 8,159,670 - 8,159,670 Pooler Bypass- US80 to I-95 2,000,000 5,237,787 5,237,787 - 5,237,787 President Street: Randolph St - US 80 2,250,000 1,236,334 1,236,334 - 1,236,334 Richardson Creek Bridge 40,000 5,100 5,100 - 5,100 Riverview Drive - 38,284 38,284 - 38,284 Robert McCorkle Bike Trail - 327,435 327,435 - 327,435 Skidaway Widening: Victory - Five Points - 1,872,241 1,872,240 1,872,240 Southwest Bypass 15,750,000 29,085,964 29,085,964 - 29,085,964 Stagecoach Road - 2,000 2,000 - 2,000 State Route 21: I-95 - County Line 40,000 41,911 41,911 - 41,911 State Route 307: US 17 to I-16 - 217,623 217,623 - 217,623 Stephenson: Abercorn - Waters 770,000 6,129,578 6,129,578 - 6,129,578 Tax Map Conversion - 383,538 383,538 - 383,538 Triplett Park Entrance Road - 254,263 254,263 - 254,263 Truman Parkway I 4,642,000 17,191,783 17,191,783 - 17,191,783 Truman Parkway II 2,794,000 10,383,000 10,383,000 - 10,383,000 Truman Parkway III 8,652,000 13,955,293 13,955,293 13,955,293 Truman Parkway IV 2,500,000 10,429,948 10,429,948 - 10,429,948 Truman Parkway V 10,500,000 23,396,580 23,393,012 3,568 23,396,580 TSM Abercorn: DeRenne - Victory - 200,000 200,000 - 200,000 TSM Abercorn: Ferguson-Victory 4,320,000 6,000,000 2,206,565 142,504 2,349,069 TSM Waters: Stephenson - Wheaton - 3,308,886 3,308,886 - 3,308,886 US 17N: Brampton Rd -Old Traffic Circle 680,000 736,216 736,216 - 736,216 US 17S: Dean Forest - I-516 3,815,000 5,686,022 5,686,022 - 5,686,022 US 17: Abercorn - Dean Forest 2,000,000 1,295,168 1,295,168 - 1,295,168 US 17: Burkhalter Rd Intersection - 19,100 19,100 - 19,100
(Continued)

CHATHAM COUNTY, GEORGIA SCHEDULE OF PROJECTS CONSTRUCTED
WITH SPECIAL SALES TAX PROCEEDS FOR THE YEAR ENDED JUNE 30, 2015
H-5
ORIGINAL EXPENDITURES
ESTIMATED ESTIMATED PRIOR CURRENTPROJECT COST COST YEARS YEAR TOTAL
US 17: Enhancement Fla Line to SC line $ - $ 7,995 $ 7,995 $ - $ 7,995 US 17: GPA Entrance 50,000 30 30 - 30 US 17: Ogeechee Road - Abercorn 1,400,000 1,828,801 1,828,801 - 1,828,801 US 17-SR 204 Intersection - 205,554 205,554 - 205,554 US 80: Bloomingdale- County Line 1,323,000 154,287 154,287 - 154,287 US 80: Chatham Parkway to I-95 4,712,000 2,689,555 2,689,555 - 2,689,555 US 80: Garden City - 268,157 268,157 - 268,157 US 80: I-516 to Victory 4,800,000 3,800,000 669,692 - 669,692 US 80: Johnny Mercer- Bryan Woods 105,000 57,871 57,871 - 57,871 US 80: Pooler 250,000 1,422,666 1,422,666 - 1,422,666 US 80: Pooler- Bloomingdale 2,005,000 1,029,946 1,029,946 - 1,029,946 US 80: Whitemarsh Island - 20,000 20,000 - 20,000 Various County Roads 8,254,519 22,900,000 17,953,482 1,993,668 19,947,150 Waters Avenue: Montgomery-Stephenson 1,050,000 2,887,972 2,887,972 - 2,887,972 Wheaton Street: Bee - Liberty 4,330,000 4,419,851 4,419,853 - 4,419,853 White Bluff: Derenne - Abercorn 1,100,000 1,150,752 1,150,752 - 1,150,752 White Bluff: Montgomery Cross Road/Windsor 4,503,000 5,501,660 5,501,660 - 5,501,660 Whitemarsh Island Road - 479,292 479,292 - 479,292 Whitefield Avenue - 3,487,964 3,487,964 - 3,487,964 Right of Way Consultants - 6,997,826 6,997,826 - 6,997,826 Administrative Expenditures - 3,737,623 3,746,685 489 3,747,174 Administrative Expenses - Direct Costs - 1,044,268 49,846 10,202 60,048 Transfer to General Fund - Admin - 4,225,000 3,545,681 80,778 3,626,459 Transfer to Service District Fund - Admin - 2,623,628 2,623,628 - 2,623,628 Transfer to CDBG Fund - 33,388 33,388 - 33,388 Contingency 29,321,481 57,747 - - -
TOTAL $ 179,313,000 $ 297,874,158 $ 284,277,904 $ 2,231,209 $ 286,509,113
(Concluded)
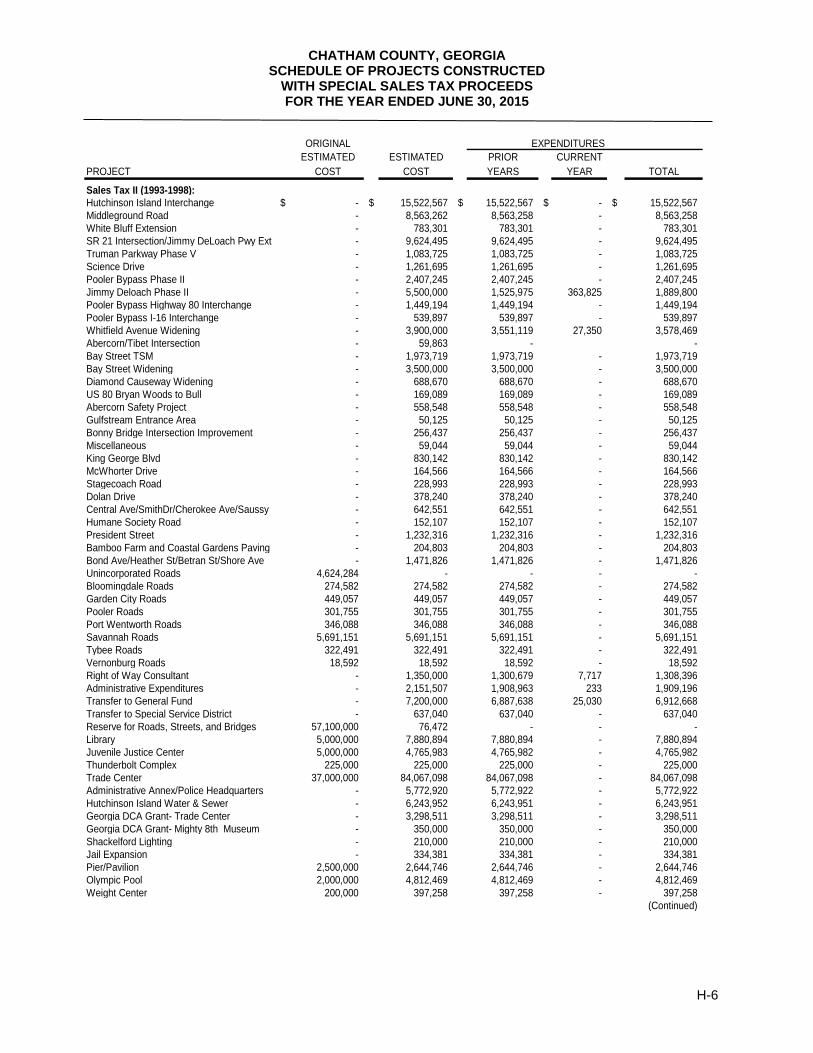
CHATHAM COUNTY, GEORGIA SCHEDULE OF PROJECTS CONSTRUCTED
WITH SPECIAL SALES TAX PROCEEDS FOR THE YEAR ENDED JUNE 30, 2015
H-6
ORIGINAL EXPENDITURESESTIMATED ESTIMATED PRIOR CURRENT
PROJECT COST COST YEARS YEAR TOTAL
Sales Tax II (1993-1998):Hutchinson Island Interchange $ - $ 15,522,567 $ 15,522,567 $ - $ 15,522,567 Middleground Road - 8,563,262 8,563,258 - 8,563,258 White Bluff Extension - 783,301 783,301 - 783,301 SR 21 Intersection/Jimmy DeLoach Pwy Ext - 9,624,495 9,624,495 - 9,624,495 Truman Parkway Phase V - 1,083,725 1,083,725 - 1,083,725 Science Drive - 1,261,695 1,261,695 - 1,261,695 Pooler Bypass Phase II - 2,407,245 2,407,245 - 2,407,245 Jimmy Deloach Phase II - 5,500,000 1,525,975 363,825 1,889,800 Pooler Bypass Highway 80 Interchange - 1,449,194 1,449,194 - 1,449,194 Pooler Bypass I-16 Interchange - 539,897 539,897 - 539,897 Whitfield Avenue Widening - 3,900,000 3,551,119 27,350 3,578,469 Abercorn/Tibet Intersection - 59,863 - - Bay Street TSM - 1,973,719 1,973,719 - 1,973,719 Bay Street Widening - 3,500,000 3,500,000 - 3,500,000 Diamond Causeway Widening - 688,670 688,670 - 688,670 US 80 Bryan Woods to Bull - 169,089 169,089 - 169,089 Abercorn Safety Project - 558,548 558,548 - 558,548 Gulfstream Entrance Area - 50,125 50,125 - 50,125 Bonny Bridge Intersection Improvement - 256,437 256,437 - 256,437 Miscellaneous - 59,044 59,044 - 59,044 King George Blvd - 830,142 830,142 - 830,142 McWhorter Drive - 164,566 164,566 - 164,566 Stagecoach Road - 228,993 228,993 - 228,993 Dolan Drive - 378,240 378,240 - 378,240 Central Ave/SmithDr/Cherokee Ave/Saussy - 642,551 642,551 - 642,551 Humane Society Road - 152,107 152,107 - 152,107 President Street - 1,232,316 1,232,316 - 1,232,316 Bamboo Farm and Coastal Gardens Paving - 204,803 204,803 - 204,803 Bond Ave/Heather St/Betran St/Shore Ave - 1,471,826 1,471,826 - 1,471,826 Unincorporated Roads 4,624,284 - - - - Bloomingdale Roads 274,582 274,582 274,582 - 274,582 Garden City Roads 449,057 449,057 449,057 - 449,057 Pooler Roads 301,755 301,755 301,755 - 301,755 Port Wentworth Roads 346,088 346,088 346,088 - 346,088 Savannah Roads 5,691,151 5,691,151 5,691,151 - 5,691,151 Tybee Roads 322,491 322,491 322,491 - 322,491 Vernonburg Roads 18,592 18,592 18,592 - 18,592 Right of Way Consultant - 1,350,000 1,300,679 7,717 1,308,396 Administrative Expenditures - 2,151,507 1,908,963 233 1,909,196 Transfer to General Fund - 7,200,000 6,887,638 25,030 6,912,668 Transfer to Special Service District - 637,040 637,040 - 637,040 Reserve for Roads, Streets, and Bridges 57,100,000 76,472 - - - Library 5,000,000 7,880,894 7,880,894 - 7,880,894 Juvenile Justice Center 5,000,000 4,765,983 4,765,982 - 4,765,982 Thunderbolt Complex 225,000 225,000 225,000 - 225,000 Trade Center 37,000,000 84,067,098 84,067,098 - 84,067,098 Administrative Annex/Police Headquarters - 5,772,920 5,772,922 - 5,772,922 Hutchinson Island Water & Sewer - 6,243,952 6,243,951 - 6,243,951 Georgia DCA Grant- Trade Center - 3,298,511 3,298,511 - 3,298,511 Georgia DCA Grant- Mighty 8th Museum - 350,000 350,000 - 350,000 Shackelford Lighting - 210,000 210,000 - 210,000 Jail Expansion - 334,381 334,381 - 334,381 Pier/Pavilion 2,500,000 2,644,746 2,644,746 - 2,644,746 Olympic Pool 2,000,000 4,812,469 4,812,469 - 4,812,469 Weight Center 200,000 397,258 397,258 - 397,258
(Continued)
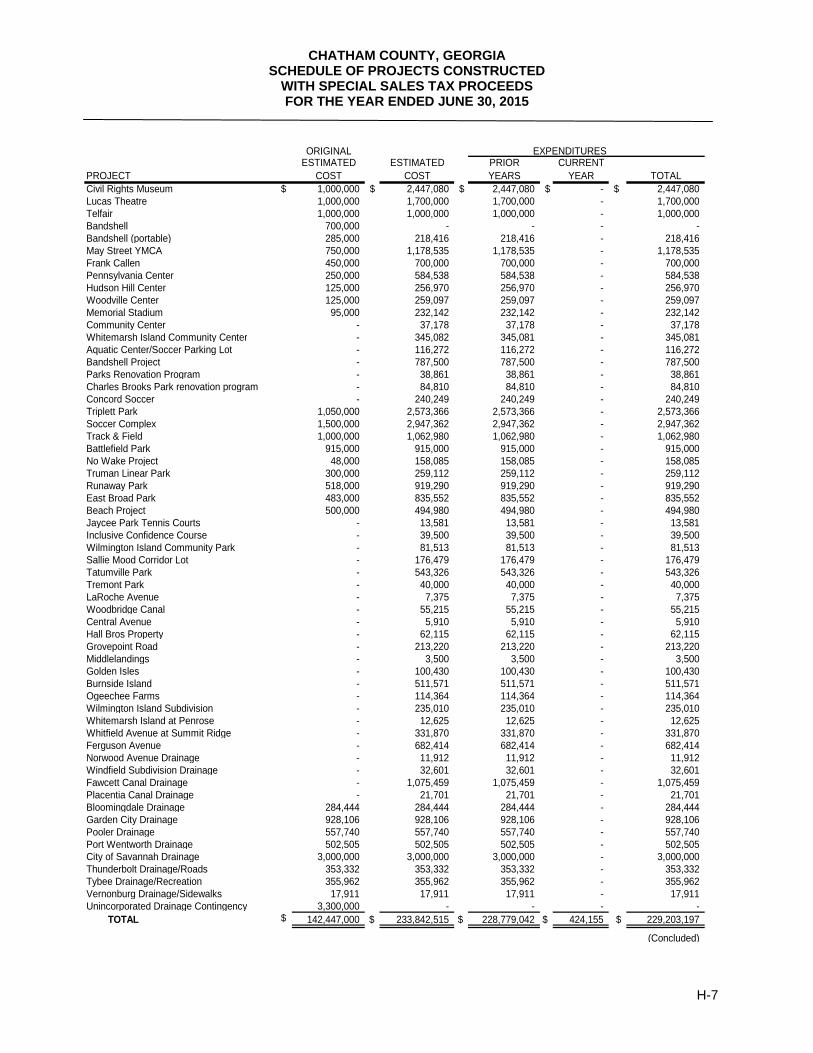
CHATHAM COUNTY, GEORGIA SCHEDULE OF PROJECTS CONSTRUCTED
WITH SPECIAL SALES TAX PROCEEDS FOR THE YEAR ENDED JUNE 30, 2015
H-7
ORIGINAL EXPENDITURESESTIMATED ESTIMATED PRIOR CURRENT
PROJECT COST COST YEARS YEAR TOTALCivil Rights Museum $ 1,000,000 $ 2,447,080 $ 2,447,080 $ - $ 2,447,080 Lucas Theatre 1,000,000 1,700,000 1,700,000 - 1,700,000 Telfair 1,000,000 1,000,000 1,000,000 - 1,000,000 Bandshell 700,000 - - - - Bandshell (portable) 285,000 218,416 218,416 - 218,416 May Street YMCA 750,000 1,178,535 1,178,535 - 1,178,535 Frank Callen 450,000 700,000 700,000 - 700,000 Pennsylvania Center 250,000 584,538 584,538 - 584,538 Hudson Hill Center 125,000 256,970 256,970 - 256,970 Woodville Center 125,000 259,097 259,097 - 259,097 Memorial Stadium 95,000 232,142 232,142 - 232,142 Community Center - 37,178 37,178 - 37,178 Whitemarsh Island Community Center - 345,082 345,081 - 345,081 Aquatic Center/Soccer Parking Lot - 116,272 116,272 - 116,272 Bandshell Project - 787,500 787,500 - 787,500 Parks Renovation Program - 38,861 38,861 - 38,861 Charles Brooks Park renovation program - 84,810 84,810 - 84,810 Concord Soccer - 240,249 240,249 - 240,249 Triplett Park 1,050,000 2,573,366 2,573,366 - 2,573,366 Soccer Complex 1,500,000 2,947,362 2,947,362 - 2,947,362 Track & Field 1,000,000 1,062,980 1,062,980 - 1,062,980 Battlefield Park 915,000 915,000 915,000 - 915,000 No Wake Project 48,000 158,085 158,085 - 158,085 Truman Linear Park 300,000 259,112 259,112 - 259,112 Runaway Park 518,000 919,290 919,290 - 919,290 East Broad Park 483,000 835,552 835,552 - 835,552 Beach Project 500,000 494,980 494,980 - 494,980 Jaycee Park Tennis Courts - 13,581 13,581 - 13,581 Inclusive Confidence Course - 39,500 39,500 - 39,500 Wilmington Island Community Park - 81,513 81,513 - 81,513 Sallie Mood Corridor Lot - 176,479 176,479 - 176,479 Tatumville Park - 543,326 543,326 - 543,326 Tremont Park - 40,000 40,000 - 40,000 LaRoche Avenue - 7,375 7,375 - 7,375 Woodbridge Canal - 55,215 55,215 - 55,215 Central Avenue - 5,910 5,910 - 5,910 Hall Bros Property - 62,115 62,115 - 62,115 Grovepoint Road - 213,220 213,220 - 213,220 Middlelandings - 3,500 3,500 - 3,500 Golden Isles - 100,430 100,430 - 100,430 Burnside Island - 511,571 511,571 - 511,571 Ogeechee Farms - 114,364 114,364 - 114,364 Wilmington Island Subdivision - 235,010 235,010 - 235,010 Whitemarsh Island at Penrose - 12,625 12,625 - 12,625 Whitfield Avenue at Summit Ridge - 331,870 331,870 - 331,870 Ferguson Avenue - 682,414 682,414 - 682,414 Norwood Avenue Drainage - 11,912 11,912 - 11,912 Windfield Subdivision Drainage - 32,601 32,601 - 32,601 Fawcett Canal Drainage - 1,075,459 1,075,459 - 1,075,459 Placentia Canal Drainage - 21,701 21,701 - 21,701 Bloomingdale Drainage 284,444 284,444 284,444 - 284,444 Garden City Drainage 928,106 928,106 928,106 - 928,106 Pooler Drainage 557,740 557,740 557,740 - 557,740 Port Wentworth Drainage 502,505 502,505 502,505 - 502,505 City of Savannah Drainage 3,000,000 3,000,000 3,000,000 - 3,000,000 Thunderbolt Drainage/Roads 353,332 353,332 353,332 - 353,332 Tybee Drainage/Recreation 355,962 355,962 355,962 - 355,962 Vernonburg Drainage/Sidewalks 17,911 17,911 17,911 - 17,911 Unincorporated Drainage Contingency 3,300,000 - - - - TOTAL $ 142,447,000 $ 233,842,515 $ 228,779,042 $ 424,155 $ 229,203,197
(Concluded)

CHATHAM COUNTY, GEORGIA SCHEDULE OF PROJECTS CONSTRUCTED
WITH SPECIAL SALES TAX PROCEEDS FOR THE YEAR ENDED JUNE 30, 2015
H-8
ORIGINAL EXPENDITURESESTIMATED ESTIMATED PRIOR CURRENT
PROJECT COST COST YEARS YEAR TOTAL
Sales Tax III (1998-2003):DRAINAGE:Administrative Expenditures Drainage $ - $ 2,673,704 $ 2,673,705 $ - $ 2,673,705 Atlantic Creosote Canal - 758,409 758,409 - 758,409 Bloomingdale Drainage 2,000,000 2,000,000 2,000,000 - 2,000,000 Chatham County Drainage 61,500,000 101,067 - - Garden City Drainage 2,000,000 2,000,000 2,000,000 - 2,000,000 Pooler Drainage 2,000,000 2,000,000 2,000,000 - 2,000,000 Port Wentworth Drainage 2,000,000 2,000,000 2,000,000 - 2,000,000 Savannah Drainage 71,000,000 71,000,000 71,000,000 - 71,000,000 Thunderbolt Drainage 2,000,000 2,000,000 2,000,000 - 2,000,000 Tybee Drainage 3,000,000 3,000,000 3,000,000 - 3,000,000 Vernonburg Drainage 400,000 400,000 400,000 - 400,000 Conaway Branch Canal - 1,264,476 1,264,476 - 1,264,476 Fawcett Phase II - 1,114,452 1,114,450 - 1,114,450 Golden Isles Area - 563,545 563,545 - 563,545 Grange Road - 158,857 158,857 - 158,857 Halycon Bluff - 1,126,751 1,126,751 - 1,126,751 Hardin Canal - 9,371,824 9,371,821 - 9,371,821 Indirect Cost Allocations -General Fund - 2,000,000 1,408,932 176,192 1,585,124 Transfer to SSD - 534,360 534,360 - 534,360 Kings Way Canal - 1,236,713 1,236,702 - 1,236,702 Little Hurst - 800,000 107,971 56,147 164,118 Little Ogeechee Basin - 9,965 9,965 - 9,965 Ogeechee Farms - 1,250,000 1,168,398 37,712 1,206,110 Pipemakers Canal - 25,945,713 20,856,241 623,003 21,479,244 Placentia Canal - 2,740,651 2,740,651 - 2,740,651 Port Industrial Park - 20,979 20,979 - 20,979 Raspberry Canal - 596,794 596,794 - 596,794 Right of Way Administration - 331,882 331,882 - 331,882 Romney Place/Parkersburg Drainage - 747,244 747,244 - 747,244 Topographic Mapping - 4,000,000 3,383,395 3,383,395 Village Green Outfall Drainage - 467,473 467,473 - 467,473 Westlake Drainage - 5,538,186 5,538,186 - 5,538,186 Wilmington Park Canal - 2,700,000 2,165,221 5,516 2,170,737 Gateway/Henderson Drainage - 1,555,938 1,555,938 - 1,555,938 Rice Mill at Grove Point - 35,014 35,014 - 35,014 Louis Mills/Redgate - 4,000,000 2,350,661 101,486 2,452,147 Quacco/Regency Park - 1,582,235 1,582,235 - 1,582,235 Quacco/Restoration - 1,648,282 1,648,282 - 1,648,282 St. Ives Culvert (Georgetown Canal) - 239,523 239,524 - 239,524 Louisville Branch - 94,043 94,043 - 94,043 Talmadge Canal - 102,691 102,691 - 102,691
OPEN SPACE, GREENWAY AND BIKEWAY:Chatham County 9,000,000 Bloomingdale - 98,597 98,597 - 98,597 Garden City - 87,979 87,979 - 87,979 Pooler - 62,260 62,260 - 62,260 Port Wentworth - 42,847 42,847 - 42,847 Savannah - 2,848,741 2,848,741 - 2,848,741 Thunderbolt - 30,273 30,273 - 30,273 Tybee Island - 33,663 33,663 - 33,663 Vernonburg - 2,532 2,532 - 2,532 Wetland Mitigation Bank - 2,400,000 2,121,682 29,108 2,150,790 Civil War Heritage Trails - 5,000 5,000 - 5,000 Coastal Georgia Greenway - 618,535 618,534 - 618,534 Demere Property Acquisition - 5,575,333 5,575,333 - 5,575,333 Greenspace Project (Grant Refund) - 71,347 71,347 - 71,347 Tom Triplett Park and Ogeechee Canal - 447,903 447,901 - 447,901
- (Continued)

CHATHAM COUNTY, GEORGIA SCHEDULE OF PROJECTS CONSTRUCTED
WITH SPECIAL SALES TAX PROCEEDS FOR THE YEAR ENDED JUNE 30, 2015
H-9
ORIGINAL EXPENDITURESESTIMATED ESTIMATED PRIOR CURRENT
PROJECT COST COST YEARS YEAR TOTAL
OTHER PROJECTS:Administrative Expenditures Other $ - $ 1,471,639 $ 357,993 $ 187,642 $ 545,635 Bloomingdale Other 458,703 396,636 396,635 - 396,635 CEMA - 240,766 240,765 - 240,765 Chatham County Other 14,112,663 - - - - City of Savannah Other 16,292,341 14,087,815 14,087,815 - 14,087,815 EMS - 79,982 79,982 - 79,982 Fire/Safety Equipment - 2,040,000 2,039,997 - 2,039,997 Garden City Other 458,703 396,636 396,635 - 396,635 Greenbriar Children's Center - 1,258,000 1,258,000 - 1,258,000 Hutchinson Island Riverwalk Ext Slip 1 - 2,000,000 945,713 - 945,713 King Tisdell Cottage - 1,258,000 1,258,000 - 1,258,000 Library (Technology) - 927,088 927,089 - 927,089 Lucas Theatre - 833,000 833,000 - 833,000 Ogeechee Canal - 833,000 431,095 3,161 434,256 Pooler Other 458,703 396,636 396,635 - 396,635 Port Wentworth Other 458,703 396,636 396,635 - 396,635 Senior Citizens - 100,000 100,000 - 100,000 Telfair Museum of the Arts - 833,000 833,000 - 833,000 Thunderbolt Other 458,703 396,637 396,636 - 396,636 Tybee Lighthouse - 297,500 297,500 - 297,500 Tybee Marine (Science Center) - 50,000 50,000 - 50,000 Tybee Other 696,428 602,191 602,192 - 602,192 Vernonburg Other 87,053 75,274 75,274 - 75,274 ROADS, STREETS, AND BRIDGES: - Administrative Expenditures - 218,343 215,475 (3,733) 211,742 Abercorn Widening (Rio Road to Truman V) - 1,000,000 874,608 3,516 878,124 Bay Street Widening - 16,248,957 9,205,142 1,483,083 10,688,225 East/West Corridor - 20,000,000 7,991,721 6,106 7,997,827 Eisenhower Widening and Median - 4,500,000 497,272 497,272 Hodgson Memorial Drive - 157,646 157,646 - 157,646 Melinda Drive (Stiles Ave Ext) - 544,000 - - - Right of Way Admin - Roads - 100,000 37,749 40,231 77,980 Chatham County Roads, Streets, Bridges 41,618,000 - - - - Spur 21, Phase I - 1,700,000 1,511,560 1,511,560 SR307 Extension - 15,224 15,224 - 15,224 Truman Parkway Phase V - 4,787,695 4,756,522 13,273 4,769,795
TOTAL $ 230,000,000 $ 250,278,082 $ 214,064,995 $ 2,762,443 $ 216,827,438
(Concluded)

CHATHAM COUNTY, GEORGIA SCHEDULE OF PROJECTS CONSTRUCTED
WITH SPECIAL SALES TAX PROCEEDS FOR THE YEAR ENDED JUNE 30, 2015
H-10
ORIGINAL EXPENDITURESESTIMATED ESTIMATED PRIOR CURRENT
PROJECT COST COST YEARS YEAR TOTAL
Sales Tax IV (2003-2008):
ROADS, STREETS, and BRIDGES:Truman Parkway Phase V $ 2,000,000 $ 3,032,314 $ 3,032,314 $ - $ 3,032,314 Benton Blvd- Extension 2,000,000 3,600,000 55,060 296,188 351,248 Interchange US 80 and J. DeLoach Pkwy 2,000,000 4,000,000 1,379,114 386,958 1,766,072 Dean Forest Road Ext from US 17 to Vet 2,000,000 184,284 184,284 - 184,284 Widen Dean Forest Road from 1-16 to US17 2,000,000 8,000,000 7,977,332 - 7,977,332 Traffic Safety Improvements Bull St to MLK 2,000,000 500,000 - - - Islands Expressway/Causton Bluff Bridge 2,000,000 1,500,000 949,716 24,007 973,723 Other Roads 6,000,000 54,402 - - - Unincorporated County Roads 14,000,000 15,600,000 12,432,144 773,504 13,205,648 Administrative Expenditures-Roads - 1,981,543 1,934,460 41,856 1,976,316 City of Savannah 13,620,000 13,782,364 13,782,364 - 13,782,364
DRAINAGE PROJECTS:Chatham County 11,000,000 11,000,000 6,033,286 137,145 6,170,431 Pipemakers Canal 17,000,000 14,000,000 547,470 - 547,470 General Drainage 500,000 400,000 339,231 - 339,231 Storm Drainage 300,000 600,000 94,801 428,927 523,728 Administrative Expenditures - 756,236 968,789 468 969,257 City of Savannah 51,150,000 51,759,764 51,759,764 - 51,759,764
OPENSPACE, GREENWAY, and BIKEWAY:Unincorporated Chatham County 2,322,122 4,850,000 4,735,354 (4,950) 4,730,404 Bloomingdale 53,540 115,967 115,967 - 115,967 Garden City 33,659 67,707 67,707 - 67,707 Pooler 33,659 67,708 67,708 - 67,708 Port Wentworth 20,078 41,138 41,138 - 41,138 Thunderbolt 14,172 30,381 30,381 - 30,381 Tybee Island 15,354 32,841 32,841 - 32,841 Vernonburg 1,200 2,547 2,547 - 2,547 Salt Marsh Mitigation - 185,000 52,497 10,635 63,132 Truman Trail II - 412,200 337,645 2,579 340,224 McQueens Trail Stabilization - 750,000 398,975 11,861 410,836 Other (Municipality & County) 2,821,203 - - - -
RECREATION, CULTURAL, and HISTORICAL:Tom Triplett Park 1,700,000 3,400,000 1,935,047 28,145 1,963,192 Runaway Point Park 400,000 376,003 376,003 - 376,003 Mother Mathilda Beasley Park 1,900,000 1,900,000 1,427,339 127,503 1,554,842 Boat Ramps 700,000 701,002 701,002 - 701,002 Bells Landing Boat Ramp - 186,248 186,248 - 186,248 Kings Ferry Boat Ramp - 880,913 881,003 - 881,003 Telfair Museum 490,128 990,128 990,128 - 990,128 Fort Jackson 1,078,283 999,638 999,638 - 999,638 W Chatham YMCA 49,013 45,438 45,438 - 45,438 McCorkle Trail 100,000 157,784 171,796 - 171,796 Civil Rights Museum 1,328,248 3,207,193 3,207,193 - 3,207,193 Tatemville Community Center 735,193 693,519 693,519 - 693,519 Coastal Soccer 68,618 135,466 135,465 - 135,465 King-Tisdell 980,257 1,951,902 1,951,902 - 1,951,902 WW Law Center 980,257 908,762 401,372 - 401,372 Yamacraw Arts 68,618 63,613 63,613 - 63,613 Con Ed 490,128 490,128 490,128 - 490,128 Library 24,500,000 25,000,000 23,333,973 1,844,374 25,178,347 Soccer Complex - 400,000 4,289 291,455 295,744
(Continued)

CHATHAM COUNTY, GEORGIA SCHEDULE OF PROJECTS CONSTRUCTED
WITH SPECIAL SALES TAX PROCEEDS FOR THE YEAR ENDED JUNE 30, 2015
H-11
ORIGINAL EXPENDITURESESTIMATED ESTIMATED PRIOR CURRENT
PROJECT COST COST YEARS YEAR TOTAL
OTHER CAPITAL PROJECTS:County Courthouse-Tax Assessor Computer $ 800,000 $ 696,270 $ 696,270 $ - $ 696,270 Chatham County Police Merger 2,200,000 3,102,385 3,102,385 - 3,102,385 Chatham County Courthouse 12,000,000 14,999,342 14,999,342 - 14,999,342 County Vehicles 4,580,000 6,397,216 5,571,525 201,625 5,773,150 King George Sidewalks 250,000 180,259 180,258 - 180,258 US 80 Sidewalks 75,000 2,547 (11,463) - (11,463) US 80 Beautification 75,000 75,000 75,000 - 75,000 Wild Heron Sidewalks 100,000 37,255 37,255 - 37,255 Whitemarsh Island Bikeways 450,000 687,428 687,428 - 687,428 Charlie Brooks Park 950,000 3,000,000 1,040,364 - 1,040,364 Public Works Building 1,000,000 5,000,000 4,886,084 29,661 4,915,745 Greenbriar 1,470,385 1,465,926 1,363,142 - 1,363,142 Hospice 1,980,257 1,980,257 1,980,257 - 1,980,257 CAT 926,343 5,416,037 4,366,039 1,050,000 5,416,039 Rape Crisis 98,026 90,876 90,876 - 90,876 Royce Learning Center 1,764,462 1,764,462 1,764,462 - 1,764,462 Humane Society 144,588 134,042 134,042 - 134,042 Food Bank 784,206 784,206 784,206 - 784,206 Savannah Symphony 98,026 - - - - Ash Tree 245,064 245,064 245,064 - 245,064 Court Appointed Special Advocate 98,026 - - - - Diversion Center 4,000,000 2,000,000 31,000 - 31,000 Savannah other capital projects 2008+ 1,669,711 - - - - Telfair 500,000 - - - - King Tisdell 1,000,000 - - - -
OTHER CAPITAL OUTLAY-PUBLIC SAFETY:Bloomingdale Fire Dept 100,000 101,454 101,453 - 101,453 Garden City Fire Dept 200,000 201,161 201,161 - 201,161 Isle of Hope Fire Dept 100,000 80,000 80,000 - 80,000 Pooler Fire Dept 200,000 201,161 201,161 - 201,161 Port Wentworth Fire Dept 200,000 201,273 201,273 - 201,273 Southside Fire Dept 800,000 800,000 800,000 - 800,000 Thunderbolt Fire Dept 100,000 100,411 100,411 - 100,411 Tybee Island Fire Dept 100,000 100,186 100,186 - 100,186 Savannah Public Safety 1,300,000 1,315,497 1,315,497 - 1,315,497
OTHER CAPITAL OUTLAY-MUNICIPALITIES:Bloomingdale 2,700,000 2,740,237 2,740,237 - 2,740,237 Garden City 3,779,500 3,803,004 3,803,004 - 3,803,004 Pooler 3,779,500 3,803,003 3,803,003 - 3,803,003 Port Wentworth 2,254,426 2,271,740 2,271,740 - 2,271,740 Thunderbolt 2,600,000 2,611,779 2,611,779 - 2,611,779 Tybee Island 6,400,000 6,414,619 6,414,619 - 6,414,619 Vernonburg 400,000 401,095 401,095 - 401,095 City of Savannah 29,901,183 31,982,002 31,982,000 - 31,982,000
OTHERDebt Retirement 16,000,000 16,719,000 16,719,000 - 16,719,000 M / WBE Contract for Consulting Services - 320,000 320,000 - 320,000 Transfer out to General Fund - Repurposing - 4,000,000 - 4,000,000 4,000,000 Transfer to M&O - Indirect Cost Allocation 2,000,000 1,214,579 176,926 1,391,505 Transfer to CIP - 10,000 - - - Reserve for Other Projects - 8,252 8,252 - 8,252 Administrative Expenditures 1,371,974 526,578 478,640 1,005,218
TOTAL $ 276,627,433 $ 309,410,553 $ 263,288,549 $ 10,337,507 $ 273,626,056
(Concluded)

CHATHAM COUNTY, GEORGIA SCHEDULE OF PROJECTS CONSTRUCTED
WITH SPECIAL SALES TAX PROCEEDS FOR THE YEAR ENDED JUNE 30, 2015
H-12
ORIGINAL EXPENDITURES
ESTIMATED ESTIMATED PRIOR CURRENT
PROJECT COST COST YEARS YEAR TOTAL
Sales Tax V (2008-2014):
Roads, Streets & Bridges Projects - County-wide $ 30,000,000 $ $ $ $
Jimmy DeLoach Parkway Phase II - 4,000,000 - - -
Interchange US 80 / Jimmy DeLoach Parkway - 7,000,000 220,354 275,284 495,638
Little Neck Road - 3,500,000 - - -
I-16 Flyover Removal - 850,000 355,000 - 355,000
Dean Forest Rd Widening I16 to US17 - 4,000,000 1,633,059 1,813,110 3,446,169
Chatsworth Cul-De-Sac Con. - 200,000 64,499 2,234 66,733
Admin Expenditures - Indirect Cost Allocation - 603,889 645,025 527,063 1,172,088
Phase II Level One Capital Projects - County-wide 39,000,000
Juvenile Court Complex - 3,370,200 87,131 224,141 311,272
Judicial Courthouse - 27,000,000 20,238,939 301,762 20,540,701
County Health Department - 9,425,448 8,425,448 175,895 8,601,343
Phase I Level One Capital Projects - County-wide -
Detention Center (Transfer Out) 100,000,000 100,186,086 86,778,544 618,023 87,396,567
Detention Center Debt Service 9,000,000 - - - -
Capital Projects - County-wide 18,000,000 -
CAT - 1,996,860 1,926,860 70,000 1,996,860
County Admin Building - 3,350,000 2,343,224 231,893 2,575,117
Hutchinson Island Slip 3 - 3,375,134 3,375,134 - 3,375,134
Hitch Library - 850,000 - - -
Ambuc Ball Park - 850,000 - - -
Liberty Community Center - 1,100,000 119,422 803,009 922,431
Carver Heights Community Center - 950,000 55,034 881,951 936,985
Cloverdale Community Center - 1,110,000 222,280 887,809 1,110,089
Greenspace - 1,000,000 977,503 - 977,503
Law Enforcement Training Facility - 292,398 279,492 15,635 295,127
Unincorporated County Projects 5,500,000 -
Reserve Unincorp. County Projects - Roads 14,000,000 2,164,080 - - -
Laroche Avenue Culvert 1,500,000 518,444 660,065 1,178,509
Coastal Georgia Greenway 1,100,000 1,016,197 - 1,016,197
Misc. Road Resurfacing 2,500,000 974,633 387,629 1,362,262
Public Works Parking Lot 251,000 251,000 - 251,000
Walthour Road Bridge 1,072,000 428,629 624,746 1,053,375
Skidaway Road Culver 500,000 - - -
Bridge Replacements 500,000 - - -
Culvert Replacements 500,000 - - -
Intersection Improvements 1,000,000 - 11,899 11,899
Johnny Mercer TSM 400,000 - - -
Laroche/Jasmine Intersection 400,000 - - -
Johnny Mercer/ Whitefmarsh Island 200,000 - - -
Reserve Unincorp. County Projects - Parks & Rec 6,500,000 100,000 - - -
Charlie Brooks Park - 250,000 - 23,595 23,595
Tom Triplett Park - 440,000 - - -
Scott Stell Park - 1,000,000 34,425 - 34,425
Lake Mayer Park - 1,000,000 97,891 - 97,891
(Continued)

CHATHAM COUNTY, GEORGIA SCHEDULE OF PROJECTS CONSTRUCTED
WITH SPECIAL SALES TAX PROCEEDS FOR THE YEAR ENDED JUNE 30, 2015
H-13
ORIGINAL EXPENDITURES
ESTIMATED ESTIMATED PRIOR CURRENT
PROJECT COST COST YEARS YEAR TOTAL
Turners Creek $ - $ 3,000,000 $ - $ 3,000,000 $ 3,000,000
Cannon Field - 200,000 - - -
Reserve Unincorp. County Projects - Sidewalks 3,000,000 1,500,000 - - -
Bradley Point Sidewalks - 500,000 - 108,663 108,663
Public Safety Fire Equipment - 400,000 - - -
Public Safety - CEMA Facility Design - 850,000 368,786 - 368,786
Weightlifting Center - 500,000 61,871 285,010 346,881
Westside Police Precinct - 3,500,000 393,638 - 393,638
Marine Patrol Facilities and Equipment - 400,000 - - -
Admin Expend. Other Cap. - - - - -
Drainage / Flood Control -
Pipemakers Canal 10,000,000 11,000,000 6,460,041 466,629 6,926,670
Hardin Canal 10,000,000 2,500,000 53,757 7,043 60,800
Administrative Expense - Drainage - 59,802 59,937 43,334 103,271
Reserve Unincorp. County Projects - Flood Ctrl 11,000,000 - - - -
Ferguson - 900,000 16,827 - 16,827
Shipyard - 500,000 - 195,691 195,691
Gateway/Henderson Drainage - 1,900,000 99,355 160,925 260,280
Willow Lakes Drainage - 900,000 12,225 11,416 23,641
Hampton Place Drainage - 1,400,000 66,746 476,870 543,616
Brampton Outfall - 850,000 - - -
Pin Point Drainage - 500,000 - 12,789 12,789
Distribution To Municipalities 189,300,000 -
Bloomingdale distribution - 2,224,883 2,026,931 197,951 2,224,882
Garden City distribution - 4,523,837 4,121,345 402,492 4,523,837
Pooler distribution - 4,449,516 4,053,637 395,880 4,449,517
Port Wentworth distribution - 2,224,883 2,026,931 197,951 2,224,882
Savannah distribution - 118,655,264 108,098,337 10,556,925 118,655,262
Thunderbolt distribution - 2,224,883 2,026,931 197,951 2,224,882
Tybee Island distribution - 5,932,688 5,404,848 527,840 5,932,688
Vernonburg distribution - 148,392 135,189 13,203 148,392
Other Projects -
Admin Expend. - Direct Charges - 2,321,562 481,174 439,128 920,302
Admin Expend. IDC - 600,000 335,137 - 335,137
$ 445,300,000 $ 364,552,805 $ 267,371,810 $ 26,233,434 $ 293,605,244
(Concluded)
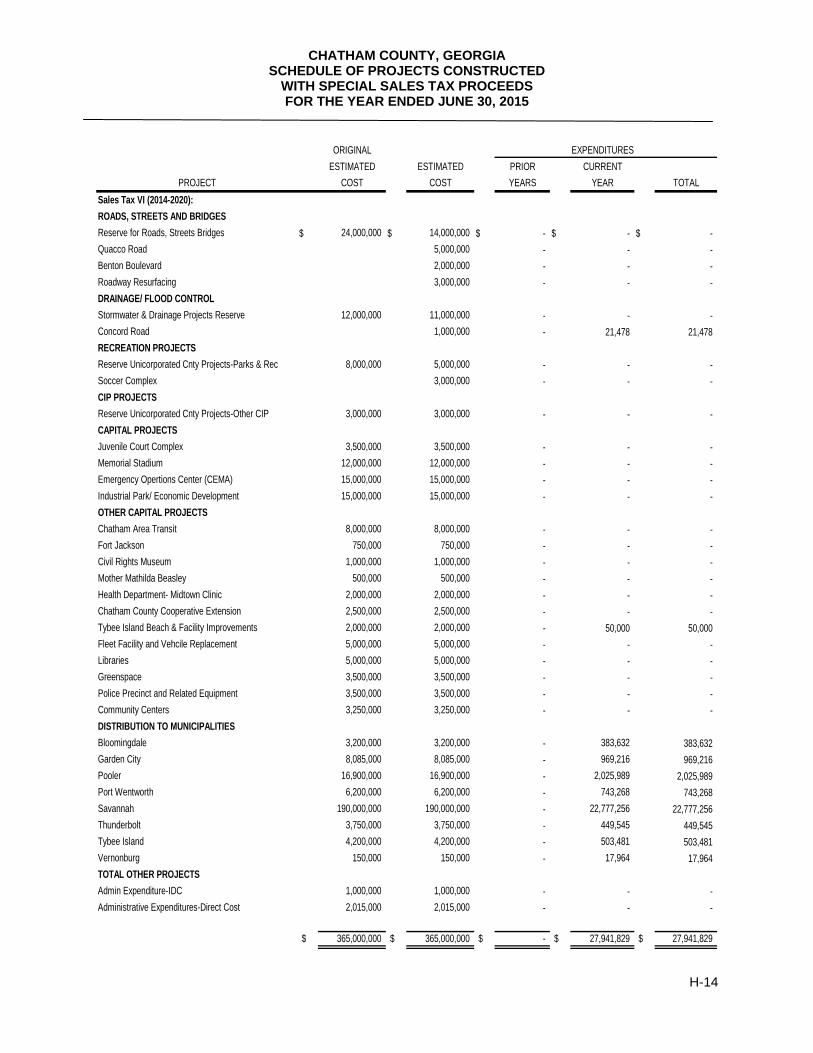
CHATHAM COUNTY, GEORGIA SCHEDULE OF PROJECTS CONSTRUCTED
WITH SPECIAL SALES TAX PROCEEDS FOR THE YEAR ENDED JUNE 30, 2015
H-14
ORIGINAL EXPENDITURES
ESTIMATED ESTIMATED PRIOR CURRENT
PROJECT COST COST YEARS YEAR TOTAL
Sales Tax VI (2014-2020):
ROADS, STREETS AND BRIDGES
Reserve for Roads, Streets Bridges $ 24,000,000 $ 14,000,000 $ - $ - $ -
Quacco Road 5,000,000 - - -
Benton Boulevard 2,000,000 - - -
Roadway Resurfacing 3,000,000 - - -
DRAINAGE/ FLOOD CONTROL
Stormwater & Drainage Projects Reserve 12,000,000 11,000,000 - - -
Concord Road 1,000,000 - 21,478 21,478
RECREATION PROJECTS
Reserve Unicorporated Cnty Projects-Parks & Rec 8,000,000 5,000,000 - - -
Soccer Complex 3,000,000 - - -
CIP PROJECTS
Reserve Unicorporated Cnty Projects-Other CIP 3,000,000 3,000,000 - - -
CAPITAL PROJECTS
Juvenile Court Complex 3,500,000 3,500,000 - - -
Memorial Stadium 12,000,000 12,000,000 - - -
Emergency Opertions Center (CEMA) 15,000,000 15,000,000 - - -
Industrial Park/ Economic Development 15,000,000 15,000,000 - - -
OTHER CAPITAL PROJECTS
Chatham Area Transit 8,000,000 8,000,000 - - -
Fort Jackson 750,000 750,000 - - -
Civil Rights Museum 1,000,000 1,000,000 - - -
Mother Mathilda Beasley 500,000 500,000 - - -
Health Department- Midtown Clinic 2,000,000 2,000,000 - - -
Chatham County Cooperative Extension 2,500,000 2,500,000 - - -
Tybee Island Beach & Facility Improvements 2,000,000 2,000,000 - 50,000 50,000
Fleet Facility and Vehcile Replacement 5,000,000 5,000,000 - - -
Libraries 5,000,000 5,000,000 - - -
Greenspace 3,500,000 3,500,000 - - -
Police Precinct and Related Equipment 3,500,000 3,500,000 - - -
Community Centers 3,250,000 3,250,000 - - -
DISTRIBUTION TO MUNICIPALITIES
Bloomingdale 3,200,000 3,200,000 - 383,632 383,632
Garden City 8,085,000 8,085,000 - 969,216 969,216
Pooler 16,900,000 16,900,000 - 2,025,989 2,025,989
Port Wentworth 6,200,000 6,200,000 - 743,268 743,268
Savannah 190,000,000 190,000,000 - 22,777,256 22,777,256
Thunderbolt 3,750,000 3,750,000 - 449,545 449,545
Tybee Island 4,200,000 4,200,000 - 503,481 503,481
Vernonburg 150,000 150,000 - 17,964 17,964
TOTAL OTHER PROJECTS
Admin Expenditure-IDC 1,000,000 1,000,000 - - -
Administrative Expenditures-Direct Cost 2,015,000 2,015,000 - - -
$ 365,000,000 $ 365,000,000 $ - $ 27,941,829 $ 27,941,829

CHATHAM COUNTY, GEORGIA SCHEDULE OF REQUIRED EXPENDITURES
GENERATED BY HOTEL/ MOTEL TAX FOR THE YEAR ENDED JUNE 30, 2015
H-15
Revenue:Hotel/Motel Taxes 1,582,429$
Tourism Expenditures:Maritime Trade Center 263,738$ Savannah Convention Center 527,476
791,214$
Percentage of expenditures to revenues 50%

CHATHAM COUNTY, GEORGIA SCHEDULE OF REQUIRED EXPENDITURES
GENERATED BY ENERGY EXCISE TAX FOR THE YEAR ENDED JUNE 30, 2015
H-16
REVENUE:Energy Excise Taxes 950,111$
EXPENDITURES:Chatham County 313,248$ City of Savannah 493,814 City of Pooler 59,764 City of Port Wentworth 18,473 City of Tybee Island 14,151 Town of Thunderbolt 10,204 City of Bloomingdale 10,268 City of Garden City 29,666 City of Vernonburg 524
950,111$