comprehensive cost of service and rate design … saws rate study report...comprehensive cost of...
TRANSCRIPT

COMPREHENSIVE COST OF SERVICE AND RATE DESIGN ANALYSIS San Antonio Water System
PREPARED FOR
San Antonio Water System
26 MAY 2015
B&V PROJECT NO. 182649 ®
®
©B
lack
& V
eatc
h H
old
ing
Co
mp
any
201
1. A
ll ri
ghts
res
erv
ed.

BLACK & VEATCH | Table of Contents ii
Table of Contents Executive Summary .................................................................................................................. 9
Recommendations ............................................................................................................................ 11
Water Rate Structure and Rates ............................................................................................ 11
Wastewater Rate Structure and Rates ................................................................................ 13
Revenue Stability and Drought Rates .................................................................................. 14
Recycled Water ............................................................................................................................. 15
District Special Project .............................................................................................................. 15
Fire Line Charges ......................................................................................................................... 15
Sewer Surcharges ........................................................................................................................ 15
Affordability Program ................................................................................................................ 16
Irrigation System Non-Compliance ...................................................................................... 16
Special Services Fees .................................................................................................................. 16
Introduction ............................................................................................................................. 17
Background ......................................................................................................................................... 17
Purpose of Study ............................................................................................................................... 18
Scope of Work .................................................................................................................................... 18
RAC Involvement .............................................................................................................................. 18
Disclaimer ............................................................................................................................................ 19
General Rate Study Approach ...................................................................................................... 19
Objectives, Policies & Rate Setting Principles ....................................................................... 20
Water Rate Study .................................................................................................................... 22
Review of Existing Rate Structure ............................................................................................. 22
Water Service Availability Charge ........................................................................................ 22
Water Volumetric Charge ......................................................................................................... 23
Revenue and Revenue Requirements....................................................................................... 25
Water Supply Revenue Requirements ................................................................................ 26
Water Delivery Revenue Requirements ............................................................................. 26
Water Cost Of Service Allocation ................................................................................................ 27
Functional Cost Components .................................................................................................. 27
Allocation to Cost Components .............................................................................................. 28
Fire Protection ...................................................................................................... 30
Allocation of Revenue Requirements ................................................................... 30
Units of Service ............................................................................................................................. 32
Cost of Service Allocations to Customer Classes ............................................................. 33
Unit Costs of Service ............................................................................................. 33
Adequacy of Existing Rates to Meet Costs of Service ........................................... 33
BLACK & VEATCH | Table of Contents iii
Multi-Family Customer Class .................................................................................................. 34
Water Rate Design ............................................................................................................................ 35
Rate Options ................................................................................................................................... 35
Revenue Sufficiency .................................................................................................................... 38
Customer Bill Impact ....................................................................................................................... 39
Wastewater Rate Study ........................................................................................................ 42
Review of Existing Rate Structure ............................................................................................. 42
Wastewater Service Availability Charge ............................................................................ 42
Wastewater Volumetric Charge ............................................................................................. 42
Sewer Surcharges ........................................................................................................................ 43
Revenue Requirements .................................................................................................................. 43
Wastewater Revenue Requirements ................................................................................... 43
Wastewater Cost of Service Allocation .................................................................................... 44
Functional Components of Wastewater System ............................................................. 44
Allocation to Cost Components .............................................................................................. 45
Cost of Service Allocations to Customer Classes ............................................................. 46
Adequacy of Existing Rates to Meet Costs of Service .................................................... 47
Multi-Family Customer Class .................................................................................................. 47
Wastewater Rate Design ................................................................................................................ 48
Rate Options ................................................................................................................................... 48
Revenue Sufficiency .................................................................................................................... 49
Customer Bill Impact ....................................................................................................................... 50
Other Financial Recommendations ................................................................................. 51
Revenue Stability Strategy ............................................................................................................ 51
Revenue Stability Strategy ....................................................................................................... 52
Recycled Water .................................................................................................................................. 52
Current Rates and Cost Recovery ......................................................................................... 52
Recommendations ....................................................................................................................... 54
San Antonio Water System - District Special Project Rates ............................................ 54
Wholesale Rates ................................................................................................................................ 55
Wholesale Water .......................................................................................................................... 55
Wholesale Wastewater .............................................................................................................. 56
Irrigation Non-Compliance ........................................................................................................... 56
Future Rate Adjustments and Price Elasticity ...................................................................... 57
Appendix A - Affordability Program Analysis .............................................................. 59
Analysis ................................................................................................................................................. 60
Finding and Recommendation .................................................................................................... 63

BLACK & VEATCH | Table of Contents iv
Finding ............................................................................................................................................. 63
Recommendation ......................................................................................................................... 63
SAWS Summary ................................................................................................................................. 64
SAWS Programs Summary ....................................................................................................... 64
Project Agua .......................................................................................................... 64
Plumbers to People ............................................................................................... 64
Affordability Discount ........................................................................................... 65
Senior Citizen Billing Program ............................................................................... 65
Disability Billing ..................................................................................................... 65
Courtesy Notice Program ...................................................................................... 66
Peer City Programs ..................................................................................................................... 66
Overview ............................................................................................................... 66
Houston, TX ........................................................................................................... 67
Austin, TX .............................................................................................................. 68
Albuquerque, NM ................................................................................................. 69
Philadelphia, PA .................................................................................................... 70
Washington, DC .................................................................................................... 71
Nashville, TN ......................................................................................................... 71
Portland, OR .......................................................................................................... 72
Appendix to Memorandum – 2015 Federal Poverty Guidelines ................................... 74
Appendix to Memorandum – Low-Income Affordability Program Types ................. 75
Appendix B – Special Services Fee Analysis .................................................................. 76
Project Overview ............................................................................................................................... 77
Special Services Fees Analysis ..................................................................................................... 77
Assumptions .................................................................................................................................. 78
Table B-1 – Overhead Allocation per Budget Dollar ............................................. 78
Industrial Discharge Sampling Fee ....................................................................................... 79
Table B-2 – Summary of Industrial Discharge Sampling Total Costs .................... 79
Table B-3 – Summary of Industrial Discharge Sampling Fee ................................ 80
Industrial Waste Permit Fees ................................................................................................. 80
Table B-4 – Summary of Total Industrial Waste Permit Costs .............................. 81
Table B-5 – 2014 Unit Cost of Industrial Waste Permit ........................................ 81
Laboratory Test Fees .................................................................................................................. 81
Table B-6 – Summary of Total Laboratory Costs ................................................... 82
BLACK & VEATCH | Table of Contents v
Table B-7 – Unit Cost of Laboratory Tests ............................................................ 82
Liquid Hauler Permit and Disposal Fee .............................................................................. 83
Table B-8 – Summary of Total Costs ..................................................................... 83
Table B-9 – Summary of 2015 Liquid Waste Hauler Fee ....................................... 84
Fire Hydrant Meter Fees ........................................................................................................... 85
Table B-10 – Customer Volumetric Fees ............................................................... 85
Table B-11 – Summary of Hydrant Costs .............................................................. 85
Summary .............................................................................................................................................. 86
Table B-12 – Special Service Fees Recommendations .......................................... 86
Appendix C – Additional Report Tables .......................................................................... 87
Table C-1 – Proposed FY 2015 Residential Inside City Water Rates ..................... 87
Table C-2 – Proposed FY 2015 Residential Outside City Water Rates .................. 88
Table C-3 – Proposed FY 2015 General Class Water Rates ................................... 89
Table C-4 – Proposed FY 2015 Irrigation Inside City Water Rates ........................ 90
Table C-5 – Proposed FY 2015 Irrigation Outside City Water Rates ..................... 91
Table C-6 – Proposed FY 2015 Wholesale Water Rates ........................................ 92
Table C-7 – District Special Project (former BexarMet) Water Rates ................... 93
Table C-8 – Proposed FY 2015 Residential & General Class Inside City ...................
Wastewater Rates .............................................................................. 93
Table C-9 – Proposed FY 2015 Residential & General Class Outside City
Wastewater Rates .............................................................................. 94
Table C-10 – Proposed FY 2015 Wholesale Wastewater Rates ............................ 94
Table C-11 –Recycled Water Rates ....................................................................... 94
BLACK & VEATCH | Table of Contents vi
LIST OF TABLES Table 1 RAC Rate Analysis Objectives ................................................................................... 10
Table 2 Proposed FY 2015 Water Rates – Residential (ICL) ........................................ 12
Table 3 Proposed FY 2015 Water Rates – General (ICL) ............................................... 12
Table 4 Proposed FY 2015 Water Rates – Wholesale ..................................................... 13
Table 5 Proposed FY 2015 Water Rates – Irrigation (ICL) ........................................... 13
Table 6 Proposed FY 2015 Wastewater Rates – Residential (ICL) &
General (ICL) .................................................................................................................... 14
Table 7 Proposed FY 2015 Wastewater Rates - Wholesale .......................................... 14
Table 8 Projected Water Accounts and Usage by Customer Class ............................. 22
Table 9 Existing Residential Class Meter Charges by Meter Size ............................... 23
Table 10 Existing General & Irrigation Class Meter Charges by Meter Size ............. 23
Table 11 Existing Residential Class Combined Water Volumetric Rates and
Usage by Block ................................................................................................................ 24
Table 12 Existing General Class Combined Water Volumetric Rates and
Usage by Block ................................................................................................................ 24
Table 13 Existing Irrigation Class Combined Water Volumetric Rates and
Usage by Block ................................................................................................................ 24
Table 14 FY 2015 Water Supply Revenue Requirements ................................................ 26
Table 15 FY 2015 Water Delivery Revenue Requirements ............................................. 26
Table 16 Customer Class Water Supply Allocation Percentages within Each
Cost Component ............................................................................................................. 31
Table 17 Total Water Supply Allocation Percentages ....................................................... 31
Table 18 Customer Class Water Delivery Allocation Percentages within
Each Cost Component .................................................................................................. 31
Table 19 Total Water Delivery Allocation Percentages .................................................... 31
Table 20 Customer Peaking Factors ......................................................................................... 32
Table 21 FY 2015 Adjusted Cost of Service with Revenues under Existing
Rates – Water Supply ................................................................................................... 34
Table 22 FY 2015 Adjusted Cost of Service with Revenues under Existing
Rates – Water Delivery ................................................................................................ 34
Table 23 Existing and Proposed Residential Block Structure & Bill
Frequency ......................................................................................................................... 36
Table 24 Existing and Proposed Irrigation Block Structure & Bill
Frequency ......................................................................................................................... 36
Table 25 Proposed Water Block Pricing Differentials ....................................................... 36
Table 26 Proposed FY 2015 Water Rates – Residential (ICL) ........................................ 37
Table 27 Proposed FY 2015 Water Rates – General (ICL) ............................................... 37
Table 28 Proposed FY 2015 Water Rates – Irrigation (ICL) ........................................... 38

BLACK & VEATCH | Table of Contents vii
Table 29 FY 2015 Adjusted Cost of Service with Revenues under Proposed
Rates – Water Supply ................................................................................................... 38
Table 30 FY 2015 Adjusted Cost of Service with Revenues under Proposed
Rates – Water Delivery ................................................................................................ 38
Table 31 2015 Projected Wastewater Accounts and Usage by Customer
Class ..................................................................................................................................... 42
Table 32 Existing Wastewater Charges ................................................................................... 43
Table 33 FY 2015 Wastewater Revenue Requirements ................................................... 43
Table 34 Customer Class Wastewater Allocation Percentages within Each
Cost Component ............................................................................................................. 46
Table 35 Total Wastewater Allocation Percentages .......................................................... 46
Table 36 Comparison of Allocated Costs of Service with Revenues under
Existing Rates – FY 2015 ............................................................................................. 47
Table 37 Proposed FY 2015 Wastewater Rates – Residential & General
(ICL) ..................................................................................................................................... 49
Table 38 FY 2015 Allocated Cost of Service with Revenue under Proposed
Wastewater Rates .......................................................................................................... 50
Table 39 Variability of Customer Water Usage .................................................................... 51
Table 40 Existing Recycled Water Rates ................................................................................. 53
Table 41 Recycled Water Allocated Costs............................................................................... 53
Table 42 SAWS Wholesale Customer Profile ......................................................................... 55
Table 43 Existing and Proposed Wholesale Combined Water Rates – FY
2015 ..................................................................................................................................... 56
Table 44 Wholesale Wastewater Rates ................................................................................... 56
BLACK & VEATCH | Table of Contents viii
LIST OF FIGURES Figure 1 Industry Standard Rate Study Approach ............................................................. 20
Figure 2 Rate Setting Objectives ................................................................................................ 21
Figure 3 Rate Study Priorities ..................................................................................................... 21
Figure 4 Financial Plan Review .................................................................................................. 25
Figure 5 General Cost of Service Allocation Methodology .............................................. 28
Figure 6 Water Revenue Requirements Allocation to Functional Costs ................... 29
Figure 7 Water Cost of Service Concept ................................................................................. 30
Figure 8 Distribution of Costs to Customer Classes ........................................................... 33
Figure 9 Rate Design Process ...................................................................................................... 35
Figure 10 Residential Water Bill Comparison – Low Use .................................................. 39
Figure 11 Residential Water Bill Comparison – Medium Use .......................................... 40
Figure 12 Residential Water Bill Comparison – High Use ................................................. 41
Figure 13 Wastewater Revenue Requirements Allocation to Functional
Costs .................................................................................................................................... 45
Figure 14 Distribution of Costs to Customer Classes ........................................................... 47
Figure 15 Rate Design Process ...................................................................................................... 48
Figure 16 Residential Wastewater Bill Comparison ............................................................ 50
San Antonio Water System | COMPREHENSIVE COST OF SERVICE AND RATE DESIGN ANALYSIS
BLACK & VEATCH | Executive Summary 9
Executive Summary The SAWS Rate Advisory Committee (RAC), an advisory group appointed by the San Antonio Water
System (SAWS) Board of Trustees, and SAWS staff completed work on an updated Comprehensive
Cost of Service and Rate Design Study. This report is the culmination of this effort; it documents the
process followed to develop the recommendations included herein, the cost of service analyses
supporting such recommendations, and the rationale behind the design of the proposed rate
structures for SAWS’ water and wastewater utilities. Additionally, the study included an analysis of
the impact of converting the District Special Project (DSP) to SAWS water rates, an analysis of
various water utilities’ customer affordability programs and a review of SAWS’ Special Services
Fees. The specific objectives of the study were to:
Allocate projected revenue requirements for 2015 to the various customer classes in
accordance with the respective cost of service requirements.
Update the cost of service factors used to properly allocate revenue requirements and
determine appropriate customer class groupings.
Develop suitable rate schedules that produce revenues adequate to meet financial needs of each
utility while recognizing customer costs of service and local and state legal and policy
considerations.
Design aggressive conservation-oriented rate structures that incentivize the efficient usage of
water. These rate structures should also strive to ensure that life essential uses of water are
made as affordable as possible.
Review and update the SAWS recycled water rate schedule.
Develop a multi-year financial model that projects the impact on SAWS future rates of different
assumptions regarding future capital and operating requirements. These assumptions include
1) the cost of water provided by the Vista Ridge project and the possible sale of Vista Ridge
water to communities along the pipeline route; 2) the timing of converting DSP customers to
SAWS rates; and 3) elasticity of customer demand as a result of conservation efforts, projected
future rate adjustments and significant drought restrictions.
Review and analyze SAWS’ affordability programs in comparison with other metropolitan
utilities and suggest improvements to the current programs.
Update current Special Services Fees to ensure that SAWS is adequately recovering costs
associated with the related services.
The RAC made its first major contribution in the rate setting process by identifying the policy
priorities or pricing objectives the committee members believed were most important to consider.
It was understood by all parties that viable alternative rate structures would exemplify all of the
pricing objectives, with an emphasis on the top ranked objectives as illustrated in Table 1.
San Antonio Water System | COMPREHENSIVE COST OF SERVICE AND RATE DESIGN ANALYSIS
BLACK & VEATCH | Executive Summary 10
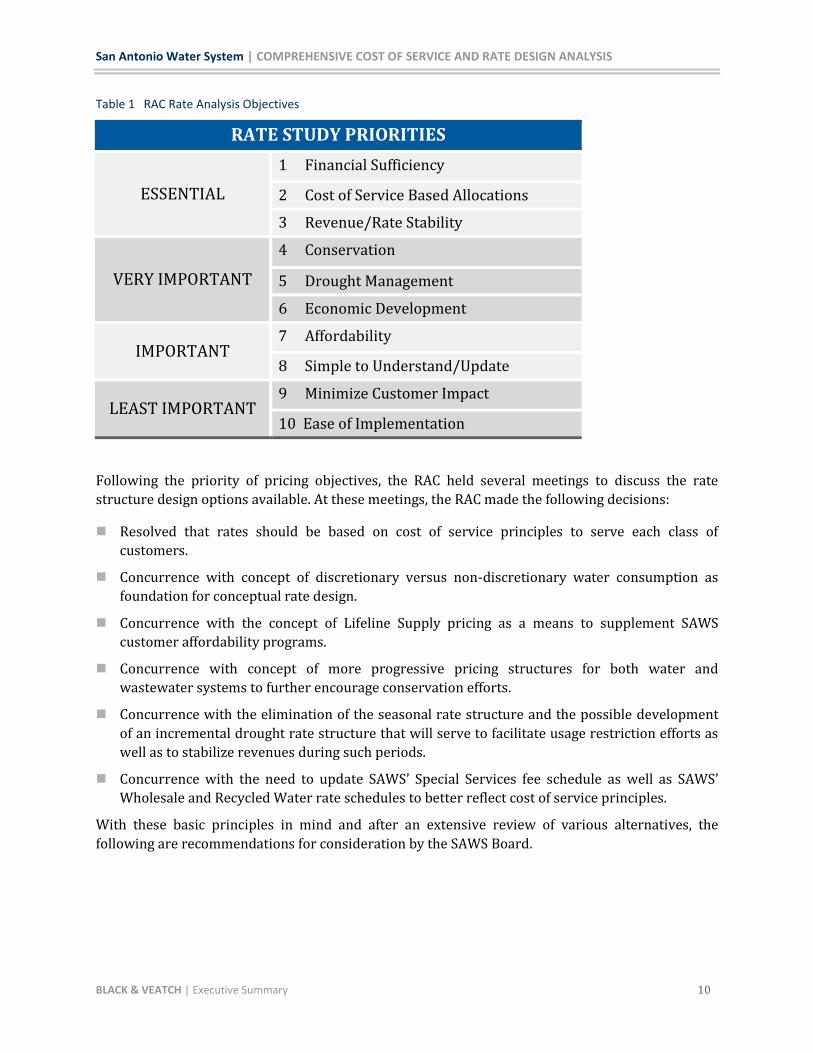
Table 1 RAC Rate Analysis Objectives
RATE STUDY PRIORITIES
ESSENTIAL
1 Financial Sufficiency
2 Cost of Service Based Allocations
3 Revenue/Rate Stability
VERY IMPORTANT
4 Conservation
5 Drought Management
6 Economic Development
IMPORTANT 7 Affordability
8 Simple to Understand/Update
LEAST IMPORTANT 9 Minimize Customer Impact
10 Ease of Implementation
Following the priority of pricing objectives, the RAC held several meetings to discuss the rate
structure design options available. At these meetings, the RAC made the following decisions:
Resolved that rates should be based on cost of service principles to serve each class of
customers.
Concurrence with concept of discretionary versus non-discretionary water consumption as
foundation for conceptual rate design.
Concurrence with the concept of Lifeline Supply pricing as a means to supplement SAWS
customer affordability programs.
Concurrence with concept of more progressive pricing structures for both water and
wastewater systems to further encourage conservation efforts.
Concurrence with the elimination of the seasonal rate structure and the possible development
of an incremental drought rate structure that will serve to facilitate usage restriction efforts as
well as to stabilize revenues during such periods.
Concurrence with the need to update SAWS’ Special Services fee schedule as well as SAWS’
Wholesale and Recycled Water rate schedules to better reflect cost of service principles.
With these basic principles in mind and after an extensive review of various alternatives, the
following are recommendations for consideration by the SAWS Board.
San Antonio Water System | COMPREHENSIVE COST OF SERVICE AND RATE DESIGN ANALYSIS
BLACK & VEATCH | Executive Summary 11
RECOMMENDATIONS
Water Rate Structure and Rates
Develop a Residential Lifeline Supply rate block to incentivize very efficient use of water and to
provide all residential customers with a very low rate for life essential uses of water. This
proposal would change the rate structure by reducing the volumetric rate for the first 2,992
gallons of consumption and lowering the fixed charge for customers with no usage above 2,992
gallons.
Expand the number of Residential volumetric blocks from four to eight. This change will allow
SAWS to send an earlier price signal to all customers with usage above the Lifeline Supply
amount and will further incentivize customer conservation efforts by affording customers the
opportunity to move down the rate blocks with moderate reductions in usage.
Continue to group the multi-family customers with the General class.
Expand the number of Irrigation volumetric blocks from three to four, sending the highest price
signal to the top 20% of irrigation usage.
For the Wholesale class, reduce the existing four block volumetric block structure to two blocks
where the first block represents the customer’s prior year’s average monthly usage or the base
use amount as defined in a wholesale contract and the second block represents water usage by
wholesale customers above the prior year average or the agreed upon base amount. Eliminate
the distinction between inside city limit (ICL) and outside city limit (OCL) wholesale rates and
develop one wholesale water rate structure that fully recovers the estimated cost of providing
wholesale water service to existing wholesale customers.
Eliminate the seasonal rate structure. At the time that the seasonal structure was implemented
by SAWS, the Edwards Aquifer Authority (EAA) controlled water permits on a quarterly basis.
Currently, the EAA controls water permits on an annual basis. As a result, seasonal rates have
lost much of their effectiveness. Additionally, because weather patterns do not consistently
follow seasonal trends, there can be quite a bit of revenue volatility for SAWS during the
seasonal rate time period.
Apply consistent block differentials to both water delivery and the water supply rates within
each rate class.
Consider the following combined water delivery and water supply rate schedules for FY 2015
for ICL customers (Tables 2 through 5). Separate water delivery and water supply ICL rate
schedules as well as OCL rate schedules are included in Appendix C of this report. Note that the
range of volumetric rates presented in the existing rate schedules for some classes represent
standard and seasonal rates. As part of this analysis, the recommendation is to eliminate the
seasonal rate structure.

San Antonio Water System | COMPREHENSIVE COST OF SERVICE AND RATE DESIGN ANALYSIS
BLACK & VEATCH | Executive Summary 12
Table 2 Proposed FY 2015 Water Rates – Residential (ICL)
Table 3 Proposed FY 2015 Water Rates – General (ICL)
**General class includes Commercial, Multi-family, Industrial, and Municipal customers
Availability Charge (meter size)*
5/8"
3/4"
1"
1 1/2"
2"
3"
4"
6"
8"
10"
12"
Threshold (gal) (per 100 gal) Threshold (gal) (per 100 gal)
Combined Water Volumetric Rate
Block 1 5,985 $0.2291 2,992 $0.1379
Block 2 12,717 $0.3315 - $0.3442 4,489 $0.2413
Block 3 17,205 $0.4675 - $0.4977 5,985 $0.3103
Block 4 Above $0.8185 - $0.9469 7,481 $0.3792
Block 5 10,473 $0.4482
Block 6 14,962 $0.5171
Block 7 20,199 $0.6206
Block 8 Above $0.8964
* Proposed Residential Availability Charge will be reduced by $1.95 if usage does not exceed 2,992 gallons.
$701.52 $725.18
$1,310.24 $1,352.74
$305.86 $317.27
$488.47 $505.54
$92.80 $97.63
$153.67 $160.38
$31.94 $34.88
$50.18 $53.69
$10.63 $12.91
$16.72 $19.19
(per bill) (per bill)
$7.57 $9.76
Description
Residential ICL
Existing Proposed FY 2015
Existing Proposed FY 2015
Availability Charge (meter size) (per bill) (per bill)
5/8" $10.53 $10.54
3/4" $15.05 $15.06
1" $24.08 $24.08
1 1/2" $46.65 $46.62
2" $73.74 $73.63
3" $136.96 $136.73
4" $227.28 $226.84
6" $453.06 $452.12
8" $723.99 $722.49
10" $1,040.08 $1,037.89
12" $1,943.21 $1,939.07
(per 100 gal) (per 100 gal)
Combined Water Volumetric Rate
Base $0.3194 $0.2918
101% - 125% of Base $0.3433 $0.3356
126% - 175% of Base $0.4018 $0.4377
176% of Base and Above $0.4967 $0.5107
Description
General ICL**
San Antonio Water System | COMPREHENSIVE COST OF SERVICE AND RATE DESIGN ANALYSIS
BLACK & VEATCH | Executive Summary 13
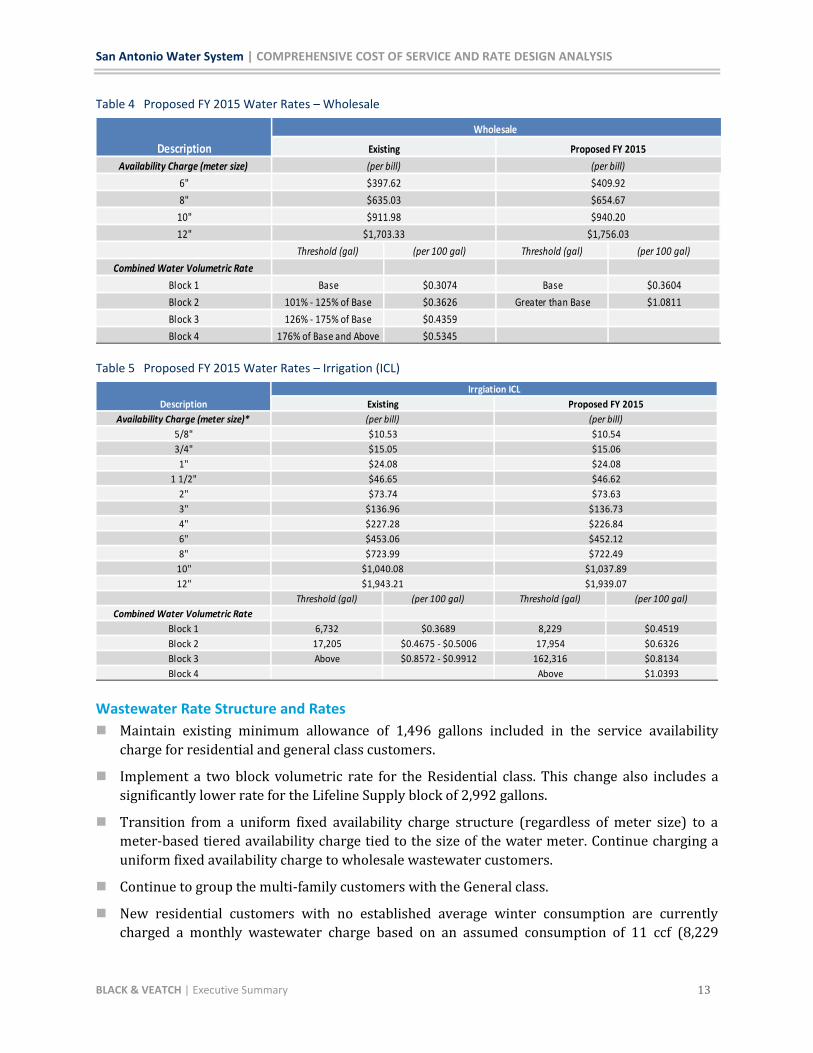
Table 4 Proposed FY 2015 Water Rates – Wholesale
Table 5 Proposed FY 2015 Water Rates – Irrigation (ICL)
Wastewater Rate Structure and Rates
Maintain existing minimum allowance of 1,496 gallons included in the service availability
charge for residential and general class customers.
Implement a two block volumetric rate for the Residential class. This change also includes a
significantly lower rate for the Lifeline Supply block of 2,992 gallons.
Transition from a uniform fixed availability charge structure (regardless of meter size) to a
meter-based tiered availability charge tied to the size of the water meter. Continue charging a
uniform fixed availability charge to wholesale wastewater customers.
Continue to group the multi-family customers with the General class.
New residential customers with no established average winter consumption are currently
charged a monthly wastewater charge based on an assumed consumption of 11 ccf (8,229
Availability Charge (meter size)
6"
8"
10"
12"
Threshold (gal) (per 100 gal) Threshold (gal) (per 100 gal)
Combined Water Volumetric Rate
Block 1 Base $0.3074 Base $0.3604
Block 2 101% - 125% of Base $0.3626 Greater than Base $1.0811
Block 3 126% - 175% of Base $0.4359
Block 4 176% of Base and Above $0.5345
$397.62
$635.03
$911.98
$1,703.33
Wholesale
(per bill)
$409.92
$654.67
$940.20
$1,756.03
Description Existing Proposed FY 2015
(per bill)
Availability Charge (meter size)*
5/8"
3/4"
1"
1 1/2"
2"
3"
4"
6"
8"
10"
12"
Threshold (gal) (per 100 gal) Threshold (gal) (per 100 gal)
Combined Water Volumetric Rate
Block 1 6,732 $0.3689 8,229 $0.4519
Block 2 17,205 $0.4675 - $0.5006 17,954 $0.6326
Block 3 Above $0.8572 - $0.9912 162,316 $0.8134
Block 4 Above $1.0393
$1,943.21 $1,939.07
$136.96 $136.73
$227.28 $226.84
$453.06 $452.12
$723.99 $722.49
$1,040.08 $1,037.89
$10.53 $10.54
$15.05 $15.06
$24.08 $24.08
$46.65 $46.62
$73.74 $73.63
Description
Irrgiation ICL
Existing Proposed FY 2015
(per bill) (per bill)
San Antonio Water System | COMPREHENSIVE COST OF SERVICE AND RATE DESIGN ANALYSIS
BLACK & VEATCH | Executive Summary 14
gallons). After 3 months, the customer is charged the lesser of actual average water usage or the
unaveraged rate. Consider reducing the unaveraged rate by 1 ccf (748 gallons) each year for the
next 3 years in order to bring the unaveraged rate more closely in line with the system-wide
Average Winter Consumption.
Eliminate the distinction between ICL and OCL wholesale rates and develop one wholesale
wastewater rate structure that fully recovers the estimated cost of providing wastewater
service to wholesale customers.
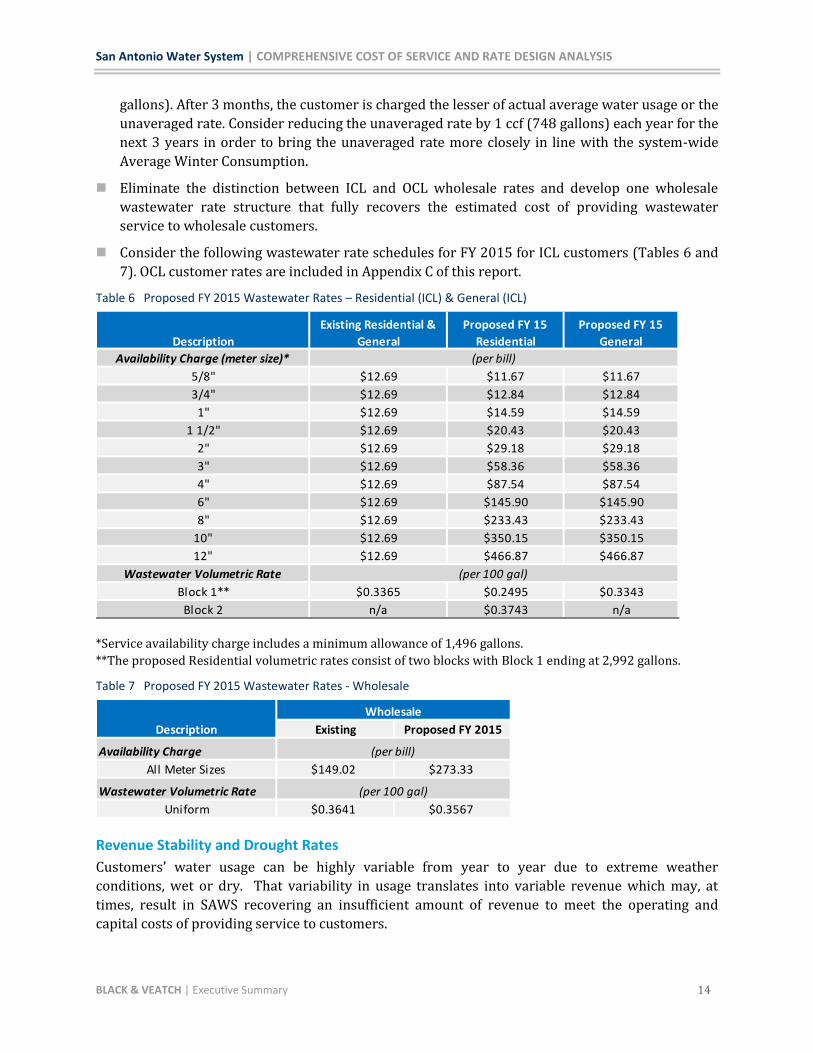
Consider the following wastewater rate schedules for FY 2015 for ICL customers (Tables 6 and
7). OCL customer rates are included in Appendix C of this report.
Table 6 Proposed FY 2015 Wastewater Rates – Residential (ICL) & General (ICL)
*Service availability charge includes a minimum allowance of 1,496 gallons.
**The proposed Residential volumetric rates consist of two blocks with Block 1 ending at 2,992 gallons.
Table 7 Proposed FY 2015 Wastewater Rates - Wholesale
Revenue Stability and Drought Rates
Customers’ water usage can be highly variable from year to year due to extreme weather
conditions, wet or dry. That variability in usage translates into variable revenue which may, at
times, result in SAWS recovering an insufficient amount of revenue to meet the operating and
capital costs of providing service to customers.
Availability Charge (meter size)*
5/8" $12.69 $11.67 $11.67
3/4" $12.69 $12.84 $12.84
1" $12.69 $14.59 $14.59
1 1/2" $12.69 $20.43 $20.43
2" $12.69 $29.18 $29.18
3" $12.69 $58.36 $58.36
4" $12.69 $87.54 $87.54
6" $12.69 $145.90 $145.90
8" $12.69 $233.43 $233.43
10" $12.69 $350.15 $350.15
12" $12.69 $466.87 $466.87
Wastewater Volumetric Rate
Block 1** $0.3365 $0.2495 $0.3343
Block 2 n/a $0.3743 n/a
Description
Existing Residential &
General
Proposed FY 15
Residential
Proposed FY 15
General
(per bill)
(per 100 gal)
Existing Proposed FY 2015
Availability Charge
All Meter Sizes $149.02 $273.33
Wastewater Volumetric Rate
Uniform $0.3641 $0.3567
(per 100 gal)
Description
Wholesale
(per bill)
San Antonio Water System | COMPREHENSIVE COST OF SERVICE AND RATE DESIGN ANALYSIS
BLACK & VEATCH | Executive Summary 15
Develop a revenue stability strategy to address revenue volatility associated with extreme
weather conditions. This strategy might include:
Reducing the projected amount of water sales when developing budgets and
determining the need for rate adjustments.
Automatically adjusting rates during periods when significant drought restrictions
are in effect in order to further incentivize lower water usage as well as offset
revenue losses from a significant reduction in customer usage. A drought rate
analysis is not contained within this report.
Recycled Water
Continue with the same Recycled Water structure until a more detailed analysis can be
conducted with input from a recycled water users group. This analysis will need to take into
account the price of recycled water compared to the price of potable water as well as any
additional costs incurred by customers to utilize recycled water instead of potable water.
Increase recycled water rates annually based on weighted average potable water rate
adjustments. Current estimate for 2016 is approximately 6 percent.
District Special Project
The District Special Project (DSP) was created upon the dissolution of Bexar Metropolitan Water
District (BexarMet). By state law, SAWS and DSP are required to be fully integrated by 2017 unless
an extension of time is requested from the Texas Commission on Environmental Quality. Full
integration includes the application of the same rate schedules to both SAWS and DSP customers.
Based on current projections, more revenue would be generated if SAWS projected water rates for
residential and irrigation customers are applied to DSP customers in 2017. However, less revenue
would be generated if SAWS projected general class rates are applied to DSP commercial
customers. SAWS management believes that any net shortfall in revenue as a result of converting
DSP customers to SAWS rates in 2017 will have been fully mitigated by cost savings that have
benefited SAWS customers as a result of the operational integration of SAWS and DSP. Therefore,
SAWS expects to achieve rate consolidation between SAWS and DSP no later than January 2017.
Fire Line Charges
The cost of service analysis indicates that existing fire line (dedicated fire protection) charges
are not sufficient to recover allocated costs to provide that service. As charges have not
increased since 1994, these charges should be increased in connection with any potential rate
adjustments. Based on the projected 2016 cost to provide fire line service, this increase is
currently estimated to be 8.6%.
Sewer Surcharges
The cost of service analysis indicates that existing sewer surcharge rates are not sufficient to
recover costs incurred by SAWS from higher than average strength of customers’ effluent. As
sewer surcharge rates have not increased since 2003, these rates should be increased in
connection with any potential rate adjustments. Based on the projected 2016 cost associated
with high strength effluent, this increase is currently estimated to be 11.7%.
San Antonio Water System | COMPREHENSIVE COST OF SERVICE AND RATE DESIGN ANALYSIS
BLACK & VEATCH | Executive Summary 16
Affordability Program
Although addressed earlier in this section, the development of a Lifeline Supply rate for both
water and wastewater will both provide rate relief for usage deemed necessary to sustain life
and incentivize very efficient water usage.
Other program modifications should be considered as follows:
Expand outreach to increase participation
Simplify process for qualifying participants
Update data on existing participants in a timely manner
Possible expansion of direct emergency assistance provided through Project Agua
Timely identification and repair of leaks resulting in high bills for qualifying
customers
Irrigation System Non-Compliance
City code requires that certain large irrigation customers conduct annual inspection of their
irrigation systems. A large percentage of these customers are not in compliance with these
requirements. Customers that comply with the inspection generally see a significant reduction in
water usage due to repairs and modifications made as a result of the inspections.
Assess a fee of $160 when a customer fails to conduct the annual required inspection to recover
the cost of enforcement.
In order to recover the true cost of water estimated to be wasted by inefficient irrigation
systems, assess an additional volumetric rate of $0.0969 per 100 gallons of usage until the
customer complies with the inspection requirement and completes any repairs identified in the
inspection report.
Special Services Fees
Consider implementing cost-based Special Services Fees as presented in the fee analysis section
found in the Appendix B of this report.

San Antonio Water System | COMPREHENSIVE COST OF SERVICE AND RATE DESIGN ANALYSIS
BLACK & VEATCH | Introduction 17
Introduction This Cost of Service study reviews the cost of providing water and wastewater services to SAWS’
customers and provides information concerning the rate structure for the Water Delivery, Water
Supply, Recycled Water and Wastewater portions of SAWS’ business. This study is a recalibration of
SAWS’ existing rate structure to take into account current conditions and priorities and not a
revision of SAWS’ currently existing multi-year financial plan.
BACKGROUND The San Antonio Water System (SAWS) is responsible for providing potable water services to about
386,000 customers and wastewater services to about 427,000 customers within the City of San
Antonio (the City) and portions of the surrounding metropolitan area. SAWS also provides recycled
water to a number of customers around San Antonio for both industrial and landscape irrigation
purposes as a cost efficient, drought proof alternative to potable water. Additionally, SAWS is
responsible for the operation of chilled water plants that support various downtown hotels, the
City’s convention center, the Alamodome, and industrial operations at Port San Antonio. SAWS also
supports the City of San Antonio in efforts to comply with federal permit requirements related to
storm water runoff. SAWS is currently structured around four core businesses: Water Delivery,
Water Supply, Wastewater, and Chilled Water.
Since the last rate study in 2009, SAWS, with the approval of the SAWS Board and San Antonio City
Council, has implemented adjustments to the level of rates in order to ensure financial sufficiency
but has not changed the rate structure resulting from the 2009 study. In accordance with its policy
to perform rate studies approximately once every five years, the SAWS Board of Trustees
authorized a new Comprehensive Cost of Service and Rate Design Study (rate study) to be initiated
in 2014. Best industry practices as endorsed by the American Water Works Association (AWWA)
and Water Environment Federation (WEF) include conducting a comprehensive cost of service
study every three to five years to review cost of service principles and to ensure the rate structures
are meeting the objectives of the utility. AWWA and WEF are the industry organizations tasked
with providing guidance on the operation and management of water and wastewater utilities,
respectively. Both organizations have established general sets of principles used to guide the
development of water and wastewater rates.
SAWS’ rate structures are progressive and complex compared to those assessed by many other
cities. The existing rate structures include the combination of tiered rates, seasonal rates, and
individualized rates which aggressively promote water conservation. This rate study reviewed the
effectiveness of these rate structures and provided information and recommendations regarding
the most appropriate structure for all rates charged by SAWS considering such current issues as
conservation, drought conditions, consumption characteristics of various customer classes, fairness
and equity implications, financial stability, customer affordability, economic development and
policy considerations. This report summarizes the processes and recommendations arising from
this rate study.

San Antonio Water System | COMPREHENSIVE COST OF SERVICE AND RATE DESIGN ANALYSIS
BLACK & VEATCH | Introduction 18
PURPOSE OF STUDY The purpose of this report is to summarize the process undertaken by the RAC and SAWS staff as
assisted by Black & Veatch Corporation (Black & Veatch) as well as to document the RAC’s
recommendations with regard to rate structure.
SCOPE OF WORK SAWS retained Black & Veatch in 2014 to update its cost of service and rate study for its water and
wastewater utilities. Presented herein are the results of a review of both systems’ projected
revenues, revenue requirements, cost of service allocations, and rates for service.
For purposes of this report, Black & Veatch developed a rate model for the six fiscal years 2015
through 2020 which was populated with data from SAWS’ multi-year financial plan. However, this
report focuses on the FY 2015 model outputs and resulting rates. Rates for 2016 and beyond will be
based upon the final rate structure ultimately approved by both SAWS’ Board and City Council as
impacted by SAWS’ regular budgeting and rate setting process. These future rates will also be
impacted by major customer and supply changes due to occur with the consolidation of DSP
customers in 2017 and the Vista Ridge water supply project expected to begin delivery of water in
2019 or 2020.
The water and wastewater systems’ costs of service were allocated to customer classes utilizing a
cost causative approach endorsed by the AWWA M1 rate setting manual (Principles of Water Rates,
Fees and Charges) and WEF rate setting manual MOP 27 (Financing and Charges for Wastewater
Systems). The allocation methodologies produce cost of service allocations recognizing the
projected customer service requirements for SAWS. The design of proposed rates is in accordance
with allocated cost of service and local policy considerations, such as cash flow considerations, debt
coverage requirements and reserve funding levels. It is important to note that AWWA and WEF
observe that there is no prescribed single approach for establishing cost-based rates. Rather,
agencies must exercise judgment to align rates and charges with local conditions and requirements,
as well as applicable state law. Black & Veatch has used the guidelines contained in the AWWA and
WEF documents to conduct the analyses contained herein.
In addition to the water and wastewater analyses, the study scope of work included an analysis of
potential drought rate structures, an update of recycled water rates, an examination of multi-family
customer cost of service elements to determine if this class should be separated from other General
class customers, an analysis of the impact of converting DSP customers to SAWS rates, an update of
Special Services fees and commentary and recommendations related to the current SAWS customer
affordability program. This report documents the findings and recommendations related to each of
these additional study items.
RAC INVOLVEMENT One of the key initiatives was to involve stakeholders, such as the SAWS Rate Advisory Committee
(RAC), in the entire rate study process, in order to obtain stakeholder support and participation in
the rate design process. The RAC consisted of 10 members nominated by members of City Council
and 7 other members, each of whom represented a diverse segment of SAWS’ customer base
depending on his/her background, profession and interests. The participation of the RAC was a key
component of the rate study process and was necessary to ensure proper community

San Antonio Water System | COMPREHENSIVE COST OF SERVICE AND RATE DESIGN ANALYSIS
BLACK & VEATCH | Introduction 19
representation in establishing rate setting objectives and rate structures. Staff held a series of
workshops with the RAC members. Black & Veatch facilitated discussions in several workshops
throughout 2014 and 2015.
RAC members were asked to provide key input in the rate design process. This report documents
the methodology used to perform the cost of service analysis, the analyses and recommendations
developed as part of the rate design process, and the key decisions made by the RAC. The resulting
rate structures, rates, and customer impacts reflect the input received from SAWS Staff,
recommendations made by Black & Veatch, and decisions made by the RAC.
DISCLAIMER In conducting our study, we reviewed the books, records, agreements, capital improvement
programs, customer sales and financial projections of SAWS as we deemed necessary to express our
opinion of the operating results and projections. While we consider such books, records,
documents, and projections to be reliable, Black & Veatch has not verified the accuracy of these
documents.
The projections set forth in this report are intended as “forward-looking statements”. In
formulating these projections, Black & Veatch has made certain assumptions with respect to
conditions, events, and circumstances that may occur in the future. The methodology utilized in
performing the analyses follows generally accepted practices for such projections. Such
assumptions and methodologies are reasonable and appropriate for the purpose for which they are
used. While we believe the assumptions are reasonable and the projection methodology valid,
actual results may differ materially from those projected, as influenced by the conditions, events,
and circumstances that actually occur. Such factors that may affect both utility systems’ abilities to
manage the systems and meet water quality, and/or other regulatory or environmental
requirements include the following: SAWS’ ability to execute the capital improvement program as
scheduled and within budget; regional climate and weather conditions affecting the demand for
water; and adverse legislative, regulatory or legal decisions (including environmental laws and
regulations).
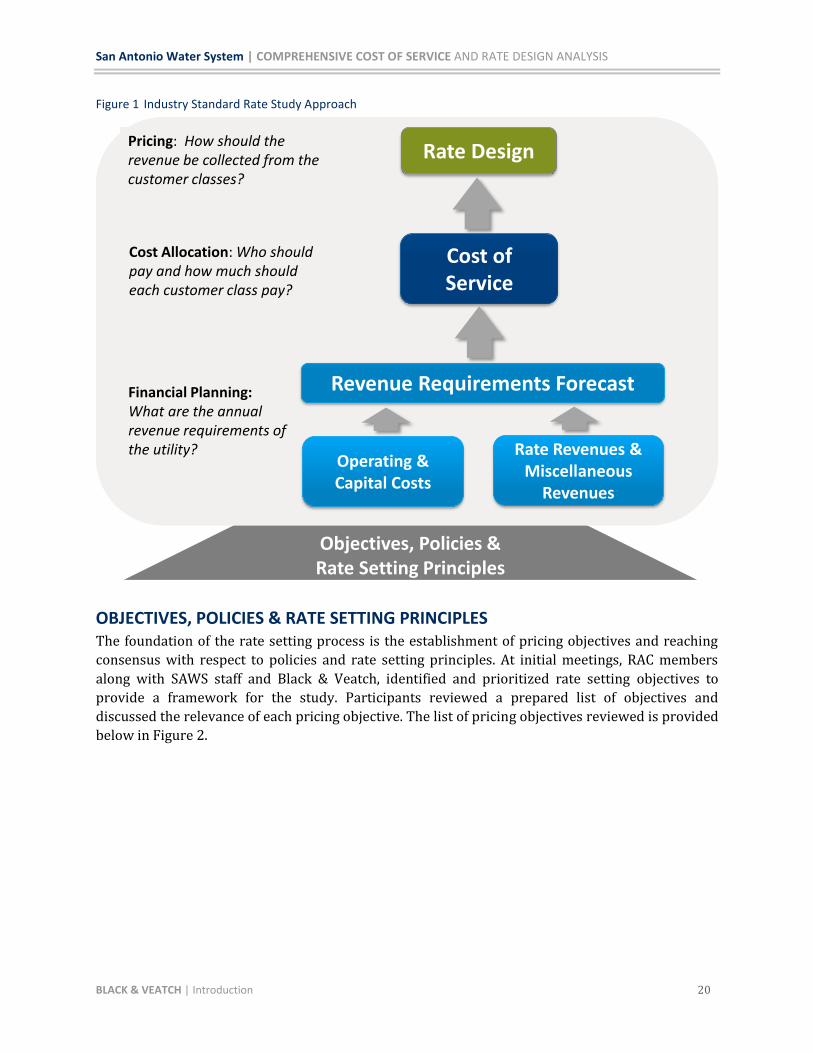
GENERAL RATE STUDY APPROACH The following graphic shows the general process to setting rates in the United States. The three
main elements of the process are Revenue Requirements, Cost of Service, and Rate Design. There
are sub-elements to every rate analysis which we also capture within the picture below. However
the three main elements are consistent to most rate studies and are endorsed by AWWA and WEF
as being included in the industry standard approach. This analysis and report incorporate these
elements and the remainder of this report describes the process in more detail.
San Antonio Water System | COMPREHENSIVE COST OF SERVICE AND RATE DESIGN ANALYSIS
BLACK & VEATCH | Introduction 20
Figure 1 Industry Standard Rate Study Approach
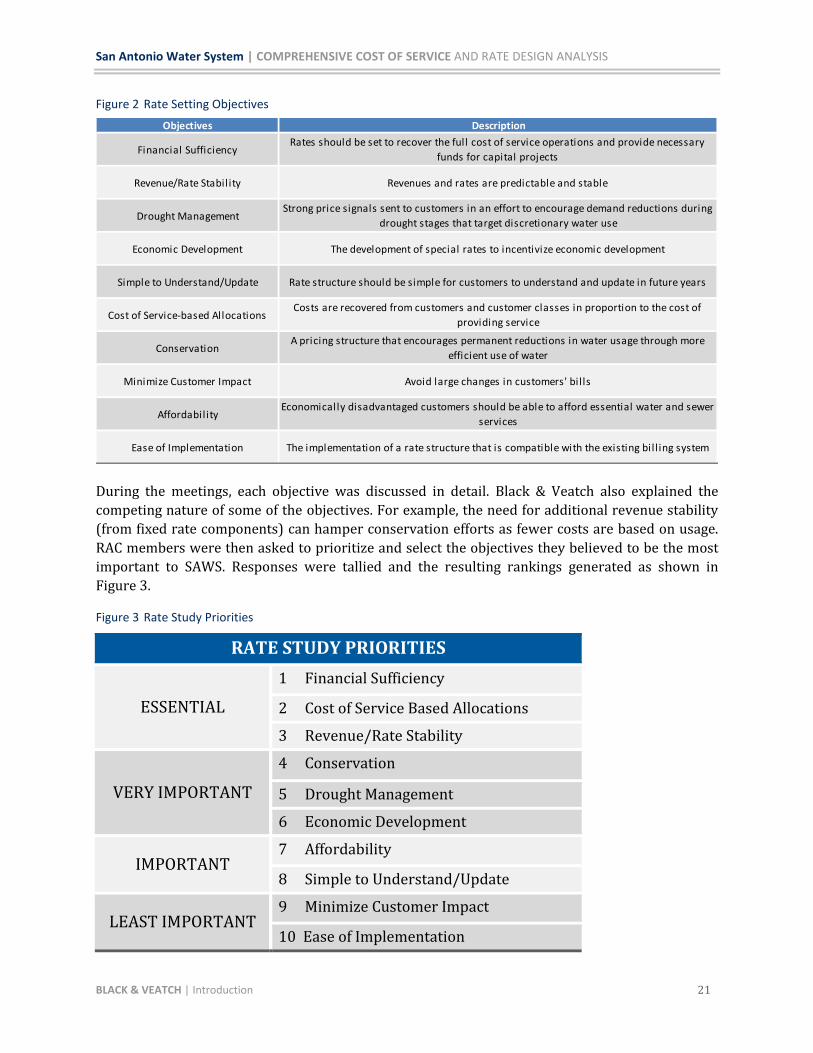
OBJECTIVES, POLICIES & RATE SETTING PRINCIPLES The foundation of the rate setting process is the establishment of pricing objectives and reaching
consensus with respect to policies and rate setting principles. At initial meetings, RAC members
along with SAWS staff and Black & Veatch, identified and prioritized rate setting objectives to
provide a framework for the study. Participants reviewed a prepared list of objectives and
discussed the relevance of each pricing objective. The list of pricing objectives reviewed is provided
below in Figure 2.
Objectives, Policies &Rate Setting Principles
Financial Planning: What are the annual revenue requirements of the utility?
Rate Design
Operating & Capital Costs
Rate Revenues & Miscellaneous
Revenues
Revenue Requirements Forecast
Cost of Service
Pricing: How should the revenue be collected from the customer classes?
Cost Allocation: Who should pay and how much should each customer class pay?
San Antonio Water System | COMPREHENSIVE COST OF SERVICE AND RATE DESIGN ANALYSIS
BLACK & VEATCH | Introduction 21
Figure 2 Rate Setting Objectives
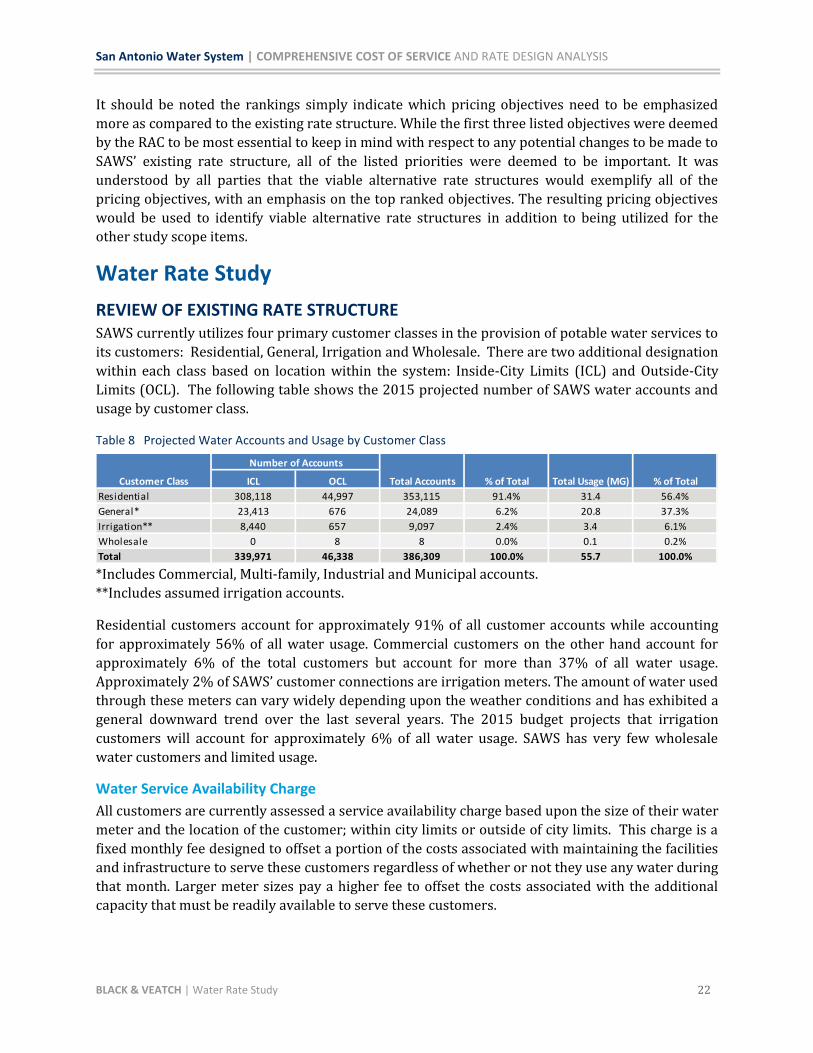
During the meetings, each objective was discussed in detail. Black & Veatch also explained the
competing nature of some of the objectives. For example, the need for additional revenue stability
(from fixed rate components) can hamper conservation efforts as fewer costs are based on usage.
RAC members were then asked to prioritize and select the objectives they believed to be the most
important to SAWS. Responses were tallied and the resulting rankings generated as shown in
Figure 3.
Figure 3 Rate Study Priorities
RATE STUDY PRIORITIES
ESSENTIAL
1 Financial Sufficiency
2 Cost of Service Based Allocations
3 Revenue/Rate Stability
VERY IMPORTANT
4 Conservation
5 Drought Management
6 Economic Development
IMPORTANT 7 Affordability
8 Simple to Understand/Update
LEAST IMPORTANT 9 Minimize Customer Impact
10 Ease of Implementation
Objectives
Financial Sufficiency
Revenue/Rate Stability
Drought Management
Economic Development
Simple to Understand/Update
Cost of Service-based Allocations
Conservation
Minimize Customer Impact
Affordability
Ease of Implementation
Economically disadvantaged customers should be able to afford essential water and sewer
services
The implementation of a rate structure that is compatible with the existing bill ing system
Rates should be set to recover the full cost of service operations and provide necessary
funds for capital projects
Description
Revenues and rates are predictable and stable
Strong price signals sent to customers in an effort to encourage demand reductions during
drought stages that target discretionary water use
The development of special rates to incentivize economic development
Rate structure should be simple for customers to understand and update in future years
Costs are recovered from customers and customer classes in proportion to the cost of
providing service
A pricing structure that encourages permanent reductions in water usage through more
efficient use of water
Avoid large changes in customers' bil ls
San Antonio Water System | COMPREHENSIVE COST OF SERVICE AND RATE DESIGN ANALYSIS
BLACK & VEATCH | Water Rate Study 22
It should be noted the rankings simply indicate which pricing objectives need to be emphasized
more as compared to the existing rate structure. While the first three listed objectives were deemed
by the RAC to be most essential to keep in mind with respect to any potential changes to be made to
SAWS’ existing rate structure, all of the listed priorities were deemed to be important. It was
understood by all parties that the viable alternative rate structures would exemplify all of the
pricing objectives, with an emphasis on the top ranked objectives. The resulting pricing objectives
would be used to identify viable alternative rate structures in addition to being utilized for the
other study scope items.
Water Rate Study
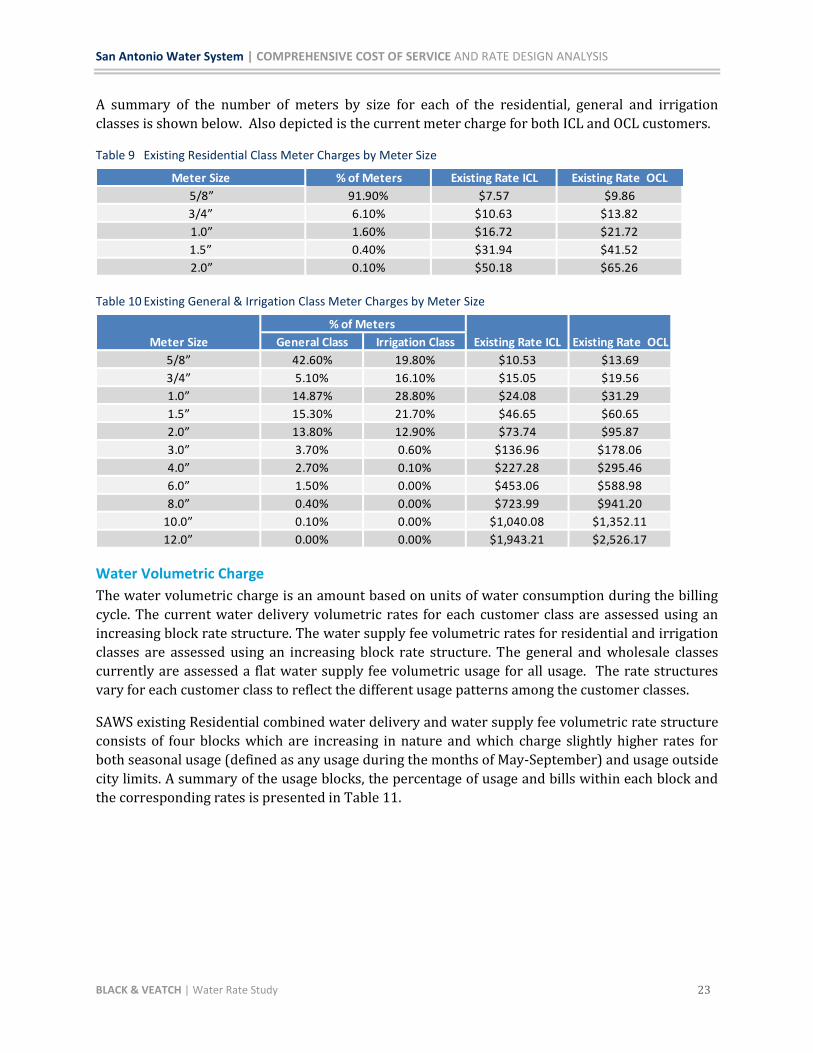
REVIEW OF EXISTING RATE STRUCTURE SAWS currently utilizes four primary customer classes in the provision of potable water services to
its customers: Residential, General, Irrigation and Wholesale. There are two additional designation
within each class based on location within the system: Inside-City Limits (ICL) and Outside-City
Limits (OCL). The following table shows the 2015 projected number of SAWS water accounts and
usage by customer class.
Table 8 Projected Water Accounts and Usage by Customer Class
*Includes Commercial, Multi-family, Industrial and Municipal accounts.
**Includes assumed irrigation accounts.
Residential customers account for approximately 91% of all customer accounts while accounting
for approximately 56% of all water usage. Commercial customers on the other hand account for
approximately 6% of the total customers but account for more than 37% of all water usage.
Approximately 2% of SAWS’ customer connections are irrigation meters. The amount of water used
through these meters can vary widely depending upon the weather conditions and has exhibited a
general downward trend over the last several years. The 2015 budget projects that irrigation
customers will account for approximately 6% of all water usage. SAWS has very few wholesale
water customers and limited usage.
Water Service Availability Charge
All customers are currently assessed a service availability charge based upon the size of their water
meter and the location of the customer; within city limits or outside of city limits. This charge is a
fixed monthly fee designed to offset a portion of the costs associated with maintaining the facilities
and infrastructure to serve these customers regardless of whether or not they use any water during
that month. Larger meter sizes pay a higher fee to offset the costs associated with the additional
capacity that must be readily available to serve these customers.
ICL OCL
Residential 308,118 44,997 353,115 91.4% 31.4 56.4%
General* 23,413 676 24,089 6.2% 20.8 37.3%
Irrigation** 8,440 657 9,097 2.4% 3.4 6.1%
Wholesale 0 8 8 0.0% 0.1 0.2%
Total 339,971 46,338 386,309 100.0% 55.7 100.0%
Customer Class
Number of Accounts
Total Accounts % of Total Total Usage (MG) % of Total
San Antonio Water System | COMPREHENSIVE COST OF SERVICE AND RATE DESIGN ANALYSIS
BLACK & VEATCH | Water Rate Study 23
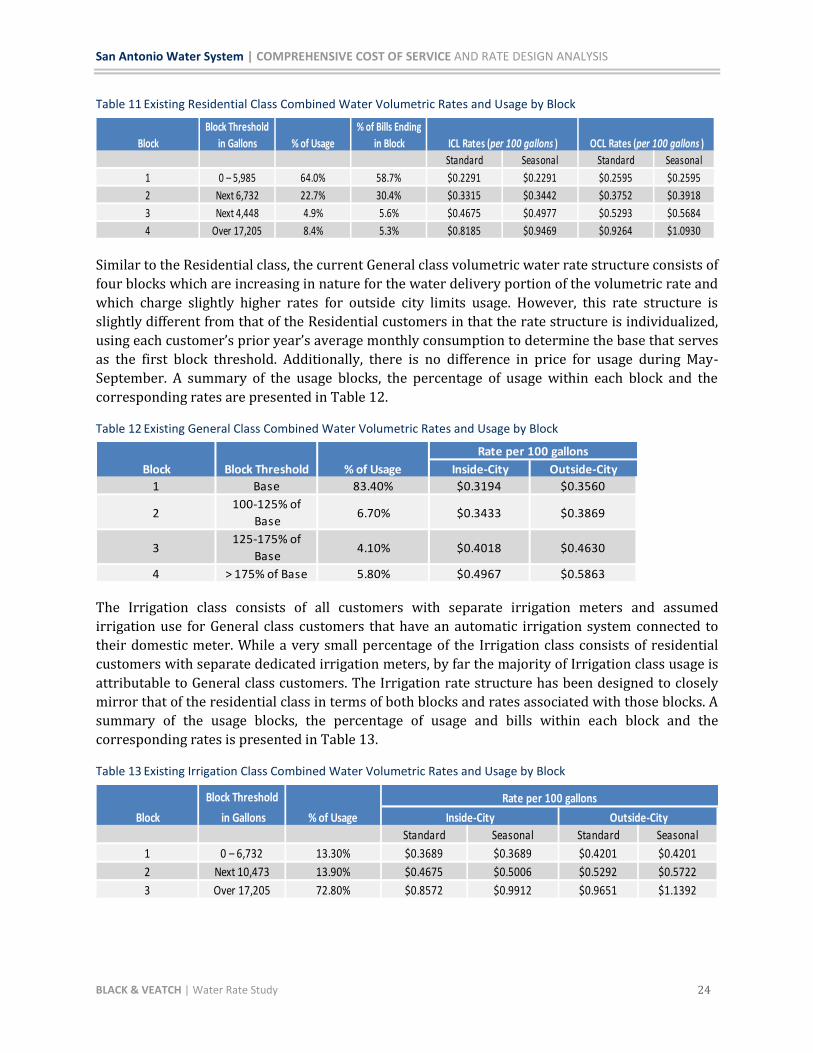
A summary of the number of meters by size for each of the residential, general and irrigation
classes is shown below. Also depicted is the current meter charge for both ICL and OCL customers.
Table 9 Existing Residential Class Meter Charges by Meter Size
Table 10 Existing General & Irrigation Class Meter Charges by Meter Size
Water Volumetric Charge
The water volumetric charge is an amount based on units of water consumption during the billing
cycle. The current water delivery volumetric rates for each customer class are assessed using an
increasing block rate structure. The water supply fee volumetric rates for residential and irrigation
classes are assessed using an increasing block rate structure. The general and wholesale classes
currently are assessed a flat water supply fee volumetric usage for all usage. The rate structures
vary for each customer class to reflect the different usage patterns among the customer classes.
SAWS existing Residential combined water delivery and water supply fee volumetric rate structure
consists of four blocks which are increasing in nature and which charge slightly higher rates for
both seasonal usage (defined as any usage during the months of May-September) and usage outside
city limits. A summary of the usage blocks, the percentage of usage and bills within each block and
the corresponding rates is presented in Table 11.
Meter Size % of Meters Existing Rate ICL Existing Rate OCL
5/8” 91.90% $7.57 $9.86
3/4” 6.10% $10.63 $13.82
1.0” 1.60% $16.72 $21.72
1.5” 0.40% $31.94 $41.52
2.0” 0.10% $50.18 $65.26
General Class Irrigation Class
5/8” 42.60% 19.80% $10.53 $13.69
3/4” 5.10% 16.10% $15.05 $19.56
1.0” 14.87% 28.80% $24.08 $31.29
1.5” 15.30% 21.70% $46.65 $60.65
2.0” 13.80% 12.90% $73.74 $95.87
3.0” 3.70% 0.60% $136.96 $178.06
4.0” 2.70% 0.10% $227.28 $295.46
6.0” 1.50% 0.00% $453.06 $588.98
8.0” 0.40% 0.00% $723.99 $941.20
10.0” 0.10% 0.00% $1,040.08 $1,352.11
12.0” 0.00% 0.00% $1,943.21 $2,526.17
Meter Size
% of Meters
Existing Rate ICL Existing Rate OCL
San Antonio Water System | COMPREHENSIVE COST OF SERVICE AND RATE DESIGN ANALYSIS
BLACK & VEATCH | Water Rate Study 24
Table 11 Existing Residential Class Combined Water Volumetric Rates and Usage by Block
Similar to the Residential class, the current General class volumetric water rate structure consists of
four blocks which are increasing in nature for the water delivery portion of the volumetric rate and
which charge slightly higher rates for outside city limits usage. However, this rate structure is
slightly different from that of the Residential customers in that the rate structure is individualized,
using each customer’s prior year’s average monthly consumption to determine the base that serves
as the first block threshold. Additionally, there is no difference in price for usage during May-
September. A summary of the usage blocks, the percentage of usage within each block and the
corresponding rates are presented in Table 12.
Table 12 Existing General Class Combined Water Volumetric Rates and Usage by Block
The Irrigation class consists of all customers with separate irrigation meters and assumed
irrigation use for General class customers that have an automatic irrigation system connected to
their domestic meter. While a very small percentage of the Irrigation class consists of residential
customers with separate dedicated irrigation meters, by far the majority of Irrigation class usage is
attributable to General class customers. The Irrigation rate structure has been designed to closely
mirror that of the residential class in terms of both blocks and rates associated with those blocks. A
summary of the usage blocks, the percentage of usage and bills within each block and the
corresponding rates is presented in Table 13.
Table 13 Existing Irrigation Class Combined Water Volumetric Rates and Usage by Block
Block
Block Threshold
in Gallons % of Usage
% of Bills Ending
in Block
Standard Seasonal Standard Seasonal
1 0 – 5,985 64.0% 58.7% $0.2291 $0.2291 $0.2595 $0.2595
2 Next 6,732 22.7% 30.4% $0.3315 $0.3442 $0.3752 $0.3918
3 Next 4,448 4.9% 5.6% $0.4675 $0.4977 $0.5293 $0.5684
4 Over 17,205 8.4% 5.3% $0.8185 $0.9469 $0.9264 $1.0930
OCL Rates (per 100 gallons )ICL Rates (per 100 gallons )
Block Block Threshold % of Usage Inside-City Outside-City
1 Base 83.40% $0.3194 $0.3560
2100-125% of
Base6.70% $0.3433 $0.3869
3125-175% of
Base4.10% $0.4018 $0.4630
4 > 175% of Base 5.80% $0.4967 $0.5863
Rate per 100 gallons
Block Threshold
Block in Gallons % of Usage
Standard Seasonal Standard Seasonal
1 0 – 6,732 13.30% $0.3689 $0.3689 $0.4201 $0.4201
2 Next 10,473 13.90% $0.4675 $0.5006 $0.5292 $0.5722
3 Over 17,205 72.80% $0.8572 $0.9912 $0.9651 $1.1392
Rate per 100 gallons
Inside-City Outside-City

San Antonio Water System | COMPREHENSIVE COST OF SERVICE AND RATE DESIGN ANALYSIS
BLACK & VEATCH | Water Rate Study 25
REVENUE AND REVENUE REQUIREMENTS The first major element in the rate setting process is the identification of revenue requirements.
Revenue requirements include all operations and maintenance (O&M), capital financing, debt
service, reserve funding, and financial coverage ratio requirements necessary for SAWS to operate
each utility system. Revenue requirements not only represent the cash-needs of each utility but also
the liquidity and debt coverage requirements. SAWS staff develop comprehensive models that
identify revenue requirements on an annual basis. SAWS accounts for O&M costs by cost centers
and then allocates the costs to the four core businesses of SAWS. The water related core businesses
are Water Supply and Water Delivery.
These financial plans were incorporated into the cost of service and rate design models. The figure
below outlines the financial planning process for each utility system. The remaining section
describes the revenue requirements analysis conducted by SAWS and Black & Veatch.
Figure 4 Financial Plan Review
With revenue derived from the various sources, SAWS funds the requirements of: operation and
maintenance (O&M); recurring annual capital expenditures for replacements, system betterments,
and extensions; debt service on outstanding bonds and reserve levels. O&M expenses are those
expenditures necessary to maintain the system in good working order. Capital expenditures consist
of recurring routine annual replacements as well as major capital projects to expand the system.
Currently, SAWS uses a combination of cash and debt to finance all capital improvements.
Total Revenue Requirements
Review of Financial Plan
MiscellaneousRevenue
Revenue Under Existing Rates
Operation and Maintenance Expense
Capital Expenditures
Debt Service
Financial Objectives, Policies, & Requirements
Bond Covenant Requirements
San Antonio Water System | COMPREHENSIVE COST OF SERVICE AND RATE DESIGN ANALYSIS
BLACK & VEATCH | Water Rate Study 26
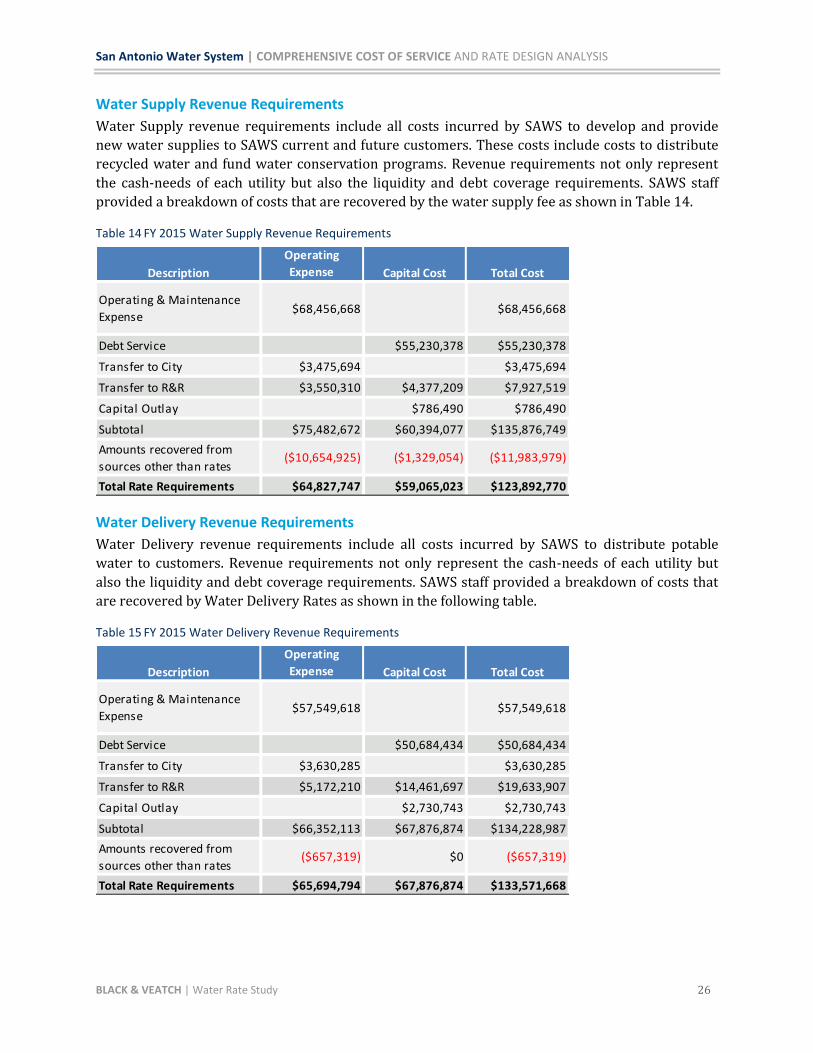
Water Supply Revenue Requirements
Water Supply revenue requirements include all costs incurred by SAWS to develop and provide
new water supplies to SAWS current and future customers. These costs include costs to distribute
recycled water and fund water conservation programs. Revenue requirements not only represent
the cash-needs of each utility but also the liquidity and debt coverage requirements. SAWS staff
provided a breakdown of costs that are recovered by the water supply fee as shown in Table 14.
Table 14 FY 2015 Water Supply Revenue Requirements
Water Delivery Revenue Requirements
Water Delivery revenue requirements include all costs incurred by SAWS to distribute potable
water to customers. Revenue requirements not only represent the cash-needs of each utility but
also the liquidity and debt coverage requirements. SAWS staff provided a breakdown of costs that
are recovered by Water Delivery Rates as shown in the following table.
Table 15 FY 2015 Water Delivery Revenue Requirements
Description
Operating
Expense Capital Cost Total Cost
Operating & Maintenance
Expense$68,456,668 $68,456,668
Debt Service $55,230,378 $55,230,378
Transfer to City $3,475,694 $3,475,694
Transfer to R&R $3,550,310 $4,377,209 $7,927,519
Capital Outlay $786,490 $786,490
Subtotal $75,482,672 $60,394,077 $135,876,749
Amounts recovered from
sources other than rates($10,654,925) ($1,329,054) ($11,983,979)
Total Rate Requirements $64,827,747 $59,065,023 $123,892,770
Description
Operating
Expense Capital Cost Total Cost
Operating & Maintenance
Expense$57,549,618 $57,549,618
Debt Service $50,684,434 $50,684,434
Transfer to City $3,630,285 $3,630,285
Transfer to R&R $5,172,210 $14,461,697 $19,633,907
Capital Outlay $2,730,743 $2,730,743
Subtotal $66,352,113 $67,876,874 $134,228,987
Amounts recovered from
sources other than rates($657,319) $0 ($657,319)
Total Rate Requirements $65,694,794 $67,876,874 $133,571,668
San Antonio Water System | COMPREHENSIVE COST OF SERVICE AND RATE DESIGN ANALYSIS
BLACK & VEATCH | Water Rate Study 27
WATER COST OF SERVICE ALLOCATION The cost of service analysis is based on a detailed cost allocation and rate model developed
specifically for SAWS. This analysis used the cost of service methodology recommended in the
AWWA M-1 Rate Manual to develop cost of service based rates. One of the essential objectives of
this cost of service analysis was to ensure that the water utility achieved revenue neutrality.
Through the adjustments presented in this section, that objective has been met. However, during
the cost of service analysis it was determined that some customer classes were over-recovering
their allocated costs based on existing 2015 rates while other classes were under-recovering. This
cost of service analysis re-aligns costs to their appropriate customer classes and helps ensure that
rates charged to each customer class appropriately recover each class’ proportionate share of costs.
The M-1 Rate Manual specifies that a test year be established using revenue requirements, or the
total cost of operating the system in that year. In analyzing the water system’s cost of service for
allocation to customer classes, the annual revenue requirements for FY 2015 was selected as the
Test Year (TY) requirements to demonstrate the development of cost of service-based water rates.
In determining the costs of service met by charges for water service, the first step is to calculate
total revenue requirements less income received from other sources that are not subject to rate
adjustments to yield the total cost of service to be recovered from rates. After that analysis is done,
the allocation process is the next step. The FY 2015 costs to be recovered from rates, as
summarized in Tables 14 and 15, are approximately $256 million (Water Supply and Water
Delivery combined).
Functional Cost Components
In developing an equitable rate structure, this analysis allocates water revenue requirements to the
various customer classifications according to the cost of service rendered. Allocations of these
requirements to customer classes should take into account water flow, the number of customers,
and other relevant factors. Customer classification occurs to reflect groups of customers with
similar service requirements for whom a utility can serve at a similar cost. Each class represents a
particular type of service requirement. For the purposes of the cost of service analysis, the
customer classifications in this study include single-family Residential; General, which includes
commercial, multi-family, industrial, and municipal customers; Irrigation; Wholesale; Recycled
Water; and Fire Line (fire protection) classes.
Figure 5 illustrates the generally-accepted process for allocating costs of service to customer
classes. The cost-of-service methodology first allocates costs to functional cost components, then to
cost categories, and subsequently distributes the costs to customer classes. For this analysis, there
are five primary cost categories: (1) base flow, or volume costs, (2) maximum day costs, (3)
maximum hour costs, (4) customer (meters and billing) costs, and (5) fire protection costs.

San Antonio Water System | COMPREHENSIVE COST OF SERVICE AND RATE DESIGN ANALYSIS
BLACK & VEATCH | Water Rate Study 28
Figure 5 General Cost of Service Allocation Methodology
* Customer classes in figure do not represent SAWS’ classes. This figure is solely intended to give a general
description of the allocation process.
Allocation to Cost Components
In this report, Black & Veatch analyzes the cost of providing water service by system function in
order to properly allocate the costs to the various classes of customers and subsequently design
rates. Figure 6 illustrates the framework of the allocation of revenue requirements to functional
cost components. As a basis for allocating costs of service among customer classes, we have
separated costs into the following four basic functional cost components: (1) “Base”; (2) “Extra
Capacity”; (3) “Customer”; and (4) “Direct Assignment.” In order to provide service to its customers
at all times, SAWS must be capable of not only providing the total amount of water used, but also
meet peak or maximum rates of demand.
Base costs include the purchase of water, regulatory fees, debt service costs, water treatment,
energy, administration, and operating and maintenance costs of the water system associated with
service to customers to the extent required for a constant, or average annual rate of use.
Extra Capacity costs represent those operating costs incurred in meeting demands in excess of
average, and capital related costs for additional plant and system capacity beyond that required
for the average rate of use.
Customer costs are those elements that tend to vary in proportion to the number of customers
connected to the system. These include meter reading, billing, collecting and accounting, and
maintenance and capital costs associated with meters and services.
Distribute Costs to Customer Classes
Residential Non-Residential Irrigation Private Fire
Separate O&M and Capital Costs into Cost Causative Parameters
Average Day
(Base Costs)
Max Day
(Extra Capacity)
Max Hour
(Extra Capacity)
Billing
(Customer Costs)
Fire
(Direct Costs)
Allocate O&M and Capital Costs to Functional Cost Components
Source of Supply Pump Stations TreatmentTransmission &
DistributionFire Protection
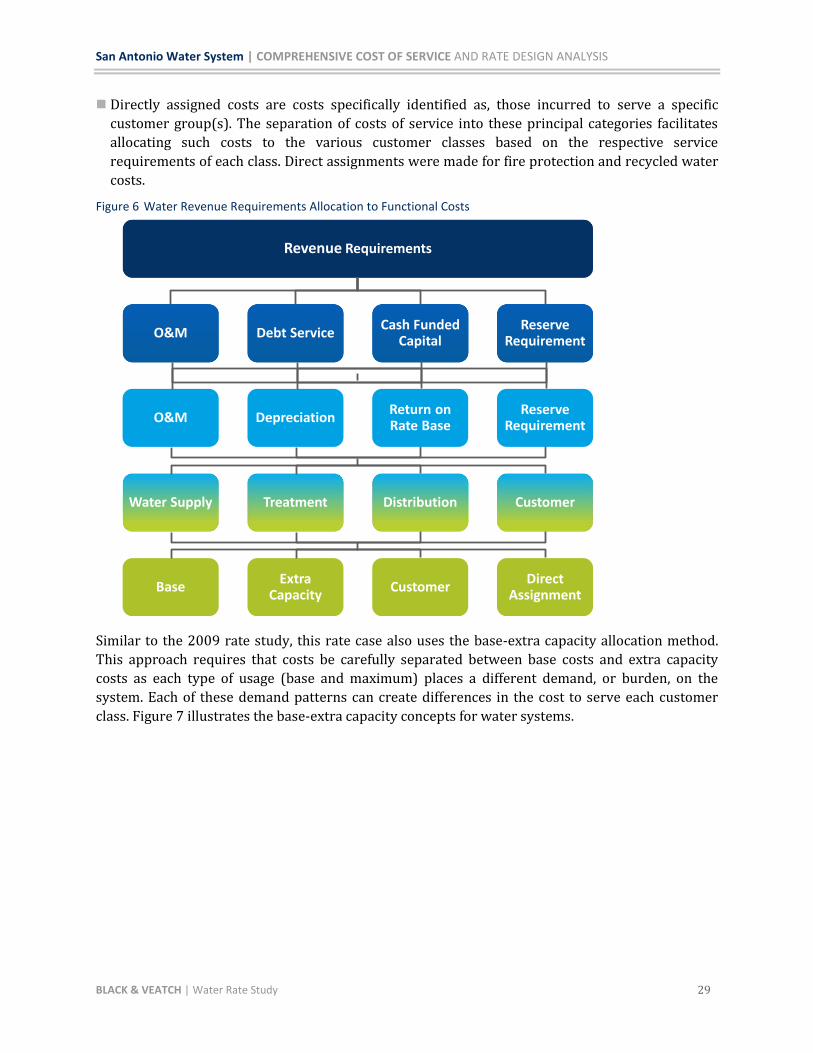
San Antonio Water System | COMPREHENSIVE COST OF SERVICE AND RATE DESIGN ANALYSIS
BLACK & VEATCH | Water Rate Study 29
Directly assigned costs are costs specifically identified as, those incurred to serve a specific
customer group(s). The separation of costs of service into these principal categories facilitates
allocating such costs to the various customer classes based on the respective service
requirements of each class. Direct assignments were made for fire protection and recycled water
costs.
Figure 6 Water Revenue Requirements Allocation to Functional Costs
Similar to the 2009 rate study, this rate case also uses the base-extra capacity allocation method.
This approach requires that costs be carefully separated between base costs and extra capacity
costs as each type of usage (base and maximum) places a different demand, or burden, on the
system. Each of these demand patterns can create differences in the cost to serve each customer
class. Figure 7 illustrates the base-extra capacity concepts for water systems.
Revenue Requirements
O&M Debt ServiceCash Funded
CapitalReserve
Requirement
O&M DepreciationReturn on Rate Base
ReserveRequirement
Water Supply
Base
Treatment
Extra Capacity
Distribution
Customer
Customer
Direct Assignment

San Antonio Water System | COMPREHENSIVE COST OF SERVICE AND RATE DESIGN ANALYSIS
BLACK & VEATCH | Water Rate Study 30
Figure 7 Water Cost of Service Concept
Black & Veatch has allocated each element of
cost to functional cost components using the
parameter or parameters having the most
significant influence on the magnitude of that
element of cost. We allocate O&M and general
and administrative (G&A) expense items directly
to appropriate cost components, while the
allocation of capital and replacement costs uses
a detailed allocation of related capital
investment. The separation of costs into
functional components provides a means for
distributing such costs to the various classes of
customers based on their respective
responsibilities for each particular type of service.
For volume-related cost allocations, the first step in determining the allocation percentages is to
assign system peaking factors. To determine peaking factors, Black & Veatch reviewed water
system planning and design documents and conducted a bill tabulation analysis to identify average
daily consumption versus maximum consumption, both in daily and hourly terms. This process is
repeated for each customer class as well.
For Water Supply, the Base element is equal to the average daily demand (ADD) and assigned a
value of 1.0. Water Supply maximum day (Max Day) demand is estimated to be 1.80 times the ADD.
Thus, the Max Day is assigned a value of 1.80. The maximum instantaneous usage is approximated
by the maximum hourly (Max Hour) usage and is estimated to be 2.50 times the ADD. Thus, Max
Hour is assigned a value of 2.50.
For Water Delivery, the Base element is assigned a value of 1.0. Maximum day (Max Day) demand is
estimated to be 1.90 times the ADD and the maximum hourly (Max Hour) usage is estimated to be
2.50 times the ADD. Water Supply and Water Delivery peaking factors are based on a combination
of historic billing data and discussions with SAWS staff.
Fire Protection
A direct cost to the water system is fire protection. Fire protection consists of those costs associated
with having the capability to provide public (municipal fire hydrants) and private (individual fire
sprinklers) fire suppression services. While a small amount of water is actually consumed for fire
suppression and fire training, the water system is still designed to accommodate relatively large
flows of water for short durations at suitable pressure. Therefore, when allocating O&M and capital
expenses to the basic functional costs factors, a pro rata share of O&M and capital expenses is
directly assigned to the fire protection category.
Allocation of Revenue Requirements
Tables 16 through 19 summarize the allocation percentages used in the cost of service analysis for
both operation and maintenance expenses and capital expenses. This is done for both Water Supply
and Water Delivery business units. Table 16 is showing the amount of demand each customer class
Max Hour
Capacity
Max Day Capacity
Base
Water Main
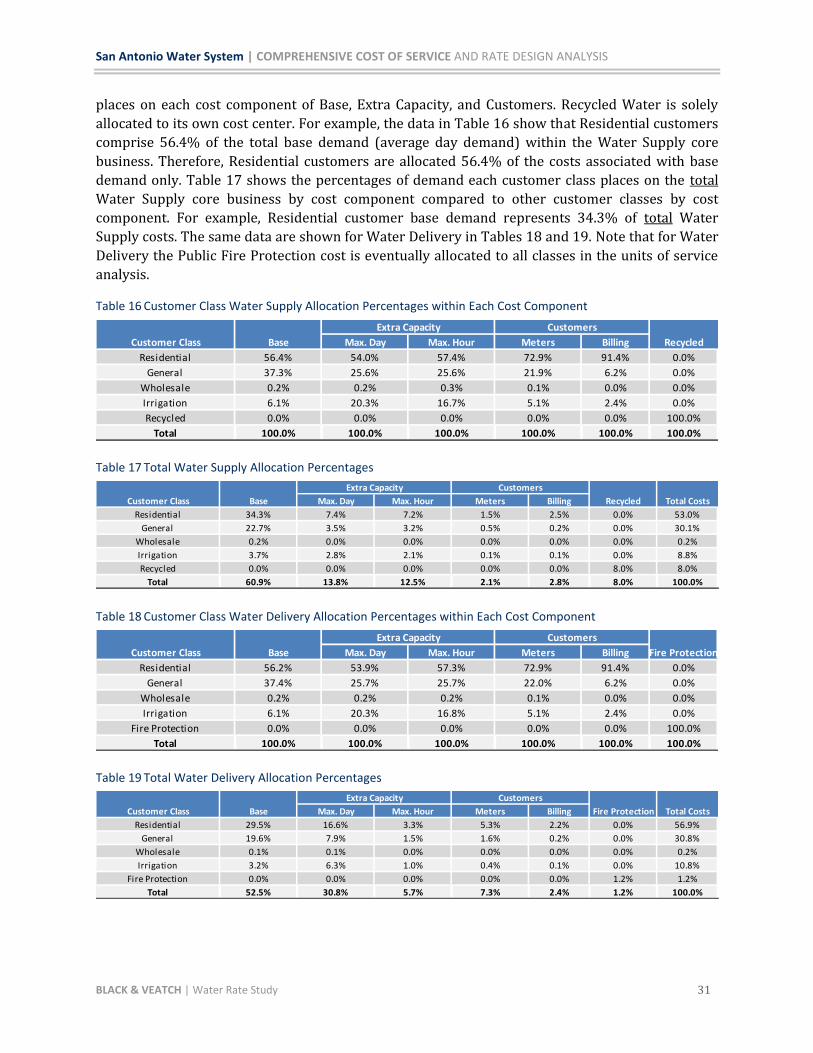
San Antonio Water System | COMPREHENSIVE COST OF SERVICE AND RATE DESIGN ANALYSIS
BLACK & VEATCH | Water Rate Study 31
places on each cost component of Base, Extra Capacity, and Customers. Recycled Water is solely
allocated to its own cost center. For example, the data in Table 16 show that Residential customers
comprise 56.4% of the total base demand (average day demand) within the Water Supply core
business. Therefore, Residential customers are allocated 56.4% of the costs associated with base
demand only. Table 17 shows the percentages of demand each customer class places on the total
Water Supply core business by cost component compared to other customer classes by cost
component. For example, Residential customer base demand represents 34.3% of total Water
Supply costs. The same data are shown for Water Delivery in Tables 18 and 19. Note that for Water
Delivery the Public Fire Protection cost is eventually allocated to all classes in the units of service
analysis.
Table 16 Customer Class Water Supply Allocation Percentages within Each Cost Component
Table 17 Total Water Supply Allocation Percentages
Table 18 Customer Class Water Delivery Allocation Percentages within Each Cost Component
Table 19 Total Water Delivery Allocation Percentages
Base Max. Day Max. Hour Meters Billing
Residential 56.4% 54.0% 57.4% 72.9% 91.4% 0.0%
General 37.3% 25.6% 25.6% 21.9% 6.2% 0.0%
Wholesale 0.2% 0.2% 0.3% 0.1% 0.0% 0.0%
Irrigation 6.1% 20.3% 16.7% 5.1% 2.4% 0.0%
Recycled 0.0% 0.0% 0.0% 0.0% 0.0% 100.0%
Total 100.0% 100.0% 100.0% 100.0% 100.0% 100.0%
Customer Class
Extra Capacity Customers
Recycled
Base Max. Day Max. Hour Meters Billing
Residential 34.3% 7.4% 7.2% 1.5% 2.5% 0.0% 53.0%
General 22.7% 3.5% 3.2% 0.5% 0.2% 0.0% 30.1%
Wholesale 0.2% 0.0% 0.0% 0.0% 0.0% 0.0% 0.2%
Irrigation 3.7% 2.8% 2.1% 0.1% 0.1% 0.0% 8.8%
Recycled 0.0% 0.0% 0.0% 0.0% 0.0% 8.0% 8.0%
Total 60.9% 13.8% 12.5% 2.1% 2.8% 8.0% 100.0%
Total Costs
Customers
RecycledCustomer Class
Extra Capacity
Base Max. Day Max. Hour Meters Billing
Residential 56.2% 53.9% 57.3% 72.9% 91.4% 0.0%
General 37.4% 25.7% 25.7% 22.0% 6.2% 0.0%
Wholesale 0.2% 0.2% 0.2% 0.1% 0.0% 0.0%
Irrigation 6.1% 20.3% 16.8% 5.1% 2.4% 0.0%
Fire Protection 0.0% 0.0% 0.0% 0.0% 0.0% 100.0%
Total 100.0% 100.0% 100.0% 100.0% 100.0% 100.0%
Customer Class
Extra Capacity Customers
Fire Protection
Base Max. Day Max. Hour Meters Billing
Residential 29.5% 16.6% 3.3% 5.3% 2.2% 0.0% 56.9%
General 19.6% 7.9% 1.5% 1.6% 0.2% 0.0% 30.8%
Wholesale 0.1% 0.1% 0.0% 0.0% 0.0% 0.0% 0.2%
Irrigation 3.2% 6.3% 1.0% 0.4% 0.1% 0.0% 10.8%
Fire Protection 0.0% 0.0% 0.0% 0.0% 0.0% 1.2% 1.2%
Total 52.5% 30.8% 5.7% 7.3% 2.4% 1.2% 100.0%
Total CostsCustomer Class
Extra Capacity Customers
Fire Protection
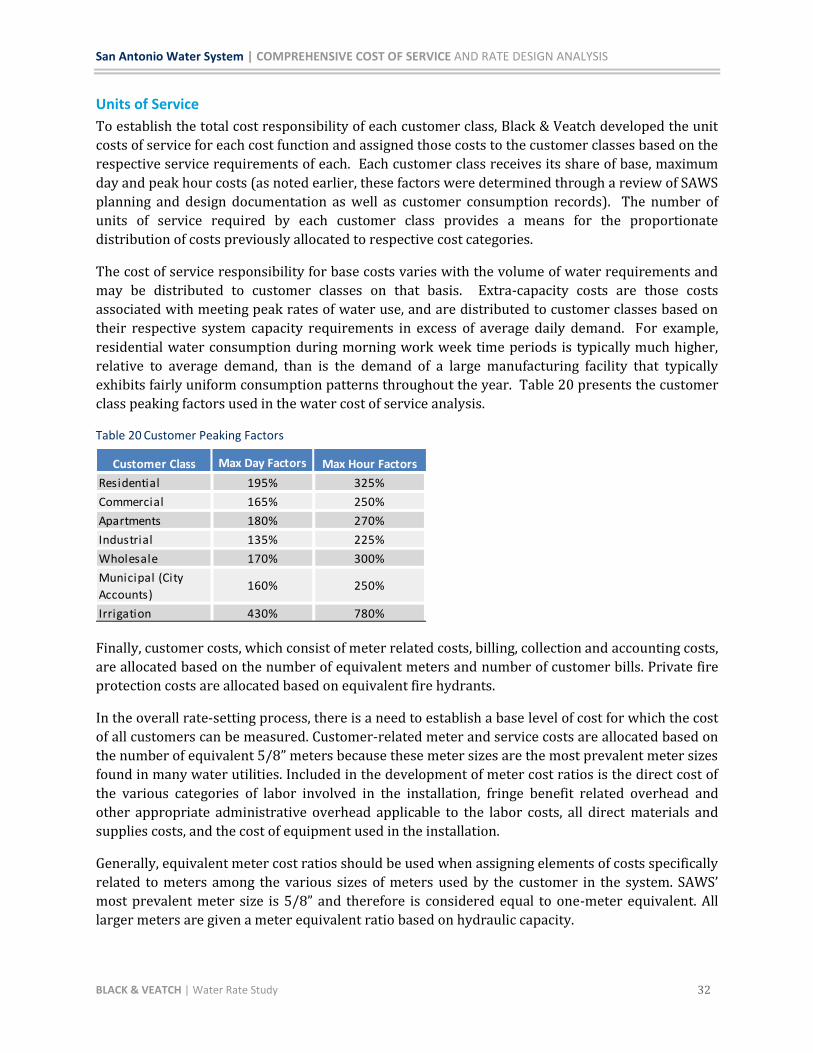
San Antonio Water System | COMPREHENSIVE COST OF SERVICE AND RATE DESIGN ANALYSIS
BLACK & VEATCH | Water Rate Study 32
Units of Service
To establish the total cost responsibility of each customer class, Black & Veatch developed the unit
costs of service for each cost function and assigned those costs to the customer classes based on the
respective service requirements of each. Each customer class receives its share of base, maximum
day and peak hour costs (as noted earlier, these factors were determined through a review of SAWS
planning and design documentation as well as customer consumption records). The number of
units of service required by each customer class provides a means for the proportionate
distribution of costs previously allocated to respective cost categories.
The cost of service responsibility for base costs varies with the volume of water requirements and
may be distributed to customer classes on that basis. Extra-capacity costs are those costs
associated with meeting peak rates of water use, and are distributed to customer classes based on
their respective system capacity requirements in excess of average daily demand. For example,
residential water consumption during morning work week time periods is typically much higher,
relative to average demand, than is the demand of a large manufacturing facility that typically
exhibits fairly uniform consumption patterns throughout the year. Table 20 presents the customer
class peaking factors used in the water cost of service analysis.
Table 20 Customer Peaking Factors
Finally, customer costs, which consist of meter related costs, billing, collection and accounting costs,
are allocated based on the number of equivalent meters and number of customer bills. Private fire
protection costs are allocated based on equivalent fire hydrants.
In the overall rate-setting process, there is a need to establish a base level of cost for which the cost
of all customers can be measured. Customer-related meter and service costs are allocated based on
the number of equivalent 5/8” meters because these meter sizes are the most prevalent meter sizes
found in many water utilities. Included in the development of meter cost ratios is the direct cost of
the various categories of labor involved in the installation, fringe benefit related overhead and
other appropriate administrative overhead applicable to the labor costs, all direct materials and
supplies costs, and the cost of equipment used in the installation.
Generally, equivalent meter cost ratios should be used when assigning elements of costs specifically
related to meters among the various sizes of meters used by the customer in the system. SAWS’
most prevalent meter size is 5/8” and therefore is considered equal to one-meter equivalent. All
larger meters are given a meter equivalent ratio based on hydraulic capacity.
Customer Class Max Day Factors Max Hour Factors
Residential 195% 325%
Commercial 165% 250%
Apartments 180% 270%
Industrial 135% 225%
Wholesale 170% 300%
Municipal (City
Accounts)160% 250%
Irrigation 430% 780%
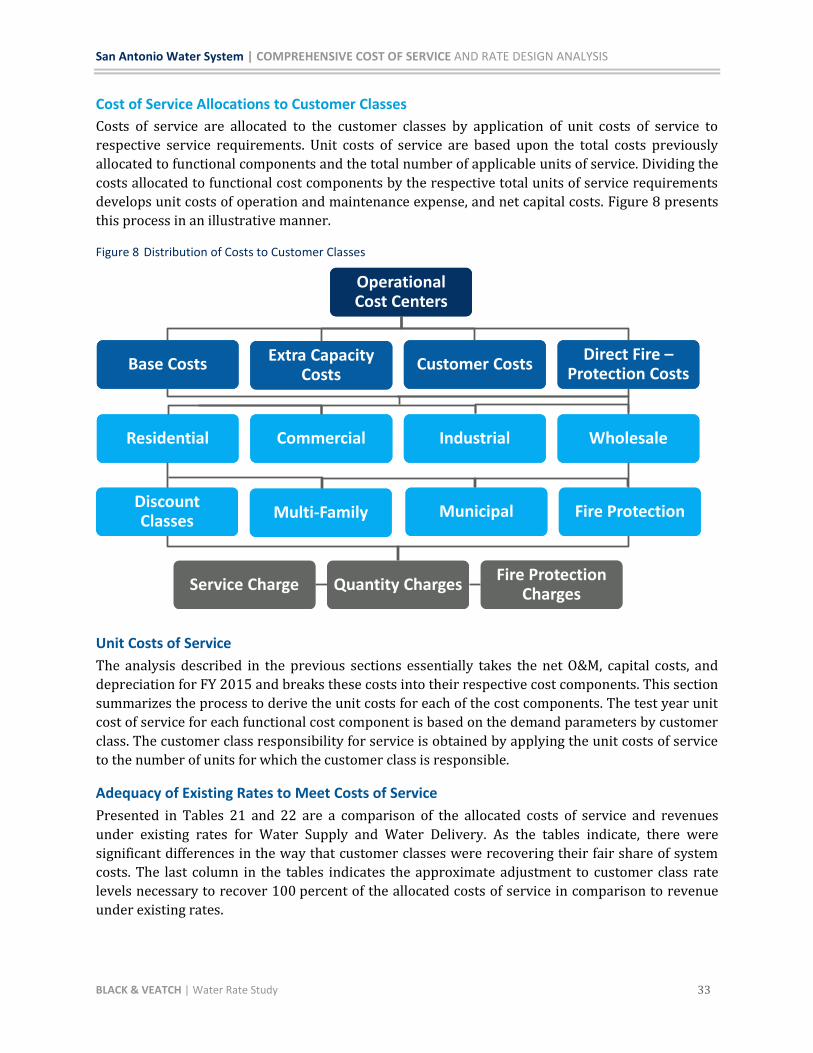
San Antonio Water System | COMPREHENSIVE COST OF SERVICE AND RATE DESIGN ANALYSIS
BLACK & VEATCH | Water Rate Study 33
Cost of Service Allocations to Customer Classes
Costs of service are allocated to the customer classes by application of unit costs of service to
respective service requirements. Unit costs of service are based upon the total costs previously
allocated to functional components and the total number of applicable units of service. Dividing the
costs allocated to functional cost components by the respective total units of service requirements
develops unit costs of operation and maintenance expense, and net capital costs. Figure 8 presents
this process in an illustrative manner.
Figure 8 Distribution of Costs to Customer Classes
Unit Costs of Service
The analysis described in the previous sections essentially takes the net O&M, capital costs, and
depreciation for FY 2015 and breaks these costs into their respective cost components. This section
summarizes the process to derive the unit costs for each of the cost components. The test year unit
cost of service for each functional cost component is based on the demand parameters by customer
class. The customer class responsibility for service is obtained by applying the unit costs of service
to the number of units for which the customer class is responsible.
Adequacy of Existing Rates to Meet Costs of Service
Presented in Tables 21 and 22 are a comparison of the allocated costs of service and revenues
under existing rates for Water Supply and Water Delivery. As the tables indicate, there were
significant differences in the way that customer classes were recovering their fair share of system
costs. The last column in the tables indicates the approximate adjustment to customer class rate
levels necessary to recover 100 percent of the allocated costs of service in comparison to revenue
under existing rates.
Operational Cost Centers
Base Costs Extra Capacity Costs
Customer CostsDirect Fire –
Protection Costs
Residential Commercial Industrial
Service Charge Quantity ChargesFire Protection
Charges
Municipal
Wholesale
Fire ProtectionDiscountClasses Multi-Family
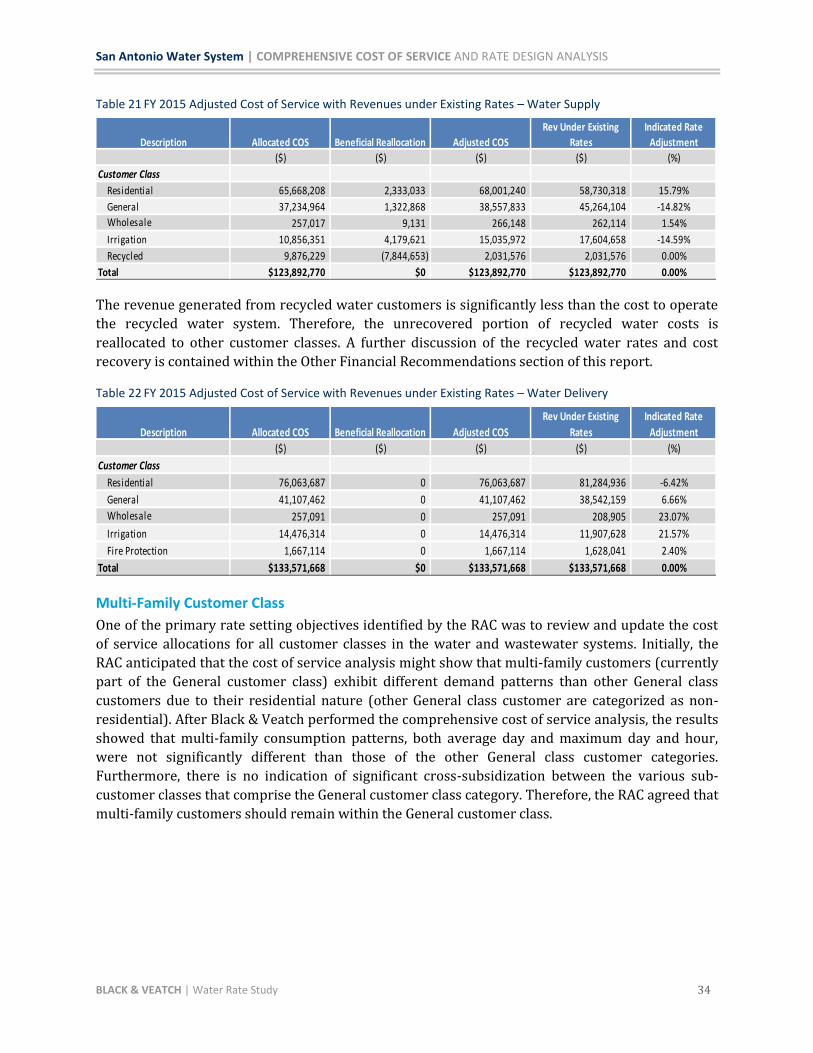
San Antonio Water System | COMPREHENSIVE COST OF SERVICE AND RATE DESIGN ANALYSIS
BLACK & VEATCH | Water Rate Study 34
Table 21 FY 2015 Adjusted Cost of Service with Revenues under Existing Rates – Water Supply
The revenue generated from recycled water customers is significantly less than the cost to operate
the recycled water system. Therefore, the unrecovered portion of recycled water costs is
reallocated to other customer classes. A further discussion of the recycled water rates and cost
recovery is contained within the Other Financial Recommendations section of this report.
Table 22 FY 2015 Adjusted Cost of Service with Revenues under Existing Rates – Water Delivery
Multi-Family Customer Class
One of the primary rate setting objectives identified by the RAC was to review and update the cost
of service allocations for all customer classes in the water and wastewater systems. Initially, the
RAC anticipated that the cost of service analysis might show that multi-family customers (currently
part of the General customer class) exhibit different demand patterns than other General class
customers due to their residential nature (other General class customer are categorized as non-
residential). After Black & Veatch performed the comprehensive cost of service analysis, the results
showed that multi-family consumption patterns, both average day and maximum day and hour,
were not significantly different than those of the other General class customer categories.
Furthermore, there is no indication of significant cross-subsidization between the various sub-
customer classes that comprise the General customer class category. Therefore, the RAC agreed that
multi-family customers should remain within the General customer class.
($) ($) ($) ($) (%)
Customer Class
Residential 65,668,208 2,333,033 68,001,240 58,730,318 15.79%
General 37,234,964 1,322,868 38,557,833 45,264,104 -14.82%
Wholesale 257,017 9,131 266,148 262,114 1.54%
Irrigation 10,856,351 4,179,621 15,035,972 17,604,658 -14.59%
Recycled 9,876,229 (7,844,653) 2,031,576 2,031,576 0.00%
Total $123,892,770 $0 $123,892,770 $123,892,770 0.00%
Indicated Rate
AdjustmentDescription Allocated COS Beneficial Reallocation Adjusted COS
Rev Under Existing
Rates
($) ($) ($) ($) (%)
Customer Class
Residential 76,063,687 0 76,063,687 81,284,936 -6.42%
General 41,107,462 0 41,107,462 38,542,159 6.66%
Wholesale 257,091 0 257,091 208,905 23.07%
Irrigation 14,476,314 0 14,476,314 11,907,628 21.57%
Fire Protection 1,667,114 0 1,667,114 1,628,041 2.40%
Total $133,571,668 $0 $133,571,668 $133,571,668 0.00%
Description Allocated COS Beneficial Reallocation Adjusted COS
Rev Under Existing
Rates
Indicated Rate
Adjustment

San Antonio Water System | COMPREHENSIVE COST OF SERVICE AND RATE DESIGN ANALYSIS
BLACK & VEATCH | Water Rate Study 35
WATER RATE DESIGN The initial consideration in the derivation of water rate schedules for utility service is the
establishment of equitable charges to the customers commensurate with the cost of providing that
service. While the cost of service allocations to customer classes should not be construed as literal
or exact determinations, they offer a guide to the necessity for, and the extent of, rate adjustments.
See Figure 9 for the process of setting rates. Practical considerations sometimes modify rate
adjustments by taking into account additional factors such as the extent of change from previous
rate levels, existing contracts, and past local policies and practices.
Figure 9 Rate Design Process
Rate Options
Before presenting the proposed rates for FY 2015, the following lists the recommended changes to
the water rate structure for Residential, General and Irrigation customer classes. Recycled Water
and Wholesale customer rate recommendations are included in the following section under Other
Financial Recommendations.
These recommendations were presented to the Rate Advisory Committee during several meetings
in early 2015 in concert with the rate setting objectives established by the RAC early in the rate
study process.
Development of a Residential Lifeline Supply rate block to incentivize very efficient use of water
and to provide all residential customers with a very low rate for life essential uses of water.
This proposal would change the rate structure by reducing the volumetric rate for the first
2,992 gallons of consumption and lower the fixed charge for customers with no usage above
2,992 gallons.
Expand Residential volumetric blocks from four to eight blocks and expand the number of
Irrigation customer blocks from three to four blocks. This change would send a price signal
sooner to high water users and further encourage conservation among these customer classes.
More blocks would also benefit customers by affording them the opportunity to move down the
rate blocks with moderate reductions in usage.
SAWS staff and Black & Veatch analyzed billing frequencies for all residential and irrigation
customers to understand customer usage patterns. The billing frequency analysis examines
each customer’s monthly bill and assists in analyzing the effectiveness of the existing blocks.
Upon review of the billing frequency analysis, it was recommended by the RAC that the blocks
for residential and irrigation customers be expanded in order to promote conservation among
all users and to emphasize a reduction in discretionary water consumption. Tables 23 and 24
Units of Service Revenue
Requirements
Rates & Charges
=
Collection Lag
Factor
Rates & Charges
X = Final Rates &
Charges
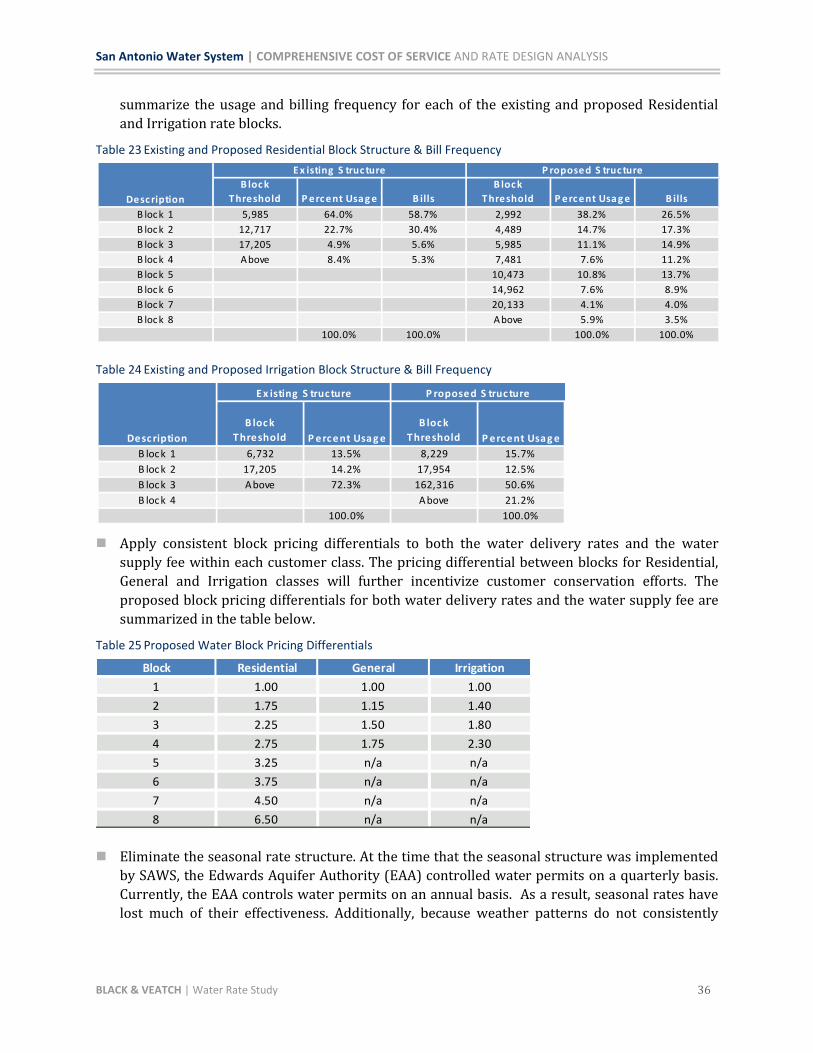
San Antonio Water System | COMPREHENSIVE COST OF SERVICE AND RATE DESIGN ANALYSIS
BLACK & VEATCH | Water Rate Study 36
summarize the usage and billing frequency for each of the existing and proposed Residential
and Irrigation rate blocks.
Table 23 Existing and Proposed Residential Block Structure & Bill Frequency
Table 24 Existing and Proposed Irrigation Block Structure & Bill Frequency
Apply consistent block pricing differentials to both the water delivery rates and the water
supply fee within each customer class. The pricing differential between blocks for Residential,
General and Irrigation classes will further incentivize customer conservation efforts. The
proposed block pricing differentials for both water delivery rates and the water supply fee are
summarized in the table below.
Table 25 Proposed Water Block Pricing Differentials
Eliminate the seasonal rate structure. At the time that the seasonal structure was implemented
by SAWS, the Edwards Aquifer Authority (EAA) controlled water permits on a quarterly basis.
Currently, the EAA controls water permits on an annual basis. As a result, seasonal rates have
lost much of their effectiveness. Additionally, because weather patterns do not consistently
B loc k
T hreshold P erc ent Usa g e B ills
B loc k
T hreshold P erc ent Usa g e B ills
B lock 1 5,985 64.0% 58.7% 2,992 38.2% 26.5%
B lock 2 12,717 22.7% 30.4% 4,489 14.7% 17.3%
B lock 3 17,205 4.9% 5.6% 5,985 11.1% 14.9%
B lock 4 Above 8.4% 5.3% 7,481 7.6% 11.2%
B lock 5 10,473 10.8% 13.7%
B lock 6 14,962 7.6% 8.9%
B lock 7 20,133 4.1% 4.0%
B lock 8 Above 5.9% 3.5%
100.0% 100.0% 100.0% 100.0%
Desc ription
E x isting S truc ture P roposed S truc ture
B loc k
T hreshold P erc ent Usa g e
B loc k
T hreshold P erc ent Usa g e
B lock 1 6,732 13.5% 8,229 15.7%
B lock 2 17,205 14.2% 17,954 12.5%
B lock 3 Above 72.3% 162,316 50.6%
B lock 4 Above 21.2%
100.0% 100.0%
Desc ription
E x isting S truc ture P roposed S truc ture
Block Residential General Irrigation
1 1.00 1.00 1.00
2 1.75 1.15 1.40
3 2.25 1.50 1.80
4 2.75 1.75 2.30
5 3.25 n/a n/a
6 3.75 n/a n/a
7 4.50 n/a n/a
8 6.50 n/a n/a
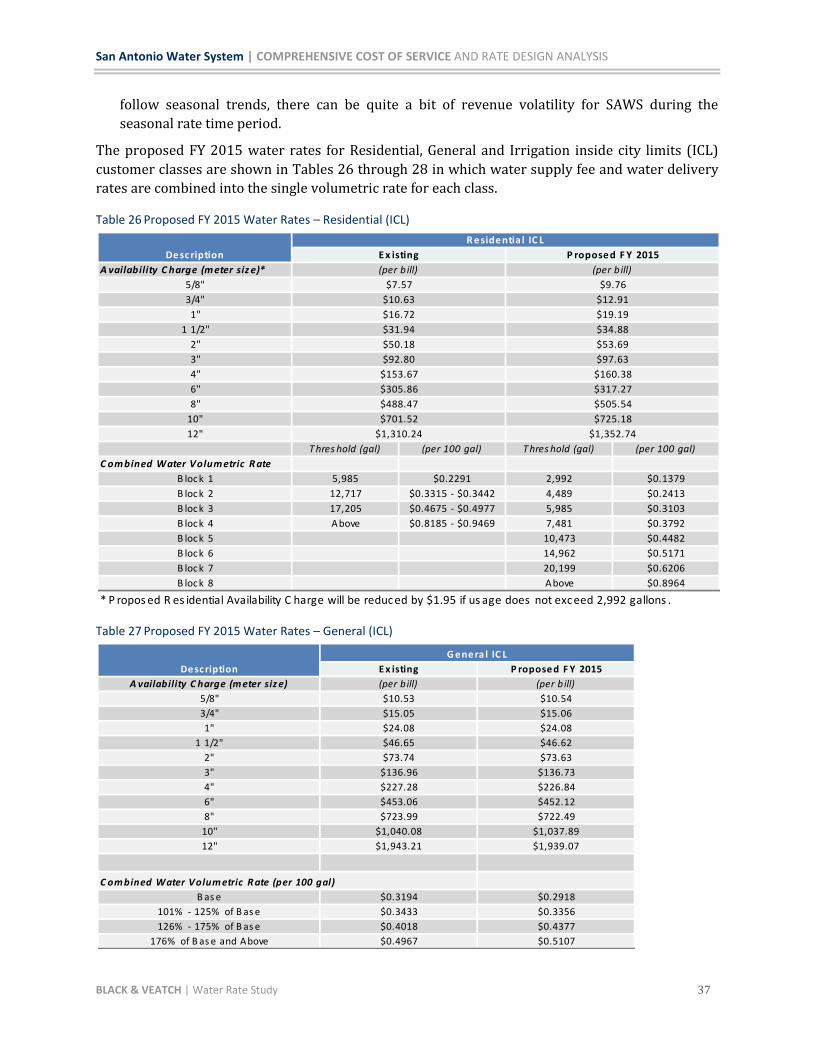
San Antonio Water System | COMPREHENSIVE COST OF SERVICE AND RATE DESIGN ANALYSIS
BLACK & VEATCH | Water Rate Study 37
follow seasonal trends, there can be quite a bit of revenue volatility for SAWS during the
seasonal rate time period.
The proposed FY 2015 water rates for Residential, General and Irrigation inside city limits (ICL)
customer classes are shown in Tables 26 through 28 in which water supply fee and water delivery
rates are combined into the single volumetric rate for each class.
Table 26 Proposed FY 2015 Water Rates – Residential (ICL)
Table 27 Proposed FY 2015 Water Rates – General (ICL)
A vailability C harge (m eter siz e)*
5/8"
3/4"
1"
1 1/2"
2"
3"
4"
6"
8"
10"
12"
T hres hold (gal) (per 100 gal) T hres hold (gal) (per 100 gal)
C om bined Water Volum etric R ate
B loc k 1 5,985 $0.2291 2,992 $0.1379
B loc k 2 12,717 $0.3315 - $0.3442 4,489 $0.2413
B loc k 3 17,205 $0.4675 - $0.4977 5,985 $0.3103
B loc k 4 Above $0.8185 - $0.9469 7,481 $0.3792
B loc k 5 10,473 $0.4482
B loc k 6 14,962 $0.5171
B loc k 7 20,199 $0.6206
B loc k 8 Above $0.8964
* P ropos ed R es idential Availability C harge will be reduced by $1.95 if us age does not exceed 2,992 gallons .
$701.52 $725.18
$1,310.24 $1,352.74
$305.86 $317.27
$488.47 $505.54
$92.80 $97.63
$153.67 $160.38
$31.94 $34.88
$50.18 $53.69
$10.63 $12.91
$16.72 $19.19
(per b ill) (per b ill)
$7.57 $9.76
Desc ription
R esidentia l IC L
E x isting P roposed F Y 2015
E x isting P roposed F Y 2015
A vailability C harge (m eter siz e) (per b ill) (per b ill)
5/8" $10.53 $10.54
3/4" $15.05 $15.06
1" $24.08 $24.08
1 1/2" $46.65 $46.62
2" $73.74 $73.63
3" $136.96 $136.73
4" $227.28 $226.84
6" $453.06 $452.12
8" $723.99 $722.49
10" $1,040.08 $1,037.89
12" $1,943.21 $1,939.07
C om bined Water Volum etric R ate (per 100 gal)
B as e $0.3194 $0.2918
101% - 125% of B as e $0.3433 $0.3356
126% - 175% of B as e $0.4018 $0.4377
176% of B as e and Above $0.4967 $0.5107
Desc ription
G enera l IC L

San Antonio Water System | COMPREHENSIVE COST OF SERVICE AND RATE DESIGN ANALYSIS
BLACK & VEATCH | Water Rate Study 38
Table 28 Proposed FY 2015 Water Rates – Irrigation (ICL)
Revenue Sufficiency
Presented in Tables 29 and 30 are comparisons of Test Year allocated cost of service with revenues
for each rate structure option. Test year costs of service are utilized and the proposed rates recover
essentially 100 percent of the total cost of service.
Table 29 FY 2015 Adjusted Cost of Service with Revenues under Proposed Rates – Water Supply
Table 30 FY 2015 Adjusted Cost of Service with Revenues under Proposed Rates – Water Delivery
A vailability C harge (m eter siz e)*
5/8"
3/4"
1"
1 1/2"
2"
3"
4"
6"
8"
10"
12"
T hres hold (gal) (per 100 gal) T hres hold (gal) (per 100 gal)
C om bined Water Volum etric R ate
B lock 1 6,732 $0.3689 8,229 $0.4519
B lock 2 17,205 $0.4675 - $0.5006 17,954 $0.6326
B lock 3 Above $0.8572 - $0.9912 162,316 $0.8134
B lock 4 Above $1.0393
$1,943.21 $1,939.07
$136.96 $136.73
$227.28 $226.84
$453.06 $452.12
$723.99 $722.49
$1,040.08 $1,037.89
$10.53 $10.54
$15.05 $15.06
$24.08 $24.08
$46.65 $46.62
$73.74 $73.63
Desc ription
Irrg ia tion IC L
E x isting P roposed F Y 2015
(per b ill) (per b ill)
($) ($) (%)
Customer Class
Residential 68,001,240 68,001,240 100.00%
General 38,557,833 38,557,833 100.00%
Wholesale 266,148 266,148 100.00%
Irrigation 15,035,972 15,035,972 100.00%
Recycled 2,031,576 2,031,576 100.00%
Total $123,892,770 $123,892,770 100.00%
Rev Under Proposed
Rates Cost Recovery Description Adjusted COS
($) ($) (%)
Customer Class
Residential 76,063,687 76,063,687 100.00%
General 41,107,462 41,107,462 100.00%
Wholesale 257,091 257,091 100.00%
Irrigation 14,476,314 14,476,314 100.00%
Fire Protection 1,667,114 1,667,114 100.00%
Total $133,571,668 $133,571,668 100.00%
Description Adjusted COS
Rev Under Proposed
Rates Cost Recovery
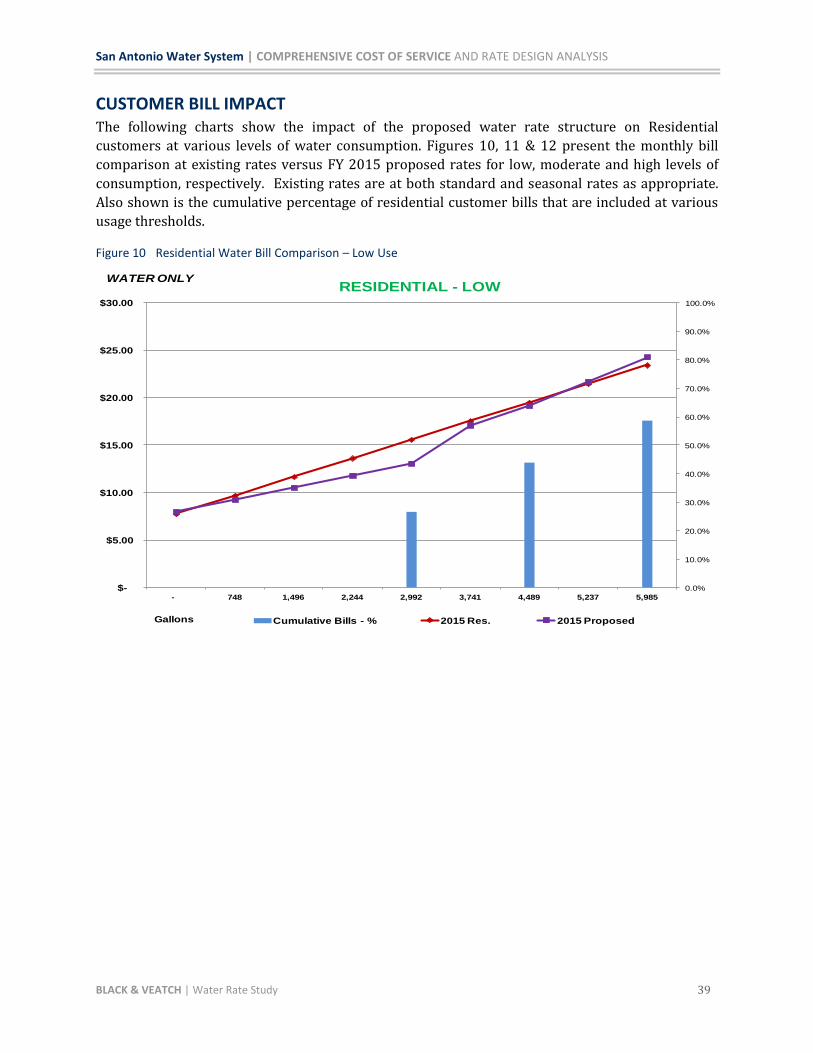
San Antonio Water System | COMPREHENSIVE COST OF SERVICE AND RATE DESIGN ANALYSIS
BLACK & VEATCH | Water Rate Study 39
CUSTOMER BILL IMPACT The following charts show the impact of the proposed water rate structure on Residential
customers at various levels of water consumption. Figures 10, 11 & 12 present the monthly bill
comparison at existing rates versus FY 2015 proposed rates for low, moderate and high levels of
consumption, respectively. Existing rates are at both standard and seasonal rates as appropriate.
Also shown is the cumulative percentage of residential customer bills that are included at various
usage thresholds.
Figure 10 Residential Water Bill Comparison – Low Use
0.0%
10.0%
20.0%
30.0%
40.0%
50.0%
60.0%
70.0%
80.0%
90.0%
100.0%
$-
$5.00
$10.00
$15.00
$20.00
$25.00
$30.00
- 748 1,496 2,244 2,992 3,741 4,489 5,237 5,985
Cumulative Bills - % 2015 Res. 2015 ProposedGallons
WATER ONLYRESIDENTIAL - LOW
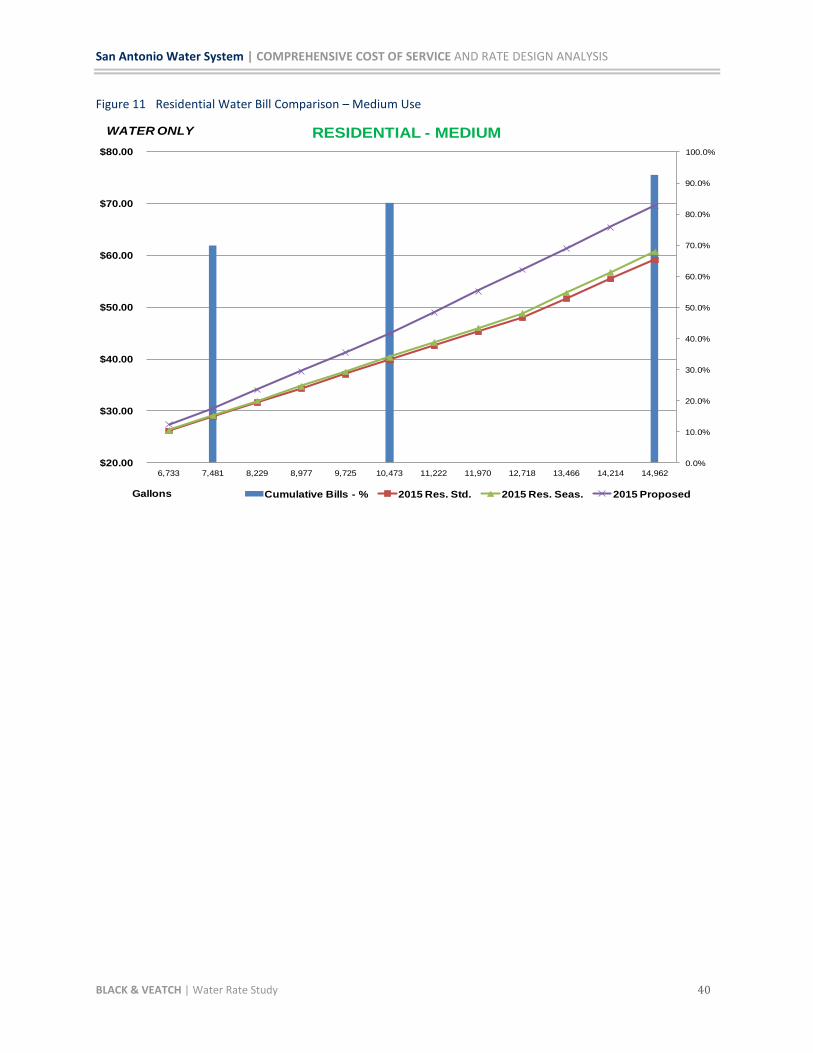
San Antonio Water System | COMPREHENSIVE COST OF SERVICE AND RATE DESIGN ANALYSIS
BLACK & VEATCH | Water Rate Study 40
Figure 11 Residential Water Bill Comparison – Medium Use
0.0%
10.0%
20.0%
30.0%
40.0%
50.0%
60.0%
70.0%
80.0%
90.0%
100.0%
$20.00
$30.00
$40.00
$50.00
$60.00
$70.00
$80.00
6,733 7,481 8,229 8,977 9,725 10,473 11,222 11,970 12,718 13,466 14,214 14,962
RESIDENTIAL - MEDIUM
Cumulative Bills - % 2015 Res. Std. 2015 Res. Seas. 2015 ProposedGallons
WATER ONLY
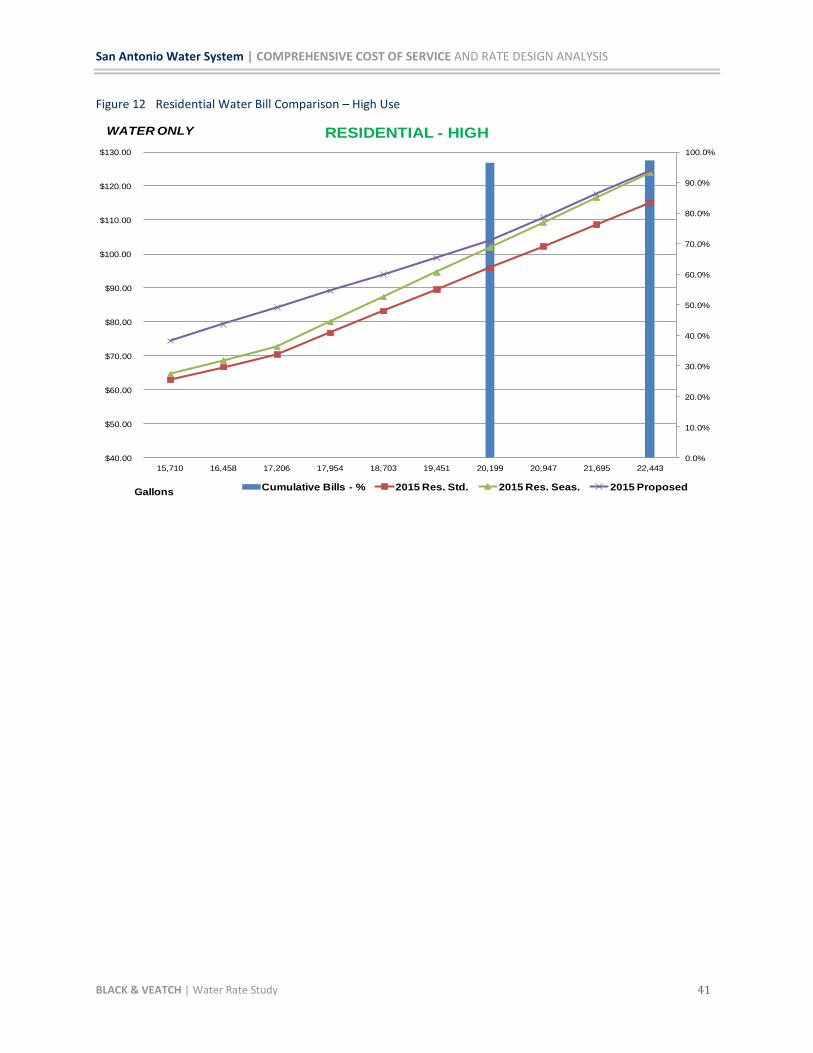
San Antonio Water System | COMPREHENSIVE COST OF SERVICE AND RATE DESIGN ANALYSIS
BLACK & VEATCH | Water Rate Study 41
Figure 12 Residential Water Bill Comparison – High Use
0.0%
10.0%
20.0%
30.0%
40.0%
50.0%
60.0%
70.0%
80.0%
90.0%
100.0%
$40.00
$50.00
$60.00
$70.00
$80.00
$90.00
$100.00
$110.00
$120.00
$130.00
15,710 16,458 17,206 17,954 18,703 19,451 20,199 20,947 21,695 22,443
RESIDENTIAL - HIGH
Cumulative Bills - % 2015 Res. Std. 2015 Res. Seas. 2015 ProposedGallons
WATER ONLY
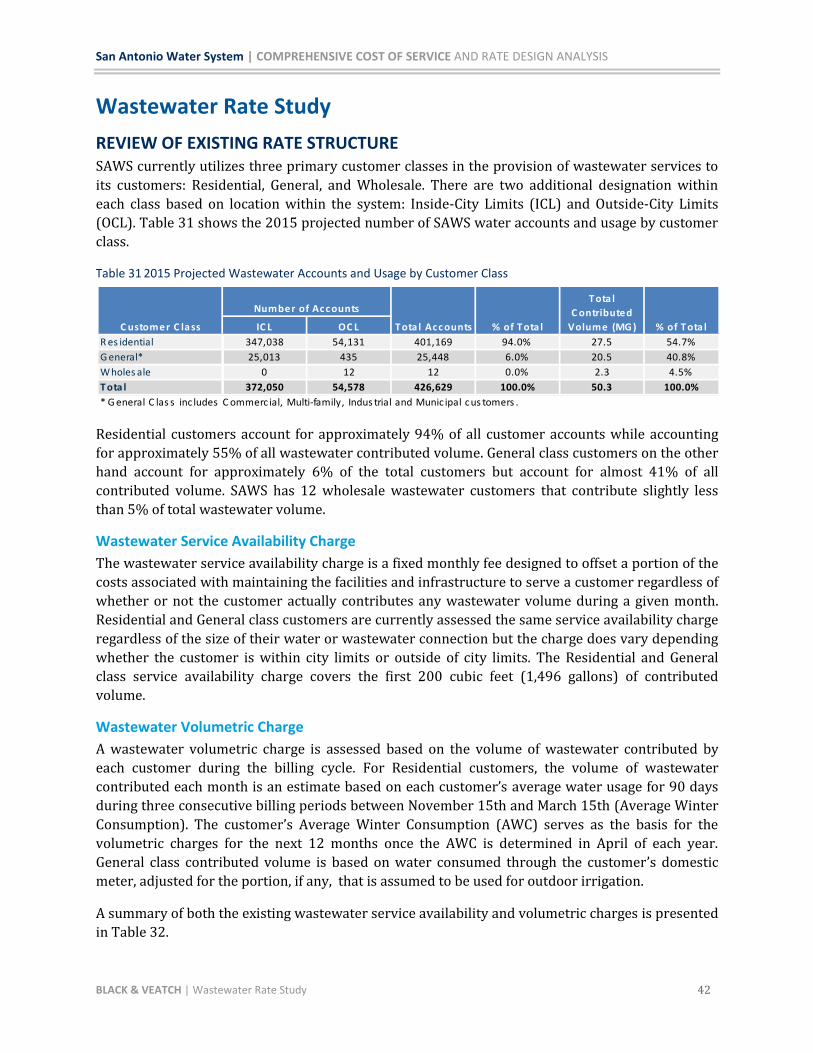
San Antonio Water System | COMPREHENSIVE COST OF SERVICE AND RATE DESIGN ANALYSIS
BLACK & VEATCH | Wastewater Rate Study 42
Wastewater Rate Study
REVIEW OF EXISTING RATE STRUCTURE SAWS currently utilizes three primary customer classes in the provision of wastewater services to
its customers: Residential, General, and Wholesale. There are two additional designation within
each class based on location within the system: Inside-City Limits (ICL) and Outside-City Limits
(OCL). Table 31 shows the 2015 projected number of SAWS water accounts and usage by customer
class.
Table 31 2015 Projected Wastewater Accounts and Usage by Customer Class
Residential customers account for approximately 94% of all customer accounts while accounting
for approximately 55% of all wastewater contributed volume. General class customers on the other
hand account for approximately 6% of the total customers but account for almost 41% of all
contributed volume. SAWS has 12 wholesale wastewater customers that contribute slightly less
than 5% of total wastewater volume.
Wastewater Service Availability Charge
The wastewater service availability charge is a fixed monthly fee designed to offset a portion of the
costs associated with maintaining the facilities and infrastructure to serve a customer regardless of
whether or not the customer actually contributes any wastewater volume during a given month.
Residential and General class customers are currently assessed the same service availability charge
regardless of the size of their water or wastewater connection but the charge does vary depending
whether the customer is within city limits or outside of city limits. The Residential and General
class service availability charge covers the first 200 cubic feet (1,496 gallons) of contributed
volume.
Wastewater Volumetric Charge
A wastewater volumetric charge is assessed based on the volume of wastewater contributed by
each customer during the billing cycle. For Residential customers, the volume of wastewater
contributed each month is an estimate based on each customer’s average water usage for 90 days
during three consecutive billing periods between November 15th and March 15th (Average Winter
Consumption). The customer’s Average Winter Consumption (AWC) serves as the basis for the
volumetric charges for the next 12 months once the AWC is determined in April of each year.
General class contributed volume is based on water consumed through the customer’s domestic
meter, adjusted for the portion, if any, that is assumed to be used for outdoor irrigation.
A summary of both the existing wastewater service availability and volumetric charges is presented
in Table 32.
IC L OC L
R es idential 347,038 54,131 401,169 94.0% 27.5 54.7%
G eneral* 25,013 435 25,448 6.0% 20.5 40.8%
Wholes ale 0 12 12 0.0% 2.3 4.5%
T ota l 372,050 54,578 426,629 100.0% 50.3 100.0%
* G eneral C las s inc ludes C ommerc ial, Multi-family, Indus trial and Munic ipal cus tomers .
% of T ota l
Number of Ac c ounts
T ota l Ac c ounts % of T ota l
T ota l
C ontributed
Volume (MG )C ustomer C la ss

San Antonio Water System | COMPREHENSIVE COST OF SERVICE AND RATE DESIGN ANALYSIS
BLACK & VEATCH | Wastewater Rate Study 43
Table 32 Existing Wastewater Charges
Sewer Surcharges
The current wastewater rate structure also includes a high strength component charged to General
class customers whose wastewater includes pollutant levels in excess of normal domestic
wastewater. The surcharges are intended to recover direct costs associated with removal of
biological oxygen demand (BOD) and total suspended solids (TSS). Surcharges also recover direct
cost to administer the city’s pretreatment program. Without a surcharge, industrial and commercial
facilities would be subsidized by residential customers.
REVENUE REQUIREMENTS With revenue derived from the various sources, SAWS funds the requirements of: operation and
maintenance (O&M); recurring annual capital expenditures for replacements, system betterments,
and extensions; debt service on outstanding bonds; and reserve levels. O&M expenses are those
expenditures necessary to maintain the system in good working order. Capital expenditures consist
of recurring routine annual replacements as well as major capital projects to expand the system.
Currently, SAWS uses a combination of cash and debt to finance all capital improvements.
Wastewater Revenue Requirements
Wastewater revenue requirements include all costs incurred by SAWS to collect and treat
wastewater contributed by each customer. The elements comprising the cost of service analysis
are assigned to the two cost categories of operating expense and capital costs. SAWS staff provided
a breakdown of costs that are recovered by wastewater rates as shown in the following table.
Table 33 FY 2015 Wastewater Revenue Requirements
ICL OCL ICL OCL
Service Availability
Charge*$12.69 $15.25 n/a $149.02
Volumetric Charge (per
100 gallons)$0.3365 $0.4038 $0.3032 $0.3641
*Residential and General Class charge includes first 1,496 gallons of contributed volume.
Description
Residential/General Class Wholesale Class
DescriptionOperating
ExpenseCapital Cost Total Cost
Operating & Maintenance
Expense$109,508,549 $109,508,549
Debt Service $79,731,570 $79,731,570
Transfer to City $5,976,386 $5,976,386
Transfer to R&R $5,958,960 $16,833,783 $22,792,743
Capital Outlay $4,444,113 $4,444,113
Subtotal $121,443,895 $101,009,466 $222,453,361
Amounts recovered from
sources other than rates($4,716,738) $0 ($4,716,738)
Total Rate Requirements $116,727,156 $101,009,466 $217,736,623
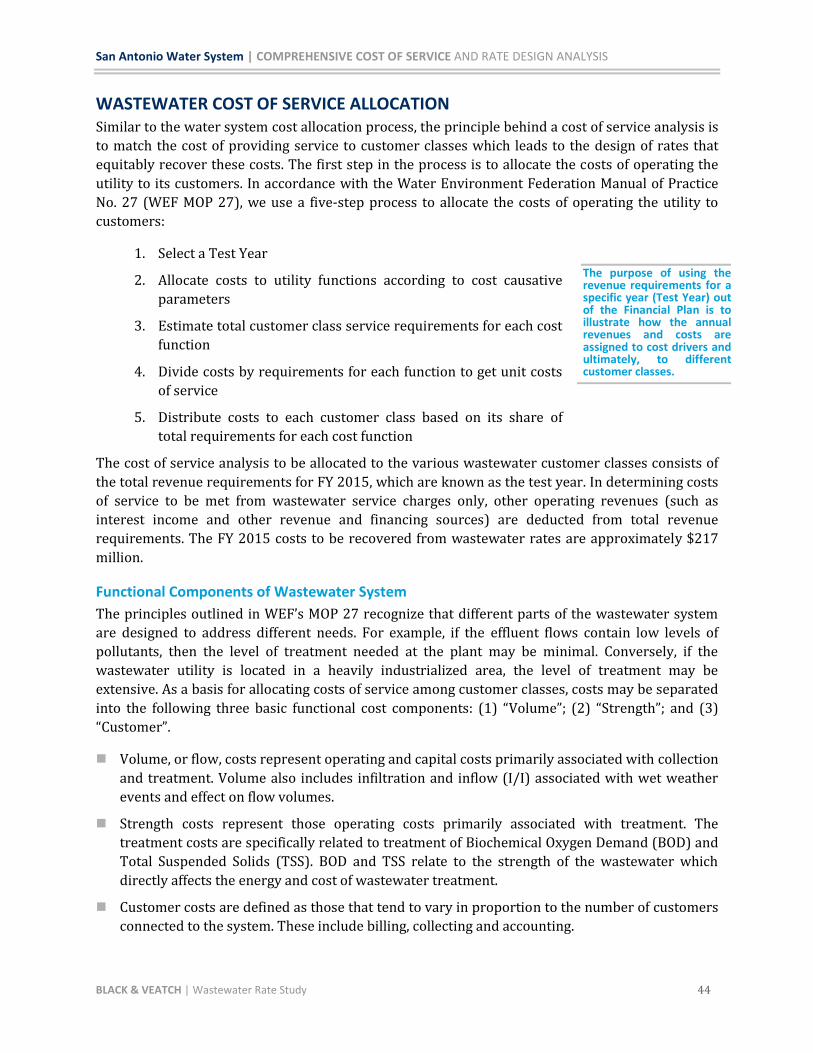
San Antonio Water System | COMPREHENSIVE COST OF SERVICE AND RATE DESIGN ANALYSIS
BLACK & VEATCH | Wastewater Rate Study 44
WASTEWATER COST OF SERVICE ALLOCATION Similar to the water system cost allocation process, the principle behind a cost of service analysis is
to match the cost of providing service to customer classes which leads to the design of rates that
equitably recover these costs. The first step in the process is to allocate the costs of operating the
utility to its customers. In accordance with the Water Environment Federation Manual of Practice
No. 27 (WEF MOP 27), we use a five-step process to allocate the costs of operating the utility to
customers:
1. Select a Test Year
2. Allocate costs to utility functions according to cost causative
parameters
3. Estimate total customer class service requirements for each cost
function
4. Divide costs by requirements for each function to get unit costs
of service
5. Distribute costs to each customer class based on its share of
total requirements for each cost function
The cost of service analysis to be allocated to the various wastewater customer classes consists of
the total revenue requirements for FY 2015, which are known as the test year. In determining costs
of service to be met from wastewater service charges only, other operating revenues (such as
interest income and other revenue and financing sources) are deducted from total revenue
requirements. The FY 2015 costs to be recovered from wastewater rates are approximately $217
million.
Functional Components of Wastewater System
The principles outlined in WEF’s MOP 27 recognize that different parts of the wastewater system
are designed to address different needs. For example, if the effluent flows contain low levels of
pollutants, then the level of treatment needed at the plant may be minimal. Conversely, if the
wastewater utility is located in a heavily industrialized area, the level of treatment may be
extensive. As a basis for allocating costs of service among customer classes, costs may be separated
into the following three basic functional cost components: (1) “Volume”; (2) “Strength”; and (3)
“Customer”.
Volume, or flow, costs represent operating and capital costs primarily associated with collection
and treatment. Volume also includes infiltration and inflow (I/I) associated with wet weather
events and effect on flow volumes.
Strength costs represent those operating costs primarily associated with treatment. The
treatment costs are specifically related to treatment of Biochemical Oxygen Demand (BOD) and
Total Suspended Solids (TSS). BOD and TSS relate to the strength of the wastewater which
directly affects the energy and cost of wastewater treatment.
Customer costs are defined as those that tend to vary in proportion to the number of customers
connected to the system. These include billing, collecting and accounting.
The purpose of using the revenue requirements for a specific year (Test Year) out of the Financial Plan is to illustrate how the annual revenues and costs are assigned to cost drivers and ultimately, to different customer classes.
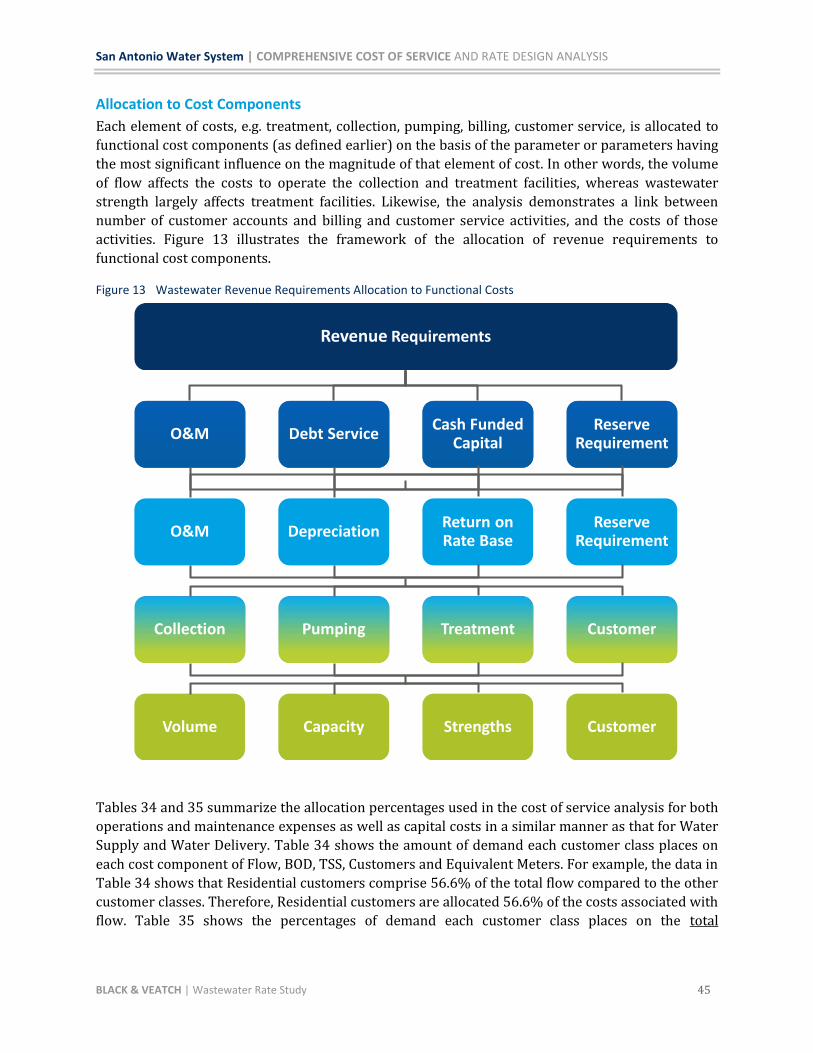
San Antonio Water System | COMPREHENSIVE COST OF SERVICE AND RATE DESIGN ANALYSIS
BLACK & VEATCH | Wastewater Rate Study 45
Allocation to Cost Components
Each element of costs, e.g. treatment, collection, pumping, billing, customer service, is allocated to
functional cost components (as defined earlier) on the basis of the parameter or parameters having
the most significant influence on the magnitude of that element of cost. In other words, the volume
of flow affects the costs to operate the collection and treatment facilities, whereas wastewater
strength largely affects treatment facilities. Likewise, the analysis demonstrates a link between
number of customer accounts and billing and customer service activities, and the costs of those
activities. Figure 13 illustrates the framework of the allocation of revenue requirements to
functional cost components.
Figure 13 Wastewater Revenue Requirements Allocation to Functional Costs
Tables 34 and 35 summarize the allocation percentages used in the cost of service analysis for both
operations and maintenance expenses as well as capital costs in a similar manner as that for Water
Supply and Water Delivery. Table 34 shows the amount of demand each customer class places on
each cost component of Flow, BOD, TSS, Customers and Equivalent Meters. For example, the data in
Table 34 shows that Residential customers comprise 56.6% of the total flow compared to the other
customer classes. Therefore, Residential customers are allocated 56.6% of the costs associated with
flow. Table 35 shows the percentages of demand each customer class places on the total
Revenue Requirements
O&M Debt ServiceCash Funded
CapitalReserve
Requirement
O&M DepreciationReturn on Rate Base
ReserveRequirement
Collection
Volume
Pumping
Capacity
Treatment
Strengths
Customer
Customer

San Antonio Water System | COMPREHENSIVE COST OF SERVICE AND RATE DESIGN ANALYSIS
BLACK & VEATCH | Wastewater Rate Study 46
wastewater system by cost component compared to other customer classes by cost component. For
example, Residential customer flow demand represents 38.4% of total wastewater system costs.
Table 34 Customer Class Wastewater Allocation Percentages within Each Cost Component
Table 35 Total Wastewater Allocation Percentages
To establish the total cost responsibility of each class of service, Black & Veatch developed the unit
costs of service for each cost function and assigned those costs to the customer classes based on the
respective service requirements of each. Each customer class receives its share of flow, capacity,
effluent strength, and customer costs (as noted earlier, these factors were determined through a
review of SAWS planning and design documentation as well as customer flow records). The number
of units of service required by each customer class provides a means for the proportionate
distribution of costs previously allocated to respective cost categories.
In the overall rate-setting process, there is a need to establish a base level of cost for which the cost
of all customers can be measured. Customer-related service costs are allocated based on the
customer's water meter size as this provides a proxy for the size of the customer's connection to the
wastewater system. Generally, equivalent meter cost ratios should be used when assigning
elements of costs specifically related to meters among the various sizes of meters used by the
customer in the system. SAWS’ most prevalent water meter size is 5/8” and therefore is considered
equal to one-meter equivalent. All larger meters are given a meter equivalent ratio based on
hydraulic capacity.
Cost of Service Allocations to Customer Classes
Costs of service are allocated to the customer classes by application of unit costs of service to
respective service requirements. Unit costs of service are based upon the total costs previously
allocated to functional components and the total number of applicable units of service. Dividing the
costs allocated to functional cost components by the respective total units of service requirements
develops unit costs of operation and maintenance expense, and net capital costs. Figure 14 presents
this process in an illustrative manner.
C ustomer C la ss F low B OD T S S C ustomers
E quiva lent
Meters
R es idential 56.6% 36.8% 50.4% 94.0% 77.7%
G eneral 39.0% 30.6% 41.2% 6.0% 22.3%
Wholes ale 4.4% 3.4% 4.7% 0.0% 0.0%
S urcharge 0.0% 29.2% 3.7% 0.0% 0.0%
T ota l 100.0% 100.0% 100.0% 100.0% 100.0%
C ustomer C la ss F low B OD T S S C ustomers
E quiva lent
Meters T ota l
R es idential 40.4% 3.1% 3.8% 11.7% 0.3% 59.3%
G eneral 27.8% 2.5% 3.1% 0.7% 0.1% 34.3%
Wholes ale 3.2% 0.3% 0.3% 0.0% 0.0% 3.8%
S urcharge 0.0% 2.4% 0.3% 0.0% 0.0% 2.7%
T ota l 71.3% 8.3% 7.5% 12.4% 0.4% 100.0%
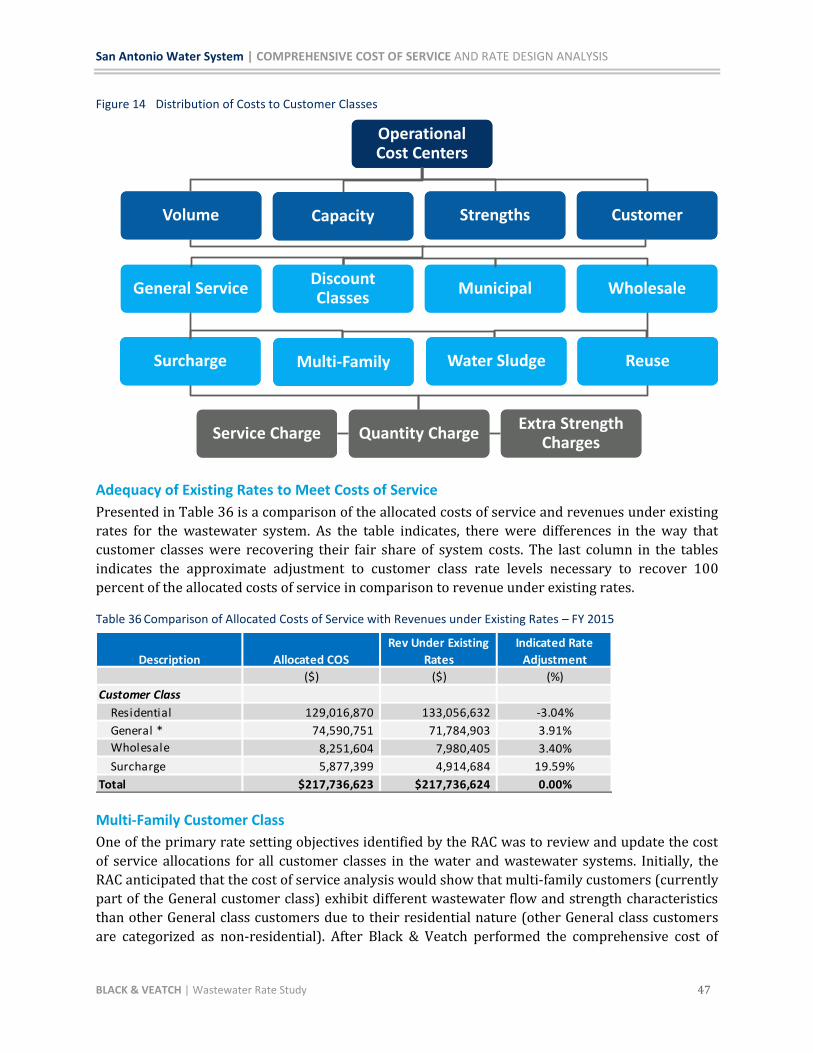
San Antonio Water System | COMPREHENSIVE COST OF SERVICE AND RATE DESIGN ANALYSIS
BLACK & VEATCH | Wastewater Rate Study 47
Figure 14 Distribution of Costs to Customer Classes
Adequacy of Existing Rates to Meet Costs of Service
Presented in Table 36 is a comparison of the allocated costs of service and revenues under existing
rates for the wastewater system. As the table indicates, there were differences in the way that
customer classes were recovering their fair share of system costs. The last column in the tables
indicates the approximate adjustment to customer class rate levels necessary to recover 100
percent of the allocated costs of service in comparison to revenue under existing rates.
Table 36 Comparison of Allocated Costs of Service with Revenues under Existing Rates – FY 2015
Multi-Family Customer Class
One of the primary rate setting objectives identified by the RAC was to review and update the cost
of service allocations for all customer classes in the water and wastewater systems. Initially, the
RAC anticipated that the cost of service analysis would show that multi-family customers (currently
part of the General customer class) exhibit different wastewater flow and strength characteristics
than other General class customers due to their residential nature (other General class customers
are categorized as non-residential). After Black & Veatch performed the comprehensive cost of
Operational Cost Centers
Volume Capacity Strengths Customer
General Service Municipal
Service Charge Quantity ChargeExtra Strength
Charges
WholesaleDiscountClasses
Surcharge ReuseWater SludgeMulti-Family
($) ($) (%)
Customer Class
Residential 129,016,870 133,056,632 -3.04%
General * 74,590,751 71,784,903 3.91%
Wholesale 8,251,604 7,980,405 3.40%
Surcharge 5,877,399 4,914,684 19.59%
Total $217,736,623 $217,736,624 0.00%
Indicated Rate
AdjustmentDescription Allocated COS
Rev Under Existing
Rates
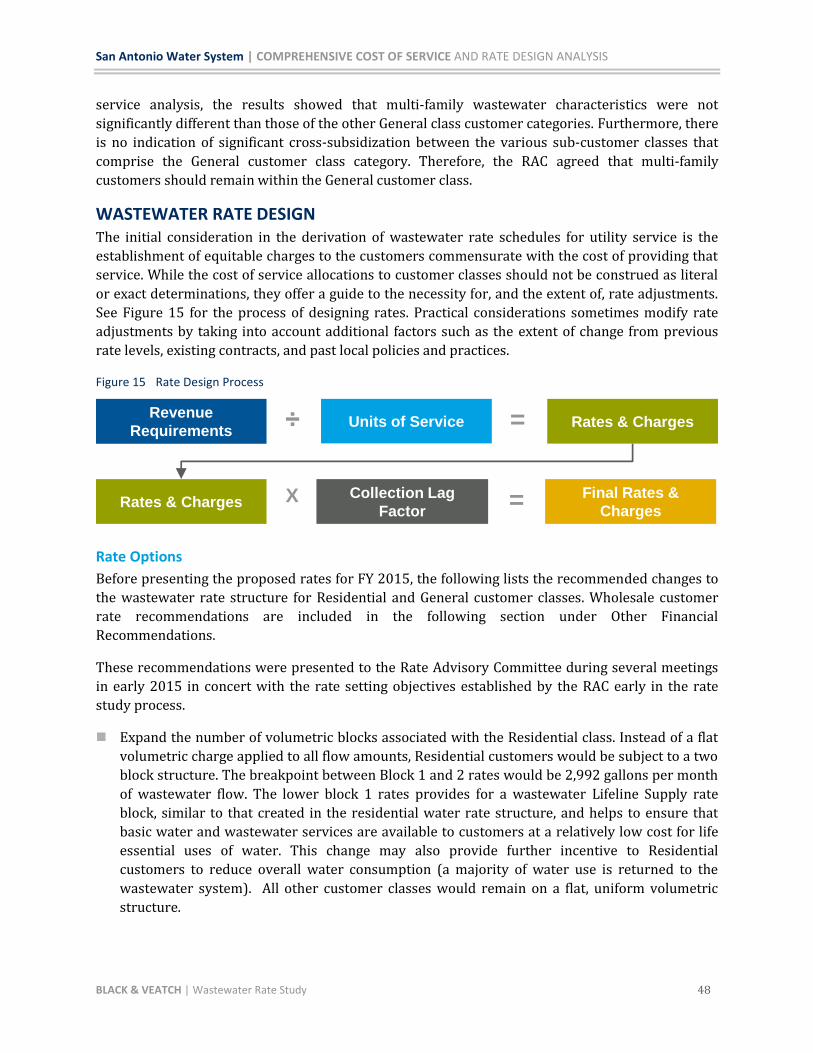
San Antonio Water System | COMPREHENSIVE COST OF SERVICE AND RATE DESIGN ANALYSIS
BLACK & VEATCH | Wastewater Rate Study 48
service analysis, the results showed that multi-family wastewater characteristics were not
significantly different than those of the other General class customer categories. Furthermore, there
is no indication of significant cross-subsidization between the various sub-customer classes that
comprise the General customer class category. Therefore, the RAC agreed that multi-family
customers should remain within the General customer class.
WASTEWATER RATE DESIGN The initial consideration in the derivation of wastewater rate schedules for utility service is the
establishment of equitable charges to the customers commensurate with the cost of providing that
service. While the cost of service allocations to customer classes should not be construed as literal
or exact determinations, they offer a guide to the necessity for, and the extent of, rate adjustments.
See Figure 15 for the process of designing rates. Practical considerations sometimes modify rate
adjustments by taking into account additional factors such as the extent of change from previous
rate levels, existing contracts, and past local policies and practices.
Figure 15 Rate Design Process
Rate Options
Before presenting the proposed rates for FY 2015, the following lists the recommended changes to
the wastewater rate structure for Residential and General customer classes. Wholesale customer
rate recommendations are included in the following section under Other Financial
Recommendations.
These recommendations were presented to the Rate Advisory Committee during several meetings
in early 2015 in concert with the rate setting objectives established by the RAC early in the rate
study process.
Expand the number of volumetric blocks associated with the Residential class. Instead of a flat
volumetric charge applied to all flow amounts, Residential customers would be subject to a two
block structure. The breakpoint between Block 1 and 2 rates would be 2,992 gallons per month
of wastewater flow. The lower block 1 rates provides for a wastewater Lifeline Supply rate
block, similar to that created in the residential water rate structure, and helps to ensure that
basic water and wastewater services are available to customers at a relatively low cost for life
essential uses of water. This change may also provide further incentive to Residential
customers to reduce overall water consumption (a majority of water use is returned to the
wastewater system). All other customer classes would remain on a flat, uniform volumetric
structure.
Units of Service Revenue
Requirements
Rates & Charges
=
Collection Lag
Factor
Rates & Charges
X = Final Rates &
Charges
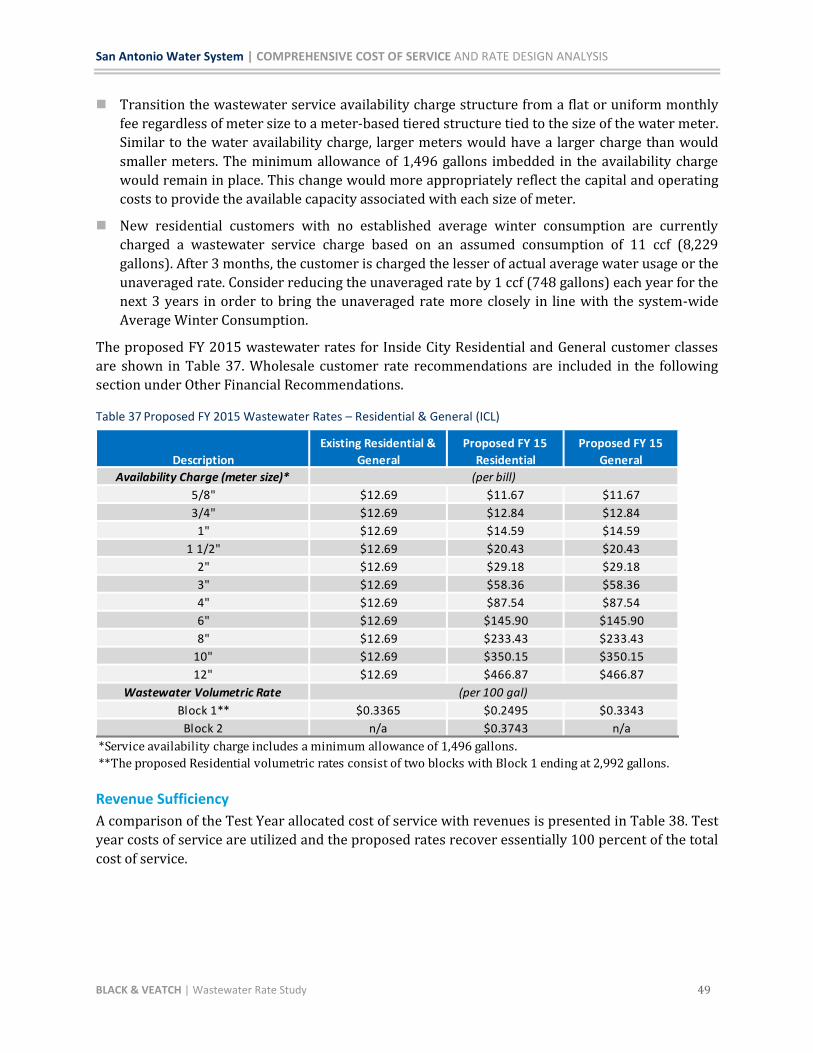
San Antonio Water System | COMPREHENSIVE COST OF SERVICE AND RATE DESIGN ANALYSIS
BLACK & VEATCH | Wastewater Rate Study 49
Transition the wastewater service availability charge structure from a flat or uniform monthly
fee regardless of meter size to a meter-based tiered structure tied to the size of the water meter.
Similar to the water availability charge, larger meters would have a larger charge than would
smaller meters. The minimum allowance of 1,496 gallons imbedded in the availability charge
would remain in place. This change would more appropriately reflect the capital and operating
costs to provide the available capacity associated with each size of meter.
New residential customers with no established average winter consumption are currently
charged a wastewater service charge based on an assumed consumption of 11 ccf (8,229
gallons). After 3 months, the customer is charged the lesser of actual average water usage or the
unaveraged rate. Consider reducing the unaveraged rate by 1 ccf (748 gallons) each year for the
next 3 years in order to bring the unaveraged rate more closely in line with the system-wide
Average Winter Consumption.
The proposed FY 2015 wastewater rates for Inside City Residential and General customer classes
are shown in Table 37. Wholesale customer rate recommendations are included in the following
section under Other Financial Recommendations.
Table 37 Proposed FY 2015 Wastewater Rates – Residential & General (ICL)
Revenue Sufficiency
A comparison of the Test Year allocated cost of service with revenues is presented in Table 38. Test
year costs of service are utilized and the proposed rates recover essentially 100 percent of the total
cost of service.
Availability Charge (meter size)*
5/8" $12.69 $11.67 $11.67
3/4" $12.69 $12.84 $12.84
1" $12.69 $14.59 $14.59
1 1/2" $12.69 $20.43 $20.43
2" $12.69 $29.18 $29.18
3" $12.69 $58.36 $58.36
4" $12.69 $87.54 $87.54
6" $12.69 $145.90 $145.90
8" $12.69 $233.43 $233.43
10" $12.69 $350.15 $350.15
12" $12.69 $466.87 $466.87
Wastewater Volumetric Rate
Block 1** $0.3365 $0.2495 $0.3343
Block 2 n/a $0.3743 n/a
*Service availability charge includes a minimum allowance of 1,496 gallons.
**The proposed Residential volumetric rates consist of two blocks with Block 1 ending at 2,992 gallons.
Description
Existing Residential &
General
Proposed FY 15
Residential
Proposed FY 15
General
(per bill)
(per 100 gal)
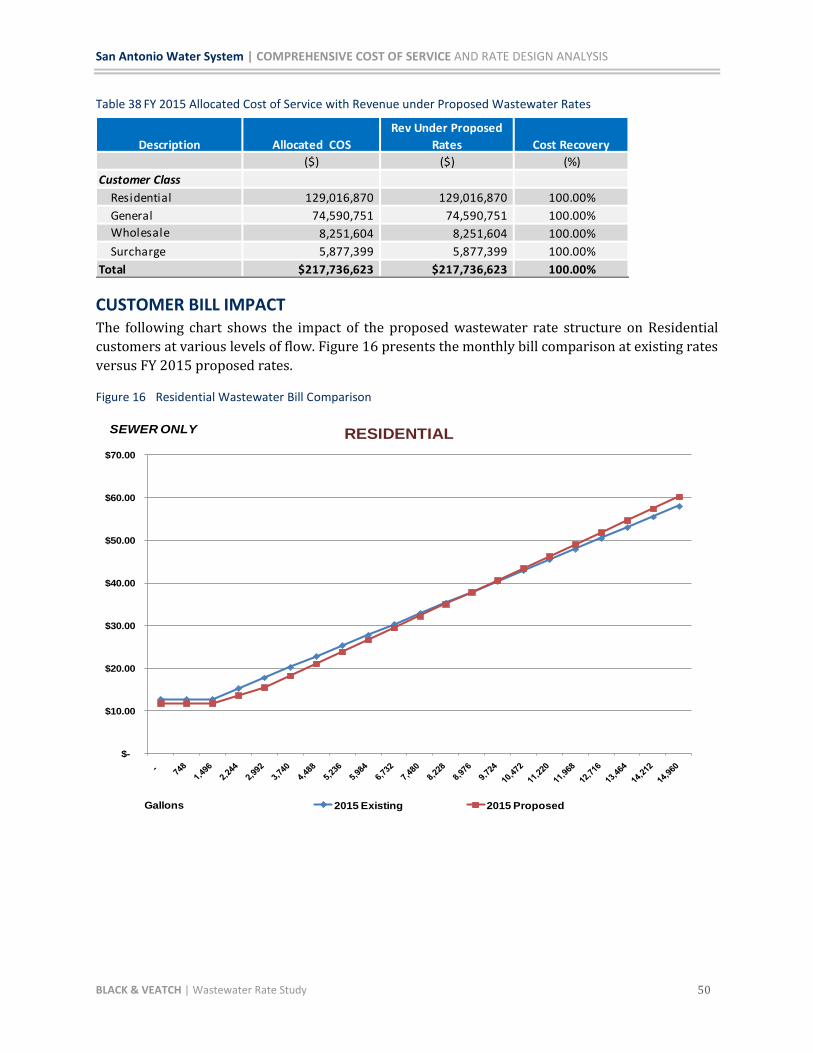
San Antonio Water System | COMPREHENSIVE COST OF SERVICE AND RATE DESIGN ANALYSIS
BLACK & VEATCH | Wastewater Rate Study 50
Table 38 FY 2015 Allocated Cost of Service with Revenue under Proposed Wastewater Rates
CUSTOMER BILL IMPACT The following chart shows the impact of the proposed wastewater rate structure on Residential
customers at various levels of flow. Figure 16 presents the monthly bill comparison at existing rates
versus FY 2015 proposed rates.
Figure 16 Residential Wastewater Bill Comparison
($) ($) (%)
Customer Class
Residential 129,016,870 129,016,870 100.00%
General 74,590,751 74,590,751 100.00%
Wholesale 8,251,604 8,251,604 100.00%
Surcharge 5,877,399 5,877,399 100.00%
Total $217,736,623 $217,736,623 100.00%
Description Allocated COS
Rev Under Proposed
Rates Cost Recovery
$-
$10.00
$20.00
$30.00
$40.00
$50.00
$60.00
$70.00
2015 Existing 2015 Proposed
SEWER ONLY RESIDENTIAL
Gallons
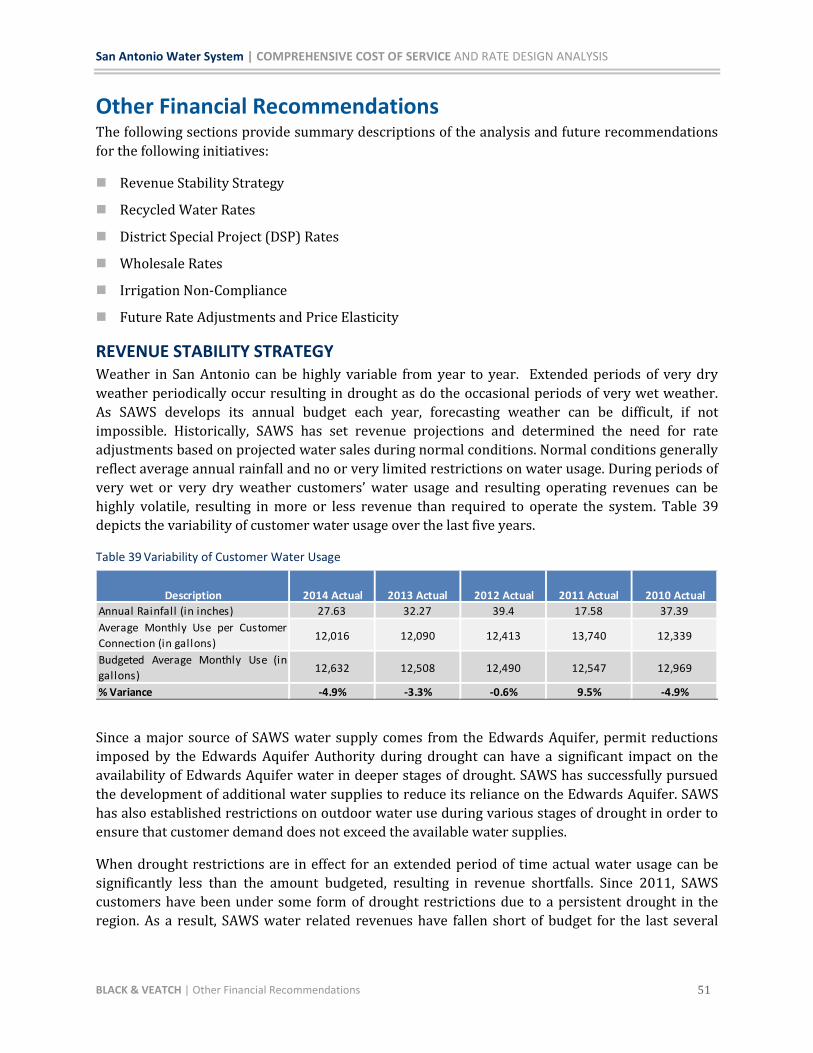
San Antonio Water System | COMPREHENSIVE COST OF SERVICE AND RATE DESIGN ANALYSIS
BLACK & VEATCH | Other Financial Recommendations 51
Other Financial Recommendations The following sections provide summary descriptions of the analysis and future recommendations
for the following initiatives:
Revenue Stability Strategy
Recycled Water Rates
District Special Project (DSP) Rates
Wholesale Rates
Irrigation Non-Compliance
Future Rate Adjustments and Price Elasticity
REVENUE STABILITY STRATEGY Weather in San Antonio can be highly variable from year to year. Extended periods of very dry
weather periodically occur resulting in drought as do the occasional periods of very wet weather.
As SAWS develops its annual budget each year, forecasting weather can be difficult, if not
impossible. Historically, SAWS has set revenue projections and determined the need for rate
adjustments based on projected water sales during normal conditions. Normal conditions generally
reflect average annual rainfall and no or very limited restrictions on water usage. During periods of
very wet or very dry weather customers’ water usage and resulting operating revenues can be
highly volatile, resulting in more or less revenue than required to operate the system. Table 39
depicts the variability of customer water usage over the last five years.
Table 39 Variability of Customer Water Usage
Since a major source of SAWS water supply comes from the Edwards Aquifer, permit reductions
imposed by the Edwards Aquifer Authority during drought can have a significant impact on the
availability of Edwards Aquifer water in deeper stages of drought. SAWS has successfully pursued
the development of additional water supplies to reduce its reliance on the Edwards Aquifer. SAWS
has also established restrictions on outdoor water use during various stages of drought in order to
ensure that customer demand does not exceed the available water supplies.
When drought restrictions are in effect for an extended period of time actual water usage can be
significantly less than the amount budgeted, resulting in revenue shortfalls. Since 2011, SAWS
customers have been under some form of drought restrictions due to a persistent drought in the
region. As a result, SAWS water related revenues have fallen short of budget for the last several
Annual Rainfall (in inches) 27.63 32.27 39.4 17.58 37.39
Average Monthly Use per Customer
Connection (in gallons)12,016 12,090 12,413 13,740 12,339
Budgeted Average Monthly Use (in
gallons)12,632 12,508 12,490 12,547 12,969
% Variance -4.9% -3.3% -0.6% 9.5% -4.9%
Description 2014 Actual 2013 Actual 2012 Actual 2011 Actual 2010 Actual

San Antonio Water System | COMPREHENSIVE COST OF SERVICE AND RATE DESIGN ANALYSIS
BLACK & VEATCH | Other Financial Recommendations 52
years. These shortfalls, if significant, have the potential to negatively impact SAWS financial metrics
and credit ratings.
As SAWS continues to add non-Edwards water supplies, the impact of Edwards Aquifer permit
reductions during drought will have less impact on SAWS total water portfolio, particularly once
the brackish desalination and the Vista Ridge water projects come online during the next five years.
However, very wet weather will continue to reduce customers’ water usage and result in revenue
shortfalls.
Revenue Stability Strategy
SAWS should develop a revenue stability strategy to address revenue volatility associated with
extreme weather. This strategy might include the following:
Reducing the projected amount of water sales when budgeting revenue and determining the
need for rate adjustments in order to minimize the impacts of reduced water usage during very
wet years or dry years with modest drought restrictions.
Automatically adjusting rates during periods when significant drought restrictions are in effect
to further incentivize additional reductions in water usage as well as offset revenue losses from
a significant reduction in customer usage.
RECYCLED WATER SAWS recycled water system is the largest direct-use recycled water system in the nation and is
recognized globally by water policymakers and distinguished water management experts for the
innovative reuse of treated wastewater effluent for irrigation, industrial, and environmental
purposes. Up to 25,000 acre feet of effluent treated at SAWS three recycling centers can be
distributed through the more than 130 miles of pipeline that circles the City in order to provide
high-quality water for use by golf courses, parks, commercial and industrial customers, as well as
San Antonio’s famous River Walk. SAWS has invested millions of dollars in building the necessary
infrastructure to distribute recycled water to customers in an effort to help conserve potable water.
Current Rates and Cost Recovery
The existing recycled water rate structure is comprised of a monthly service availability fee that
varies by meter size and a two-tiered volumetric rate structure. Seasonal volumetric rates apply to
recycled usage between May 1 and September 30th. Standard volumetric rates are applied to usage
in the other months.
SAWS has two different tiered rate structures. SAWS has a few recycled water customers that
transferred their Edwards Aquifer rights (in acre feet or “AF”) to SAWS. In exchange for these
rights, SAWS charges these customers the “Edwards Exchange Customer” Block 1 rate for all usage
that is up to the amount of AF transferred to SAWS. The customer is then assessed the Block 2 rate
for all usage above the AF transferred to SAWS. The majority of SAWS’ customers are Non-Edwards
Exchange Customers. These customers are assessed a tiered standard and seasonal volumetric rate
structure. The Block 1 threshold for these customers is 748,000 gallons. The current rates charged
to recycled water customers are provided in Table 40.

San Antonio Water System | COMPREHENSIVE COST OF SERVICE AND RATE DESIGN ANALYSIS
BLACK & VEATCH | Other Financial Recommendations 53
Table 40 Existing Recycled Water Rates
The total estimated annual cost to operate the recycled water distribution system in 2015 is $9.9
million. This only includes the cost to distribute recycled water to customers and does not include
any of the cost to treat the effluent, which is covered by wastewater rates. Revenue generated by
direct-use recycled customers currently recovers approximately 20% of the operating and capital
costs associated with SAWS’ recycled water distribution system. As a result, approximately 80% of
the recycled water system costs are subsidized by potable water customers.
Table 41 Recycled Water Allocated Costs
Non-exchange recycled water rates are approximately 30% of the potable water rates paid by
general class customers and approximately 10% to 25% of the potable water rates paid by
irrigation class customers. Recycled water users also incur additional costs in order to utilize
recycled water in their industrial or landscape irrigation processes.
Recycled water rates were initially set at levels to incentivize commercial customers to switch from
potable water to recycled water. SAWS currently has some unused capacity in the recycled water
system and continues to pursue potential new recycled customers. If recycled water rates were set
at a level that fully recovered the annual cost of the recycled water system, recycled water rates
would have to increase nearly 500%, at which point recycled water customers would likely be
paying more for water than potable water customers. If the cost of recycled water along with any
additional costs incurred by the customer to utilize recycled water is greater than the cost of
potable water, recycled water customers could decide to switch from recycled water to potable
water.
Availability Charge (meter size)
5/8"
3/4"
1"
1 1/2"
2"
3"
4"
6"
8"
10"
12"
Supply & Delivery Volumetric Rate Threshold (per 100 gal) Threshold (gal) (per 100 gal)
Block 1 Transferred $0.0250 748,000 $0.1004 - $0.1079
Block 2 Excess $0.0938 - $0.0997 Above $0.1026 - $0.1089
$99.61 $99.61
$148.06 $148.06
$720.27 $720.27
$282.44 $282.44
$425.73 $425.73
$583.77 $583.77
$16.11 $16.11
$25.61 $25.61
$37.45 $37.45
$12.37 $12.37
$9.51 $9.51
Description Existing Existing
(per bill) (per bill)
Edwards Exchange Customers Non-Edwards Exchange Customers
$9,876,229 $2,031,576 20.6% $7,844,653
Allocated Costs
Revenus Under Existing
Rates Cost Recovery % Unrecovered Costs
San Antonio Water System | COMPREHENSIVE COST OF SERVICE AND RATE DESIGN ANALYSIS
BLACK & VEATCH | Other Financial Recommendations 54
Recommendations
The objective should be to set recycled water rates at a level that both maximizes cost recovery and
ensures that customers view recycled water as an economically viable alternative to potable water.
Understanding the manner in which existing customers utilize recycled water as well as the
additional costs incurred by those customers is critical to determining the appropriate level for
recycled water rates.
In order to meet this objective, SAWS should form a user group of recycled water customers within
the next 12 months to study possible recycled water rate structure modifications. These
modifications may include the development of separate recycled water rates for industrial use and
irrigation use. Until final recommendations are developed and approved, adjusting recycled water
rates annually based on the average adjustments applied to potable water rates will ensure that the
percentage of costs recovered and the relative differences between recycled and potable water
rates do not deteriorate. As long as full cost recovery is not achievable, potable water users must
continue to subsidize recycled water users; however, the amount of recycled costs being subsidized
by potable water users is less than the cost associated with replacing recycled water with a potable
water source.
SAN ANTONIO WATER SYSTEM - DISTRICT SPECIAL PROJECT RATES San Antonio Water System – District Special Project (DSP) was created on January 28, 2012 upon
the dissolution of Bexar Metropolitan Water District (BexarMet). DSP includes all water resources,
properties, facilities, and plants relating to the supply, storage, treatment, transmission, and
distribution of treated potable water for customers located in the former BexarMet service area.
SAWS DSP provides potable water service to more than 101,000 customer connections.
DSP has been fully integrated into SAWS for operational purposes but remains a separate legal
entity under the management of SAWS. DSP customers pay rates for water service based on the
rates established by the former BexarMet at the time BexarMet was dissolved. By state law, SAWS
and SAWS DSP are required to be fully integrated by January 1, 2017 unless an extension is
requested from the Texas Commission on Environmental Quality (TCEQ) of no more than 3 years.
Full integration is considered to be achieved when DSP no longer operates as a separate legal entity
and the customers of both SAWS and DSP pay the same rates for water service (“rate
consolidation”).
The San Antonio City Council ordinance that provided for the creation of DSP stipulates that the
integration of DSP should have no adverse impact to SAWS customers. If DSP customers had been
converted to SAWS rates for water service at the time that BexarMet was dissolved in 2012, annual
revenue generated would have been approximately $19 million less than revenue generated under
the existing BexarMet rates. Additionally, if the outstanding BexarMet debt had been refunded at
that time with SAWS debt, a condition necessary to eliminate the SAWS DSP entity, an additional
loss of $12 million would have been incurred. Both of these actions would have had a significant
detrimental financial impact to SAWS customers. Therefore, SAWS announced its intention to hold
the DSP rates constant until such time as the DSP cost structure could be reduced and rates charged
to SAWS water customers could catch up more closely to the DSP rates. The current rates charged
to DSP customers are provided in Appendix C.
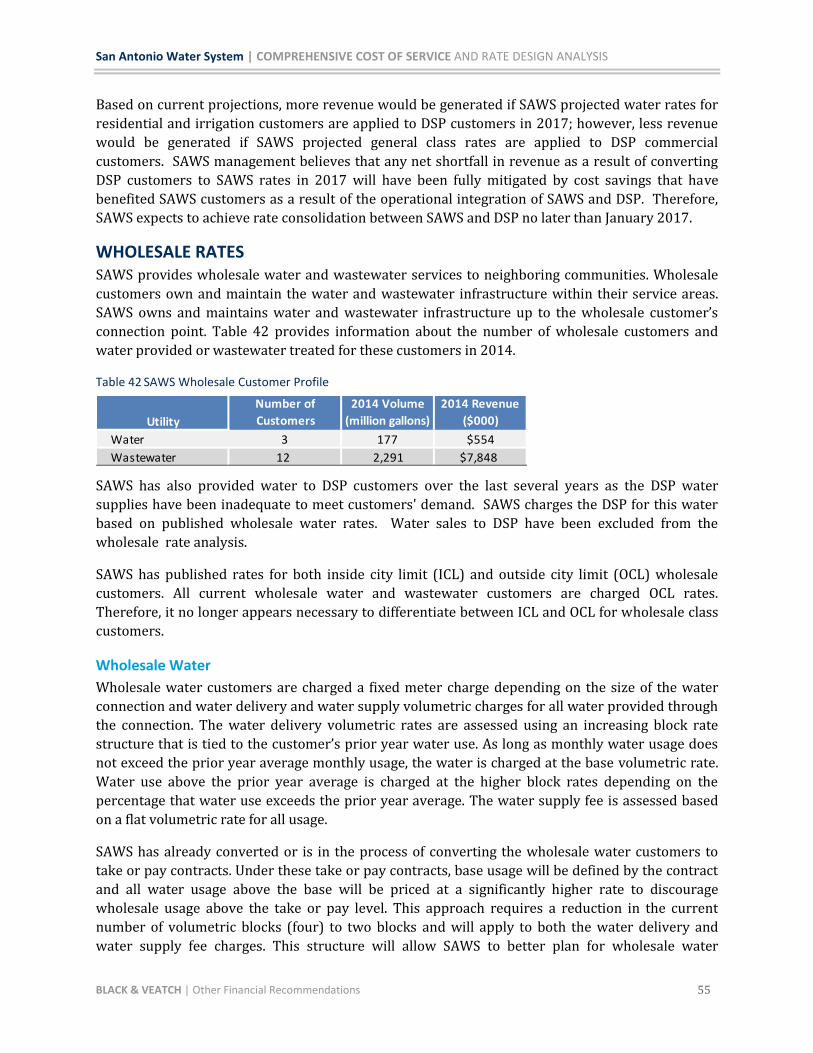
San Antonio Water System | COMPREHENSIVE COST OF SERVICE AND RATE DESIGN ANALYSIS
BLACK & VEATCH | Other Financial Recommendations 55
Based on current projections, more revenue would be generated if SAWS projected water rates for
residential and irrigation customers are applied to DSP customers in 2017; however, less revenue
would be generated if SAWS projected general class rates are applied to DSP commercial
customers. SAWS management believes that any net shortfall in revenue as a result of converting
DSP customers to SAWS rates in 2017 will have been fully mitigated by cost savings that have
benefited SAWS customers as a result of the operational integration of SAWS and DSP. Therefore,
SAWS expects to achieve rate consolidation between SAWS and DSP no later than January 2017.
WHOLESALE RATES SAWS provides wholesale water and wastewater services to neighboring communities. Wholesale
customers own and maintain the water and wastewater infrastructure within their service areas.
SAWS owns and maintains water and wastewater infrastructure up to the wholesale customer’s
connection point. Table 42 provides information about the number of wholesale customers and
water provided or wastewater treated for these customers in 2014.
Table 42 SAWS Wholesale Customer Profile
SAWS has also provided water to DSP customers over the last several years as the DSP water
supplies have been inadequate to meet customers' demand. SAWS charges the DSP for this water
based on published wholesale water rates. Water sales to DSP have been excluded from the
wholesale rate analysis.
SAWS has published rates for both inside city limit (ICL) and outside city limit (OCL) wholesale
customers. All current wholesale water and wastewater customers are charged OCL rates.
Therefore, it no longer appears necessary to differentiate between ICL and OCL for wholesale class
customers.
Wholesale Water
Wholesale water customers are charged a fixed meter charge depending on the size of the water
connection and water delivery and water supply volumetric charges for all water provided through
the connection. The water delivery volumetric rates are assessed using an increasing block rate
structure that is tied to the customer’s prior year water use. As long as monthly water usage does
not exceed the prior year average monthly usage, the water is charged at the base volumetric rate.
Water use above the prior year average is charged at the higher block rates depending on the
percentage that water use exceeds the prior year average. The water supply fee is assessed based
on a flat volumetric rate for all usage.
SAWS has already converted or is in the process of converting the wholesale water customers to
take or pay contracts. Under these take or pay contracts, base usage will be defined by the contract
and all water usage above the base will be priced at a significantly higher rate to discourage
wholesale usage above the take or pay level. This approach requires a reduction in the current
number of volumetric blocks (four) to two blocks and will apply to both the water delivery and
water supply fee charges. This structure will allow SAWS to better plan for wholesale water
Utility
Number of
Customers
2014 Volume
(million gallons)
2014 Revenue
($000)
Water 3 177 $554
Wastewater 12 2,291 $7,848
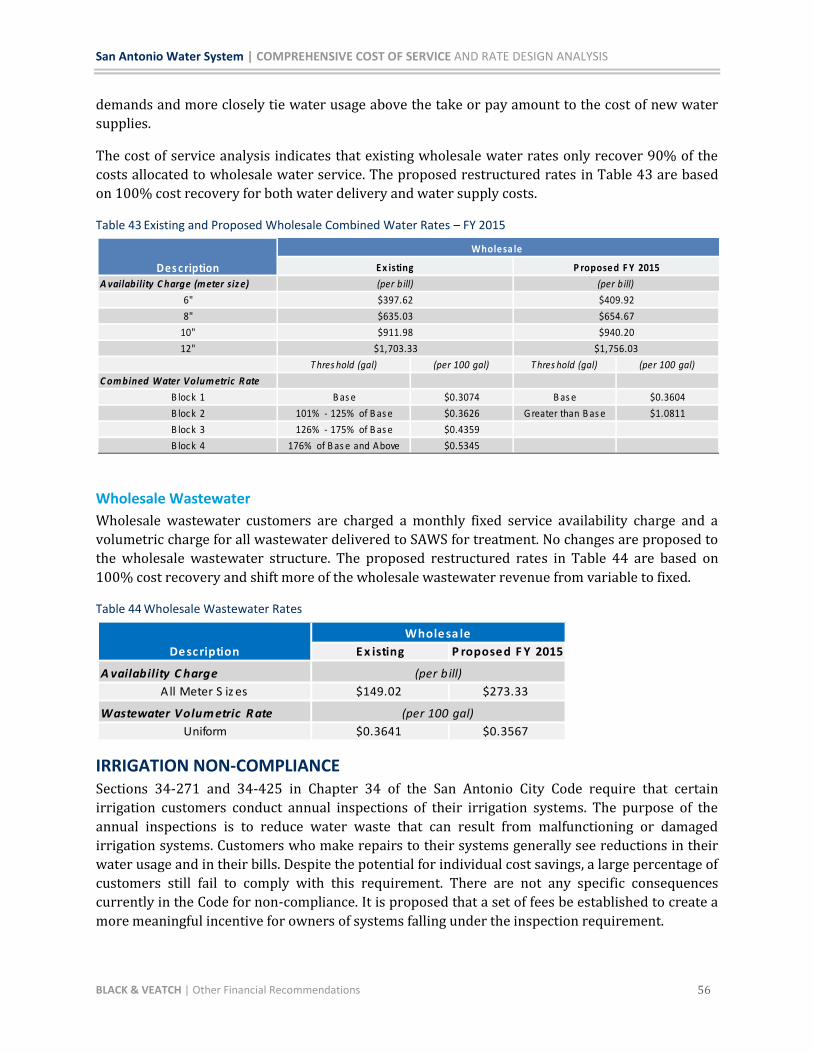
San Antonio Water System | COMPREHENSIVE COST OF SERVICE AND RATE DESIGN ANALYSIS
BLACK & VEATCH | Other Financial Recommendations 56
demands and more closely tie water usage above the take or pay amount to the cost of new water
supplies.
The cost of service analysis indicates that existing wholesale water rates only recover 90% of the
costs allocated to wholesale water service. The proposed restructured rates in Table 43 are based
on 100% cost recovery for both water delivery and water supply costs.
Table 43 Existing and Proposed Wholesale Combined Water Rates – FY 2015
Wholesale Wastewater
Wholesale wastewater customers are charged a monthly fixed service availability charge and a
volumetric charge for all wastewater delivered to SAWS for treatment. No changes are proposed to
the wholesale wastewater structure. The proposed restructured rates in Table 44 are based on
100% cost recovery and shift more of the wholesale wastewater revenue from variable to fixed.
Table 44 Wholesale Wastewater Rates
IRRIGATION NON-COMPLIANCE Sections 34-271 and 34-425 in Chapter 34 of the San Antonio City Code require that certain
irrigation customers conduct annual inspections of their irrigation systems. The purpose of the
annual inspections is to reduce water waste that can result from malfunctioning or damaged
irrigation systems. Customers who make repairs to their systems generally see reductions in their
water usage and in their bills. Despite the potential for individual cost savings, a large percentage of
customers still fail to comply with this requirement. There are not any specific consequences
currently in the Code for non-compliance. It is proposed that a set of fees be established to create a
more meaningful incentive for owners of systems falling under the inspection requirement.
A vailability C harge (meter siz e)
6"
8"
10"
12"
T hres hold (gal) (per 100 gal) T hres hold (gal) (per 100 gal)
C ombined Water Volumetric R ate
B lock 1 B as e $0.3074 B as e $0.3604
B lock 2 101% - 125% of B as e $0.3626 G reater than B as e $1.0811
B lock 3 126% - 175% of B as e $0.4359
B lock 4 176% of B as e and Above $0.5345
$397.62
$635.03
$911.98
$1,703.33
Wholesa le
(per b ill)
$409.92
$654.67
$940.20
$1,756.03
Des cription E x isting P roposed F Y 2015
(per b ill)
E x isting P roposed F Y 2015
A vailability C harge
All Meter S iz es $149.02 $273.33
Wastewater Volum etric R ate
Uniform $0.3641 $0.3567
(per 100 gal)
Desc ription
Wholesa le
(per b ill)

San Antonio Water System | COMPREHENSIVE COST OF SERVICE AND RATE DESIGN ANALYSIS
BLACK & VEATCH | Other Financial Recommendations 57
Specifically, the annual inspection requirement applies to irrigation customers who meet either of
the following criteria:
Large Property Customers: Owners of five-acre properties which have irrigation systems
covering all or a portion of each property, or
Large Use Customers: Owners of irrigation systems that use one million gallons or more of
water annually.
Approximately 2,500 customers meet these criteria. The City Code requires that inspections from
these customers be submitted to SAWS by May 1 of each year. As of August 2014, the rate of non-
compliance with this requirement was 60.5%. In order to encourage compliance with the
requirements and recover the costs associated with non-compliance the following
recommendations are made:
Assess a fee of $160 when a customer fails to conduct the annually required inspection in order
to recover the enforcement costs incurred by SAWS to identify irrigation system owners who
are not complying with the requirement. This fee would continue to be assessed on an annual
basis for as long as the owner is non-compliant.
Assess an additional volumetric fee of $0.0969 per 100 gallons be applied to monthly water use
by the non-compliant customer’s irrigation system for so long as the inspection of the system is
not performed or repairs identified by the inspection are not completed. This additional
volumetric charge approximates the true cost of water estimated to be wasted by inefficient
irrigation systems.
FUTURE RATE ADJUSTMENTS AND PRICE ELASTICITY Although this report does not show the overall analysis beyond FY 2015, the analysis performed
does show that rate revenue increases will likely be needed each year of the FY 2016 through FY
2020 period due to capital requirements associated with maintaining and expanding water and
wastewater infrastructure as well as the development of additional water supplies. The biggest
impact on future rates over this five year horizon will likely be associated with wastewater
infrastructure improvements required under the consent decree with the Environmental
Protection Agency and the Vista Ridge water supply project that is projected to begin delivery
water to San Antonio by 2019 or 2020. The Vista Ridge project will result in significant operating
and capital related costs, some of which may be offset by the sale of Vista Ridge water to other
water retailers. The project will provide significant benefit to SAWS customers as a result of locking
in a significant long-term, drought resistant water source at today’s prices and reducing San
Antonio’s reliance on the Edwards Aquifer.
The economic theory of elasticity is one whereby any movement in price of a good or service will
affect a corresponding movement in demand of the good or service. In the case of water rates, this
relationship is an inverse one, meaning that any increase in water rates typically translates to a
decrease in water consumption. For example, a 10% increase in water rates may have the effect of
reducing water consumption by 5%. There have been numerous studies of this relationship
performed by utility economists yet there is wide disagreement of the precise factors a utility
should use.
San Antonio Water System | COMPREHENSIVE COST OF SERVICE AND RATE DESIGN ANALYSIS
BLACK & VEATCH | Other Financial Recommendations 58
The recommended course of action when incorporating elasticity into a rate design model is to
examine consumption responses to past rate increases and to choose elasticity factors within the
ranges produced by the economic studies. Black & Veatch has incorporated price elasticity of
demand factors into the multi-year financial model. This will allow SAWS to adjust projected
customer demand in future years to account for customers’ response to future rate adjustments to
both water and wastewater rates. In order to ensure that projected revenue requirements are fully
recovered and financial stability maintained, properly assessing the appropriate elasticity factors to
apply to customer demand will be critical when evaluating the need for rate adjustments in the
future.
San Antonio Water System | COMPREHENSIVE COST OF SERVICE AND RATE DESIGN ANALYSIS
BLACK & VEATCH | Appendix A - Affordability Program Analysis 59
Appendix A - Affordability Program Analysis
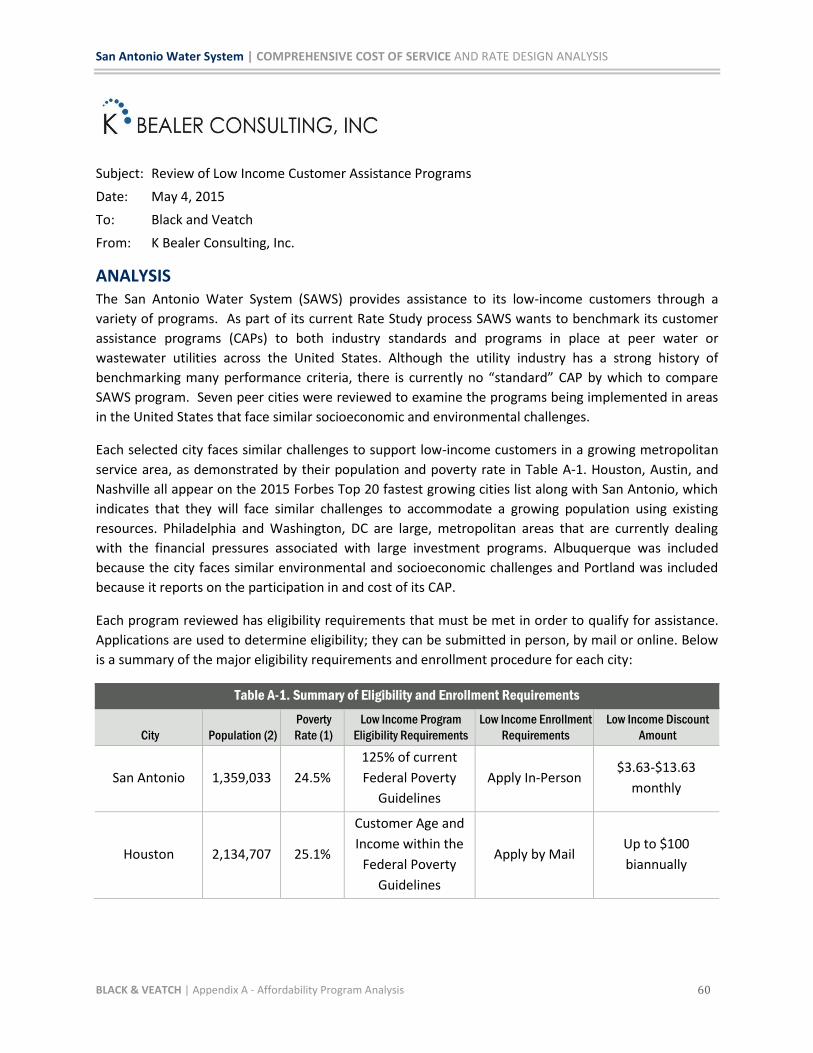
San Antonio Water System | COMPREHENSIVE COST OF SERVICE AND RATE DESIGN ANALYSIS
BLACK & VEATCH | Appendix A - Affordability Program Analysis 60
Subject: Review of Low Income Customer Assistance Programs
Date: May 4, 2015
To: Black and Veatch
From: K Bealer Consulting, Inc.
ANALYSIS The San Antonio Water System (SAWS) provides assistance to its low-income customers through a
variety of programs. As part of its current Rate Study process SAWS wants to benchmark its customer
assistance programs (CAPs) to both industry standards and programs in place at peer water or
wastewater utilities across the United States. Although the utility industry has a strong history of
benchmarking many performance criteria, there is currently no “standard” CAP by which to compare
SAWS program. Seven peer cities were reviewed to examine the programs being implemented in areas
in the United States that face similar socioeconomic and environmental challenges.
Each selected city faces similar challenges to support low-income customers in a growing metropolitan
service area, as demonstrated by their population and poverty rate in Table A-1. Houston, Austin, and
Nashville all appear on the 2015 Forbes Top 20 fastest growing cities list along with San Antonio, which
indicates that they will face similar challenges to accommodate a growing population using existing
resources. Philadelphia and Washington, DC are large, metropolitan areas that are currently dealing
with the financial pressures associated with large investment programs. Albuquerque was included
because the city faces similar environmental and socioeconomic challenges and Portland was included
because it reports on the participation in and cost of its CAP.
Each program reviewed has eligibility requirements that must be met in order to qualify for assistance.
Applications are used to determine eligibility; they can be submitted in person, by mail or online. Below
is a summary of the major eligibility requirements and enrollment procedure for each city:
Table A-1. Summary of Eligibility and Enrollment Requirements
City
Population (2)
Poverty
Rate (1)
Low Income Program
Eligibility Requirements
Low Income Enrollment
Requirements
Low Income Discount
Amount
San Antonio 1,359,033 24.5%
125% of current
Federal Poverty
Guidelines
Apply In-Person $3.63-$13.63
monthly
Houston 2,134,707 25.1%
Customer Age and
Income within the
Federal Poverty
Guidelines
Apply by Mail Up to $100
biannually
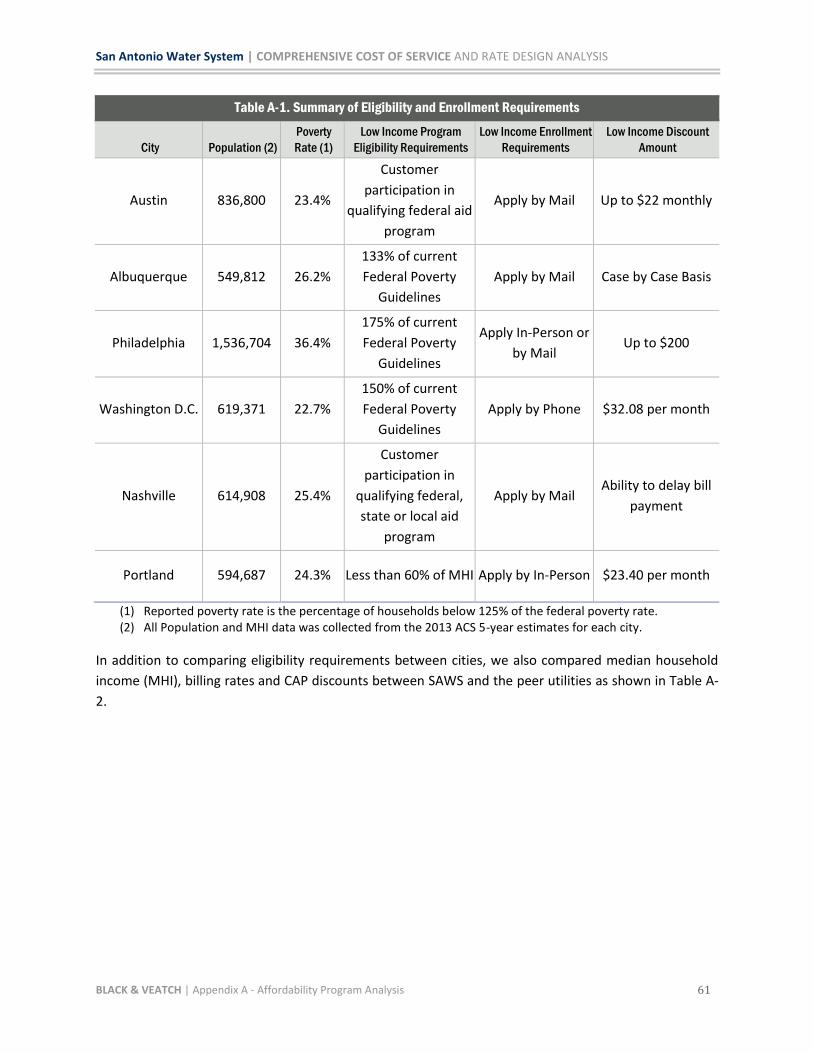
San Antonio Water System | COMPREHENSIVE COST OF SERVICE AND RATE DESIGN ANALYSIS
BLACK & VEATCH | Appendix A - Affordability Program Analysis 61
Table A-1. Summary of Eligibility and Enrollment Requirements
City
Population (2)
Poverty
Rate (1)
Low Income Program
Eligibility Requirements
Low Income Enrollment
Requirements
Low Income Discount
Amount
Austin 836,800 23.4%
Customer
participation in
qualifying federal aid
program
Apply by Mail Up to $22 monthly
Albuquerque 549,812 26.2%
133% of current
Federal Poverty
Guidelines
Apply by Mail Case by Case Basis
Philadelphia 1,536,704 36.4%
175% of current
Federal Poverty
Guidelines
Apply In-Person or
by Mail Up to $200
Washington D.C. 619,371 22.7%
150% of current
Federal Poverty
Guidelines
Apply by Phone $32.08 per month
Nashville 614,908 25.4%
Customer
participation in
qualifying federal,
state or local aid
program
Apply by Mail Ability to delay bill
payment
Portland 594,687 24.3% Less than 60% of MHI Apply by In-Person $23.40 per month
(1) Reported poverty rate is the percentage of households below 125% of the federal poverty rate. (2) All Population and MHI data was collected from the 2013 ACS 5-year estimates for each city.
In addition to comparing eligibility requirements between cities, we also compared median household
income (MHI), billing rates and CAP discounts between SAWS and the peer utilities as shown in Table A-
2.
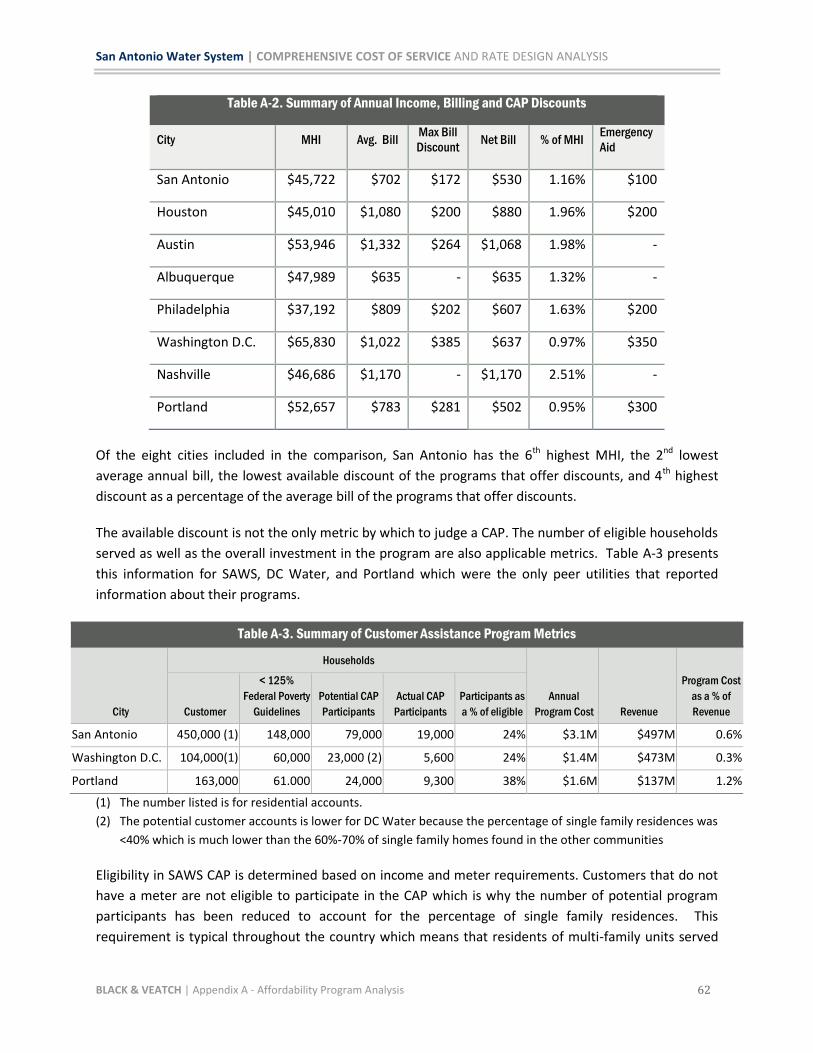
San Antonio Water System | COMPREHENSIVE COST OF SERVICE AND RATE DESIGN ANALYSIS
BLACK & VEATCH | Appendix A - Affordability Program Analysis 62
Table A-2. Summary of Annual Income, Billing and CAP Discounts
City MHI Avg. Bill Max Bill
Discount Net Bill % of MHI
Emergency
Aid
San Antonio $45,722 $702 $172 $530 1.16% $100
Houston $45,010 $1,080 $200 $880 1.96% $200
Austin $53,946 $1,332 $264 $1,068 1.98% -
Albuquerque $47,989 $635 - $635 1.32% -
Philadelphia $37,192 $809 $202 $607 1.63% $200
Washington D.C. $65,830 $1,022 $385 $637 0.97% $350
Nashville $46,686 $1,170 - $1,170 2.51% -
Portland $52,657 $783 $281 $502 0.95% $300
Of the eight cities included in the comparison, San Antonio has the 6th highest MHI, the 2nd lowest
average annual bill, the lowest available discount of the programs that offer discounts, and 4th highest
discount as a percentage of the average bill of the programs that offer discounts.
The available discount is not the only metric by which to judge a CAP. The number of eligible households
served as well as the overall investment in the program are also applicable metrics. Table A-3 presents
this information for SAWS, DC Water, and Portland which were the only peer utilities that reported
information about their programs.
Table A-3. Summary of Customer Assistance Program Metrics
City
Households
Annual
Program Cost Revenue
Program Cost
as a % of
Revenue Customer
< 125%
Federal Poverty
Guidelines
Potential CAP
Participants
Actual CAP
Participants
Participants as
a % of eligible
San Antonio 450,000 (1) 148,000 79,000 19,000 24% $3.1M $497M 0.6%
Washington D.C. 104,000(1) 60,000 23,000 (2) 5,600 24% $1.4M $473M 0.3%
Portland 163,000 61.000 24,000 9,300 38% $1.6M $137M 1.2%
(1) The number listed is for residential accounts.
(2) The potential customer accounts is lower for DC Water because the percentage of single family residences was
<40% which is much lower than the 60%-70% of single family homes found in the other communities
Eligibility in SAWS CAP is determined based on income and meter requirements. Customers that do not
have a meter are not eligible to participate in the CAP which is why the number of potential program
participants has been reduced to account for the percentage of single family residences. This
requirement is typical throughout the country which means that residents of multi-family units served
San Antonio Water System | COMPREHENSIVE COST OF SERVICE AND RATE DESIGN ANALYSIS
BLACK & VEATCH | Appendix A - Affordability Program Analysis 63
by a single meter are ineligible for participation in CAPs except in situations where water may be
provided by a multiple utility provider, such as the Los Angeles Department of Water and Power. Their
customers are billed for both water and power by the same utility, so it is possible to identify low
income customers through their metered power service and provide them with assistance for their
water bills, even though they are not served by an individual water meter.
Although there is limited data available to benchmark SAWS CAP to either an industry standard or to
peer utilities, from the information that is available it appears that the assistance programs available to
SAWS customers are in line with the CAPs available to customers at peer utilities.
FINDING AND RECOMMENDATION
Finding
The SAWS programs share many similarities with the programs reviewed in this memo, except for the
application process required for certain SAWS assistance programs. SAWS requires that customers apply
in-person through a visit to a case worker at the City’s Human Services Department for assistance from
the Project Agua, Plumbers to People and Laterals to People programs, which is not required by any of
the other cities. The addition of an office visit during the application process could be a barrier to
participation for low-income customers (i.e. those who have limited transportation options or a fear of
entering the City’s Human Services Department). Applications for other SAWS CAPs may be made by
mail or fax machine.
Recommendation
SAWS should expand the application process for the Project Agua, Plumbers to People, and Laterals to
People programs. Allowing customers to initiate the process via a bill insert, on-line, or over the phone
has the potential to increase participation. Low-income residents who might otherwise not be able to
apply in person could now have access to this program. In 2014, SAWS transferred $263,160 to the City
of San Antonio for program administration. Expanding the application process has the potential to
increase program participation without increasing the administrative costs of the program.
San Antonio Water System | COMPREHENSIVE COST OF SERVICE AND RATE DESIGN ANALYSIS
BLACK & VEATCH | Appendix A - Affordability Program Analysis 64
SAWS SUMMARY The San Antonio Water System serves residents of the City of San Antonio and other surrounding areas.
The City has a population of 1,359,033 with a MHI of $45,7221. Approximately 24.5% of city residents fall
below 125% of the poverty guidelines established by the United States Department of Health and
Human Services. The water system serves more than 1.6 million people in Bexar County, as well as parts
of Medina and Atascosa counties. This includes more than 473,000 water customers and 420,000
wastewater customers.
SAWS offers a variety of affordability programs to reduce the burden of utility costs for customers who
qualify. The Affordability Programs include: Project Agua, Plumbers to People, Affordability Discount,
Senior Citizen Billing Program, Disability Billing Program, and the Courtesy Notice Program. In order to
qualify for a program customers must meet certain eligibility requirements. These requirements are
specific to the program and generally require participants to fall either within a certain age or within the
income guidelines determined by the City of San Antonio Department of Human Services.
SAWS Programs Summary
Project Agua
Project Agua is designed to provide one-time assistance to residential SAWS customers who are having
difficulty paying their water bill and who meet Federal Income Assistance Guidelines. Funds for this
program are provided by voluntary contributions from SAWS customers (residential and commercial)
and SAWS employees.
In order to qualify for the program customers must meet certain eligibility requirements. These
requirements may include income, family size, age, location of residence, disability, and degree of need
or emergency. Requirements are determined by the City of San Antonio Department of Human Services.
For customers to apply they must contact Human Services by phone and locate an office nearest them.
Plumbers to People
The Plumbers to People Program provides assistance to low-income residential customers seeking
repairs for leaking plumbing fixtures in their homes. SAWS water customers (wastewater-only do not
qualify) that are the occupant and owner of the home in which they reside are eligible for the program.
In addition, customers must meet the income eligibility requirements established by the City of San
Antonio Department of Human Services. There is a corresponding wastewater-related program called
“Laterals to People” that has similar eligibility requirements.
1 2009-2013 American Community Survey 5-Year Estimates
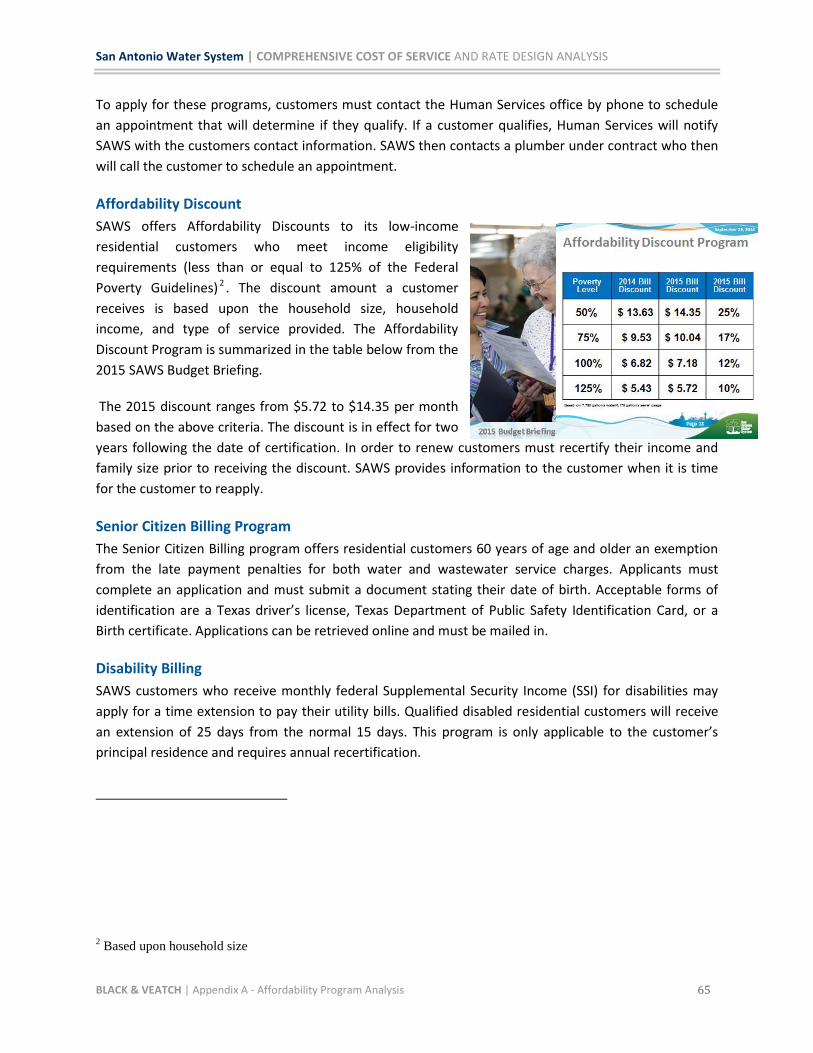
San Antonio Water System | COMPREHENSIVE COST OF SERVICE AND RATE DESIGN ANALYSIS
BLACK & VEATCH | Appendix A - Affordability Program Analysis 65
To apply for these programs, customers must contact the Human Services office by phone to schedule
an appointment that will determine if they qualify. If a customer qualifies, Human Services will notify
SAWS with the customers contact information. SAWS then contacts a plumber under contract who then
will call the customer to schedule an appointment.
Affordability Discount
SAWS offers Affordability Discounts to its low-income
residential customers who meet income eligibility
requirements (less than or equal to 125% of the Federal
Poverty Guidelines) 2 . The discount amount a customer
receives is based upon the household size, household
income, and type of service provided. The Affordability
Discount Program is summarized in the table below from the
2015 SAWS Budget Briefing.
The 2015 discount ranges from $5.72 to $14.35 per month
based on the above criteria. The discount is in effect for two
years following the date of certification. In order to renew customers must recertify their income and
family size prior to receiving the discount. SAWS provides information to the customer when it is time
for the customer to reapply.
Senior Citizen Billing Program
The Senior Citizen Billing program offers residential customers 60 years of age and older an exemption
from the late payment penalties for both water and wastewater service charges. Applicants must
complete an application and must submit a document stating their date of birth. Acceptable forms of
identification are a Texas driver’s license, Texas Department of Public Safety Identification Card, or a
Birth certificate. Applications can be retrieved online and must be mailed in.
Disability Billing
SAWS customers who receive monthly federal Supplemental Security Income (SSI) for disabilities may
apply for a time extension to pay their utility bills. Qualified disabled residential customers will receive
an extension of 25 days from the normal 15 days. This program is only applicable to the customer’s
principal residence and requires annual recertification.
2 Based upon household size

San Antonio Water System | COMPREHENSIVE COST OF SERVICE AND RATE DESIGN ANALYSIS
BLACK & VEATCH | Appendix A - Affordability Program Analysis 66
Applicants must provide certification that they are receiving SSI benefits from the Social Security
Administration (SSA). Applicants have the following items to choose from: Social Security Administration
Notification of Award Letter, Social Security Administration Third Party Query (TPQY), or Social Security
Administration Consent for Release of Information Form. Applications can be retrieved from any SAWS
Customer Service center or by phone call. Completed applications must be mailed in.
Courtesy Notice Program
SAWS Courtesy Notice Program offers residential customers with medical necessity 24 hours’ notice
prior to interruption of service due to nonpayment. Customers eligible for this program must be under a
physician’s care or have a household member residing at the property under a physician’s care and they
must have documentation of medical necessity on file with SAWS.
The applicant must be the account holder and the application must include the medical condition that
exists at home, name of person and relation to account holder for which the service is medically
required and the doctors name, address, telephone and license number. Applications are available at
any SAWS Customer Service center or can be obtained by calling. Applications must be mailed in.
Peer City Programs
Overview
The seven cities chosen for the peer review
were selected to provide a diverse
comparison group for the SAWS program.
Nashville, Houston, and Austin all face similar
population growth demands that will place
pressure on existing infrastructure and rates.
Philadelphia and Washington, DC are large
metropolitan areas that are currently in the
process of constructing and financing large
capital improvement programs. Albuquerque
is the smallest peer city, but the climate and socioeconomic challenges faced by the area are similar to
those of San Antonio. Portland was included because it reports on the participation in and cost of its
CAP. A description of other types of low-income affordability programs can be found in Appendix 2.

San Antonio Water System | COMPREHENSIVE COST OF SERVICE AND RATE DESIGN ANALYSIS
BLACK & VEATCH | Appendix A - Affordability Program Analysis 67
Houston, TX
City Overview
The City of Houston, TX has a population of roughly 2,134,707 with a MHI of $45,0103. Approximately
25.10% of city residents fall within 125% of the poverty guidelines established by the United States
Department of Health and Human Services.
Program Summary
The Houston Water Department offers a low-income program through the Water Aid To Elderly
Residents Fund (W.A.T.E.R Fund). This program is administered by the City of Houston and is designed to
provide financial assistance to senior citizens, the disabled, and other customers who qualify as low
income households. It is funded through voluntary contributions from customers, charities, and
businesses while all administrative costs are paid for by the City of Houston.
The funds primary intent is to support low-income senior citizens. This category includes any individual
60 years of age or older who falls within the 2015 Health and Human Services Poverty Guidelines.
Limited assistance is also available to low-income disabled or other low-income customers. The
applicant must live in a single family dwelling and service must be in their name.
Applications for the program must be submitted through the mail and can be found online. Additional
information must be provided with the application depending on the applicant. Low-income disabled
must provide proof of disability while Senior Citizens must provide a photo ID. All applicants must
include a copy of the birth certificate or Social Security card for each household member. Lastly, proof of
total household income must accompany all applications.
Customers who complete the application process and meet the eligibility requirements may receive up
to $100 in assistance for each six month period. At the end of six months, customers may re-apply for
further assistance. Late fee exemptions are also available to these applicants but additional information
must be provided with the application.4 In addition, veterans with a service related disability are eligible
for the exemption regardless of their level of income.
3 2009-2013 American Community Survey 5-Year Estimates
4 For all applicants a copy of City of Houston residential water/wastewater bill, and a Texas driver’s license or ID,
must be submitted. Low-Income disabled must provide current award letters for Veterans, Railroad or Teachers Pension or disability benefit of all individuals living in the home, current check stubs from employers of all person(s) living in the home and current Social Security or Supplemental Security income award letters for all person(s) living in the home.
San Antonio Water System | COMPREHENSIVE COST OF SERVICE AND RATE DESIGN ANALYSIS
BLACK & VEATCH | Appendix A - Affordability Program Analysis 68
Austin, TX
City Overview
The Austin Water Utility falls within the City of Austin, TX. The City has a population of roughly 836,800
with a MHI of $53,9465. Approximately 23.40% of city residents fall within 125% of the poverty
guidelines established by the United States Department of Health and Human Services. The utility serves
nearly 890,000 retail and wholesale customers over a utility service area that covers approximately 538
square miles6. It currently has three water treatment plants which draw water from the Colorado River.
Program Summary
The City of Austin offers assistance for its utility customers via Customer Assistance Program Discounts
(CAP Discounts). This program offers customers on low or fixed incomes who participate in certain state,
federal, or local assistance programs discounts on utility bills. In addition to the CAP Discounts program,
the City also offers assistance through the Financial Support Plus 1 program. This program provides
emergency financial aid to customers having temporary problems paying bills. It is funded entirely by
voluntary contributions and funds are distributed by local social service agencies.
In order to qualify for the CAP Discount program customers must currently participate in a state, federal
or local assistance program. These programs include the Medicaid Program, Supplemental Nutrition
Assistance Program (SNAP), Children’s Health Insurance Program (CHIP), Telephone Lifeline Program,
Travis County Comprehensive Energy Assistance Program (CEAP), Medical Access Program (MAP), or
Supplemental Security Income (SSI). Eligibility for the Financial Support Plus 1 program is determined by
the local social service agency administering the funds.
Applications for the CAP Discount program can be found online and must be submitted through the
mail. Additional information must be provided with the application. This includes one of the following:
Medicaid Notice of Case Action Letter from Texas Department of Health & Human Services,
Supplemental Nutrition Assistance Program (SNAP) Notice of Case Action Letter from Texas Department
of Health & Human Services (also known as Food Stamps), Children’s Health Insurance Program (CHIP)
Confirmation Enrollment Letter from Texas Department of Health & Human Services, Telephone Lifeline
Program Enrollment Letter or phone bill reflecting Lifeline enrollment, Travis County Comprehensive
Energy Assistance Program (CEAP) Notice of Payment Letter, Medical Access Program (MAP) Clinic Card,
5 2009-2013 American Community Survey 5-Year Estimates
6 Austin Water Utility Statistics; www.austintexas.gov/department/water

San Antonio Water System | COMPREHENSIVE COST OF SERVICE AND RATE DESIGN ANALYSIS
BLACK & VEATCH | Appendix A - Affordability Program Analysis 69
or Supplemental Security Income (SSI) Award Letter. Additional information needed for Financial
Support Plus 1 determined by local social services agency distributing the assistance funds.
Customers who complete the application and meet the eligibility requirements for the CAP Discount
program may receive about $22 in monthly discounts to their utility bill. The discounts that are available
for water/wastewater customers include a water service customer charge waiver, a water tiered fixed
charge waiver, a water volume charge discount and a wastewater service customer charge waiver.
Financial Support Plus 1 program eligibility and discounts are determined by the local social service
agency administering the funds.
Albuquerque, NM
City Overview
The City of Albuquerque has a population of roughly 549,812 with a MHI of $47,9897. Approximately
26.2% of city residents fall within 125% of the poverty guidelines established by the United States
Department of Health and Human Services. The Albuquerque Water Authority serves approximately
656,000 retail and wholesale customers.
Program Summary
The Water Authority’s Low Income Water Credit Program is managed by The Storehouse of Greater
Albuquerque. The Storehouse is the largest food pantry in New Mexico that exists to aid poor residents
of New Mexico. Customers meeting household income requirements may qualify for assistance with
their water and wastewater bills. Customers are taken on a case by case examination.
Along with the application, residents must submit proof of income, proof of property, their most current
water bill, and the number of people residing in the household. The income requirement for the
program is 133% of the federal poverty rate. Applications for the Low Income Water Credit program can
be found online at The Storehouse’s website.
7 2009-2013 American Community Survey 5-Year Estimates
San Antonio Water System | COMPREHENSIVE COST OF SERVICE AND RATE DESIGN ANALYSIS
BLACK & VEATCH | Appendix A - Affordability Program Analysis 70
Philadelphia, PA
City Overview
The City of Philadelphia has a population of roughly 1,536,704 with a MHI of $37,1928. Approximately
36.4% of city residents fall within 125% of the poverty guidelines established by the United States
Department of Health and Human Services.
Program Summary
The City of Philadelphia offers a Water Revenue Assistance Program (WRAP) and a Senior Citizen Water
Bill discount to qualifying senior citizens. In order to qualify for WRAP, customers must have a
household income at or below 175% of the Federal Poverty Guidelines. In order to qualify for the Senior
Citizens program the applicant must be a customer of record, must be at least 65 years of age, and have
a total household income below $32,000.
WRAP is administered by the Water Revenue Board. The Water Revenue Board (WRB) will help the
customer find assistance in paying their water or wastewater bill. The WRAP program offers up to $200
in grants to help customers avoid a water shut-off. The level of assistance will be based on the
customer’s water usage, ability to pay current water and wastewater bills and status as a property
owner, tenant or occupant.
To qualify for the Low Income Agreement, applicants must live in the property for which the application
is being made, verify that their total household income is within Federal Poverty Guidelines, submit
social security numbers for each person who lives with them and provide evidence of all expenses such
as utility bills, gas bills, and rent or mortgage payments or allow a current meter read. Customers can
apply by mail or in person.
For the Senior Citizen Water Bill discount, applicants must submit proof of age along with the
application. The following types of documents will generally be accepted as proof of age: valid driver’s
license, a document issued by the Social Security Administration clearly showing date of birth (a
Medicare Card or Social Security card will not be acceptable), birth certificate/hospital birth record
during the first few years of life and certified by the custodian of the record, passport or naturalization
papers, and military discharge papers. Applications can either be mailed in or delivered in person. If the
customer qualifies, then they are eligible for a 25% discount on their water bill.
8 2009-2013 American Community Survey 5-Year Estimates
San Antonio Water System | COMPREHENSIVE COST OF SERVICE AND RATE DESIGN ANALYSIS
BLACK & VEATCH | Appendix A - Affordability Program Analysis 71
Washington, DC
City Overview
Washington, D.C. has a population of roughly 619,371 with a MHI of $65,8309. Approximately 22.7% of
city residents fall within 125% of the poverty guidelines established by the United States Department of
Health and Human Services. The District of Columbia Water Authority serves approximately 700,000
retail and wholesale customers across a 725 square mile service area.
Program Summary
The District of Columbia Water and Sewer Authority has two programs in place to provide financial
assistance to customers in need. The Customer Assistance Program (CAP) and the Serving People by
Lending A Supporting Hand (SPLASH) help eligible individuals pay their water and sewer bills when they
are experiencing financial difficulties.
CAP is administered by the District of Columbia’s Department of the Environment (DDOE) Energy office.
It provides eligible customers with a discount of up to 400 cubic feet of water and up to 400 cubic feet of
sewer services per month. This savings is currently estimated at $32.08 for water and sewer services.
Eligibility is determined based on Federal Poverty Guidelines, specifically a customer’s income must not
exceed 150% of the guidelines. Applicants must provide proof of income, current utility bill, and proof of
age with the application.
SPLASH is funded solely by contributions from DC water customers and the community. SPLASH helps
customers maintain critical water and sewer service in times of financial emergencies. Qualified water
customers who meet low income criteria are eligible to receive a maximum of $350 per household in a
12-month period. Applicants are encouraged to call to find out more about the assistance program.
Nashville, TN
City Overview
The City of Nashville has a population of roughly 614,908 with a MHI of $46,68610. Approximately 25.4%
of city residents fall within 125% of the poverty guidelines established by the United States Department
of Health and Human Services. Nashville Metro Water Services provides water to approximately 700,000
retail and wholesale customers across a 725 square mile service area.
9 2009-2013 American Community Survey 5-Year Estimates
10 2009-2013 American Community Survey 5-Year Estimates
San Antonio Water System | COMPREHENSIVE COST OF SERVICE AND RATE DESIGN ANALYSIS
BLACK & VEATCH | Appendix A - Affordability Program Analysis 72
Program Summary Nashville’ Flexible Payment Date Program offers low-income customer the ability to delay payment of
their water bills until they have received income from federal or state-run income programs. The
program income sources recognized include social security income, service pension benefits, retirement
benefits, and monthly payments from local, state, or federal agencies. In order to qualify for the Flexible
Payment Date Program customers must provide proof of participation in one of the qualifying programs,
they must have proof of a primary residence, and they must have an account in good standing. Nashville
does not provide a discount on water rates because their program is focused on the cash flow needs of
the customer base. Customer must submit an application and the appropriate documentation through
the mail.
Portland, OR
City Overview
The City of Portland has a population of roughly 594,687 with a MHI of $52,64711. Approximately 24.3%
of city residents fall within 125% of the poverty guidelines established by the United States Department
of Health and Human Services. The utility serves nearly 950,000 over a utility service area that covers
approximately 143 square miles.
Program Summary The goal of Portland’s program is to aid financially vulnerable groups, which includes low-income
residents, elderly residents, and the disabled. Disconnecting and reconnecting accounts is expensive and
Portland’s program seeks to avoid those costs by providing discounts to minimize overdue bills.
Portland’s bill discount program is available to customers whose household income is less than 60% of
the State of Oregon’s median household income; eligibility varies by household size. Multnomah County,
which administers other low-income programs including federally and state-funded energy assistance,
determines eligibility. Candidates apply at any of nine Community Service Centers throughout the
bureau’s 143 square mile service area.
The discount is half of the bill for those consuming 5 CCF (500 cubic feet) or less a month. Some utilities
discount a percentage of the total bill. Portland, however, opted for a flat maximum credit to encourage
conservation. Approximately 9,300 households participate in the program and the total program cost is
$1.6 million. Portland also offers an emergency assistance program with a maximum assistance level of
$300 per year. Households can acquire emergency assistance under 3 scenarios: 1) employment status
11 2009-2013 American Community Survey 5-Year Estimates

San Antonio Water System | COMPREHENSIVE COST OF SERVICE AND RATE DESIGN ANALYSIS
BLACK & VEATCH | Appendix A - Affordability Program Analysis 73
change (i.e. termination or pay reduction, 2) family status change (i.e. divorce or death of spouse), and
3) extraordinary medical expense.
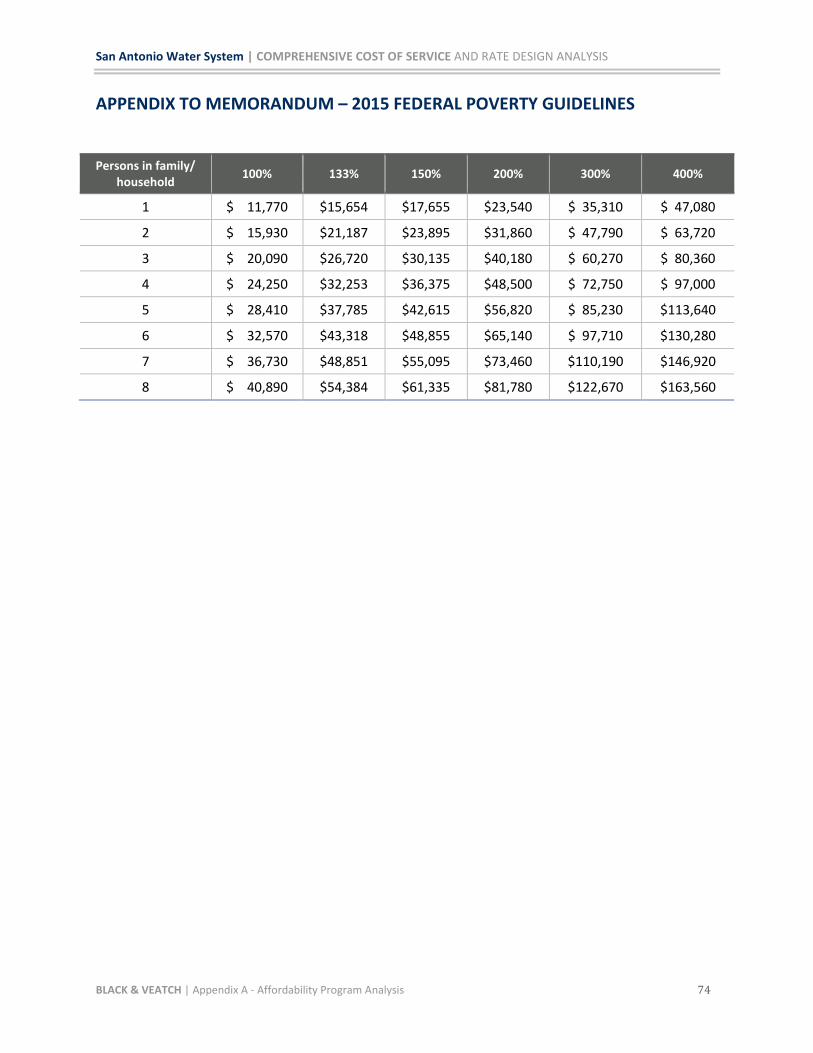
San Antonio Water System | COMPREHENSIVE COST OF SERVICE AND RATE DESIGN ANALYSIS
BLACK & VEATCH | Appendix A - Affordability Program Analysis 74
APPENDIX TO MEMORANDUM – 2015 FEDERAL POVERTY GUIDELINES
Persons in family/ household
100% 133% 150% 200% 300% 400%
1 $ 11,770 $15,654 $17,655 $23,540 $ 35,310 $ 47,080
2 $ 15,930 $21,187 $23,895 $31,860 $ 47,790 $ 63,720
3 $ 20,090 $26,720 $30,135 $40,180 $ 60,270 $ 80,360
4 $ 24,250 $32,253 $36,375 $48,500 $ 72,750 $ 97,000
5 $ 28,410 $37,785 $42,615 $56,820 $ 85,230 $113,640
6 $ 32,570 $43,318 $48,855 $65,140 $ 97,710 $130,280
7 $ 36,730 $48,851 $55,095 $73,460 $110,190 $146,920
8 $ 40,890 $54,384 $61,335 $81,780 $122,670 $163,560

San Antonio Water System | COMPREHENSIVE COST OF SERVICE AND RATE DESIGN ANALYSIS
BLACK & VEATCH | Appendix A - Affordability Program Analysis 75
APPENDIX TO MEMORANDUM – LOW-INCOME AFFORDABILITY PROGRAM TYPES
Common Customer Assistance Programs
Assistance Program Program Description
Discount rate (lower fee per unit)
Rates for eligible customers are lower than all other residential customers.
Discounted bill (percentage discount on gross bill)
Total bill calculation is based upon same rates as similarly situated customers but a discount given on the total bill amount based on eligibility.
Fee Exemption based on eligibility
Free service based on eligibility criteria.
Life-line credit (minimum use credit)
Life line credit provided on bill up to a specified maximum level. Eligible residential customers would receive credit for minimal units of service if used. Consumption above the credit level would be due and payable at the same rate as every other residential customer.
Bill round-up program Voluntary donations are received from other customers by rounding up their bills to include an amount above their consumption payment that is then dedicated to an assistance program.
3rd party administration referral (usually provides maximum annual bill assistance)
Can be either a simple referral service to non-profit groups or can provide funding to a 3rd party that administers a bill payment program for customers needing one-time bill assistance no more than once annually.

San Antonio Water System | COMPREHENSIVE COST OF SERVICE AND RATE DESIGN ANALYSIS
BLACK & VEATCH | Appendix B – Special Services Fee Analysis 76
Appendix B – Special Services Fee Analysis

San Antonio Water System | COMPREHENSIVE COST OF SERVICE AND RATE DESIGN ANALYSIS
BLACK & VEATCH | Appendix B – Special Services Fee Analysis 77
Subject: Analysis of Special Service Fees
Date: November 14, 2014
To: Black & Veatch
From: K Bealer Consulting, Inc.
PROJECT OVERVIEW Black & Veatch (BV) was retained by San Antonio Water System (SAWS) to perform a Rate Design Study
Analysis. As part of the project team, K Bealer Consulting (KBC) was responsible for performing a cost
assessment of certain special service fees. Initially, the fees to be examined included the following:
Industrial Discharge Sampling Fees
Industrial Waste Permit Fees
Laboratory Test Fees
Liquid Waste Hauler Permit and Disposal Fees
Fire Hydrant Meter Fees
Fats, Oils, and Grease (FOG) Fees
With respect to the FOG fees, SAWS subsequently determined that the changes needed would be more
complex than anticipated requiring additional consultation with affected groups and more time than
allocated to the Rate Study process. As a result, the FOG fees were dropped from the list of fees
analyzed. Changes to the FOG fees will be handled outside of the Rate Study process.
The results of this assessment are presented below.
SPECIAL SERVICES FEES ANALYSIS The objective of the analysis is to provide cost estimates for the selected special service fees to aid
SAWS in their effort to recover the full cost of for providing services related to these fee programs.
Estimates have been developed for the 2015 costs of each service program in order to identify the gaps
between the unit cost of service and the current service fee levels.
The following sections provide a description of the major cost components of the pricing models, the
current rates for each service, a description of the methodology used to update the models, and cost
changes since the last modeling effort. Diagrams are provided that explain the flow of information for
each of the models used in the analysis.

San Antonio Water System | COMPREHENSIVE COST OF SERVICE AND RATE DESIGN ANALYSIS
BLACK & VEATCH | Appendix B – Special Services Fee Analysis 78
Assumptions
Two assumptions appear in all of the pricing models: allocation of overhead services and a transfer of a
share of revenue to the City in accordance with City Ordinance 75686 which created SAWS. SAWS
provided an overhead calculation for budgeted general management and administrative activities that
are normalized as a percent of the total budget, including capital outlays, in 2014. The resulting
overhead cost share of total budget was utilized to calculate the amount of overhead spending allocated
to each special service fee rate model. Table B-1 below is the result of that analysis.
Table B-1 – Overhead Allocation per Budget Dollar
Group Sum of Total
O&M Expense Sum of Capital
Outlay
Sum of Overhead O&M and Capital
Outlay
Board of Trustees and Pres/CEO $2,289,753 $1,881 $2,291,634
Customer Service $13,543,257 $207,000 -
Distribution and Collection Operations $34,741,956 $249,000 -
Engineering and Construction $1,858,125
$165,625
Financial Services $4,711,649
$4,711,649
Human Resources $3,862,259
$3,862,259
Information Systems $13,332,383 $2,307,070 $15,631,553
Legal $5,490,229
$4,862,912
Operations $3,690,425 $4,000 $574,295
Operations Services $33,688,675 $4,326,880 $20,846,642
Other Requirements $26,984,546
$26,984,546
Production and Treatment Operations $63,431,167 $1,393,000 -
Public Affairs $3,363,486
$3,363,486
Wastewater System Improvements $21,463,072 $180,000 $781,932
Water Resources and Conservation $76,262,710
-
(blank) -
-
Grand Total $308,713,690 $8,668,831 $84,076,532
Overhead Assumption 26.5%
The overhead budget as a percent of the total SAWS budget is 26.5% for 2014. We have assumed that
overhead cost allocation is distributed evenly across the activities at SAWS.

San Antonio Water System | COMPREHENSIVE COST OF SERVICE AND RATE DESIGN ANALYSIS
BLACK & VEATCH | Appendix B – Special Services Fee Analysis 79
The second overhead assumption applied in each special service fee model is a required transfer of a
share of revenue to the City; consequently, 2.7% of the revenue from each fee is assumed to be
remitted to the City. This cost has been accounted for in our models.
Industrial Discharge Sampling Fee
Industrial Discharge Sampling Fees are assessed to recover the costs for the sampling of industrial user
discharges. All industrial customers subject to the City’s Industrial Waste Ordinance are subject to these
fees. There are two categories of customers in this program and two types of fees: Significant Industrial
Users (SIUs) who are subject to U.S. Environmental Protection Agency (EPA) pre-treatment standards
and/or who discharge significant amounts of industrial wastewater; and Non-Significant Industrial Users
(NSIUs) who are not subject to EPA standards, but do discharge waste into the wastewater system that
exceeds normal domestic wastewater standards for solids content.
The SIU Sampling Fee is $600 per SIU sample and the NSIU Sampling Fee is $5.76 per month which is
assessed on each NSIU customer’s bill. Total SIU and NSIU revenues in 2015 are projected to be
$640,547 with costs anticipated to be $929,773 for a total shortfall of $289,227, or a negative 31.1% of
costs. These fees were last increased in 2012. Table B-2 contains a summary of costs associated with
these fees.
Table B-2 – Summary of Industrial Discharge Sampling Total Costs
Cost Type 2015
Personnel $537,007
Non-Personnel $198,459
City Transfer $25,104
Overhead $169,203
TOTAL: $929,773
As seen in Table B-3 below, the current cost of service per SIU sample is $575 for SIUs and the cost of
service per month per NSIU customer is $12.96. The fee per SIU sample is recovering the cost of the SIU
sampling program. However, for NSIUs, the cost of service is currently 55.6% more than the revenue
collected from the monthly fee being assessed for NSIU sampling.

San Antonio Water System | COMPREHENSIVE COST OF SERVICE AND RATE DESIGN ANALYSIS
BLACK & VEATCH | Appendix B – Special Services Fee Analysis 80
Table B-3 – Summary of Industrial Discharge Sampling Fee
Activity/Cost
2015
SIU Sampling Fee Revenue
NSIU Sampling Fee Revenue
Total Sampling Program
Number of Samples (SIU) / Participants (NSIU) 660 3.538
Current Fee Amount $600 $5.76
Annual Revenue $396,000 $244,257 $640,547
Proportion of Effort 40.82% 59.18%
Expenditures $379,543 $550,230 $929,773
Cost per Sample (SIU)/Month (NSIU) $575 $12.96
Difference $16,457 -$305,683 -$289,227
Margin amount 4.3% -55.6% -31.1%
It is recommended that the SIU sampling fee not be changed for 2016 and remain at $600 per sample.
However, it is recommended that the NSIU monthly fee be increased in 2016 to $12.57 a month to
recover the full costs of service to NSIU customers.
For each year beyond 2016, it is further recommended that both the SIU and NSIU fees be automatically
increased using the annual change in the U.S. Consumer Price Index (CPI) as the basis for the increase.
Industrial Waste Permit Fees
Industrial Waste Permit Fees are assessed to recover the costs for the administration of the industrial
waste permitting program. All industrial customers subject to the City’s Industrial Waste Ordinance are
subject to these fees. There are two categories of customers in this program and two types of fees: (1)
Categorical customers who must pretreat their industrial waste prior to discharge in accordance with
EPA categorical pre-treatment standards, and (2) Non-Categorical customers who discharge industrial
strength waste, but who do not have to comply with EPA categorical pre-treatment standards.
The current fee for a five-year permit for a Categorical user is $9,000. The current fee for a five-year
permit for a Non-Categorical user is $6,750. These fees were last increased in 2012. Total revenue in
2015 is projected to be $141,750, while actual total costs are anticipated to be $516,173, creating a
shortfall of $374,423, or a negative 72.5% of costs. Table B-5 contains a summary of costs associated
with these fees.
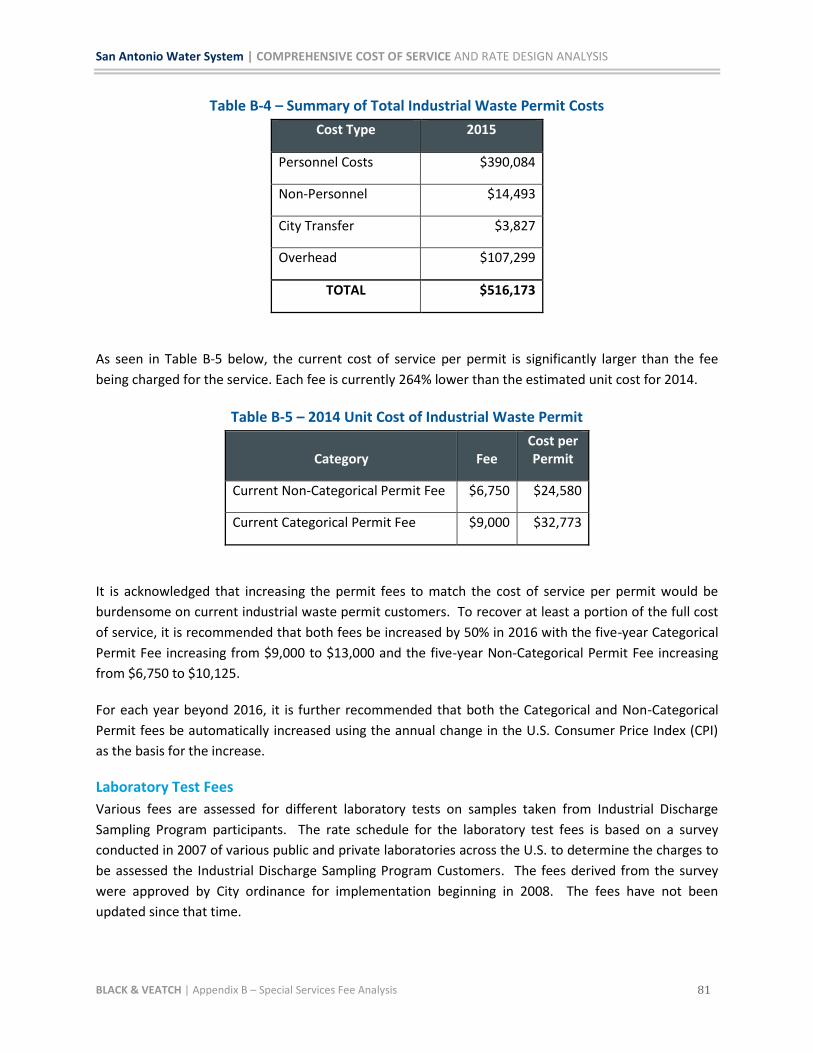
San Antonio Water System | COMPREHENSIVE COST OF SERVICE AND RATE DESIGN ANALYSIS
BLACK & VEATCH | Appendix B – Special Services Fee Analysis 81
Table B-4 – Summary of Total Industrial Waste Permit Costs
Cost Type 2015
Personnel Costs $390,084
Non-Personnel $14,493
City Transfer $3,827
Overhead $107,299
TOTAL $516,173
As seen in Table B-5 below, the current cost of service per permit is significantly larger than the fee
being charged for the service. Each fee is currently 264% lower than the estimated unit cost for 2014.
Table B-5 – 2014 Unit Cost of Industrial Waste Permit
Category Fee Cost per Permit
Current Non-Categorical Permit Fee $6,750 $24,580
Current Categorical Permit Fee $9,000 $32,773
It is acknowledged that increasing the permit fees to match the cost of service per permit would be
burdensome on current industrial waste permit customers. To recover at least a portion of the full cost
of service, it is recommended that both fees be increased by 50% in 2016 with the five-year Categorical
Permit Fee increasing from $9,000 to $13,000 and the five-year Non-Categorical Permit Fee increasing
from $6,750 to $10,125.
For each year beyond 2016, it is further recommended that both the Categorical and Non-Categorical
Permit fees be automatically increased using the annual change in the U.S. Consumer Price Index (CPI)
as the basis for the increase.
Laboratory Test Fees
Various fees are assessed for different laboratory tests on samples taken from Industrial Discharge
Sampling Program participants. The rate schedule for the laboratory test fees is based on a survey
conducted in 2007 of various public and private laboratories across the U.S. to determine the charges to
be assessed the Industrial Discharge Sampling Program Customers. The fees derived from the survey
were approved by City ordinance for implementation beginning in 2008. The fees have not been
updated since that time.
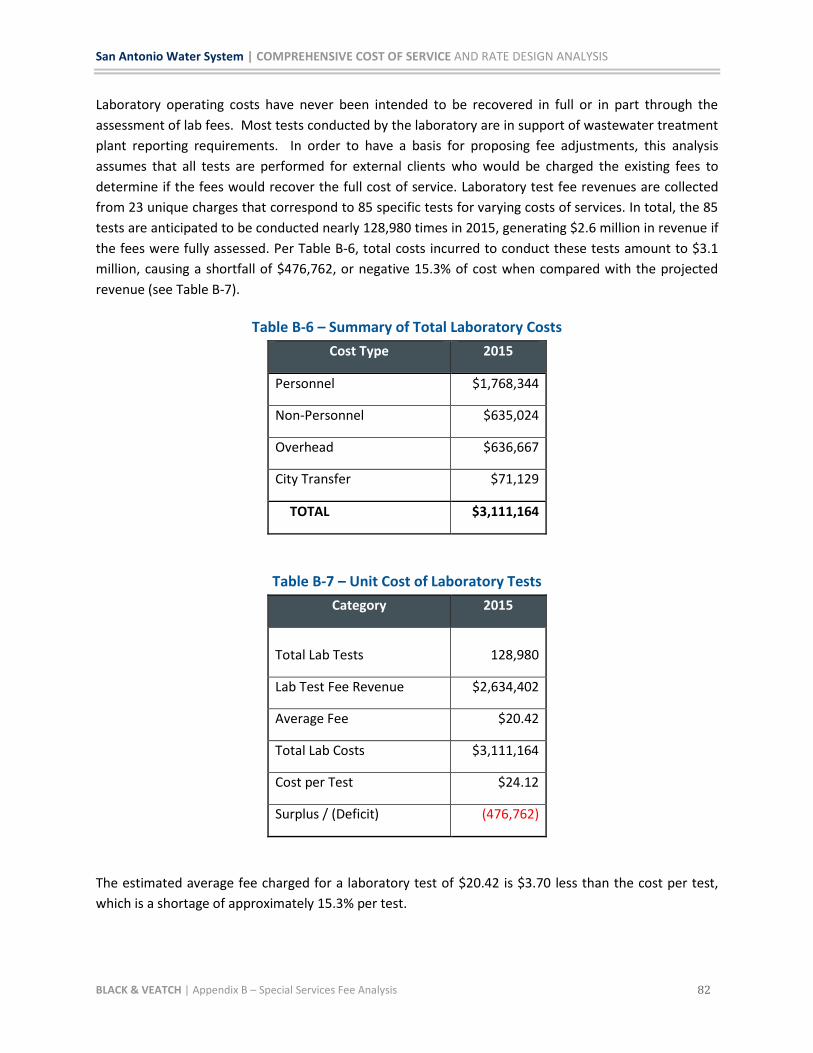
San Antonio Water System | COMPREHENSIVE COST OF SERVICE AND RATE DESIGN ANALYSIS
BLACK & VEATCH | Appendix B – Special Services Fee Analysis 82
Laboratory operating costs have never been intended to be recovered in full or in part through the
assessment of lab fees. Most tests conducted by the laboratory are in support of wastewater treatment
plant reporting requirements. In order to have a basis for proposing fee adjustments, this analysis
assumes that all tests are performed for external clients who would be charged the existing fees to
determine if the fees would recover the full cost of service. Laboratory test fee revenues are collected
from 23 unique charges that correspond to 85 specific tests for varying costs of services. In total, the 85
tests are anticipated to be conducted nearly 128,980 times in 2015, generating $2.6 million in revenue if
the fees were fully assessed. Per Table B-6, total costs incurred to conduct these tests amount to $3.1
million, causing a shortfall of $476,762, or negative 15.3% of cost when compared with the projected
revenue (see Table B-7).
Table B-6 – Summary of Total Laboratory Costs
Cost Type 2015
Personnel $1,768,344
Non-Personnel $635,024
Overhead $636,667
City Transfer $71,129
TOTAL $3,111,164
Table B-7 – Unit Cost of Laboratory Tests
Category 2015
Total Lab Tests
128,980
Lab Test Fee Revenue $2,634,402
Average Fee $20.42
Total Lab Costs $3,111,164
Cost per Test $24.12
Surplus / (Deficit) (476,762)
The estimated average fee charged for a laboratory test of $20.42 is $3.70 less than the cost per test,
which is a shortage of approximately 15.3% per test.
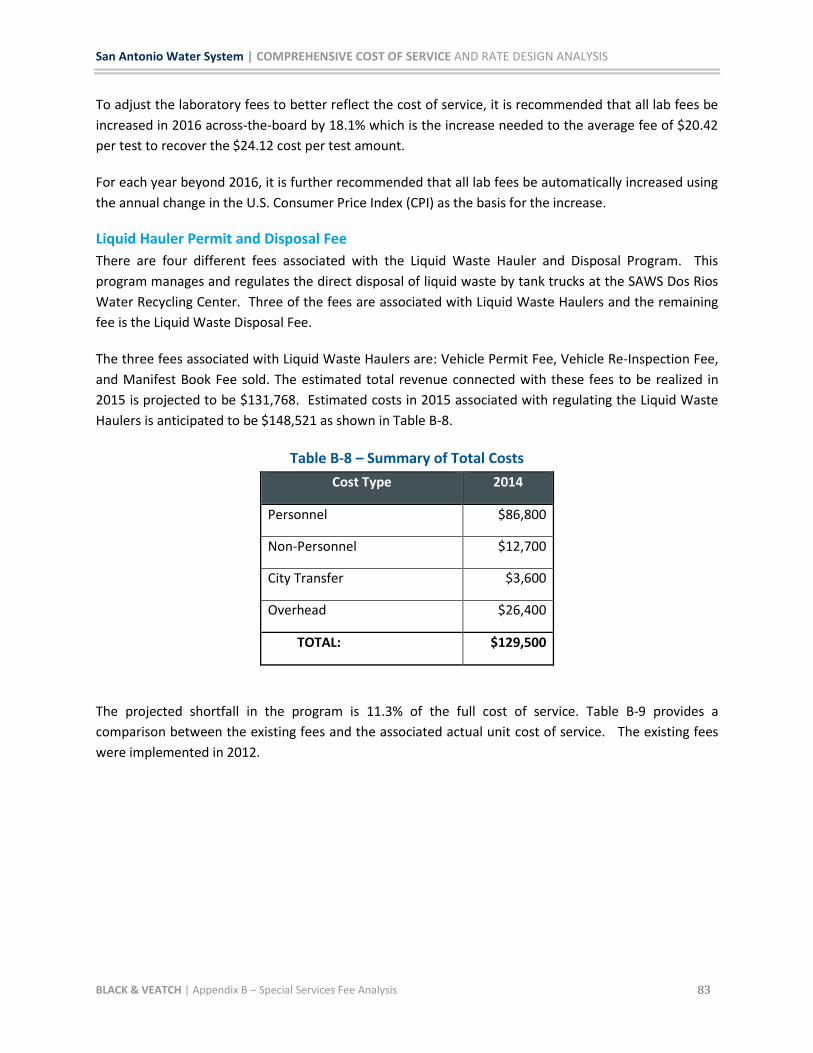
San Antonio Water System | COMPREHENSIVE COST OF SERVICE AND RATE DESIGN ANALYSIS
BLACK & VEATCH | Appendix B – Special Services Fee Analysis 83
To adjust the laboratory fees to better reflect the cost of service, it is recommended that all lab fees be
increased in 2016 across-the-board by 18.1% which is the increase needed to the average fee of $20.42
per test to recover the $24.12 cost per test amount.
For each year beyond 2016, it is further recommended that all lab fees be automatically increased using
the annual change in the U.S. Consumer Price Index (CPI) as the basis for the increase.
Liquid Hauler Permit and Disposal Fee
There are four different fees associated with the Liquid Waste Hauler and Disposal Program. This
program manages and regulates the direct disposal of liquid waste by tank trucks at the SAWS Dos Rios
Water Recycling Center. Three of the fees are associated with Liquid Waste Haulers and the remaining
fee is the Liquid Waste Disposal Fee.
The three fees associated with Liquid Waste Haulers are: Vehicle Permit Fee, Vehicle Re-Inspection Fee,
and Manifest Book Fee sold. The estimated total revenue connected with these fees to be realized in
2015 is projected to be $131,768. Estimated costs in 2015 associated with regulating the Liquid Waste
Haulers is anticipated to be $148,521 as shown in Table B-8.
Table B-8 – Summary of Total Costs
Cost Type 2014
Personnel $86,800
Non-Personnel $12,700
City Transfer $3,600
Overhead $26,400
TOTAL: $129,500
The projected shortfall in the program is 11.3% of the full cost of service. Table B-9 provides a
comparison between the existing fees and the associated actual unit cost of service. The existing fees
were implemented in 2012.
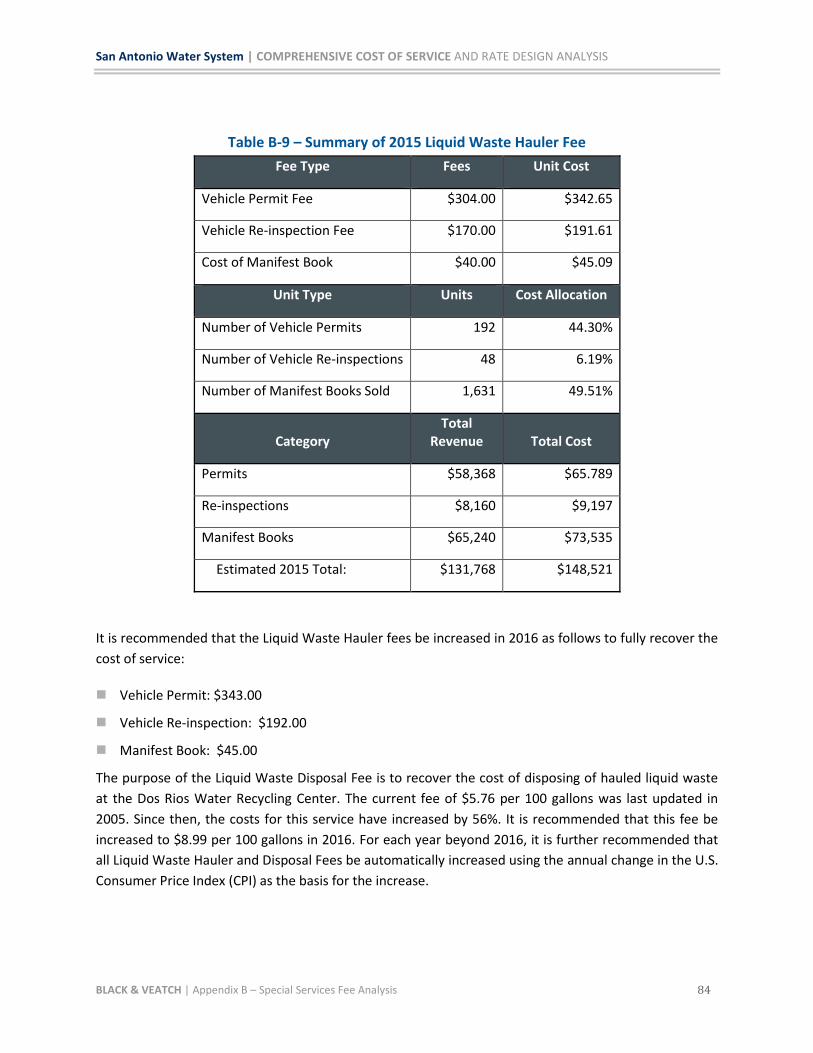
San Antonio Water System | COMPREHENSIVE COST OF SERVICE AND RATE DESIGN ANALYSIS
BLACK & VEATCH | Appendix B – Special Services Fee Analysis 84
Table B-9 – Summary of 2015 Liquid Waste Hauler Fee
Fee Type Fees Unit Cost
Vehicle Permit Fee $304.00 $342.65
Vehicle Re-inspection Fee $170.00 $191.61
Cost of Manifest Book $40.00 $45.09
Unit Type Units Cost Allocation
Number of Vehicle Permits 192 44.30%
Number of Vehicle Re-inspections 48 6.19%
Number of Manifest Books Sold 1,631 49.51%
Category Total
Revenue Total Cost
Permits $58,368 $65.789
Re-inspections $8,160 $9,197
Manifest Books $65,240 $73,535
Estimated 2015 Total: $131,768 $148,521
It is recommended that the Liquid Waste Hauler fees be increased in 2016 as follows to fully recover the
cost of service:
Vehicle Permit: $343.00
Vehicle Re-inspection: $192.00
Manifest Book: $45.00
The purpose of the Liquid Waste Disposal Fee is to recover the cost of disposing of hauled liquid waste
at the Dos Rios Water Recycling Center. The current fee of $5.76 per 100 gallons was last updated in
2005. Since then, the costs for this service have increased by 56%. It is recommended that this fee be
increased to $8.99 per 100 gallons in 2016. For each year beyond 2016, it is further recommended that
all Liquid Waste Hauler and Disposal Fees be automatically increased using the annual change in the U.S.
Consumer Price Index (CPI) as the basis for the increase.
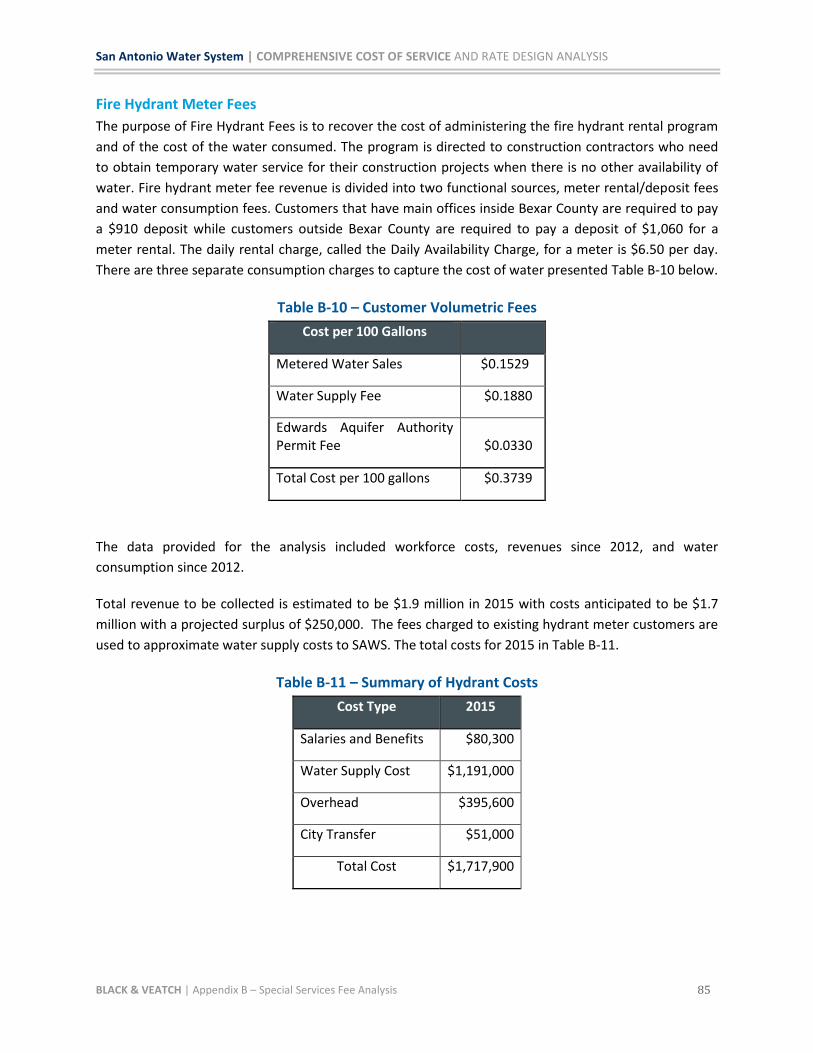
San Antonio Water System | COMPREHENSIVE COST OF SERVICE AND RATE DESIGN ANALYSIS
BLACK & VEATCH | Appendix B – Special Services Fee Analysis 85
Fire Hydrant Meter Fees
The purpose of Fire Hydrant Fees is to recover the cost of administering the fire hydrant rental program
and of the cost of the water consumed. The program is directed to construction contractors who need
to obtain temporary water service for their construction projects when there is no other availability of
water. Fire hydrant meter fee revenue is divided into two functional sources, meter rental/deposit fees
and water consumption fees. Customers that have main offices inside Bexar County are required to pay
a $910 deposit while customers outside Bexar County are required to pay a deposit of $1,060 for a
meter rental. The daily rental charge, called the Daily Availability Charge, for a meter is $6.50 per day.
There are three separate consumption charges to capture the cost of water presented Table B-10 below.
Table B-10 – Customer Volumetric Fees
Cost per 100 Gallons
Metered Water Sales $0.1529
Water Supply Fee $0.1880
Edwards Aquifer Authority Permit Fee $0.0330
Total Cost per 100 gallons $0.3739
The data provided for the analysis included workforce costs, revenues since 2012, and water
consumption since 2012.
Total revenue to be collected is estimated to be $1.9 million in 2015 with costs anticipated to be $1.7
million with a projected surplus of $250,000. The fees charged to existing hydrant meter customers are
used to approximate water supply costs to SAWS. The total costs for 2015 in Table B-11.
Table B-11 – Summary of Hydrant Costs
Cost Type 2015
Salaries and Benefits $80,300
Water Supply Cost $1,191,000
Overhead $395,600
City Transfer $51,000
Total Cost $1,717,900
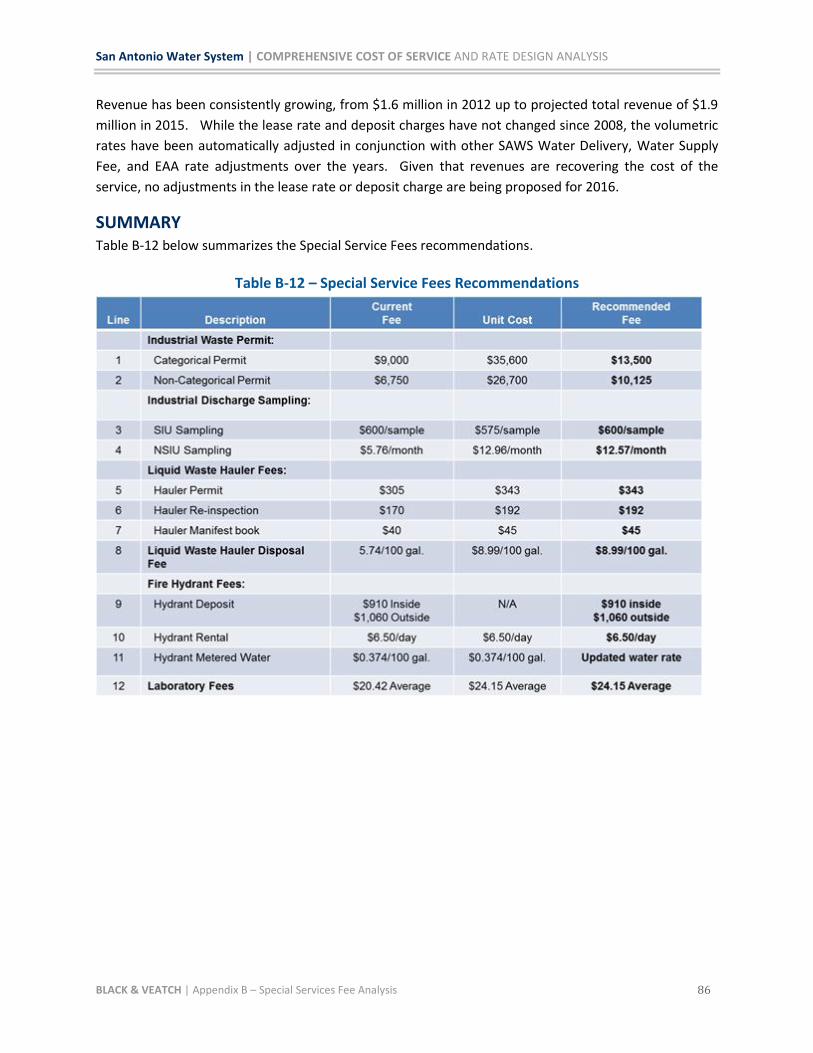
San Antonio Water System | COMPREHENSIVE COST OF SERVICE AND RATE DESIGN ANALYSIS
BLACK & VEATCH | Appendix B – Special Services Fee Analysis 86
Revenue has been consistently growing, from $1.6 million in 2012 up to projected total revenue of $1.9
million in 2015. While the lease rate and deposit charges have not changed since 2008, the volumetric
rates have been automatically adjusted in conjunction with other SAWS Water Delivery, Water Supply
Fee, and EAA rate adjustments over the years. Given that revenues are recovering the cost of the
service, no adjustments in the lease rate or deposit charge are being proposed for 2016.
SUMMARY Table B-12 below summarizes the Special Service Fees recommendations.
Table B-12 – Special Service Fees Recommendations
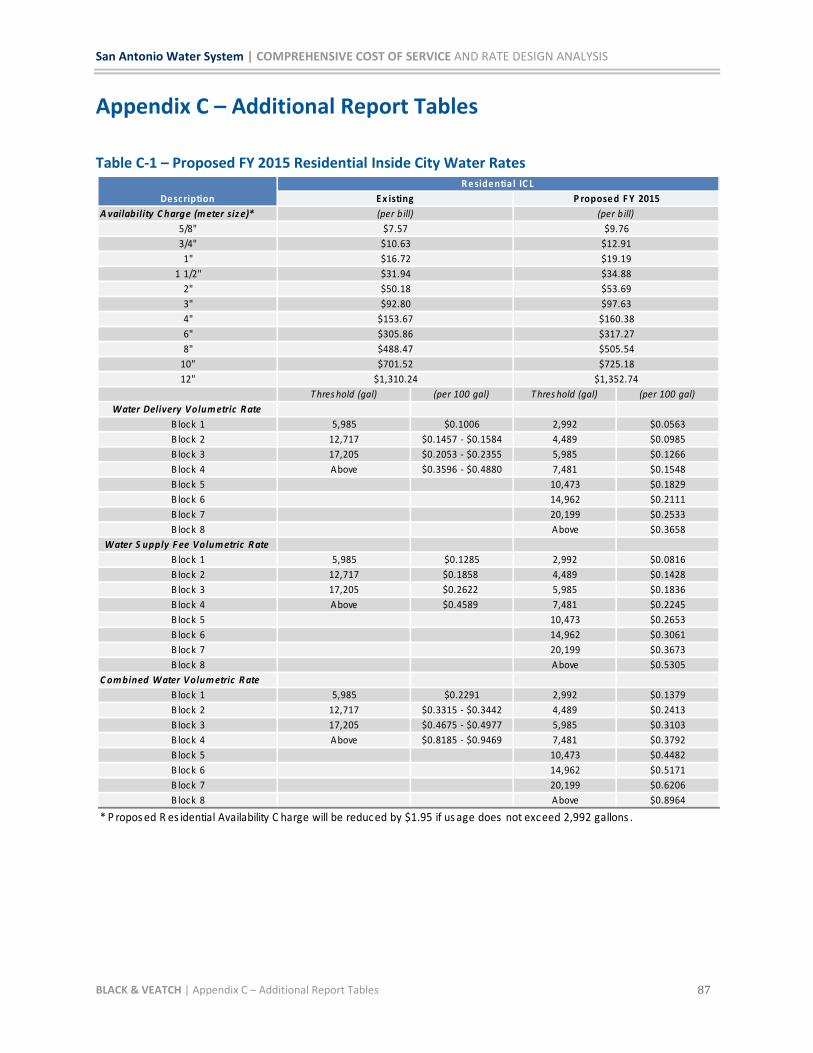
San Antonio Water System | COMPREHENSIVE COST OF SERVICE AND RATE DESIGN ANALYSIS
BLACK & VEATCH | Appendix C – Additional Report Tables 87
Appendix C – Additional Report Tables
Table C-1 – Proposed FY 2015 Residential Inside City Water Rates
A vailability C harge (m eter siz e)*
5/8"
3/4"
1"
1 1/2"
2"
3"
4"
6"
8"
10"
12"
T hres hold (gal) (per 100 gal) T hres hold (gal) (per 100 gal)
Water Delivery Volum etric R ate
B lock 1 5,985 $0.1006 2,992 $0.0563
B lock 2 12,717 $0.1457 - $0.1584 4,489 $0.0985
B lock 3 17,205 $0.2053 - $0.2355 5,985 $0.1266
B lock 4 Above $0.3596 - $0.4880 7,481 $0.1548
B lock 5 10,473 $0.1829
B lock 6 14,962 $0.2111
B lock 7 20,199 $0.2533
B lock 8 Above $0.3658
Water S upply F ee Volum etric R ate
B lock 1 5,985 $0.1285 2,992 $0.0816
B lock 2 12,717 $0.1858 4,489 $0.1428
B lock 3 17,205 $0.2622 5,985 $0.1836
B lock 4 Above $0.4589 7,481 $0.2245
B lock 5 10,473 $0.2653
B lock 6 14,962 $0.3061
B lock 7 20,199 $0.3673
B lock 8 Above $0.5305
C om bined Water Volum etric R ate
B lock 1 5,985 $0.2291 2,992 $0.1379
B lock 2 12,717 $0.3315 - $0.3442 4,489 $0.2413
B lock 3 17,205 $0.4675 - $0.4977 5,985 $0.3103
B lock 4 Above $0.8185 - $0.9469 7,481 $0.3792
B lock 5 10,473 $0.4482
B lock 6 14,962 $0.5171
B lock 7 20,199 $0.6206
B lock 8 Above $0.8964
* P ropos ed R es idential Availability C harge will be reduced by $1.95 if us age does not exceed 2,992 gallons .
$701.52 $725.18
$1,310.24 $1,352.74
$305.86 $317.27
$488.47 $505.54
$92.80 $97.63
$153.67 $160.38
$31.94 $34.88
$50.18 $53.69
$10.63 $12.91
$16.72 $19.19
(per b ill) (per b ill)
$7.57 $9.76
Desc ription
R esidentia l IC L
E x isting P roposed F Y 2015
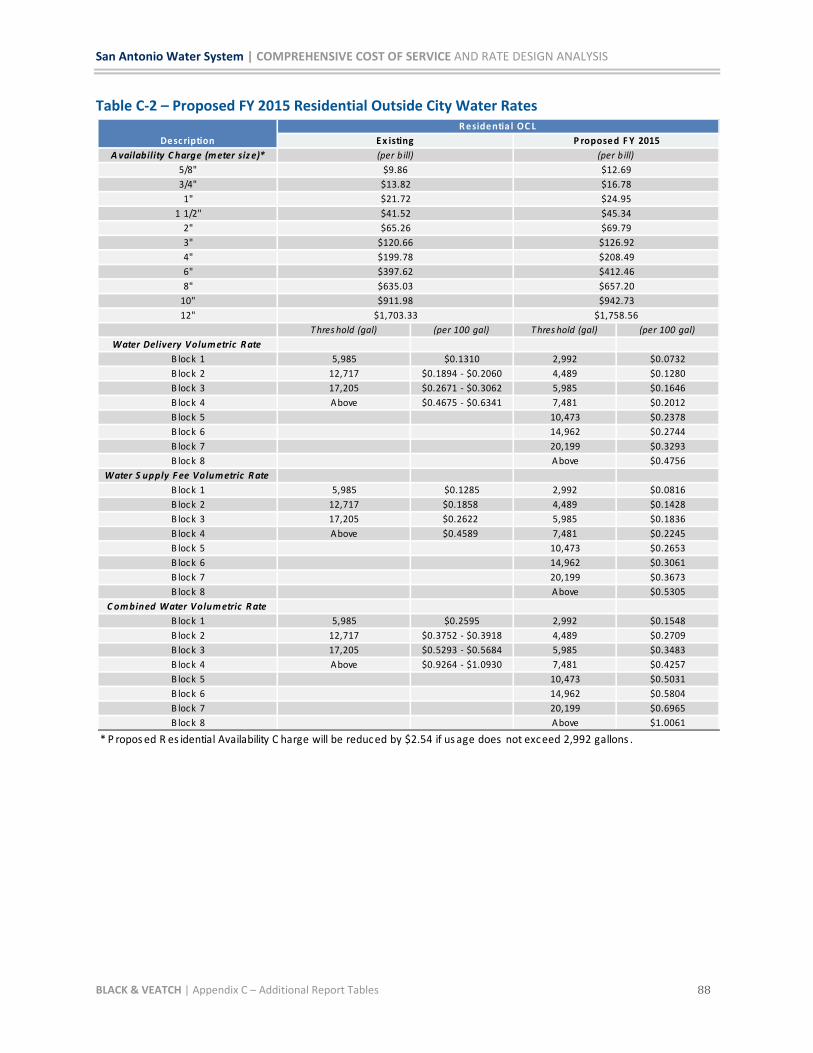
San Antonio Water System | COMPREHENSIVE COST OF SERVICE AND RATE DESIGN ANALYSIS
BLACK & VEATCH | Appendix C – Additional Report Tables 88
Table C-2 – Proposed FY 2015 Residential Outside City Water Rates
A vailability C harge (m eter siz e)*
5/8"
3/4"
1"
1 1/2"
2"
3"
4"
6"
8"
10"
12"
T hres hold (gal) (per 100 gal) T hres hold (gal) (per 100 gal)
Water Delivery Volum etric R ate
B lock 1 5,985 $0.1310 2,992 $0.0732
B lock 2 12,717 $0.1894 - $0.2060 4,489 $0.1280
B lock 3 17,205 $0.2671 - $0.3062 5,985 $0.1646
B lock 4 Above $0.4675 - $0.6341 7,481 $0.2012
B lock 5 10,473 $0.2378
B lock 6 14,962 $0.2744
B lock 7 20,199 $0.3293
B lock 8 Above $0.4756
Water S upply F ee Volum etric R ate
B lock 1 5,985 $0.1285 2,992 $0.0816
B lock 2 12,717 $0.1858 4,489 $0.1428
B lock 3 17,205 $0.2622 5,985 $0.1836
B lock 4 Above $0.4589 7,481 $0.2245
B lock 5 10,473 $0.2653
B lock 6 14,962 $0.3061
B lock 7 20,199 $0.3673
B lock 8 Above $0.5305
C om bined Water Volum etric R ate
B lock 1 5,985 $0.2595 2,992 $0.1548
B lock 2 12,717 $0.3752 - $0.3918 4,489 $0.2709
B lock 3 17,205 $0.5293 - $0.5684 5,985 $0.3483
B lock 4 Above $0.9264 - $1.0930 7,481 $0.4257
B lock 5 10,473 $0.5031
B lock 6 14,962 $0.5804
B lock 7 20,199 $0.6965
B lock 8 Above $1.0061
* P ropos ed R es idential Availability C harge will be reduced by $2.54 if us age does not exceed 2,992 gallons .
Desc ription
R esidentia l OC L
$911.98 $942.73
$1,703.33 $1,758.56
$397.62 $412.46
$635.03 $657.20
$120.66 $126.92
$199.78 $208.49
$41.52 $45.34
$65.26 $69.79
$13.82 $16.78
$21.72 $24.95
(per b ill) (per b ill)
$9.86 $12.69
E x isting P roposed F Y 2015
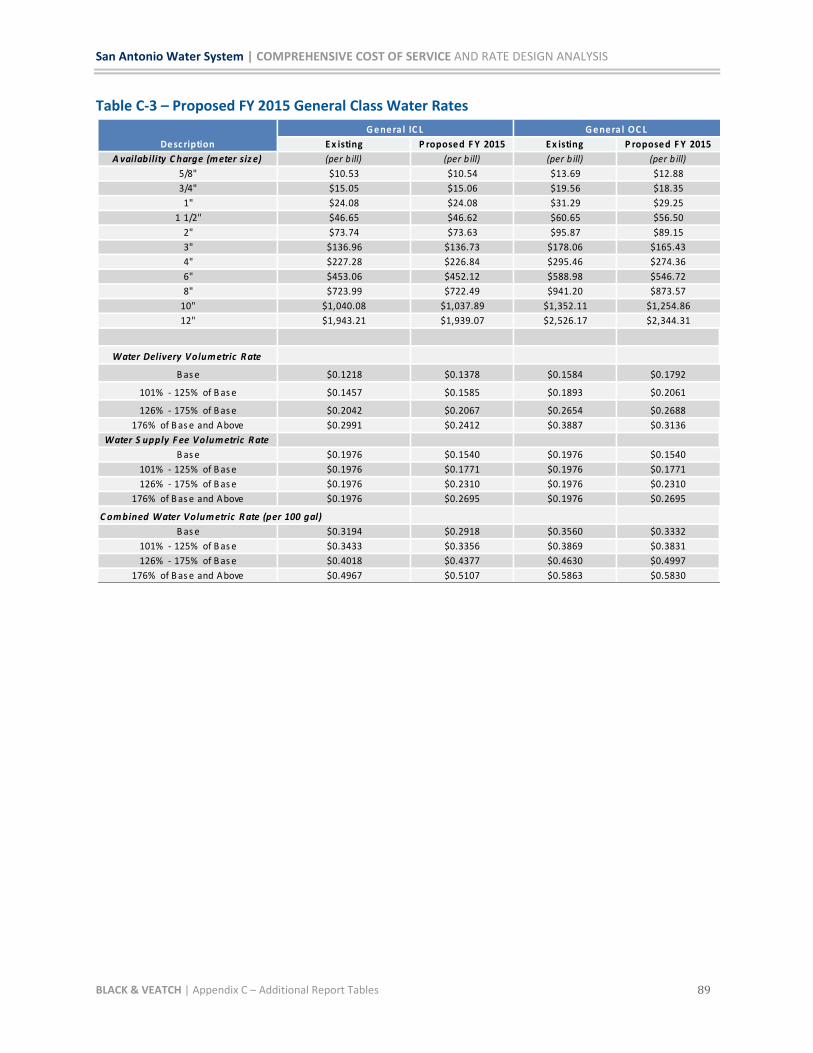
San Antonio Water System | COMPREHENSIVE COST OF SERVICE AND RATE DESIGN ANALYSIS
BLACK & VEATCH | Appendix C – Additional Report Tables 89
Table C-3 – Proposed FY 2015 General Class Water Rates
E x isting P roposed F Y 2015 E x isting P roposed F Y 2015
A vailability C harge (m eter siz e) (per b ill) (per b ill) (per b ill) (per b ill)
5/8" $10.53 $10.54 $13.69 $12.88
3/4" $15.05 $15.06 $19.56 $18.35
1" $24.08 $24.08 $31.29 $29.25
1 1/2" $46.65 $46.62 $60.65 $56.50
2" $73.74 $73.63 $95.87 $89.15
3" $136.96 $136.73 $178.06 $165.43
4" $227.28 $226.84 $295.46 $274.36
6" $453.06 $452.12 $588.98 $546.72
8" $723.99 $722.49 $941.20 $873.57
10" $1,040.08 $1,037.89 $1,352.11 $1,254.86
12" $1,943.21 $1,939.07 $2,526.17 $2,344.31
Water Delivery Volum etric R ate
B as e $0.1218 $0.1378 $0.1584 $0.1792
101% - 125% of B as e $0.1457 $0.1585 $0.1893 $0.2061
126% - 175% of B as e $0.2042 $0.2067 $0.2654 $0.2688
176% of B as e and Above $0.2991 $0.2412 $0.3887 $0.3136
Water S upply F ee Volum etric R ate
B as e $0.1976 $0.1540 $0.1976 $0.1540
101% - 125% of B as e $0.1976 $0.1771 $0.1976 $0.1771
126% - 175% of B as e $0.1976 $0.2310 $0.1976 $0.2310
176% of B as e and Above $0.1976 $0.2695 $0.1976 $0.2695
C om bined Water Volum etric R ate (per 100 gal)
B as e $0.3194 $0.2918 $0.3560 $0.3332
101% - 125% of B as e $0.3433 $0.3356 $0.3869 $0.3831
126% - 175% of B as e $0.4018 $0.4377 $0.4630 $0.4997
176% of B as e and Above $0.4967 $0.5107 $0.5863 $0.5830
Desc ription
G enera l IC L G enera l OC L

San Antonio Water System | COMPREHENSIVE COST OF SERVICE AND RATE DESIGN ANALYSIS
BLACK & VEATCH | Appendix C – Additional Report Tables 90
Table C-4 – Proposed FY 2015 Irrigation Inside City Water Rates
A vailability C harge (m eter siz e)*
5/8"
3/4"
1"
1 1/2"
2"
3"
4"
6"
8"
10"
12"
T hres hold (gal) (per 100 gal) T hres hold (gal) (per 100 gal)
Water Delivery Volum etric R ate
B lock 1 6,732 $0.1713 8,229 $0.2504
B lock 2 17,205 $0.2053 - $0.2384 17,954 $0.3505
B lock 3 Above $0.3596 - $0.4936 162,316 $0.4507
B lock 4 Above $0.5759
Water S upply F ee Volum etric R ate
B lock 1 6,732 $0.1976 8,229 $0.2015
B lock 2 17,205 $0.2622 17,954 $0.2821
B lock 3 Above $0.4976 162,316 $0.3627
B lock 4 Above $0.4635
C om bined Water Volum etric R ate
B lock 1 6,732 $0.3689 8,229 $0.4519
B lock 2 17,205 $0.4675 - $0.5006 17,954 $0.6326
B lock 3 Above $0.8572 - $0.9912 162,316 $0.8134
B lock 4 Above $1.0393
$1,943.21 $1,939.07
$136.96 $136.73
$227.28 $226.84
$453.06 $452.12
$723.99 $722.49
$1,040.08 $1,037.89
$10.53 $10.54
$15.05 $15.06
$24.08 $24.08
$46.65 $46.62
$73.74 $73.63
Desc ription
Irrg ia tion IC L
E x isting P roposed F Y 2015
(per b ill) (per b ill)
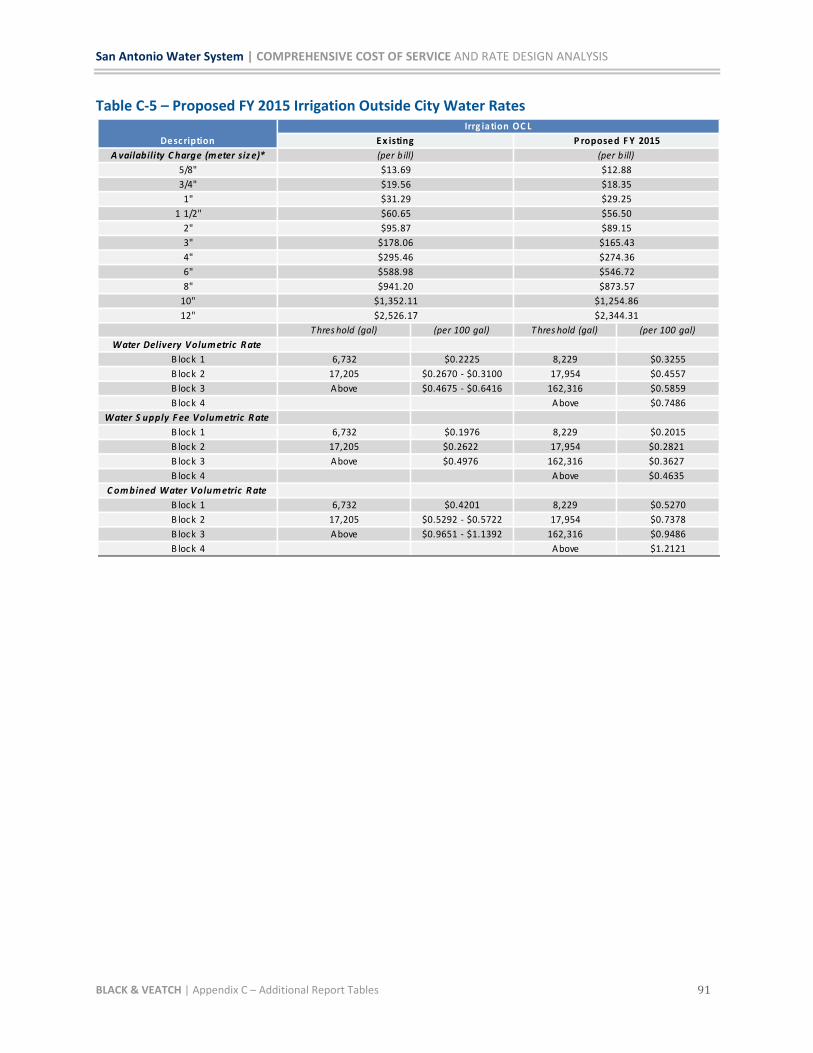
San Antonio Water System | COMPREHENSIVE COST OF SERVICE AND RATE DESIGN ANALYSIS
BLACK & VEATCH | Appendix C – Additional Report Tables 91
Table C-5 – Proposed FY 2015 Irrigation Outside City Water Rates
A vailability C harge (m eter siz e)*
5/8"
3/4"
1"
1 1/2"
2"
3"
4"
6"
8"
10"
12"
T hres hold (gal) (per 100 gal) T hres hold (gal) (per 100 gal)
Water Delivery Volum etric R ate
B lock 1 6,732 $0.2225 8,229 $0.3255
B lock 2 17,205 $0.2670 - $0.3100 17,954 $0.4557
B lock 3 Above $0.4675 - $0.6416 162,316 $0.5859
B lock 4 Above $0.7486
Water S upply F ee Volum etric R ate
B lock 1 6,732 $0.1976 8,229 $0.2015
B lock 2 17,205 $0.2622 17,954 $0.2821
B lock 3 Above $0.4976 162,316 $0.3627
B lock 4 Above $0.4635
C om bined Water Volum etric R ate
B lock 1 6,732 $0.4201 8,229 $0.5270
B lock 2 17,205 $0.5292 - $0.5722 17,954 $0.7378
B lock 3 Above $0.9651 - $1.1392 162,316 $0.9486
B lock 4 Above $1.2121
$2,526.17 $2,344.31
$178.06 $165.43
$295.46 $274.36
$588.98 $546.72
$941.20 $873.57
$1,352.11 $1,254.86
$13.69 $12.88
$19.56 $18.35
$31.29 $29.25
$60.65 $56.50
$95.87 $89.15
Desc ription
Irrg ia tion OC L
E x isting P roposed F Y 2015
(per b ill) (per b ill)
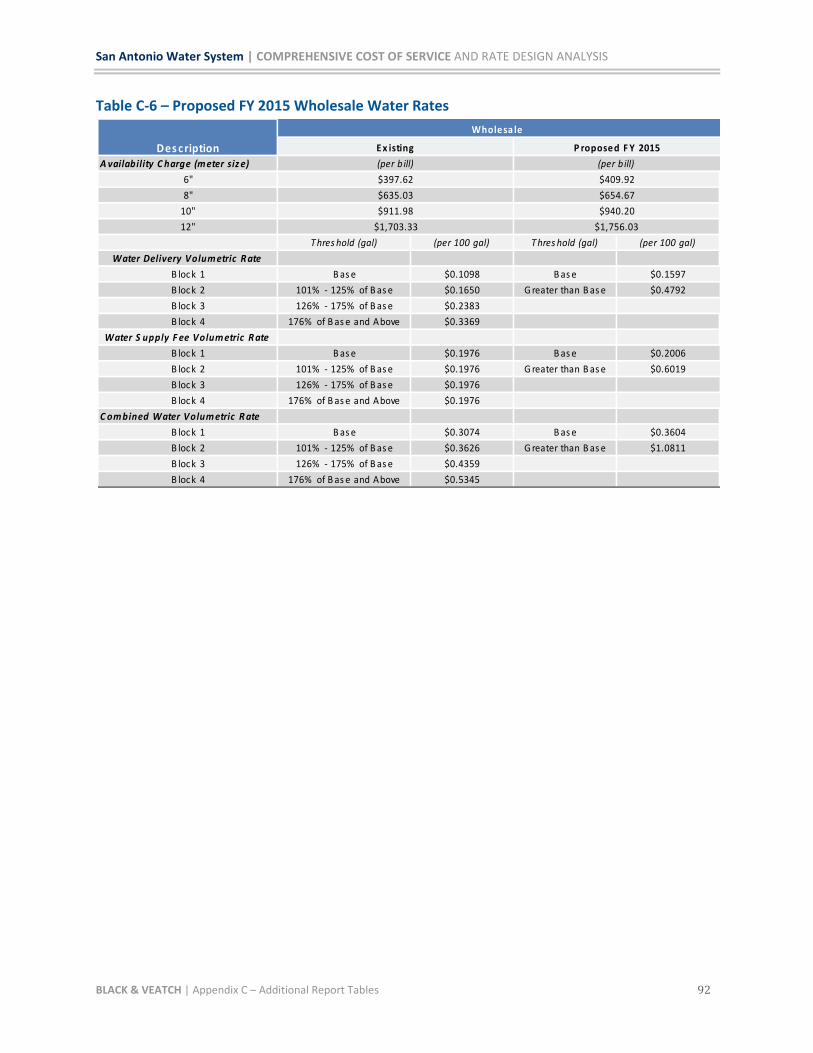
San Antonio Water System | COMPREHENSIVE COST OF SERVICE AND RATE DESIGN ANALYSIS
BLACK & VEATCH | Appendix C – Additional Report Tables 92
Table C-6 – Proposed FY 2015 Wholesale Water Rates
A vailability C harge (m eter siz e)
6"
8"
10"
12"
T hres hold (gal) (per 100 gal) T hres hold (gal) (per 100 gal)
Water Delivery Volum etric R ate
B lock 1 B as e $0.1098 B as e $0.1597
B lock 2 101% - 125% of B as e $0.1650 G reater than B as e $0.4792
B lock 3 126% - 175% of B as e $0.2383
B lock 4 176% of B as e and Above $0.3369
Water S upply F ee Volum etric R ate
B lock 1 B as e $0.1976 B as e $0.2006
B lock 2 101% - 125% of B as e $0.1976 G reater than B as e $0.6019
B lock 3 126% - 175% of B as e $0.1976
B lock 4 176% of B as e and Above $0.1976
C om bined Water Volum etric R ate
B lock 1 B as e $0.3074 B as e $0.3604
B lock 2 101% - 125% of B as e $0.3626 G reater than B as e $1.0811
B lock 3 126% - 175% of B as e $0.4359
B lock 4 176% of B as e and Above $0.5345
$397.62
$635.03
$911.98
$1,703.33
Wholesa le
(per b ill)
$409.92
$654.67
$940.20
$1,756.03
Des cription E x isting P roposed F Y 2015
(per b ill)

San Antonio Water System | COMPREHENSIVE COST OF SERVICE AND RATE DESIGN ANALYSIS
BLACK & VEATCH | Appendix C – Additional Report Tables 93
Table C-7 – District Special Project (former BexarMet) Water Rates
Table C-8 – Proposed FY 2015 Residential & General Class Inside City Wastewater Rates
Monthly Meter C harge
5/8"
3/4"
1"
1 1/2"
2"
3"
4"
6"
8"
10"
T hres hold (gal) (per 100 gal) T hres hold (gal) (per 100 gal)
Water Delivery Volum etric R ate
B lock 1 5,000 $0.0890 40,000 $0.2540
B lock 2 10,000 $0.1430 150,000 $0.4950
B lock 3 17,000 $0.3950 Above $0.8000
B lock 4 Above $0.6300
Water S upply F ee Volum etric R ate
B lock 1 5,000 $0.1840 40,000 $0.1840
B lock 2 10,000 $0.1840 150,000 $0.1840
B lock 3 17,000 $0.1840 Above $0.1840
B lock 4 Above $0.1840
C om bined Water Volum etric R ate
B lock 1 5,000 $0.2730 40,000 $0.4380
B lock 2 10,000 $0.3270 150,000 $0.6790
B lock 3 17,000 $0.5790 Above $0.9840
B lock 4 Above $0.8140
Desc ription E x isting E x isting
$1,708.83
(per b ill) (per b ill)
$7.93 $24.41
$10.38 $30.51
$15.87 $48.82
$39.64 $122.06
DS P R esidentia l DS P C ommerc ia l
$63.47 $195.30
$317.35
$439.31
$781.18
$2,929.43
Availability Charge (meter size)*
5/8" $12.69 $11.67 $11.67
3/4" $12.69 $12.84 $12.84
1" $12.69 $14.59 $14.59
1 1/2" $12.69 $20.43 $20.43
2" $12.69 $29.18 $29.18
3" $12.69 $58.36 $58.36
4" $12.69 $87.54 $87.54
6" $12.69 $145.90 $145.90
8" $12.69 $233.43 $233.43
10" $12.69 $350.15 $350.15
12" $12.69 $466.87 $466.87
Wastewater Volumetric Rate
Block 1** $0.3365 $0.2495 $0.3343
Block 2 n/a $0.3743 n/a
*Service availability charge includes a minimum allowance of 1,496 gallons.
**The proposed Residential volumetric rates consist of two blocks with Block 1 ending at 2,992 gallons.
Description
Existing Residential &
General
Proposed FY 15
Residential
Proposed FY 15
General
(per bill)
(per 100 gal)
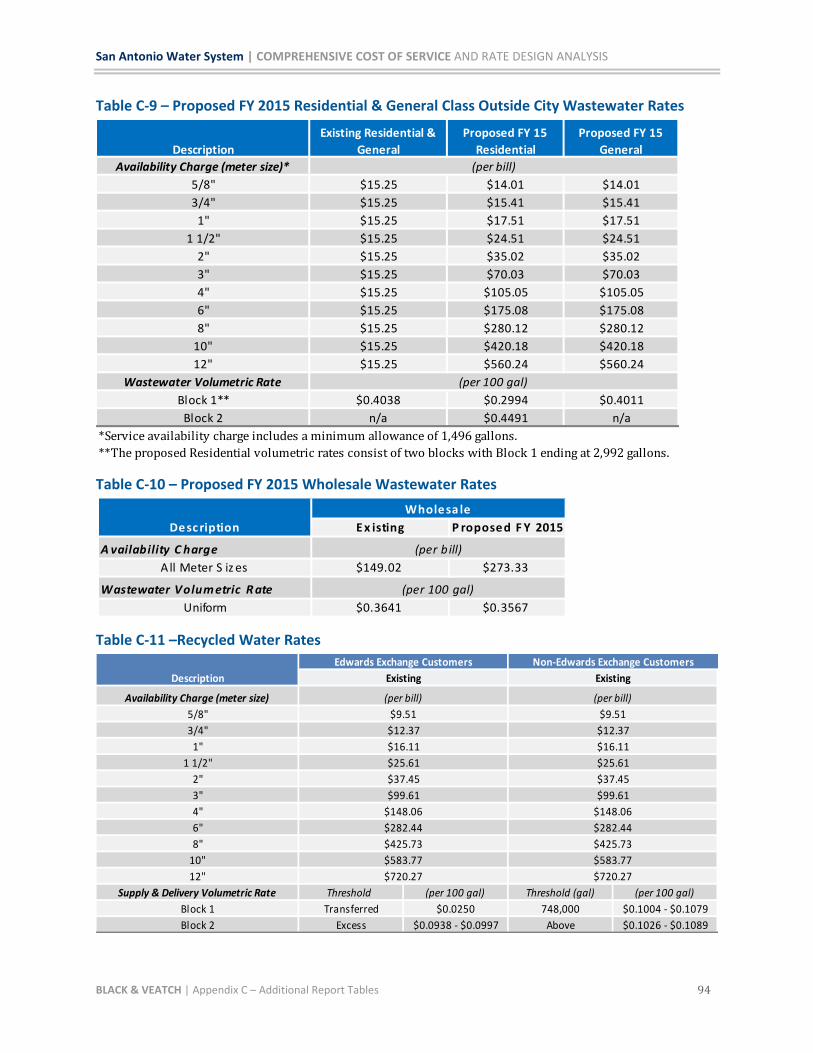
San Antonio Water System | COMPREHENSIVE COST OF SERVICE AND RATE DESIGN ANALYSIS
BLACK & VEATCH | Appendix C – Additional Report Tables 94
Table C-9 – Proposed FY 2015 Residential & General Class Outside City Wastewater Rates
Table C-10 – Proposed FY 2015 Wholesale Wastewater Rates
Table C-11 –Recycled Water Rates
Availability Charge (meter size)*
5/8" $15.25 $14.01 $14.01
3/4" $15.25 $15.41 $15.41
1" $15.25 $17.51 $17.51
1 1/2" $15.25 $24.51 $24.51
2" $15.25 $35.02 $35.02
3" $15.25 $70.03 $70.03
4" $15.25 $105.05 $105.05
6" $15.25 $175.08 $175.08
8" $15.25 $280.12 $280.12
10" $15.25 $420.18 $420.18
12" $15.25 $560.24 $560.24
Wastewater Volumetric Rate
Block 1** $0.4038 $0.2994 $0.4011
Block 2 n/a $0.4491 n/a
*Service availability charge includes a minimum allowance of 1,496 gallons.
**The proposed Residential volumetric rates consist of two blocks with Block 1 ending at 2,992 gallons.
(per 100 gal)
(per bill)
Description
Existing Residential &
General
Proposed FY 15
Residential
Proposed FY 15
General
E x isting P roposed F Y 2015
A vailability C harge
All Meter S iz es $149.02 $273.33
Wastewater Volum etric R ate
Uniform $0.3641 $0.3567
(per 100 gal)
Desc ription
Wholesa le
(per b ill)
Availability Charge (meter size)
5/8"
3/4"
1"
1 1/2"
2"
3"
4"
6"
8"
10"
12"
Supply & Delivery Volumetric Rate Threshold (per 100 gal) Threshold (gal) (per 100 gal)
Block 1 Transferred $0.0250 748,000 $0.1004 - $0.1079
Block 2 Excess $0.0938 - $0.0997 Above $0.1026 - $0.1089
$99.61 $99.61
$148.06 $148.06
$720.27 $720.27
$282.44 $282.44
$425.73 $425.73
$583.77 $583.77
$16.11 $16.11
$25.61 $25.61
$37.45 $37.45
$12.37 $12.37
$9.51 $9.51
Description Existing Existing
(per bill) (per bill)
Edwards Exchange Customers Non-Edwards Exchange Customers