comprehensive income: who’s afraid of performance...
TRANSCRIPT
Comprehensive Income: Who’s Afraid of Performance Statement Reporting?
Linda Smith Bamber J.M. Tull Professor of Accounting
University of Georgia
John (Xuefeng) Jiang Assistant Professor
Michigan State University
Kathy Petroni Deloitte /Michael Licata Professor of Accounting
Michigan State University
Isabel Yanyan Wang* Assistant Professor
Michigan State University
September 2006
We are grateful to Ben Ayers, Michael Bamber, Matt Weiland, and Eric Yeung for insightful comments that helped us improve this paper. * Corresponding author: N233 Business College Complex, Eli Broad College of Business, Michigan State University, East Lansing MI, 48824. Phone: 517-432-2923. Email: [email protected].

Comprehensive Income: Who’s Afraid of Performance Statement Reporting?
Abstract
Our study provides new insight into why the majority of firms do not follow policymakers’ preference to report comprehensive income in a performance statement, and instead relegate it to the statement of changes in equity. We argue that managers believe reporting comprehensive income in the more salient performance statement will lead financial statement users to perceive the firm’s performance as more volatile. Our empirical evidence on a broad cross-section of firms shows that managers who are more likely to be hurt by increased perceived volatility of firm performance – those with less secure positions and stronger equity-based incentives – are less likely to adopt the more transparent performance reporting. Our results suggest that a relatively subtle (and previously unexplored) aspect of managers’ self-interest – their sensitivity to the perceived volatility of the firm’s performance – is associated with their accounting choices.

1
1. Introduction
Current financial reporting standards allow firms to report comprehensive income in
either an income-statement-like format as part of a statement of performance,1 or in a statement
of changes in equity (Financial Accounting Standards Board FAS 130; International Accounting
Standards Board IAS 1). In traditional models of financial markets, rational investors fully
process information regardless of its location. Under this view it does not matter where the firm
reports comprehensive income. On the other hand, policymakers apparently believe the location
of comprehensive income does matter. Policymakers prefer the performance statement
presentation – referred to as performance reporting – because they regard this as the more
transparent presentation (FASB 1997, paragraph 67). As long as it is not too costly, we would
expect firms to adopt the recommended reporting so they can tout the transparency of their
financial reporting.
Contrary to policymakers’ preferences, however, most firms relegate comprehensive
income to the statement of changes in equity (Campbell et al. 1999; Bhamornsiri and Wiggins
2001; Pandit et al. 2006). This evidence raises the question why managers are reluctant to report
comprehensive income in the more transparent performance statement. Do managers believe
performance reporting is costly? What might these costs be? Our study provides new empirical
evidence on these questions.
The only extant empirical evidence on determinants of firms’ comprehensive income
reporting location choice is the Lee et al. (2006) investigation in the insurance industry. They
conclude that insurers who avoid performance reporting and instead relegate comprehensive
1 Under FAS 130, Comprehensive Income Reporting, the income statement-like format can take one of two specific forms: (1) a statement that includes the information in an income statement as well as comprehensive income, or (2) a separate statement that begins with net income and ends with comprehensive income.

2
income to the statement of changes in equity are attempting to hide their earnings management
accomplished by cherry-picking realized gains and losses on available-for-sale securities.
Performance reporting is costly for these firms because it makes their earnings management
more transparent (Hirst and Hopkins 1998; Lee et al. 2006). The insurance industry is an
excellent setting to investigate the effect on firms’ comprehensive income reporting choices of
earnings management through selective sales of available-for-sale securities. Opportunities to
cherry-pick are ripe in this industry because the average available-for-sale portfolio is about 40%
of total assets (Godwin et al. 1998).
Outside the insurance industry, however, available-for-sale securities constitute a smaller
proportion of firm assets, which likely reduces the opportunity for cherry-picking. Yet firms
outside the insurance industry are even more likely (than insurers) to relegate comprehensive
income to the statement of changes in equity (Lee et al. 2006). Thus, we investigate the role of
other potential costs of performance reporting in a broad cross-section of firms.
Our analysis of the 105 comment letters that managers of Standard and Poors’ 500 (S&P
500, hereafter) firms sent in response to the initial FAS 130 proposal reveals that opposition to
performance reporting stems mainly from concerns that other comprehensive income items
fluctuate widely and unpredictably. Managers say they fear that reporting comprehensive
income in a salient performance statement would lead investors and other stakeholders to
increase their assessments of the volatility of the firm’s performance.2 We therefore hypothesize
that managers who are more likely to be hurt by an increase in perceived volatility of the firm’s
2 Hodder et al. (2006) and Barth et al. (1995) provide empirical evidence that comprehensive income is more volatile than net income (in the banking industry), and recent experimental, archival, and theoretical research concludes that the salience of a disclosure can affect market participants’ perceptions of the firm’s performance (e.g., Aboody 1996; Hirst and Hopkins 1998; Maines and McDaniel 2000; Bloomfield 2002; Hirshleifer and Teoh 2003; Ahmed et al. 2006).

3
performance will not follow the FASB’s preference, but will instead relegate comprehensive
income to the less salient statement of changes in equity. Building on the Graham et al. (2005)
survey evidence, we argue that managers with greater equity-based incentives and less job
security are more likely to believe they would be hurt by an increase in the perceived volatility of
firm performance. As described more fully in the next section, managers say they believe
increases in the perceived volatility of firm performance adversely affect the firm’s stock price,
and also reflect negatively on the assessment of the manager’s performance (Maines and
McDaniel 2000; Graham et al. 2005). We therefore expect that CEOs with more equity-based
incentives and CEOs with less job security will avoid reporting comprehensive income in the
more salient (performance statement) location.
We test our expectations on the initial comprehensive income reporting choice made by
S&P 500 firms during the 1998 to 2001 period. Consistent with our hypotheses, the logit
analysis reveals that firms who ignore the FASB’s preference for performance reporting are
headed by CEOs who are more likely to be hurt by greater perceived volatility in performance
(i.e., CEOs with more equity-based incentives and less job security3) than firms that follow the
FASB’s recommendation. These results are robust to controlling for other comprehensive
income items, industry, and other variables associated with accounting choice (e.g., leverage and
firm size). Additional analysis of the small sample of firms that changed their comprehensive
income reporting location further supports our inferences.
We also find that firms with larger (absolute) unrealized gains and losses on available-
for-sale securities are less likely to follow the FASB’s preference to report comprehensive
income in a (salient) performance statement. These firms also have more to lose from
3 As detailed in Section 3, our job security measure is based on three dimensions of CEO power derived from the

4
performance reporting, because: (1) they have more opportunity to manage earnings by
selectively selling available-for-sale marketable securities, but (2) financial statement users are
more likely to detect any such earnings management if the firm reports comprehensive income in
a performance statement (Hirst and Hopkins 1998), and managers are aware that performance
reporting increases the likelihood of detection (Lee et al. 2006; Hunton et al. 2006).
Our study contributes to the literature in several ways. First, and most important, our
results shed new light on why a broad cross-section of firms choose not to follow the FASB’s
stated preference to report comprehensive income in a performance statement. Specifically, we
find that managers who are more likely to be hurt by increased perceived volatility of firm
performance – those with less secure positions and those with more equity-based incentives – are
less likely to follow policymakers’ preference for the more transparent performance reporting
that highlights the volatility of other comprehensive income items. This evidence is relevant to
standard setters who are currently deliberating whether to require all firms to report
comprehensive income in a performance statement (e.g., FASB 2006; IASB 2006).
Policymakers should be interested in evidence that firms act as if a seemingly benign disclosure
choice, such as comprehensive income reporting location, matters. Our results suggest that a
relatively subtle (and previously unexplored) aspect of managers’ self-interest – their sensitivity
to the perceived volatility of the firm’s performance – is associated with their accounting
choices. More broadly, our evidence suggests that when allowing a menu of alternatives to a
preferred disclosure choice, policymakers should carefully consider whether relatively subtle
aspects of managers’ wealth and job security concerns (such as their sensitivity to perceived
volatility of firm performance) are likely to drive managers to choose less-transparent reporting
management literature.

5
alternatives.
A second contribution of our study is new evidence that managers’ broader job security
concerns play a significant incremental role (beyond their specific equity-based compensation
incentives) in determining financial reporting choices. Graham et al. (2005) provide survey-
based evidence suggesting that managers’ career concerns are important drivers of financial
reporting, and note that this is an “under-explored” issue (Graham et al. 2005, 24). Our results
help address this void in the literature by providing large-scale archival empirical evidence that
managers’ job security concerns do appear to affect their accounting choices: CEOs with less job
security on average make comprehensive income reporting choices that reduce transparency.
Third, our study extends prior research on the effect of equity-based incentives on
earnings management (e.g., Cheng and Warfield 2005; Coles et al. 2006; Bergstresser and
Philippon 2006) to show that equity-based incentives also affect another transparency-related
accounting choice – the decision to disclose accounting information in a more or less salient
location. Finally, because firms self-select where to report comprehensive income, factors
affecting this choice could also affect the valuation of comprehensive income items. Research on
the valuation effects of comprehensive income reporting location could use our model of the
determinants of the location to identify and control for likely self-selection biases.
The paper proceeds as follows. The next section develops testable hypotheses. The third
section describes the research method. The fourth section presents the empirical results, and the
last section concludes.
2. Hypothesis development
In this section, we develop our hypotheses that managers who disregard policymakers’
preferences and instead report comprehensive income in the less salient statement of changes in

6
equity have more equity-based incentives and less job security. First, we explain why managers
would believe that reporting comprehensive income in a performance statement could lead
financial statement users to increase their perception of the volatility of the firm’s performance.
Second, we discuss how an increase in the perceived volatility of a firm’s performance is likely
to adversely affect CEOs. Third, we use these discussions to develop testable hypotheses.
2.1 How comprehensive income reporting location affects perceived volatility of the firm’s performance
Experimental research confirms the FASB’s view (FASB 1997, paragraph 67) that
reporting comprehensive income in a performance statement makes comprehensive income more
salient to financial statement users. For example, Hirst and Hopkins (1998) find that
professional financial analysts more fully assimilate the implications of comprehensive income
when an electronics company uses performance reporting. Indeed, when the company reports
comprehensive income in the statement of changes in equity, half of the analyst-subjects do not
even recall seeing the term comprehensive income. In addition, Maines and McDaniel (2000)
demonstrate that when nonprofessional investors evaluate the performance of insurance firms,
they weight comprehensive income more heavily when it appears in a performance statement
than when it appears in a statement of changes in equity. Furthermore, evidence in Brown (1997)
confirms that financial analysts regard the statement of changes in equity as one of the least
useful components of the annual report.
Why should salience matter? In traditional models of financial markets, fully rational
investors completely and costlessly process public information regardless of its location or
complexity. In these models, the location of a disclosure cannot affect users’ assessments of the
firm. In contrast, experimental and archival research concludes that market participants have

7
limited cognitive abilities, and as a result, the salience of a disclosure can affect perceptions of
the firm’s performance (e.g., Hirst and Hopkins 1998; Maines and McDaniel 2000; Aboody
1996; Ahmed et al. 2006). Theoretical work that incorporates these cognitive limitations in
models of users’ assimilation of financial reporting information generally supports the notion
that the salience of a disclosure can affect stock price (e.g., Hirshleifer and Teoh 2003).4
With this background, we next consider three related reasons why managers are likely to
fear that reporting comprehensive income in the more salient performance statement will
increase financial statement users’ perceptions of the volatility of the firm’s performance.
First, other comprehensive income items are generally more volatile than net income, so
it is reasonable for managers to believe that more salient reporting of comprehensive income will
lead users to perceive the firm’s performance as more volatile. Hirshleifer and Teoh (2003, HT
hereafter) model a market in which investors have limited attention and limited information
processing ability.5 Because of these cognitive limitations, investors more fully assimilate
information that is more salient, and they fail to fully assimilate identical information that – even
if it is relevant – is less prominent. Because comprehensive income is generally more volatile
than net income, HT’s model implies that reporting comprehensive income in the more salient
performance statement will lead financial statement users to perceive the firm’s performance as
more volatile. Maines and McDaniel (2000, 179) confirm this prediction, concluding that
“nonprofessional investors’ judgments of corporate and management performance reflect the
volatility of comprehensive income only when it is presented in a statement of comprehensive
income.”
4 Daniel et al. (2002) review the burgeoning literature in finance suggesting that rational arbitrage will not necessarily eliminate mispricing arising from investors’ cognitive biases. 5 Hirshleifer and Teoh (2003) review the voluminous behavioral literature supporting their assumptions that

8
The second reason why salient reporting of comprehensive income is likely to increase
users’ perceptions of the volatility of the firm’s performance is that users often fail to fully
assimilate hard-to-process information, such as the differential implications of complex financial
disclosures that have different implications for future earnings (i.e., differential persistence). For
example, in HT’s model, when firms saliently disclose “lumpy” earnings components (employee
stock option expense in their specific example), investors tend to overestimate the persistence of
the current period realization of this lumpy expense. This insight is relevant to our setting
because the four components of other comprehensive income are unrealized gains and losses on:
(1) available-for-sale (hereafter AFS) securities; (2) foreign currency translations; (3) minimum
pension obligations; and (4) certain hedging and derivative activity. These unrealized gains and
losses are complex, they stem from volatile market forces (e.g., stock market trends, foreign
currency exchange rates and interest rates), and as demonstrated by Chambers et al. (2006) they
are transitory in nature. Applying HT’s inattention to differential persistence notion to our
setting suggests that when firms start reporting comprehensive income in the more salient
performance statement, financial statement users are unlikely to fully appreciate the extent to
which the (newly-reported) other comprehensive income items are largely transitory, and this
will in turn lead users to perceive the firm’s performance as more volatile.
The third reason why salient reporting of comprehensive income is likely to increase
users’ perceptions of the volatility of the firm’s performance is that FAS 130 requires firms to
report only a subset of their unrealized gains and losses (i.e., only the four categories listed
above). In contrast, unrealized gains and losses on other assets and liabilities of the firm – which
may be natural or planned hedges for the four items subject to FAS 130 reporting – are not
investors have limited attention and limited information processing abilities.
9
recognized. If a firm reports comprehensive income in a performance statement, users will likely
assimilate the implications of those unrealized gains and losses (Hirst and Hopkins 1998; Maines
and McDaniel 2000). However, HT’s limited attention notion suggests that users will likely fail
to balance these (saliently-reported) other comprehensive income items against offsetting
unrealized gains and losses on other assets and liabilities that are not recognized in the current
accounting model. Thus, when a firm starts disclosing other comprehensive income in a salient
performance statement, to the extent these other comprehensive income items are in fact hedged
by other unrealized gains and losses that are not subject to FAS 130 disclosure requirements,
users are likely to perceive the firm’s performance as more volatile.6
Relatedly, Bloomfield et al. (2006) develop a model showing that if a firm’s other
comprehensive income items are correlated with other information about the firm that is publicly
available,7 investors fail to fully recognize the redundancy of the information in other
comprehensive income items. As a result, investors place more weight on the other
comprehensive income items, and this affects stock price. The authors test their model in a series
of experimental financial markets, and show that when the correlated items are large, the firm’s
stock price is indeed more volatile when comprehensive income appears in the more salient
performance statement than when it appears in a statement of changes in equity.
2.2 Implications of an increase in the perceived volatility of a firm’s performance
Graham et al. (2005, GHR hereafter) report that almost 90 percent of their CFO survey
respondents believe that – even keeping cash flows constant – stakeholders perceive smoother
6 For example, HT (2003, 380) specifically note that their model “suggests that firms that hedge may be viewed by investors as more risky than those that do not if hedge profits are marked-to-market whereas the long-term business risk the firm is hedging is not marked to market.” 7 Such a correlation arises when the unrealized gains and losses on the firm’s AFS securities are correlated with the firm’s returns, for example.

10
earnings paths to be associated with less risky firms. In addition, prior studies that have
examined both professional and non-professional investors’ judgments demonstrate that
investors associate variability in earnings with higher firm risk (Farrelly et al. 1985; Lipe 1998).
Thus, both survey and experimental evidence suggest that even if two firms have the same
volatility in their underlying cash flows, market participants will consider the firm with more
volatile accounting performance as riskier. 8 GHR’s survey shows that managers believe an
increase in the perceived riskiness of the firm will: (1) hurt the firm’s stock price, and (2) hurt
the evaluation of their own performance. We discuss each in turn.
Managers believe that an increase in perceived risk will reduce the firm’s profits and
increase the firm’s cost of capital, both of which hurt stock price. Starting with the effect of
perceived risk on profitability, two-thirds of the CFOs surveyed in GHR say that an increase in
perceived risk of the firm will reduce profits from operations because customers and suppliers
concerned about the firm’s higher risk respond by offering less favorable terms of trade.
Archival evidence suggests this concern is valid. For example, Sommer (1996) shows that as an
insurer’s riskiness increases, the prices customers will pay for insurance (i.e., premium rates)
decrease. Less profitable firm operations drive down stock prices.
Increases in the perceived riskiness of the firm also increase the cost of debt and equity
capital, further driving down stock price. Consistent with Trueman and Titman’s (1988) model
of why managers smooth earnings, over half the CFOs surveyed in GHR fear that an increase in
perceived volatility of the firm’s performance will increase the firm’s risk premium, which in
8 Prior research on how the variability of earnings affects market participants’ perceptions of firm value and risk focuses on the net income measure of earnings, whereas our study focuses on the effects of volatility in comprehensive income. However, the FASB considers comprehensive income to be a notion similar to earnings (FASB 1997, paragraph 26) and comprehensive income is often referred to as an all-inclusive measure of income (FASB 1997, paragraph 2). Thus, we believe it is reasonable to expect that investors will react to volatility in

11
turn increases the costs of equity and debt. Many CFOs go on to say they fear their P/E
multiples will drop and their debt ratings will deteriorate if market participants perceive the firm
as riskier. Archival studies have also shown that more variable earnings performance is
associated with higher beta (Beaver et al. 1970), higher ex ante equity risk premia (Gebhardt et
al. 2001),9 and less favorable debt ratings (West 1970). The collective implication of these
results in our setting is that managers fear reporting comprehensive income in the more salient
performance statement will increase the perceived risk of the firm, which will in turn hurt stock
prices.10
Decreased profitability of operations and lower stock prices are likely to hurt managers’
performance evaluations. In addition, GHR’s survey evidence suggests that higher earnings
volatility (and hence higher perceived risk) can also impair managers’ performance evaluations
more directly. Three-quarters of the respondents in GHR’s survey believe that consistently
achieving earnings benchmarks builds credibility with capital markets and otherwise improves
managers’ external reputations, and Farrell and Whidbee (2003) show that hitting earnings
benchmarks is associated with lower CEO turnover. In a controlled experiment, Maines and
McDaniel (2000) find that when investors evaluate managers’ performance, they penalize
managers’ performance for volatility in other comprehensive income items, but interestingly, this
comprehensive income similarly to volatility in net income, especially when the firm reports comprehensive income in a performance statement. 9 Ryan (1997) reviews the literature that links accounting numbers to market measures of systematic equity risk. Traditional asset pricing models focus on systematic risk but more recent asset pricing models also incorporate idiosyncratic risk. See Goyal and Santa-Clara (2003) for an examination of the pricing of idiosyncratic risk. 10 There is very limited evidence from actual markets on how comprehensive income reporting location affects pricing. We are unaware of any archival study investigating whether reporting comprehensive income in a performance statement results in systematically lower stock price. Although the Chambers et al. (2006) working paper indicates that the pricing multiple on other comprehensive income items does not differ significantly across reporting locations (Chambers et al. 2006, 29), their evidence is not necessarily inconsistent with our hypothesis, which only requires that managers believe that reporting comprehensive income more saliently will hurt the firm’s stock price (as distinct from affecting the pricing multiple).
12
penalty is significant only when the firm reports comprehensive income in a performance
statement (and not when the firm reports comprehensive income in the statement of changes in
equity). Collectively, this evidence suggests that managers would expect a perceived increase in
the volatility of firm performance to hurt evaluation of their own performance.
2.3 Hypotheses
Above we argue that managers believe that reporting comprehensive income in a more
salient performance statement will increase the perceived volatility of the firm’s performance,
which in turn hurts both stock price and evaluations of the CEO’s performance. We expect that
CEOs with the most to lose from lower stock price and poorer performance evaluations will be
most reluctant to use performance reporting.
CEOs with the most to lose from a lower stock price are those whose wealth is most
sensitive to a change in the firm’s stock price, and thus who have the most powerful equity-based
incentives. This leads to our first hypothesis (stated in the alternative):
H1: The likelihood that a firm reports comprehensive income in a statement of changes in equity increases in the power of the CEO’s equity-based incentives. CEOs with the most to lose from a poor performance evaluation are those with less job
security. CEOs are rightfully concerned about job security. The frequency of forced turnovers
increased significantly from 1971 to 1994 (Huson et al. 2001), and the rate of CEO dismissals
further increased by 170% from 1995 to 2003 (Lucier et al. 2004). This leads to our second
hypothesis (stated in the alternative):
H2: The likelihood that a firm reports comprehensive income in a statement of changes in equity increases as the CEO’s job becomes less secure.
3. Research method
3.1 Sample selection and descriptive statistics
13
The comprehensive income data must be hand-collected, so we start with the S&P 500
firms as of December 1998 from Compustat’s Price, Dividend, and Earnings file. We drop 46
firms for which we cannot reliably identify comprehensive income or executive compensation
data from 1998 to 2001.11 To more cleanly isolate the determinants of firms’ long-term
comprehensive income reporting policy choices, we follow Lee et al. (2006) and drop 14 firms
that changed their comprehensive income reporting choice between 1998 and 2001.12 Thus, our
empirical tests investigate the comprehensive income reporting choices of the remaining 440
firms. This broad cross-sectional sample is representative of large firms in the U.S. economy.
Furthermore, the accounting choices of these firms are also of interest in their own right, as the
sample firms comprise 66% of the total market value of NYSE, AMEX, and NASDAQ firms.
About 80% of our sample firms reported other comprehensive income items for the first time in
1998, while the remaining 20% reported other comprehensive income items for the first time in
1999, 2000, or 2001.
Of the 440 sample firms, only 19% (85 firms) report comprehensive income in a
performance statement.13 In contrast, 81% (355 firms) disregard the FASB’s stated preference,
and report comprehensive income in a statement of changes in equity. These results on our
broad cross-sectional sample demonstrate that the high incidence of performance reporting that
11 We drop 43 firms that did not report comprehensive income and three additional firms identified as outliers in our subsequent analysis. Examination of the three outliers’ 10-K reports revealed that all three were involved in confounding spin-off type organizational changes in 1998. Moreover, two of the outlier firms spun-off from the same parent, but we cannot separately identify their CEO compensation because Execucomp sums the cash pay and options across the two firms (i.e., treating the cash and options as if they came from the same firm). 12 The low rate of switches supports our view that the comprehensive income reporting choice is a relatively long-term disclosure commitment. We later examine the firms that changed their comprehensive income reporting in a separate analysis. 13 Of the 85 firms that use a performance statement, 69 firms include a separate statement of comprehensive income, while the remaining 16 use a combined statement of net income and comprehensive income. Because so few firms use the combined statement, we follow Lee et al. (2006), and combine the two performance reporting formats into a single category.

14
Lee et al. (2006) observe in their sample of property-liability insurers (approximately half of
their sample insurers use performance reporting) appears rather unique.14 These differences
suggest that care should be taken in generalizing inferences from the property-liability industry
to the broader population of firms, and also suggest that the propensity to report comprehensive
income in a performance statement may vary across industries.
Table 1 reports descriptive statistics for the first year our sample firms reported
comprehensive income. Other comprehensive income is material for the mean (median) firm in
our sample: the absolute value of other comprehensive income is 12.7% (7.2%) of the absolute
value of net income. Our hypotheses assume that, ex ante, managers expect other
comprehensive income items to be more variable and less predictable than net income
(consistent with the Chambers et al. (2006) evidence that other comprehensive income items are
more transitory in nature). Evidence that the ex post volatility of comprehensive income on
average exceeds that of net income would support this assumption. We compute the standard
deviation of both income series from two years before the firm starts reporting comprehensive
income until 2004. (Throughout the study we use as-reported comprehensive income data. We
are able to obtain these data for two years before the year the firm initially reports
comprehensive income, because FAS 130 requires that in the initial reporting year firms must
also disclose comparative comprehensive income data for the previous two years.) We then
divide the standard deviation of comprehensive income by the standard deviation of net income.
As expected, comprehensive income is on average more volatile than net income – the volatility
of comprehensive income is 29% (9%) greater than the volatility of net income for the mean
14 Additional analyses confirm that the insurance firms in our sample are significantly more likely than the non-insurance firms to report comprehensive income in a performance statement (36% versus 18%; significantly different at p < 0.03).
15
(median) firm. Moreover, comprehensive income is more volatile than net income for 78% of
the firms. These results support our underlying assumption that, ex ante, the average manager
should expect other comprehensive income items to be less predictable and more volatile than
net income.
The last four rows of Table 1 provide evidence on the relative magnitudes of each of the
four components of other comprehensive income (in the year the firm first reported
comprehensive income). Specifically, we divide the absolute value of each component by the
sum of the absolute values of all four components. We also record the number of sample firms
reporting a non-zero value for each component. The most common other comprehensive income
item is unrealized gains and losses on foreign currency translation (FORCURR), with 81% of
our sample firms reporting this item. This component represents more than half of all other
comprehensive income for the mean and median firm. The next most common component is
unrealized gains and losses on AFS securities (MKTSEC), reported by 60% of our sample firms.
For the mean (median) firm this represents more than 30% (8%) of other comprehensive income.
Less than 40% of our sample firms report a pension component and the derivatives-related
component is rare (because most firms started reporting comprehensive income before FAS 133
became effective in 2001). Since the derivative component is so rare in our sample, we do not
separately consider it in our empirical analysis.
3.2 Empirical proxies for CEO reporting incentives
3.2.1 Power of the CEO’s equity-based incentives
We hypothesize that CEOs with more powerful equity-based incentives will have greater
incentives to minimize the perceived volatility of firm performance, and therefore are more
likely to report comprehensive income in the statement of changes in equity. We measure the

16
power of equity-based incentives as the sensitivity of the CEO’s stock and stock option holdings
to changes in stock prices, following Bergstresser and Philippon (2006). Specifically, we first
measure the dollar change in the value of a CEO’s stock and stock option holdings that would
arise from a one percentage point increase in the firm’s stock price:
ONEPCT = the effect of a one percentage point increase in the firm’s stock price on the value of the firm’s shares held by the CEO: (0.01 × PRICE × SHARES), (1) plus the effect of a one percentage point increase in the firm’s stock price on the value of the CEO’s options, following Core and Guay (1999, 2002)15
where:
PRICE = the firm’s share price; SHARES = the number of shares the CEO owns.
We next use ONEPCT to construct EQUITY_INCENTIVE, which is a normalized
measure of the portion of the CEO’s total compensation stemming from a one percentage point
increase in the firm’s stock price:
BONUSSALARYONEPCT
ONEPCTINCENTIVEEQUITY
++=_ (2)
where:
SALARY = the CEO’s salary;
BONUS = the CEO’s cash bonus.
15 Specifically, we divide the CEO’s options into three groups: (1) those awarded in the current year, (2) those awarded in previous years but not yet exercisable, and (3) those that are currently exercisable. For each group, we use Execucomp data to extract or construct measures of the exercise price and other variables in the Black-Scholes option formula. Core and Guay (2002) show that this procedure (first used in Core and Guay 1999) leads to unbiased estimates of the sensitivity of option value to changes in stock prices in broad cross-sectional samples of firms whose options are in-the-money, and these estimates capture more than 99% of the variation in option portfolio value. Only three of our sample firms have out-of-the-money unexercisable options, and omitting these three firms does not affect our inferences. Thus, we believe we have an unbiased estimate.

17
We obtained the stock and stock option ownership information and salary and bonus amounts
from Execucomp, measured at the fiscal year-end of the first year the sample firm reports other
comprehensive income.
3.2.2 Job Security
Our second hypothesis is that the likelihood a firm will choose to report comprehensive
income in a statement of changes in equity increases as the CEO’s job becomes less secure.
More powerful CEOs enjoy greater job security (i.e., lower forced turnover rates), so our proxy
for job security encompasses three dimensions of CEO power.
First, we capture the CEO’s influence on the board of directors by identifying CEOs who
also serve as chairman of the board of directors. As Lucier et al. (2004, 13) note, “a chief
[executive] who is also chairman has far more influence...” Both Lucier et al. (2004) and Desai
et al. (2006) confirm that CEOs who also serve as chairman of the board of directors enjoy
greater job security.
Second, the balance of power between the board of directors and the CEO affects the
CEO’s job security. CEOs have more influence over insider board members. As Weisbach
(1988) notes, it can be costly for an inside director to challenge the CEO to whom his career is
tied. Similarly, the management and accounting literatures argue that stronger and more
independent boards result in higher rates of CEO dismissal (e.g., Friedman and Singh 1989;
Fredrickson et al. 1988; Laux 2006). Consistent with this view, Huson et al. (2001) demonstrate
that more independent boards are associated with greater forced CEO turnover. We therefore
expect CEOs with less independent boards of directors to enjoy greater job security.
Third, the balance of power between the CEO and shareholders also affects the CEO’s
job security. The more the firm’s corporate governance structure tilts the balance of power

18
toward managers and away from shareholders, the greater the CEO’s job security. Following
Bergstresser and Philippon (2006), we use the Gompers et al. (2003) “Governance Score”
(GSCORE hereafter) as a measure of the balance of power between managers and shareholders.
The Gompers et al. (2003) measure captures the extent to which firms have reduced shareholder
rights, so the higher the GSCORE, the more the firm’s power tilts toward managers at the
expense of shareholders.16
Because we expect these three phenomena to reflect different aspects of CEO job
security, our proxy for job security sums these three indicators of CEO power that are all
measured in the first year the firm reports other comprehensive income:
JOB_SECURITY = CHAIRMAN + DIRECTORS + DICTATOR (3) where:
CHAIRMAN = indicator variable that equals one if the CEO is also the chairman of the board of directors; 0 otherwise;
DIRECTORS = an indicator variable that equals one if the percentage of independent
directors on the firm’s board is smaller than the sample median; 0 otherwise;
DICTATOR = an indicator variable that equals one if the firm’s GSCORE (measure of
the extent to which the firm has adopted provisions to reduce shareholder rights) exceeds the sample median; 0 otherwise.17
Higher values of JOB_SECURITY suggest that the CEO has more power, and thus more job
security.18
3.3 Model
16 Gompers et al. (2003) obtain data on the governance provisions from the Investor Responsibility Research Center, which identifies 24 corporate governance provisions for most large firms trading in the U.S. These provisions include tactics for delaying hostile bidders, provisions reducing shareholders’ voting rights, provisions to provide director/officer protection, and other takeover defenses. 17 We thank Andrew Merck for sharing his firm link between Gindex and CRSP. 18 Our measure of job security is somewhat ad hoc, although our use of categorical measures of DIRECTORS and DICTATOR follows the prior literature (e.g., Gompers et al. 2003). To the extent our measure is a noisy reflection

19
We test the determinants of firms’ comprehensive income location choices using the
following logit model:
PERFSTMT = β0 + β1 EQUITY_INCENTIVE + β2 JOB_SECURITY + β3 MKTSEC + β4 PENSION + β5 FORCURR + β6 DISC_QUAL + β7 LEVERAGE + β8 LSIZE + ε (4)
where:
PERFSTMT = indicator variable that equals one if the firm reports comprehensive income in a performance statement, and zero if the firm reports comprehensive income in a statement of changes in equity;
EQUITY_INCENTIVE = the sensitivity of the CEO’s stock and stock option holdings to a
one per cent change in the firm’s stock price, following Bergstresser and Philippon (2006), as explained above;19
JOB_SECURITY = a measure of the CEO’s job security, as explained above; MKTSEC = indicator variable that equals one if the average absolute value of
the unrealized gains and losses from the firm’s AFS securities (hand-collected from the firm’s 10-K report and then deflated by total assets), over the two years prior to and the initial comprehensive income reporting year, exceeds the sample median; 0 otherwise;
PENSION = indicator variable that equals one if the average absolute value of
the unrealized losses resulting from recognition of a minimum pension obligation (hand-collected from the firm’s 10-K report and then deflated by total assets), over the two years prior to and the initial comprehensive income reporting year, exceeds the sample median; 0 otherwise;
FORCURR = indicator variable that equals one if the average absolute value of
unrealized gains and losses from foreign currency translation (hand-collected from the firm’s 10-K report and then deflated by total assets), over the two years prior to and the initial comprehensive income reporting year, exceeds the sample median; 0 otherwise;
DISC_QUAL = the disclosure quality factor extracted following Lee et al. (2006),
as of the end of the comprehensive income reporting year; 20 of the unobservable degree of the CEO’s job security, such noise should simply reduce the power of our tests. 19 Using the natural log or the rank of EQUITY_INCENTIVE does not affect our inferences.

20
LEVERAGE = long-term debt deflated by total assets, as of the end of the initial
comprehensive income reporting year; LSIZE = log of the market value of the firm’s common shares outstanding,
as of the end of the initial comprehensive income reporting year;
H1 predicts that the coefficient on EQUITY_INCENTIVE will be negative if CEOs
whose stock and stock option holdings are more sensitive to changes in the firm’s stock price are
less likely to report comprehensive income in a performance statement. H2 predicts that the
coefficient on JOB_SECURITY will be positive, because we expect CEOs whose jobs are more
(less) secure will be more (less) likely to use the more salient performance reporting.
In addition to the primary variables used in our hypothesis tests, we control for a number
of other factors. Our analysis of the comment letters the FASB received opposing FAS 130
revealed that most of the resistance to performance reporting (that mentioned specific
components of comprehensive income) focused on the unrealized gains and losses on AFS
securities. Specifically, almost twice as many critics expressed concern about the effect of the
volatility in unrealized gains and losses on AFS securities as mentioned pension or foreign
currency translation components. To control for the possibility that the components of other
comprehensive income might affect the firm’s comprehensive income location choice, we
control for MKTSEC, PENSION, and FORCURR. Given the transitory nature of these items,
we expect a three-year average to better reflect the expected level of each component than the
amount observed in any one year. (We do not separately control for the component of other
20 To maximize the power of the factor analysis and minimize estimation error in the extracted disclosure quality factor, we start with all firms listed in the 1998 Compustat file that have data for the bid-ask spread (from CRSP), analyst following (from I/B/E/S), and institutional holdings data (from CDA Spectrum). A principal factor analysis yields one common disclosure quality factor that, as expected, is a negative function of the bid-ask spread, and a positive function of analyst following and institutional holdings. The factor explains about 56% of the total variation in the original variables. We then apply these factor coefficients to our sample firms.
21
comprehensive income related to hedging and derivatives, because this component is zero for
96% of our sample firms. However, sensitivity tests reveal that adding a control for this
component does not affect our inferences.)
Because Lee et al. (2006) find that firms who have committed to higher disclosure quality
in the past are more likely to follow policymakers’ preference to report comprehensive income in
the performance statement, we include their measure of disclosure quality in our model. Their
empirical results suggest that the coefficient on DISC_QUAL will be positive. We also control
for leverage (LEVERAGE) because GHR provides some evidence suggesting that managers of
more levered firms are more concerned with smoothing earnings to minimize the perceived risk
of the firm. Therefore, more highly levered firms may be more likely to report comprehensive
income in a statement of changes in equity. Similar to Lee et al. (2006), we also control for the
log of firm size (LSIZE).
We estimate the model with and without industry controls, because descriptive statistics
reported in the next section reveal significant across-industry differences in the comprehensive
income reporting choice. To control for industry we include a series of indicator variables, with
one for each of the major economic sectors identified by the Global Industry Classification
Standards (GICS) codes developed by S&P and Morgan Stanley Capital International. The
sectors include energy, materials, industrials, consumer discretionary, consumer staples, health
care, utilities, information technology, telecommunication services, and financials.21
We report results based on the model in Equation 4 for parsimony. However, our results
are robust to controlling for a number of other variables. Specifically, we repeated the analysis
21 Bhojraj et al. (2003) show that the GICS industry classification generates more homogenous industry groups (for example, in terms of contemporaneously correlated stock returns, valuation multiples, operating characteristics, and forecasted growth in earnings, sales, and R&D) than SIC codes or the Fama-French (1997) algorithm. Moreover,

22
after including an indicator variable equaling one if the firm uses an industry-specialist auditor,
because Lee et al. (2006) find that insurance firms using one of two industry-specialist auditors
are more likely to report comprehensive income in the performance statement. In our sample,
the industry-specialist auditor variable is not significant, and including it does not affect any of
our inferences. 22 Similarly, including a proxy for firm performance (return on assets), a proxy
for the firm’s financing needs (issuance of debt and equity, scaled by total assets), and the natural
log of the book-to-market ratio does not affect our inferences, and the coefficients on these
control variables are not statistically significant.23
4. Results
4.1 Descriptive statistics
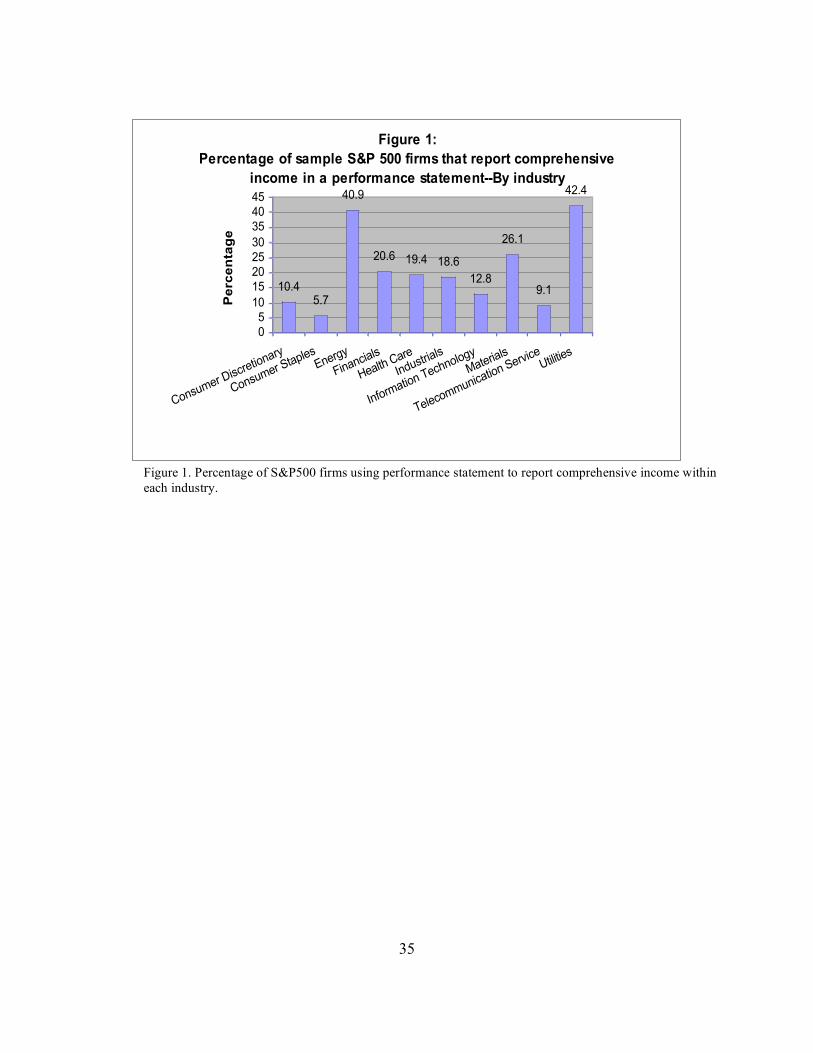
Figure 1 shows that the broad cross-sectional average indicating that only 19% of firms
choose performance reporting masks significant across-industry differences in willingness to
follow policymakers’ preference for performance reporting. Only 10% or fewer of firms in the
consumer discretionary, consumer staples, and telecommunications industries report
comprehensive income in a performance statement, whereas over 25% of firms in the energy,
they show that the GICS advantage is more pronounced for S&P 500 firms than for mid- and small-cap firms. 22 Including the relative volatility of comprehensive income to net income as an additional independent variable in Equation 4 does not affect our inferences, and the coefficient on relative volatility is not significant. This is not necessarily surprising. First, Lee et al. (2006) also find that relative volatility does not explain comprehensive income reporting location choice in their sample. Second, we hypothesize that it is managers’ sensitivity to (their ex ante expectation of) an increase in stakeholders’ perceptions of the volatility of the firm’s performance (as distinct from the ex post level of relative volatility of comprehensive income to net income per se) that explains their comprehensive income reporting location choice. Moreover, if we confine our analysis to firms whose comprehensive income is more volatile than net income, we continue to find that firms whose CEOs have greater equity incentives and lower job security are more likely to relegate comprehensive income to the statement of changes in equity. 23 Ideally, we would also like to include an explicit control for cherry-picking similar to Lee et al. (2006). Unfortunately, we are not able to estimate their measure for our broad-based sample of firms because this requires a time-series of realized gains and losses on AFS securities and only about one-quarter of the firms in our sample disclose this information. Lee et al. (2006) were able to estimate this variable for their sample of property-casualty insurers, because insurers are uniquely required by FAS 60 Accounting and Reporting by Insurance Enterprises (paragraph 50) to separately disclose realized gains and losses on AFS securities. Although we cannot capture ex

23
materials, and utilities industries do so. To the extent that our primary variables,
EQUITY_INCENTIVE and JOB_SECURITY, vary systematically across industries, controlling
for industry abstracts from some of the incentive effect of interest. Thus, we present results
without as well as with the industry controls.
Table 2 reports correlations among the independent variables. The CEO’s equity-based
incentive (EQUITY_INCENTIVE) is greater for firms that have larger absolute unrealized gains
and losses on AFS marketable securities (MKTSEC), better DISC_QUAL, and higher market
value (LSIZE). These equity incentives are negatively associated with large absolute minimum
pension liability adjustments (PENSION) and leverage. Consistent with prior research,
DISC_QUAL is higher for larger firms (Lang and Lundholm 1993; Kasznik and Lev 1995).
4.2 Univariate results
Table 3 compares the values of our model’s explanatory variables across two subsamples,
partitioned based on comprehensive income reporting location.24 Firms who ignore the FASB’s
preference for performance reporting and adopt the less transparent statement of changes in
equity are headed by CEOs who have greater EQUITY_INCENTIVE (p ≤ 0.001) and less
JOB_SECURITY (p < 0.05 per t-test; p < 0.10 per Wilcoxon rank sum test). This descriptive
univariate evidence is consistent with our hypotheses that CEOs with more powerful equity-
based incentives and less job security will be less willing to report comprehensive income in the
more salient performance reporting location.
Firms that choose performance reporting are less likely to have large absolute unrealized
gains and losses on AFS securities (MKTSEC) than are firms that report comprehensive income
post cherry-picking, our MKTSEC variable is similar in spirit because it captures the ex ante opportunity to cherry-pick (which is a necessary, though not sufficient condition for actual cherry-picking). 24 To ensure the inferences are not attributable to extreme values, we winsorize continuous variables at 1% and 99%.

24
in a statement of changes in equity (p < 0.05). This result is consistent with the notion that firms
with more opportunity to manage income through selective sales of AFS marketable securities
(i.e., MKTSEC =1) are more inclined to report comprehensive income in the statement of
changes in equity, which makes comprehensive income (and thus any strategic selective sales of
AFS securities) less salient. Interestingly, none of the other control variables differ significantly
across the reporting location choices. This similarity of the two subsamples of firms on other
key dimensions supports the contention that CEO equity-based incentives and CEO job security
(and not other differences in firm characteristics) are in fact important explanators of firms’
comprehensive income reporting choices.
4.3 Logit results
Table 4 displays the results of estimating the logit model in Equation 4.25 The results
support our hypothesis that CEOs whose stock and stock option holdings are more sensitive to
changes in stock price will be less willing to follow the FASB’s recommendation to report
comprehensive income in the more salient performance statement. Specifically, firms whose
CEOs have higher EQUITY_INCENTIVE are less likely to report comprehensive income in a
performance statement, whether or not we control for industry (p ≤ 0.001). The effect of the
CEO’s equity incentives on comprehensive income reporting choice is economically (as well as
statistically) significant. Moving from the 25th percentile to the 75th percentile of the distribution
of EQUITY_INCENTIVE leads to a 5.7 percentage point decrease in the probability that the
firm reports comprehensive income in a performance statement.26 This decline is material given
25 All significance levels are based on robust standard errors that correct for heteroscedasticity and also allow for dependence across firms within the same industry (Froot 1989). 26 To calculate the estimated probability, we set all variables equal to their mean values except the variable of interest (e.g., EQUITY_INCENTIVE). We set the value of this variable equal to the 25th percentile of the sample distribution and calculate the predicted probability of performance reporting based on our model. We then set the

25
that the unconditional probability of choosing performance reporting is only 19 per cent (i.e., it
represents a 30 per cent decline in the probability of performance reporting).
Table 4 also shows that firms whose CEOs enjoy greater JOB_SECURITY are more
likely to follow the FASB’s recommendation for performance reporting, consistent with our
second hypothesis (p < 0.05). Again, the job security effect is economically significant. Moving
from the 25th percentile to the 75th percentile of the distribution of JOB_SECURITY leads to a
4.1 percentage point increase in the probability of reporting comprehensive income in a
performance statement. We also determine the difference in probability of performance
reporting between CEOs with the lowest level of job security versus those with the highest level.
Moving from the lowest to highest level of job security increases the probability of choosing the
performance reporting by 12.4 percentage points. Both increases are material relative to the 19
per cent unconditional probability of choosing performance reporting.
Finally, firms with large absolute unrealized gains and losses on AFS securities (i.e.,
MKTSEC = one) are less likely to report comprehensive income in a performance statement (p >
0.01). This is consistent with the notion that firms enjoying more opportunity to manage
earnings through selective sale of AFS securities are less apt to choose the reporting location that
would render any such earnings management more transparent. Once again, the effect is
economically significant. Moving from the bottom to the top half of the distribution of
MKTSEC leads to an 8.4 percentage point decline in the probability of performance reporting.
This is a large drop relative to the 19 per cent unconditional probability of choosing performance
reporting.
variable of interest to the 75th percentile and calculate a second predicted probability. The difference between these two values is the estimated change in probability that the firm chooses performance reporting.

26
DISC_QUAL is marginally positively significant (p = 0.09) in the logit model that does
not include the industry controls. This provides weak evidence from a broad cross-sectional
sample of firms that is consistent with the Lee et al. (2006) finding that insurers who have a
history of higher quality reporting are more likely to report comprehensive income in the more
salient performance statement. After controlling for industry, however, disclosure quality
becomes insignificant.27 As in the univariate tests, the pension and foreign currency components
of other comprehensive income, leverage, and size are not significant incremental explanators of
firms’ comprehensive income reporting choice. Firms in the consumer discretionary, consumer
staples, and telecommunications industries are significantly less likely to use performance
reporting than are financial institutions (whose impact is impounded in the intercept), whereas
firms in the energy and utility industries are significantly more likely to use performance
reporting.
4.4 Analysis of firms changing their comprehensive income reporting location
To help ensure that our inferences are not simply an artifact of some unidentified
correlated omitted variable, we now examine a (necessarily small) sample of firms that changed
their comprehensive income reporting between 1998 and 2001. We start with the 14 firms in the
S&P 500 (as of December 1998) that we omitted from our primary sample because they changed
their comprehensive income reporting choice between their initial reporting year and 2001. We
then examined the 133 firms included in the October 2002 S&P 500 that were not in our original
sample (which was based on the December 1998 S&P 500), and identified six firms that changed
their comprehensive income reporting location between 1998 and 2001. This yields a sample of
27 In additional analyses (not tabulated in detail here), we find that the disclosure quality index varies across industries. The energy and service industries have high disclosure quality, while industrial and materials industries have lower disclosure quality. Controlling for industry abstracts from the industry-average effects of disclosure

27
20 firms that changed their comprehensive reporting location between 1998 and 2001.28
Table 5 Panel A provides descriptive statistics on these 20 firms that changed their
comprehensive reporting location. Specifically, we report the changes in our explanatory
variables between the year the firm first reported comprehensive income and the year the firm
changed its comprehensive income reporting location. We denote these “change” variables with
the prefix CHG. Beginning with the seven firms that changed to the more salient performance
reporting, the first column of Panel A shows that on average, EQUITY_INCENTIVE decreased,
while JOB_SECURITY increased. In stark contrast, for the 13 firms that changed from
performance reporting to a statement of changes in equity, EQUITY_INCENTIVE increased and
JOB_SECURITY decreased. Although these differences are marginally significant in a strict
statistical sense (p values range from 0.03 to 0.08), given the small sample size we consider these
results consistent with increasingly powerful equity incentives and reduced job security reducing
the likelihood of reporting comprehensive income in the more salient performance statement.
None of the other explanatory variables changed significantly between the initial comprehensive
income reporting year and the year the firm changed the comprehensive reporting location.
In Panel B, we report the results of a logit analysis on the 20 change firms, where the
dependent variable equals one for firms that change to reporting comprehensive income in a
performance statement (from a statement of changes in equity); zero otherwise. For our
independent variables we include only the change version of the three variables with explanatory
power in our primary model, CHGEQUITY_INCENTIVE, CHGJOB_SECURITY, and
CHGMKTSEC. We omit the other variables from this logit because we have few degrees of
quality on the comprehensive income reporting choice. 28 Restricting our analysis to the 14 change firms deleted from our original sample yields similar inferences. We report results based on the larger sample to help ensure that our inferences are robust.

28
freedom.29 Consistent with the univariate change analysis, we find that the coefficient is
negative on CHGEQUITY_INCENTIVE (p = 0.07) and positive on CHGJOB_SECURITY (p =
0.01). The coefficient on CHGMKTSEC is negative but not significantly different from zero.
These change results are consistent with our levels analysis and further support our hypotheses
that CEOs with the most to lose from increased perceptions of volatility of firm performance are
more likely to report comprehensive income in a less salient manner.
5. Conclusions
Policymakers have stated a preference that firms report comprehensive income in a
performance statement rather than in the statement of changes in equity. As this is simply a
reporting location choice, one would expect firms to follow this recommendation so they could
tout the transparency of their financial reporting. However, over 80% of our sample S&P 500
firms do not follow policymakers’ recommendation, and instead relegate comprehensive income
to the statement of change in equity. Our study provides new insight into why so many firms are
reluctant to follow the FASB’s preference for reporting comprehensive income in the more
salient performance statement.
We draw on prior research to explain why we expect CEOs to believe that reporting
comprehensive income – which is typically more volatile than net income – in a performance
statement will increase the perceived volatility of the firm’s performance. We then discuss
survey and experimental evidence suggesting that managers believe an increase in the perceived
volatility of firm performance will hurt both the firm’s stock price and their own performance
evaluation. Consequently, CEOs who are most likely to be hurt by higher perceived volatility
29 Inferences are similar if we include the change in all variables, although the p values on CHGEQUITY_INCENTIVE and CHGJOB_SECURITY increase to 0.10 and to 0.05, respectively and none of the control variables are significant.

29
are those with more powerful equity-based incentives (that will be devalued by a lower stock
price) and those with less job security (who have more to fear from poor performance
evaluation).
Our evidence is consistent with our hypotheses that CEOs’ sensitivity to perceived
increases in the volatility of the firm’s performance affects the firm’s comprehensive income
reporting choice. Specifically, we find that when CEOs’ stock and stock holdings are more
sensitive to changes in stock price, or CEOs have less secure positions, the firm is less likely to
report comprehensive income in a performance statement and more likely to report it in a
statement of changes in equity. The magnitudes of these effects are economically significant,
and the results hold even after controlling for industry and other variables often related to
accounting choice (e.g., leverage and firm size). Additional analysis of the small sample of firms
that changed their comprehensive income reporting location further supports our inferences.
We also find that firms with large (absolute) unrealized gains and losses on AFS
marketable securities are less likely to report comprehensive income in the FASB’s preferred
performance statement. This result is consistent with the notion that firms with more opportunity
to manage income through selective sales of AFS securities are more likely to relegate
comprehensive income to the statement of changes in equity, which makes comprehensive
income (and thus any selective sales of AFS securities) less salient.
Our evidence sheds light on an important consequence of financial reporting standards
that allow disclosure alternatives: A relatively subtle (and previously unexplored) aspect of
managers’ self-interest – their sensitivity to the perceived volatility of the firm’s performance –
is associated with their accounting choices. Specifically, managers who are more likely to be
hurt by an increase in the perceived volatility of firm performance (those with less secure

30
positions or more equity-based incentives) are less likely to follow policymakers’ preference for
the more transparent performance reporting that makes comprehensive income more salient.30
These results also suggest that financial statement users keep such managerial incentives in
mind, taking particular care in evaluating comprehensive income relegated to the statement of
changes in equity.
Our evidence that CEOs with less job security on average make reporting choices that
reduce transparency is of interest in its own right, and also helps fill the void that Graham et al.
(2005) identify when they point out the dearth of evidence on how other attributes of managers’
welfare (beyond equity-based incentives) affect their financial reporting choices. We also find
that CEOs with stronger equity-based compensation incentives report comprehensive income in
a less transparent manner. This evidence extends prior research showing that equity-based
compensation increases incentives for earnings management (e.g., Cheng and Warfield 2005:
Coles et al. 2006; Bergstresser and Philippon 2006) by providing evidence that equity incentives
affect another accounting choice – the decision to disclose comprehensive income in a more or
less salient location. Finally, comment letters on the initial FAS 130 proposal expressed
managers’ concern that performance reporting would lead stakeholders to view the firm’s
performance as more volatile. Because we find that managers’ comprehensive income reporting
choices reflect the extent to which they have reason to be concerned about an increase in
stakeholders’ perceptions of the volatility of firm performance, our evidence suggests that
managers act as if the concerns expressed in the comment letters are real (as distinct from
excuses).
30 Note that our study cannot tell policymakers whether reporting comprehensive income in a performance statement or in the statement of changes in equity results in stock prices and evaluations of CEO performance that better reflect the true (unobservable) economics of the firm.

31
References
Aboody, D. 1996. Recognition versus disclosure in the oil and gas industry. Journal of Accounting Research 34 (3): 21-32.
Ahmed, A., E. Kilic, and G. Lobo. 2006. Does recognition versus disclosure matter? Evidence
from value-relevance of banks’ recognized and disclosed derivative financial instruments. The Accounting Review 81 (3): 567-588.
Barth, M., W. Landsman, and J. Wahlen. 1995. Fair value accounting: Effects on banks’ earnings
volatility, regulatory capital, and value of contractual cash flows. Journal of Banking & Finance 19 (3-4): 577-605.
Beaver, W., P. Kettler, and M. Scholes. 1970. The association between market determined and
accounting determined risk measures. The Accounting Review 45 (3): 654-682. Bergstresser, D., and T. Philippon. 2006. CEO incentives and earnings management. Journal of
Financial Economics 80 (3): 511-529. Bhamornsiri, S. and C. Wiggins. 2001. Comprehensive income disclosures. The CPA Journal
(October): 54-56. Bhojraj, S., C. Lee, and D. Oler. 2003. What’s my line? A comparison of industry
classification schemes for capital market research. Journal of Accounting Research 41 (5): 745-774.
Bloomfield, R., 2002. The ‘Incomplete relevation hypothesis’ and financial reporting.
Accounting Horizons 16 (3): 233-243. Bloomfield, R., Nelson, M., Smith, S. 2006. Feedback loops, fair value accounting and
correlated investments. Review of Accounting Studies, forthcoming. Brown, P. 1997. Financial data and decision making by sell-side analysts. Journal of Financial
Statement Analysis : 43-48. Burns, N., and S. Kedia. 2006. The impact of performance-based compensation on
misreporting. Journal of Financial Economics 79 (1): 35-67. Campbell, L., D. Crawford, and D. Franz. 1999. How companies are complying with the
comprehensive income disclosure requirements. Ohio CPA Journal (Jan-March): 13-19. Chambers, D., T. Linsmeier, C. Shakespeare, and T. Sougiannis. 2006. An evaluation of SFAS
No. 130 Comprehensive Income Disclosures. Working paper. Cheng, Q. and T. Warfield. 2005. Equity incentives and earnings management. The Accounting

32
Review 80 (2): 441-476. Coles, J., M. Hertzel, and S. Kalpathy. 2006. Earnings management around employee stock
option reissues. Journal of Accounting & Economics 41 (1-2): 173-200. Core, J. and W. Guay. 1999. The use of equity grants to manage optimal equity incentive levels.
Journal of Accounting and Economics 28 (2): 151-184. Core, J. and W. Guay. 2002. Estimating the value of employee stock option portfolios and their
sensitivities to price and volatility. Journal of Accounting Research 40 (3): 613-630. Daniel, K., D. Hirshleifer, and S. Teoh. 2002. Investor psychology in capital markets: Evidence
and policy implications. Journal of Monetary Economics 49:139-209. Desai, H., C. Hogan, and M. Wilkins. 2006. The reputational penalty for aggressive accounting:
Earnings restatements and management turnover. The Accounting Review 81 (1): 83-112. Fama, E., and K. French. 1997. Industry costs of equity. Journal of Financial Economics 43
(2): 153-193. Farrell, K., and D. Whidbee. 2003. Impact of firm performance expectations on CEO turnover
and replacement decisions. Journal of Accounting and Economics 36 (1-3):165-196. Farrelly, G., K. Ferris, and W. Reichenstein. 1985. Perceived risk, market risk, and accounting
determined risk measures. The Accounting Review 60 (2): 278-288. Financial Accounting Standards Board. Project Update: Financial Statement Presentation, as
updated on April 26, 2006, Available from www.fasb.org. Fredrickson, J., D. Hambrick, and S. Baumrin. 1988. A model of CEO dismissal. Academy of
Management Review 13 (2): 255-270. Friedman, S. and H. Singh. 1989. CEO succession and stockholder reaction: The influence of
organizational context and event content. Academy of Management Journal 32 (4): 718-744.
Froot, K. A. 1989. Consistent covariance matrix estimation with cross-sectional dependence and
heteroskedasticity in financial data. Journal of Financial and Quantitative Analysis 24: 333–355.
Gebhardt, W., C. M. C. Lee, and B. Swaminathan. 2001. Toward an Implied Cost of Capital.
Journal of Accounting Research 39 (1): 135-176. Godwin,N., K. Petroni, and J. Wahlen. 1998. Fair value accounting for property-liability
insurers and classification decisions under FAS 115. Journal of Accounting, Auditing,

33
and Finance 13 (3): 207-239. Gompers, P., J. Ishii, and A. Metrick. 2003. Corporate governance and equity prices. Quarterly
Journal of Economics 118 (February): 107-155. Goyal, A. and P. Santa-Clara. 2003. Idiosyncratic risk matters! Journal of Finance 58 (3): 975-
1007. Graham, J., C. Harvey, and S. Rajgopal. 2005. The economic implications of corporate financial
reporting. Journal of Accounting and Economics 40 (1-3): 3-73.
Hirshleifer, D., and S.H. Teoh. 2003. Limited attention, information disclosure, and financial reporting. Journal of Accounting and Economics 36 (1-3):337-386.
Hirst, D., and P. Hopkins. 1998. Comprehensive income reporting and analysts' valuation
judgments. Journal of Accounting Research 36 (Supplement): 47-75. Hodder, L., P. Hopkins, and J. Wahlen. 2006. Risk-relevance of fair-value income measures for
commercial banks. The Accounting Review 81 (2): 337-375. Hunton, J., R. Libby, and C. Mazza. 2006. Financial reporting transparency and earnings
management. The Accounting Review 81 (1): 135-157. Huson, M., R. Parrino, and L. Starks. 2001. Internal monitoring mechanisms and CEO
turnover: A long-term perspective. Journal of Finance 56 (6): 2265-2297. International Accounting Standards Board. 2006. Exposure Draft of Proposed Amendments to
IAS 1 Presentation of Financial Statements: A Revised Presentation. London, United Kingdom: IASB.
Laux, V. 2006. Board independence and CEO turnover. Working paper, Goethe University
Frankfurt. Lee, Y., M. Shen, and K. Petroni. 2006. Cherry picking, disclosure quality, and comprehensive
income reporting choices: The case of property-liability insurers. Contemporary Accounting Research 23 (3): 655-700.
Lipe, M. 1998. Individual investors' risk judgments and investment decisions: The impact of
accounting and market data. Accounting Organizations and Society 23 (7): 625-640. Lucier, C., R. Schuyt, and J. Handa. 2004. CEO Succession 2003: The Perils of ‘Good’
Governance. Mc Lean, VA: Booz Allen Hamilton. Maines, L. 1990. The Effect of Forecast Redundancy on Judgments of a Consensus Forecast's
Expected Accuracy. Journal of Accounting Research 28 (Supplement): 29-47.

34
Maines, L, and L. McDaniel. 2000. Effects of comprehensive income volatility on
nonprofessional investors’ judgments: the role of presentation format. The Accounting Review 75 (2): 179-207.
Pandit, G., A. Rubenfield, and J. Phillips. 2006. Current NASDAQ corporation methods of
reporting comprehensive income. Mid-American Journal of Business 21 (1): 13-19. Ryan, S. 1997. A survey of research relating accounting numbers to systematic equity risk, with
implications for risk disclosure policy and future research. Accounting Horizons 11 (2): 82-95.
Sommer, D. 1996. The impact of firm risk on property-liability insurance prices. Journal of Risk
and Insurance 63: 501-514. Trueman, B. and S. Titman. 1988. An explanation for accounting income smoothing. Journal of
Accounting Research 26 (1):127-139. Weisbach, M. 1988. Outside directors and CEO turnover. Journal of Financial Economics 20:
341-460. West, R. 1970. An alternative approach to predicting corporate bond ratings. Journal of
Accounting Research 8 (1): 118-125.
35
Figure 1:
Percentage of sample S&P 500 firms that report comprehensive
income in a performance statement--By industry
10.45.7
40.9
20.6 19.4 18.6
12.8
26.1
9.1
42.4
0
5
10
15
20
25
30
35
40
45
Consumer Discretionary
Consumer Staples
Energy
Financials
Health Care
Industrials
Information Technology
Materials
Telecommunication ServiceUtiliti
es
Pe
rce
nta
ge
Figure 1. Percentage of S&P500 firms using performance statement to report comprehensive income within each industry.

36
Table 1 Descriptive statistics for comprehensive income and its components
N Mean Std Dev
Lower Quartile Median Upper
Quartile
Absolute value of other comprehensive income Absolute value of net income
440 0.127 0.221 0.027 0.072 0.142
Standard deviation of comprehensive income Standard deviation of net income
(n>1)/100=78% 440 1.288 0.576 1.004 1.093 1.400
Absolute value of MKTSEC Sum of the absolute values of other comprehensive income items
(n>0)/100=60%
440 0.309 0.385 0.000 0.083 0.691
Absolute value of PENSION Sum of the absolute values of other comprehensive income items
(n>0)/100=39%
440 0.113 0.242 0.000 0.000 0.088
Absolute value of FORCURR Sum of the absolute values of other comprehensive income items
(n>0)/100=81%
440 0.554 0.407 0.075 0.700 0.954
Absolute value of DERIVATIVES Sum of the absolute values of other comprehensive income items
(n>0)/100=4%
440 0.022 0.135 0.000 0.000 0.000
Table 1 reports descriptive statistics for comprehensive income and its components in the first year our sample S&P 500 firms report comprehensive income. MKTSEC is the unrealized gains and losses from the firm’s AFS securities. PENSION is the unrealized losses resulting from recognition of a minimum pension obligation. FORCURR is the unrealized gains and losses from foreign currency translation. DERIVATIVES is the unrealized gains and losses related to hedging and derivative activity.
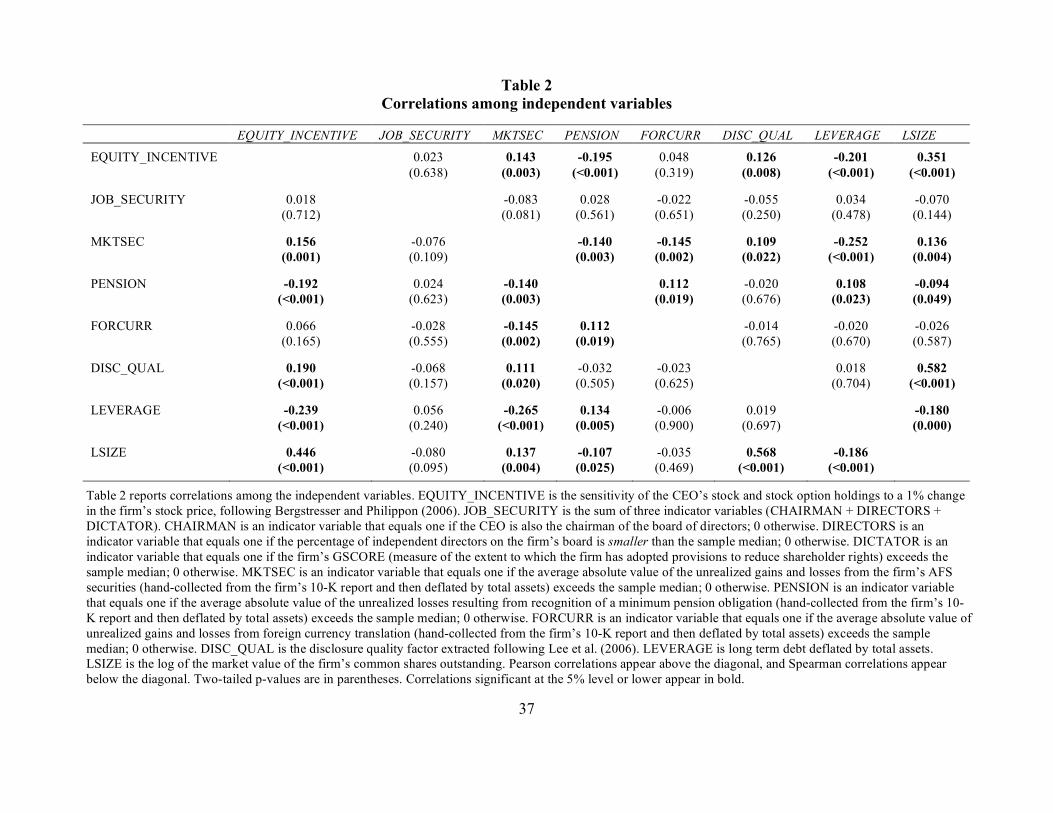
37
Table 2 Correlations among independent variables
EQUITY_INCENTIVE JOB_SECURITY MKTSEC PENSION FORCURR DISC_QUAL LEVERAGE LSIZE EQUITY_INCENTIVE 0.023 0.143 -0.195 0.048 0.126 -0.201 0.351 (0.638) (0.003) (<0.001) (0.319) (0.008) (<0.001) (<0.001)
JOB_SECURITY 0.018 -0.083 0.028 -0.022 -0.055 0.034 -0.070 (0.712) (0.081) (0.561) (0.651) (0.250) (0.478) (0.144)
MKTSEC 0.156 -0.076 -0.140 -0.145 0.109 -0.252 0.136 (0.001) (0.109) (0.003) (0.002) (0.022) (<0.001) (0.004)
PENSION -0.192 0.024 -0.140 0.112 -0.020 0.108 -0.094 (<0.001) (0.623) (0.003) (0.019) (0.676) (0.023) (0.049)
FORCURR 0.066 -0.028 -0.145 0.112 -0.014 -0.020 -0.026 (0.165) (0.555) (0.002) (0.019) (0.765) (0.670) (0.587)
DISC_QUAL 0.190 -0.068 0.111 -0.032 -0.023 0.018 0.582 (<0.001) (0.157) (0.020) (0.505) (0.625) (0.704) (<0.001)
LEVERAGE -0.239 0.056 -0.265 0.134 -0.006 0.019 -0.180 (<0.001) (0.240) (<0.001) (0.005) (0.900) (0.697) (0.000)
LSIZE 0.446 -0.080 0.137 -0.107 -0.035 0.568 -0.186 (<0.001) (0.095) (0.004) (0.025) (0.469) (<0.001) (<0.001)
Table 2 reports correlations among the independent variables. EQUITY_INCENTIVE is the sensitivity of the CEO’s stock and stock option holdings to a 1% change in the firm’s stock price, following Bergstresser and Philippon (2006). JOB_SECURITY is the sum of three indicator variables (CHAIRMAN + DIRECTORS + DICTATOR). CHAIRMAN is an indicator variable that equals one if the CEO is also the chairman of the board of directors; 0 otherwise. DIRECTORS is an indicator variable that equals one if the percentage of independent directors on the firm’s board is smaller than the sample median; 0 otherwise. DICTATOR is an indicator variable that equals one if the firm’s GSCORE (measure of the extent to which the firm has adopted provisions to reduce shareholder rights) exceeds the sample median; 0 otherwise. MKTSEC is an indicator variable that equals one if the average absolute value of the unrealized gains and losses from the firm’s AFS securities (hand-collected from the firm’s 10-K report and then deflated by total assets) exceeds the sample median; 0 otherwise. PENSION is an indicator variable that equals one if the average absolute value of the unrealized losses resulting from recognition of a minimum pension obligation (hand-collected from the firm’s 10-K report and then deflated by total assets) exceeds the sample median; 0 otherwise. FORCURR is an indicator variable that equals one if the average absolute value of unrealized gains and losses from foreign currency translation (hand-collected from the firm’s 10-K report and then deflated by total assets) exceeds the sample median; 0 otherwise. DISC_QUAL is the disclosure quality factor extracted following Lee et al. (2006). LEVERAGE is long term debt deflated by total assets. LSIZE is the log of the market value of the firm’s common shares outstanding. Pearson correlations appear above the diagonal, and Spearman correlations appear below the diagonal. Two-tailed p-values are in parentheses. Correlations significant at the 5% level or lower appear in bold.

38
Table 3 Univariate tests of differences between firms reporting comprehensive income in a
performance statement versus a statement of changes in equity
Performance Statement
Changes in Equity
Variable Mean (Median)
n=85
Mean (Median)
n=355
Expected difference:
Performance statement –changes in
equity statement
Actual difference:
Performance statement – changes in
equity statement
P-value of difference*
Primary Variables: 0.218 0.310 -0.092 0.000 EQUITY_INCENTIVE (0.161) (0.221) - (-0.060) (0.001)
2.012 1.870 0.142 0.038 JOB_SECURITY (2.000) (2.000) + (0.000) (0.080)
Control Variables: 0.400 0.524 -0.124 0.040 MKTSEC (0.000) (1.000) ? (-1.00) (0.040)
0.435 0.375 0.061 0.313 PENSION (0.000) (0.000) ? (0.000) (0.303)
0.424 0.518 -.095 0.117 FORCURR (0.000) (1.000) ? (-1.00) (0.117)
1.759 1.686 0.073 0.158 DISC_QUAL (1.706) (1.657) + (0.049) (0.259)
0.232 0.213 0.019 0.260 LEVERAGE (0.222) (0.194) ? (0.029) (0.237)
8.971 9.065 -.094 0.511 LSIZE (8.818) (9.005) ? (-.187)
(0.390)
Table 3 compares the values of the explanatory variables across two subsamples partitioned based on comprehensive income reporting choice. Variables are defined in Table 2. Reported p-values are based on two-sample t tests and Wilcoxon rank-sum tests. Reported p-values are based on one-tailed significance levels for variables with predictions, and two-tailed significance levels for variables without predictions.

39
Table 4 Logit analysis of comprehensive income reporting choice
(Dependent variable = 1 if the firm reports comprehensive income in a performance statement)
(1) (2)
Primary Variables:
Predicted sign Without industry controls With industry controls
- -2.002 -1.487 EQUITY_INCENTIVE (0.000) (0.001)
+ 0.294 0.328 JOB_SECURITY (0.031) (0.043)
Control Variables: - -0.496 -0.616 MKTSEC (0.003) (0.001) ? 0.087 0.039 PENSION (0.632) (0.812) ? -0.416 -0.223 FORCURR (0.138) (0.407)
+ 0.401 0.210 DISC_QUAL (0.090) (0.275) ? -0.216 -0.410 LEVERAGE (0.835) (0.685) ? -0.008 0.047 LSIZE (0.962) (0.799)
Industry Dummies: ? -0.975 Consumer Discretionary (0.000) ? -1.564 Consumer Staples (0.000) ? 0.579 Energy (0.022) ? -0.002 Health Care (0.991) ? -0.255 Industrials (0.391) ? -0.341 Information Technology (0.164) ? -0.013 Materials (0.970) ? -1.292 Telecommunication
Service (0.000)
? 0.708 Utilities (0.003)
Observations 440 440 McKelvey and Zavoina's R2 0.117 0.186

40
Table 4 reports the results of the logit analysis of comprehensive income reporting choices. The dependent variable equals 1 if a firm reports comprehensive income in a performance statement, and 0 otherwise. Independent variables are defined in table 2, except industry dummies are indicator variables that equal 1 if a firm is in the given industry, 0 otherwise. Reported p-values (in parentheses) are based on White-adjusted standard errors, corrected for correlation across firms within a given industry. Reported p-values are based on one-tailed significance levels for variables with predictions, and two-tailed significance levels for variables without predictions.

41
Table 5 Analysis of firms that change comprehensive income reporting location from 1998-2001
Panel A: Univariate tests of differences between firms changing reporting location
(1) (2)
Change to Performance
Statement
Change to Stmt. of Changes in
Equity Variable Mean (Median)
n=7
Mean (Median)
n=13
Expected difference:
(1)-(2)
Actual difference:
(1)-(2)
P-value of difference
-0.141 0.059 -0.200 0.073 CHGEQUITY_INCENTIVE (-0.040) (0.048) - (-0.089) (0.034)
0.429 -0.385 0.813 0.065 CHGJOB_SECURITY (0.000) (0.000) + (0.000) (0.082)
0.286 0.615 -0.330 0.179 CHGMKTSEC (0.000) (1.000) ? (-1.00) (0.185)
0.143 0.231 -0.088 0.647 CHGPENSION (0.000) (0.000) ? (0.000) (0.689)
0.429 0.308 0.121 0.627 CHGFORCURR (0.000) (0.000) ? (0.000) (0.632)
-0.019 0.068 -0.087 0.707 CHGDISC_QUAL (0.019) (-0.045) + (0.064) (0.500)
0.259 0.320 -0.061 0.473 CHGLEVERAGE (0.321) (0.293) ? (0.029) (0.634)
8.723 8.957 -0.233 0.672 CHGLSIZE (8.423) (8.725) ? (-0.302) (0.579)
Panel B: Logit analysis of firms’ decision to change comprehensive income reporting location
Predicted sign Dependent Variable=1 if Change to Performance Statement
CHGEQUITY_INCENTIVE - -5.681 (0.072)
CHGJOB_SECURITY + 1.144 (0.012)
CHGMKTSEC ? -1.55 (0.226)
Observations 20 McKelvey and Zavoina's R2 0.583
Table 5 Panel A reports descriptive statistics on firms that change comprehensive income reporting location over the 1998-2001 period. CHGEQUITY_INCENTIVE is the difference in EQUITY_INCENTIVE between the year the firm changed its comprehensive income reporting location and the initial year it reported comprehensive income. Similarly, CHGJOB_SECURITY, CHGMKTSEC, CHGPENSION, CHGFORCURR, CHGDISC_QUAL,

42
CHGLEVERAGE, and CHGLSIZE are the changes in the original variables (defined in Table 2) between the year the firm changed its comprehensive income reporting location and the initial year the firm reported comprehensive income. Reported p-values are based on two-sample t tests and Wilcoxon rank-sum tests and are based on one-tailed significance levels for variables with predictions, and two-tailed significance levels for variables without predictions.
In Panel B the dependent variable equals 1 for firms that change from reporting comprehensive income the statement of changes in equity to a performance statement, 0 if firms change from a performance statement to the statement of changes in equity. Independent variables are as defined in Panel A. Reported p-values are based on one-tailed significance levels for variables with predictions and two-tailed for variables without predictions, and are based on the White-adjusted standard errors.