comprehensive lipid profiling of human liver tissue
TRANSCRIPT

p 1
Comprehensive Lipid Profiling of Human Liver Tissue Extracts of Non-Alcoholic Fatty Liver Disease Multiplexed Precursor Ion Scanning and LipidView™ Software
Brigitte Simons1 and Bianca Arendt2 1AB SCIEX, Canada, 2University of Toronto / Toronto General Hospital, Canada Non-alcoholic fatty liver disease (NAFLD) is clinically characterized as uncontrolled fat accumulation in the liver resulting in inflammatory responses, insulin resistance, elevated liver enzymes, and ultimately liver failure1. Currently, there are no clinical lipid markers detectable by blood test to ascertain the manifestation of improper fat regulation in the liver. The cell membranes of hepatocytes consist of an asymmetrical distribution of phosphatidylcholine (PC) and phosphatidyl ethanolamine (PE) lipids localized to the outer and inner bilayers respectively and these lipids co-exist in a fine balance to maintain cell membrane fluidity and integrity. The PC/PE ratio is thought to be off-balance in hepatocytes stricken by inflammation and un-regulated lipid metabolism1. The PC/PE ratio can be determined through targeted and quantitative MS measurements of all PC and PE lipids in liver tissue lipid extracts by multiplexed precursor ion scanning.
Targeted Lipid Profiling Using Multiplexed Precursor Ion Scanning on the QTRAP® 5500 System Targeted lipid class profiling is best executed on triple quadrupole instruments (QqQ) that combine highly sensitive precursor ion scanning, good quantitative reproducibility, in a wide linear dynamic range. The AB SCIEX QTRAP® 5500 System offers the very fast quadrupole scanning, up to 2000 Da/s, achieving a wide mass range survey scan in milliseconds
and delivering improvements in sensitivity and reproducible quantification. In addition, a total of 60 combinations of PIS and NL experiments can be acquired per infusion based time period enabling the multiplexing of a high number of lipid class-specific precursor ion fragment targets, in both positive and negative polarities in a single method. Post-acquisition data processing of these highly multiplexed scanning approaches can now be fully automated using LipidView™ Software for lipid identification and quantification.
Taken together in combination with the simplicity of shotgun lipidomics by direct infusion, a complete solution to lipid species characterization and quantification of liver tissues lipid extracts is presented (Figure 1).
Figure 1. Shotgun Lipidomics Workflow. This workflow includes automated sample infusion, multiplexed precursor ion scanning (XPIS) acquisition on the QTRAP® 5500 System and automated lipid identification and quantification using LipidView™ Software.

p 2
Multiplexed precursor ion scanning (XPIS) has several technical benefits for profiling complex biological tissue extracts2, 3. The first advantage of this approach is that it offers both qualitative and quantitative information in a single acquisition. Multiplexing lipid head group and complementary fatty acid scanning provides lipid species characterization while subsequent m/z peak integration provides quantification if the response is corrected by lipid class-specific internal standards3. To illustrate this point, selected negative ion precursor ion scans are overlaid in Figure 1A and a peak at 766.6 is potentially identified as PE 38:4 by its parent ion mass. Different fatty acyl ion precursor ion scans acquired in parallel are overlaid and integrated to confirm the lipid molecular composition of the PE isomeric group and quantify the response of each fatty acid moiety identified relative to the PE 17:0 / 17:0 internal standard (Figure 1B). Secondly, XPIS is amenable to the simplicity of direct infusion workflows and can be fully automated for human lipid extracts profiled by robot assisted sampling in 96 well plate formats for high-throughput. Lastly, the XPIS methodology is now complemented by dedicated software, LipidView™ Software, that enables lipid identification via peak extraction, isotope correction, and database searching as well as relative quantification against lipid class internal standards.
Quantitative Lipid Profiling of NAFLD Liver Tissue Extracts to Determine PC/PE Ratio and Fatty Acid Lipid Profiles Experimental Design
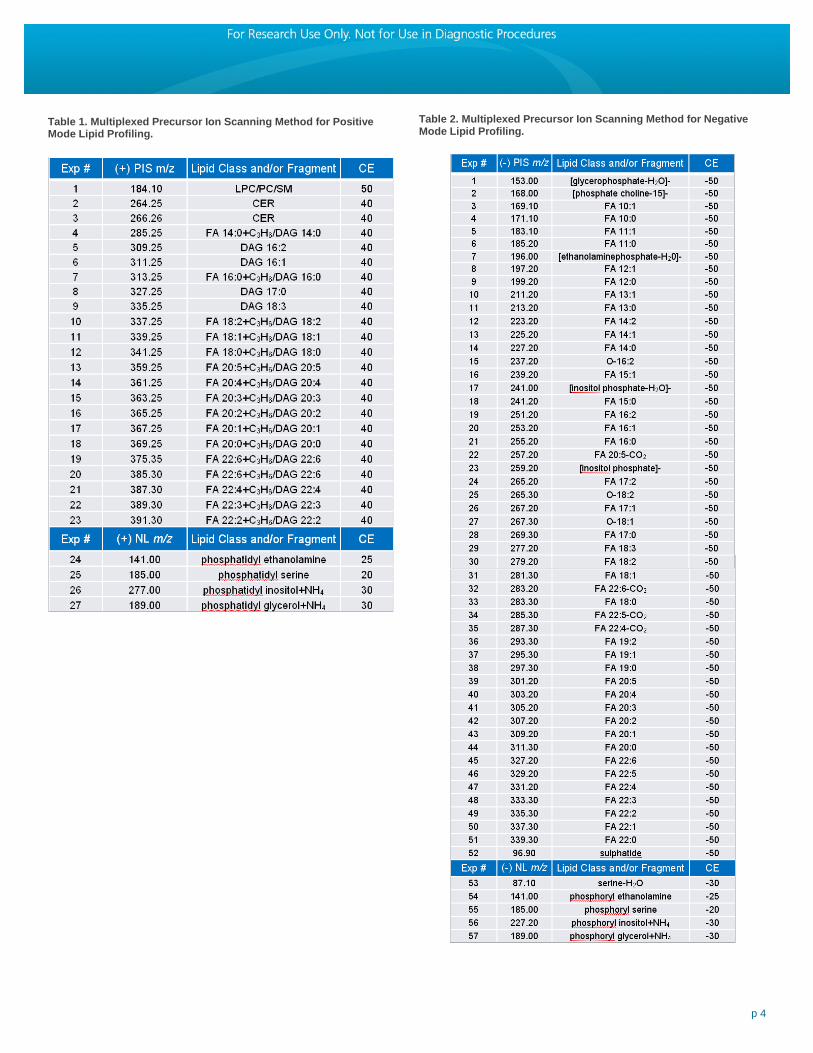
A cross-sectional study was carried out consisting of 28 liver biopsies samples from individuals diagnosed with non-alcoholic fatty liver disease and 9 biopsies from healthy living donors as controls. Lipid extracts were prepared using the Bligh-Dyer technique5, concentrations were normalized to 80 µg/mL in 1:2 (v/v) chloroform, methanol with 5 mM ammonium acetate, and 9 lipid class internal standards were added to a final concentration of 75 nM. All lipid extracts were subjected to the lipid profiling workflow shown in Figure 1 involving automated sample infusion using the TriVersa® NanoMate source (Advion). XPIS was carried out in both negative and positive polarities on the QTRAP® 5500 System according to the precursor ion and neutral loss fragments shown in Tables 1 and 2. These tables represent 84 targeted experiments that can be executed in a simple acquisition method consisting of positive and negative time periods to enable lipid profiling of glycerophospholipids, diacylglycerol lipids, and fatty acids up to 22 carbon chain lengths.
LipidView™ Software for Lipid Profiling and Quantification LipidView™ Software is a data processing tool for the molecular characterization and quantification of lipid species from electrospray MS data. The software enables lipid profiling by searching parent and fragment ion masses against a lipid fragment database containing ~23,000 entries, then reports a numerical and graphical outputs for profiling various lipid molecular species, lipid classes, fatty acids and long chain bases.
A
B
Figure 2. Multiplexed Precursor Ion Scanning on the QTRAP® 5500 System. XPIS enables up to 60 scans for complementary data sets providing lipid molecular composition when overlaid (A). A PE 38:4 lipid is identified at m/z 766.6, however, fatty acid scanning shows a combination of 6 different acyl ions were also detected providing molecular species quantification in a peak area response compared against the PE 17:0/17:0 internal standard (B).
p 3
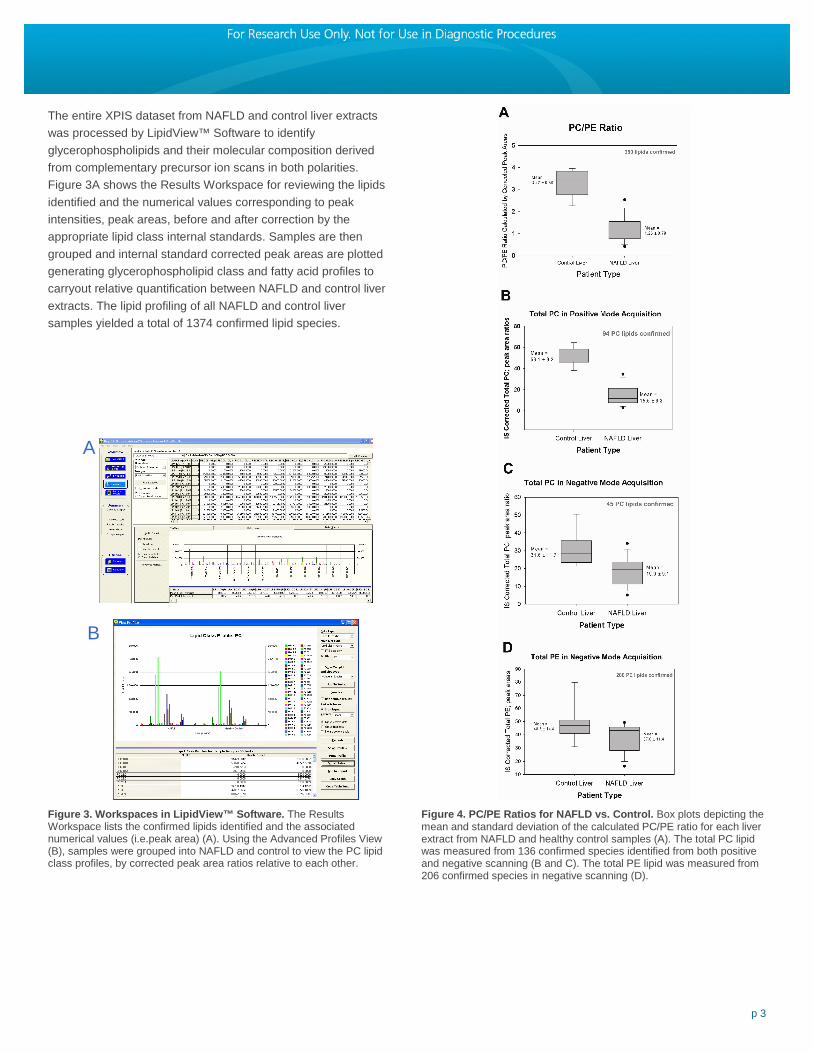
The entire XPIS dataset from NAFLD and control liver extracts was processed by LipidView™ Software to identify glycerophospholipids and their molecular composition derived from complementary precursor ion scans in both polarities. Figure 3A shows the Results Workspace for reviewing the lipids identified and the numerical values corresponding to peak intensities, peak areas, before and after correction by the appropriate lipid class internal standards. Samples are then grouped and internal standard corrected peak areas are plotted generating glycerophospholipid class and fatty acid profiles to carryout relative quantification between NAFLD and control liver extracts. The lipid profiling of all NAFLD and control liver samples yielded a total of 1374 confirmed lipid species.
Figure 4. PC/PE Ratios for NAFLD vs. Control. Box plots depicting the mean and standard deviation of the calculated PC/PE ratio for each liver extract from NAFLD and healthy control samples (A). The total PC lipid was measured from 136 confirmed species identified from both positive and negative scanning (B and C). The total PE lipid was measured from 206 confirmed species in negative scanning (D).
A
B
Figure 3. Workspaces in LipidView™ Software. The Results Workspace lists the confirmed lipids identified and the associated numerical values (i.e.peak area) (A). Using the Advanced Profiles View (B), samples were grouped into NAFLD and control to view the PC lipid class profiles, by corrected peak area ratios relative to each other.
p 4
Table 2. Multiplexed Precursor Ion Scanning Method for Negative Mode Lipid Profiling.
Table 1. Multiplexed Precursor Ion Scanning Method for Positive Mode Lipid Profiling.

p 5
Using correction by the internal standards, the total PC and PE lipids was calculated per patient to generate a PC/PE ratio. Box plots describing the mean, standard deviation, and scatter of NAFLD liver against control liver PC/PE ratio is shown in Figure 4A. Measured from a total of 395 lipid species confirmed, an approximate 3-fold decrease in the PC/PE ratio is observed in the NAFLD liver tissue extracts.
Also shown in Figure 4, are the total PC lipid (B and C) and total PE lipid (D) comparisons in order to determine the distribution of these glycerophospholipid sub-classes causing this decrease in the PC/PE ratio in NAFLD liver. These total lipid measurements, after correction by the PC and PE internal standards, show that there is a significant reduction in PC lipids in the NAFLD liver while the total PE lipid measures relatively consistently against the healthy controls. Therefore, it can be concluded that the lowered PC/PE ratio in NAFLD is due to a decrease in phosphocholine lipids.
Subsequent to determining that the distribution of PC lipid is altered in NAFLD liver, a subset of common PC and PE lipids were then quantified and profiled using LipidView™ Software. As shown in the red colour of the heat map displayed in Figure 6, some long chain PC species [ i.e. PC 34:1, PC 36:1, and PC 38:1] show a marked decreased in abundance in the NAFLD liver extracts relative to control. PE lipid profiles, however, do not show much significant up or down trend, as observed in the PC profiles. Therefore, the reduction in long chain PC species is perhaps the primary factor in the reduction of the PC/PE ratio may also indicate a trend in fatty acid metabolism.
Figure 5. Relative Quantification Summary. PC and PE lipid relative quantification can be visualized using a Heat Map, indicating the increasing abundance (green) and decreasing abundance (red) of PC and PE lipids of NAFLD samples relative to control in a Log2-based ratio. A subset of 49 PC lipids detected in positive mode and 68 PE lipids detected in negative mode are shown in red, black, and green shades to indicate the range of change relative to control.
p 6
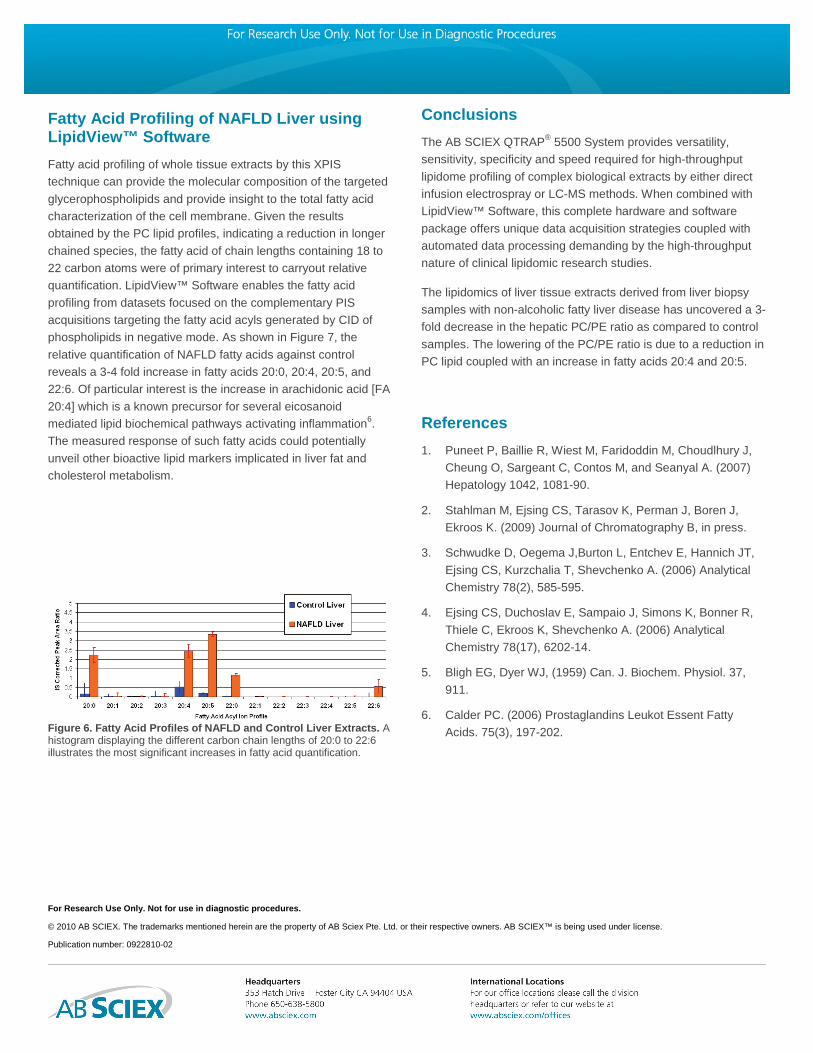
Fatty Acid Profiling of NAFLD Liver using LipidView™ Software Fatty acid profiling of whole tissue extracts by this XPIS technique can provide the molecular composition of the targeted glycerophospholipids and provide insight to the total fatty acid characterization of the cell membrane. Given the results obtained by the PC lipid profiles, indicating a reduction in longer chained species, the fatty acid of chain lengths containing 18 to 22 carbon atoms were of primary interest to carryout relative quantification. LipidView™ Software enables the fatty acid profiling from datasets focused on the complementary PIS acquisitions targeting the fatty acid acyls generated by CID of phospholipids in negative mode. As shown in Figure 7, the relative quantification of NAFLD fatty acids against control reveals a 3-4 fold increase in fatty acids 20:0, 20:4, 20:5, and 22:6. Of particular interest is the increase in arachidonic acid [FA 20:4] which is a known precursor for several eicosanoid mediated lipid biochemical pathways activating inflammation6. The measured response of such fatty acids could potentially unveil other bioactive lipid markers implicated in liver fat and cholesterol metabolism.
Conclusions The AB SCIEX QTRAP® 5500 System provides versatility, sensitivity, specificity and speed required for high-throughput lipidome profiling of complex biological extracts by either direct infusion electrospray or LC-MS methods. When combined with LipidView™ Software, this complete hardware and software package offers unique data acquisition strategies coupled with automated data processing demanding by the high-throughput nature of clinical lipidomic research studies.
The lipidomics of liver tissue extracts derived from liver biopsy samples with non-alcoholic fatty liver disease has uncovered a 3-fold decrease in the hepatic PC/PE ratio as compared to control samples. The lowering of the PC/PE ratio is due to a reduction in PC lipid coupled with an increase in fatty acids 20:4 and 20:5.
References 1. Puneet P, Baillie R, Wiest M, Faridoddin M, Choudlhury J,
Cheung O, Sargeant C, Contos M, and Seanyal A. (2007) Hepatology 1042, 1081-90.
2. Stahlman M, Ejsing CS, Tarasov K, Perman J, Boren J, Ekroos K. (2009) Journal of Chromatography B, in press.
3. Schwudke D, Oegema J,Burton L, Entchev E, Hannich JT, Ejsing CS, Kurzchalia T, Shevchenko A. (2006) Analytical Chemistry 78(2), 585-595.
4. Ejsing CS, Duchoslav E, Sampaio J, Simons K, Bonner R, Thiele C, Ekroos K, Shevchenko A. (2006) Analytical Chemistry 78(17), 6202-14.
5. Bligh EG, Dyer WJ, (1959) Can. J. Biochem. Physiol. 37, 911.
6. Calder PC. (2006) Prostaglandins Leukot Essent Fatty Acids. 75(3), 197-202.
Figure 6. Fatty Acid Profiles of NAFLD and Control Liver Extracts. A histogram displaying the different carbon chain lengths of 20:0 to 22:6 illustrates the most significant increases in fatty acid quantification.
For Research Use Only. Not for use in diagnostic procedures.
© 2010 AB SCIEX. The trademarks mentioned herein are the property of AB Sciex Pte. Ltd. or their respective owners. AB SCIEX™ is being used under license.
Publication number: 0922810-02