comprehensive numerical modelling of the performance of a
TRANSCRIPT

Comprehensive numerical modelling of the performance of a secondharmonic generation stage coupled with a low-gain optical parametricamplifierSharba, A. B., Nersisyan, G., Zepf, M., Borghesi, M., & Sarri, G. (2016). Comprehensive numerical modelling ofthe performance of a second harmonic generation stage coupled with a low-gain optical parametric amplifier.Optics Express, 24(5), 5212-5234. https://doi.org/10.1364/OE.24.005212
Published in:Optics Express
Document Version:Publisher's PDF, also known as Version of record
Queen's University Belfast - Research Portal:Link to publication record in Queen's University Belfast Research Portal
Publisher rights© 2016, The AuthorPublished by The Optical Society under the terms of the Creative Commons Attribution 4.0 License(https://creativecommons.org/licenses/by/4.0/). Further distribution of this work must maintain attribution to the author(s) and the publishedarticle's title, journal citation, and DOI.
General rightsCopyright for the publications made accessible via the Queen's University Belfast Research Portal is retained by the author(s) and / or othercopyright owners and it is a condition of accessing these publications that users recognise and abide by the legal requirements associatedwith these rights.
Take down policyThe Research Portal is Queen's institutional repository that provides access to Queen's research output. Every effort has been made toensure that content in the Research Portal does not infringe any person's rights, or applicable UK laws. If you discover content in theResearch Portal that you believe breaches copyright or violates any law, please contact [email protected].
Download date:05. Feb. 2022

Comprehensive numerical modelling ofthe performance of a second harmonic
generation stage coupled with a low-gainoptical parametric amplifier
A. B. Sharba,* G. Nersisyan, M. Zepf, M. Borghesi, and G. SarriCentre for Plasma Physics, School of Mathematics and Physics, Queen’s University, Belfast,
Northern Ireland, UK*[email protected]
Abstract: We present a comprehensive model for predicting the full per-formance of a second harmonic generation-optical parametric amplificationsystem that aims at enhancing the temporal contrast of laser pulses. Themodel simultaneously takes into account all the main parameters at play inthe system such as the group velocity mismatch, the beam divergence, thespectral content, the pump depletion, and the length of the nonlinear crys-tals. We monitor the influence of the initial parameters of the input pulse andthe interdependence of the two related non-linear processes on the perfor-mance of the system and show its optimum configuration. The influence ofthe initial beam divergence on the spectral and the temporal characteristicsof the generated pulse is discussed. In addition, we show that using a crystalslightly longer than the optimum length and introducing small delay betweenthe seed and the pump ensures maximum efficiency and compensates for thespectral shift in the optical parametric amplification stage in case of chirpedinput pulse. As an example, calculations for bandwidth transform limitedand chirped pulses of sub-picosecond duration in beta barium borate crystalare presented.Published by The Optical Society under the terms of the Creative Commons Attribution 4.0License. Further distribution of this work must maintain attribution to the author(s) and thepublished article’s title, journal citation, and DOI.
OCIS codes: (190.7110) Ultrafast nonlinear optics; (140.3295) Laser beam characterization.
References and links1. D. Strickland and G Mourou, “Compression of amplified chirped optical pulses,” Opt. Lett. 55(6), 447–449
(1985).2. A. Macchi, M Borghesi, and M. Passoni, “Ion acceleration by superintense laser-plasma interaction,” Rev. Mod.
Phys. 85(2), 751–793 (2013).3. V. Chvykov, P. Rousseau, S. Reed, G. Kalinchenko, and V. Yanovsky, “Generation of 1011 contrast 50 TW laser
pulses,” Opt. Lett. 31(10), 1456–1458 (2006).4. D. Homoelle, A. L. Gaeta, V. Yanovsky, and G Mourou, “Pulse contrast enhancement of high-energy pulses by
use of a gas-filled hollow waveguide,” Opt. Lett. 27(18), 1646–11648 (2002).5. C. M. Zhang, J. L. Wang, L. Chuang, X. W. Chen, L. H. Lin, R. X. Li, and Z. Z. Xu, “Pulse temporal cleaner
based on nonlinear ellipse rotation by using BK7 glass plate,” Chin. Phys. Lett. 25(7), 2504–2507 (2008).6. J Itatani, J Faure, M Nantel, G Mourou, and S Watanabe, “Suppression of the amplified spontaneous emission
in chirped-pulse-amplification lasers by clean high-energy seed-pulse injection,” Opt. Commun. 148(1), 70–74(1998).
#256043 Received 18 Dec 2015; revised 12 Feb 2016; accepted 13 Feb 2016; published 1 Mar 2016 © 2016 OSA 7 Mar 2016 | Vol. 24, No. 5 | DOI:10.1364/OE.24.005212 | OPTICS EXPRESS 5212
7. M. P. Kalashnikov, E. Risse, H. Schnnagel, and W. Sandner, “Double chirped-pulse-amplification laser: a way toclean pulses temporally,” Opt. Lett. 30(8), 923–925 (2005).
8. R. Shah, R. Johnson, T. Shimada, K. Flippo, J. Fernandez, and B. Hegelich, “High-temporal contrast using low-gain optical parametric amplification,” Opt. Lett. 34(15), 2273–2275 (2009).
9. D. M. Gold, “Direct measurement of prepulse suppression by use of a plasma shutter,” Opt. Lett. 19(23), 2006–2008 (1994).
10. B. Dromey, S. Kar, M. Zepf, and P. Foster, “The plasma mirror a subpicosecond optical switch for ultrahighpower lasers,” Rev. Sci. Instrum. 75(3), 645–649 (2004).
11. I. Jovanovic, C. P. J. Barty, C. Haefner, and B. Wattellier, “Optical switching and contrast enhancement in intenselaser systems by cascaded optical parametric amplification,” Opt. Lett. 31(6), 787–789 (2006).
12. Y. Huang, C. Zhang,Y. Xu, D. Li, Y. Leng,R. Li and Z. Xu, “Ultrashort pulse temporal contrast enhancementbased on noncollinear optical-parametric amplification,” Opt. Lett. 36(6), 781–783 (2011).
13. D. A. Kleinman, “Theory of second harmonic generation of light,” Phys. Rev. 128 (4), 1761–1775 (1962).14. J. E. Bjorkholm, “Optical second-harmonic generation using a focused Gaussian laser beam,” Phys. Rev. 142 (1),
126–136 (1966).15. J. E. Bjorkholm, “Beam divergence effects on nonlinear frequency mixing,” Appl. Phys. 71 (3), 1091–1101
(1992).16. I. Jovanovic, B. J. Comaskey, and D. M. Pennington, “Angular effects and beam quality in optical parametric
amplification,” Appl. Phys. 90 (9), 4328–4337 (2001).17. V. Krylov, A. Rebane, A. G. Kalintsev, H. Schwoerer, and U. P. Wild, “Second-harmonic generation of amplified
femtosecond Ti: sapphire laser pulses,” Opt. Lett. 20 (2), 198–200 (1995).18. J. Y. Zhang, J. Y. Huang, H. Wang, K. S. Wong, and G. K. Wong, “Second-harmonic generation from regen-
eratively amplified femtosecond laser pulses in BBO and LBO crystals,” J. Opt. Soc. Am. B 15 (1), 200–209(1998).
19. A. Dement’ev, O. Vrublevskaja, V. Girdauskas, and R. Kazragyte, “Numerical analysis of short pulse opticalparametric amplification using type I phase matching,” Nonlinear Analysis 9 (1), 39–53 (2004).
20. T. Zhang, M. Yonemura, M. Aoyama and K. Yamakawa, “A simulation code for tempo-spatial analysis of three-wave interaction with ultrashort-and ultrahigh-intensity laser pulses,” Jp. J. Appl. Phys. 40 (11), 6455–6456(2001).
21. H. Wang and A. M. Weiner, “Efficiency of short-pulse type-I second-harmonic generation with simultaneous spa-tial walk-off, temporal walk-off, and pump depletion,” IEEE J. Quantum Electron. 39 (12), 1600–1618 (2003).
22. Y. Wang and B. Luther-Davies, “Optical-parametric-amplification-based prepulse eliminator for a chirped-pulse-amplification Nd: glass laser,” J. Opt. Soc. Am. B 11 (9), 1531–1538 (1994).
23. G. Cerullo and S. D. Silvestri, “Ultrafast optical parametric amplifiers,” Rev. Sci. Instrum. 74 (1), 1–18 (2003).24. M. Bache, H. Guo, B. Zhou, and X. Zeng, “The anisotropic Kerr nonlinear refractive index of the beta-barium
borate (β -BaB2O4) nonlinear crystal,” Opt. Mater. Express 3(3), 357–382 (2013).25. A. Nautiyal, P. B. Bisht, K.S. Bindra, and S.M. Oak, “Effects of thickness of β -barium borate and angle of non-
collinearity on the fs pulse generation by optical parametric amplification,” Opt. Laser Technol. 41(5), 539–544(2009).
26. K. H. Hong, J. H. Kim, Y. H. Kang, and C. H. Nam, “Numerical treatment of short laser pulse compression intransient stimulated Brillouin scattering,” Nonlinear Anal. 7 (1), 3–29 (2002).
27. E. K. Blum, “A modification of the Runge-Kutta fourth-order method,” Math. Comput. 16 (78), 176–187 (1962).28. D. Eimerl, “High average power harmonic generation,” IEEE J. Quantum Electron. QE-23 (5), 575–592 (1987).29. W. Han, W. G. Zheng, Y. S. Yang, D. X. Cao, Q. H. Zhu, and L. J. Qian, “Phase matching limitation of high-
efficiency second-harmonic generation in both phase-and group-velocity-matched structures,” Optik-Int. J. LightElectron Opt. 119 (3), 122–126 (2008).
30. A. Richard, “Optical parametric amplification,” IEEE J. Quantum Electron. 15 (6), 432–444 (1979).31. G. Pretzler, A. Kasper, and K. J. Witte, “Angular chirp and tilted light pulses in CPA lasers,” Appl. Phys. B 70
(1), 1–9 (2000).32. Huang Shu-Wei, Jeffrey Moses, and Franz X. Krtner, “Broadband noncollinear optical parametric amplification
without angularly dispersed idler,” Opt. Lett. 37(14), 2796–2798 (2012).33. A. Shirakawa, I. Sakane, and T. Kobayashi, “Pulse-front-matched optical parametric amplification for sub-10-fs
pulse generation tunable in the visible and near infrared,” Opt. Lett. 23(16), 1292–1294 (1998).
1. Introduction
The development of chirp pulse amplification (CPA)techniques [1] has enabled exciting andrapidly developing investigations of laser-matter interactions at relativistic intensities. In orderto ensure a clean interaction of the high intensity peak of the laser pulse with the target, it isnecessary to avoid deformation or heating induced by lower-intensity pedestals or pre-pulses.
#256043 Received 18 Dec 2015; revised 12 Feb 2016; accepted 13 Feb 2016; published 1 Mar 2016 © 2016 OSA 7 Mar 2016 | Vol. 24, No. 5 | DOI:10.1364/OE.24.005212 | OPTICS EXPRESS 5213

For instance, a non-ideal laser contrast dramatically affects laser-driven ion acceleration, im-posing stringent limits on the thickness of the target [2]. Thus, generating laser pulses thatare devoid of any pre-pulses or pedestal is one of the key elements in the development of theultra-high-intensity laser systems .
The temporal contrast of high intensity lasers has been enhanced using many techniques,such as cross polarized wave generation technique (XPW) [3], nonlinear ellipse rotation [4, 5],saturable absorber [6], double chirped pulse amplification [7] and optical parametric amplifi-cation (OPA) [8]. Furthermore, plasma mirror techniques [9, 10] can be used after the maincompressor to enhance the contrast by four orders of magnitude using two plasma mirrors, al-beit at the cost of reducing the laser energy. OPA has advantages over the other pulse cleaningtechniques since it is a second order nonlinear process which does not require high pulse in-tensities, and therefore effectively minimizing the high order effects. Furthermore, OPAs havemany attractive features such as broad amplification bandwidth, high gain and no amplifiedspontaneous amplification accumulation.
In particular, different configurations [8, 11, 12] have been proposed in order to enhancethe temporal contrast of laser pulses in the infrared range employing OPA. Short pulse lowgain OPA is one of the simplest and efficient techniques which can work at the front end ofhigh-power laser systems. It relies on the fact that the gain in the OPA occurs only duringthe pump pulse duration. Thus, using short pump pulse, can ensure that the pump will matchonly the main pulse of the seed without amplifying anything outside it. This will lead to thegeneration of an idler pulse of extremely high contrast, since it is generated only during theoptical parametric interaction [8].
Short-pulse and low gain OPAs, as temporal contrast enhancement systems, have received asignificant degree of interest, because, besides the efficient contrast enhancement ability, theycan be integrated into an existing high power laser system without imposing major changes tothe system [8]. However, in short pulse low gain regime, small difference in the used crystalthickness or/and slight different system configuration can result in generation of degraded pulseor simply limiting the unit efficiency, as will be shown later. Thus, careful characterization andoptimization of the unit is of a particular importance in order to seed a high power laser system.
In its simplest configuration, we will consider here a system, similar to that in [8], comprisinga second harmonic generation (SHG) stage and an OPA stage. The input beam is split into twoparts, the large part is frequency doubled to generated the pump pulse and the seed of the OPAwill be the smaller part of the input beam, as shown in Fig. 1. The idler pulse is considered asthe useful output of the system due to the high contrast of this pulse.
Although the SHG and the OPA processes, individually, have been extensively studied overthe years, a comprehensive detailed study that simultaneously considering all the main param-eters at play and investigating how the first process influences the second in a system which isdriven by a single source, has not yet been carried out according to our knowledge. In such asystem, the seed energy is determined only by the splitting ratio of the beam splitter, as shownin Fig. 1, while the efficiency of the SHG process is another factor that determines the pumpenergy. Therefore, since the OPA works in low gain regime, the SHG efficiency has a significantimpact on the OPA, in terms of saturation effects. Furthermore, the duration and the temporalshape of the pump pulse, which are set in the SHG stage, define the shape of the idler pulseand set the time window of the gain and the superfluorescence in the OPA process. At optimumperformance of the SHG, the resulting pulse, which will pump the following OPA, could beshorter than the input pulse due to the quadratic dependence of the frequency conversion pro-cess. This initial parameter makes the OPA work in an environment that is different than that ofthe traditional OPAs which are pumped by pulses which are longer or equal to the seed pulseduration. Accordingly, characterizing the two related nonlinear processes in linked mode is of
#256043 Received 18 Dec 2015; revised 12 Feb 2016; accepted 13 Feb 2016; published 1 Mar 2016 © 2016 OSA 7 Mar 2016 | Vol. 24, No. 5 | DOI:10.1364/OE.24.005212 | OPTICS EXPRESS 5214

BD
DL
DM
BBO BS
BBO
Fig. 1. A layout of a SHG-OPA based temporal contrast enhancement system, BS: beamsplitter, DM: dielectric mirror, BD: beam damper and DL: delay line.
particular importance.The effect of beam divergence on the nonlinear interaction has been studied by many authors
since the invention of the laser. Early studies [13, 14], focused on low conversion efficiencywhere the effect could be investigated analytically [15]. S. K. Wong, et al [15] studied the effectof beam divergence on the frequency conversion efficiency for laser intensity up to 2 GW/cm2.In their work they assumed constant field amplitude in the temporal domain and the group ve-locity mismatch was not taken into account, while, as will be shown later, the influence of beamdivergence is different for different pulse durations. The study was extended by I.Jovanovic, etal [16] to predict the performance of OPAs, of pump intensity up to 1 GW/cm2, taking intoaccount the beam quality and assuming long pulse duration where the group velocity mismatchcan be ignored.
On the other hand, the effect of group velocity mismatch (GVM) on the SHG conversion ef-ficiency and the temporal profile of laser pulses was reported by many authors, for example in[17, 18]. However, they considered the laser beam as a plane wave, where all the beam parts sat-isfy perfect phase matching. A numerical study has been carried out by A. Dementev, et al [19]to simulate the performance of short pulse OPA taking into account group velocity mismatch,diffraction and other parameters. However, in their study the pump pulse duration was consid-ered much longer than that of the seed. Several other works [20, 21] have included diffraction,the GVM and dispersion effects in the calculations to simulate the nonlinear frequency conver-sion processes. A numerical study for simulating SHG-OPA based temporal contrast cleanerhas been done by Y. Wang [22] for 1 ps input pulse. The simulation is for type II SHG andOPA, assuming plane-wave approximation. The divergence of the beam, the spectral contentand chirp rate of the input pulse were not considered in their simulation.
In this work we present a comprehensive simulation of a SHG-OPA temporal cleaning unitthat predicts the performance of the unit for any initial conditions within the range of pulseduration and input intensity where the phase modulations and the high order dispersion can beignored. The model simultaneously takes into account the temporal walk-off of the interactingfields due to the GVM, the effects of the divergence of the beams and the resulting reconversionprocesses, the spectral content of the pulses, the pump depletion, and the length of the nonlinearcrystal, which are the most effective parameters in this regime. Considering these parameterssimultaneously shows their interdependence and sets an effective range for each of them. Weshow results for a system driven by a single input pulse, to be temporally cleaned. Equally
#256043 Received 18 Dec 2015; revised 12 Feb 2016; accepted 13 Feb 2016; published 1 Mar 2016 © 2016 OSA 7 Mar 2016 | Vol. 24, No. 5 | DOI:10.1364/OE.24.005212 | OPTICS EXPRESS 5215

important, we explore the influence of these parameters on the interdependence of the relatednon-linear processes in the system. We show how the effect of the beam divergence dependson the input pulse duration and how this source of phase mismatch can influence the temporaland the spectral profiles of the resulting pulses. Also, we present a detailed investigation on theeffect of the pulse chirp and the spectral content of the input pulse on the performance of thesystem. By considering all these effects, we present an optimum configuration for the system inorder to generate a pulse with temporal, spectral and spatial characteristics that are suitable forseeding a high power laser system. We include results for transform limited (TL) pulses, whichare generated from ideal systems, and for non-transform limited (non-TL) pulses which can bea result of imperfect pulse compression in the generating system.
In this paper, the most relevant theoretical concepts and the assumptions of the model arelisted in section II. The two parts of section III are devoted to the results of the model and thediscussion of the SHG and the OPA stages respectively. Finally, the conclusions of the workare drawn in section IV.
2. Numerical Simulations
When a light wave at the fundamental frequency (FF) enters a non-linear medium, the complexamplitudes of the FF and the SH can be estimated by solving a system of coupled differentialequations which, in the slowly varying amplitude approximation, can be given by: [17]:
∂A1
∂ z+
1vg1
∂A1
∂ t=−i
2ωde f f
n1cA∗1A2 exp(−i∆kz) (1a)
∂A2
∂ z+
1vg2
∂A2
∂ t=−i
2ωde f f
n2cA2
1 exp(i∆kz) (1b)
Where A j,n j and vg j, j = 1,2 are the field amplitude, the refractive index, and the group veloc-ity at the FF and the SH frequencies respectively, ω the fundamental angular frequency, de f fis the effective nonlinear coefficient, ∆k is the phase mismatch, z is the propagation distance ofthe waves along the crystal and c is the speed of light.
When the input pulse duration is longer than 100 fs, the second and higher order dispersionscan be neglected, where the dispersion length (LD) of the pulse in this case is much longer thanthe used crystals. Also, within the intensity level of the working environment of the low gaintemporal contrast enhancement system, the self and the cross phase modulations are not related.
LD =T 2
o
|B2|(2)
Where, To = T/2√
ln2, T is the pulse duration at the full width half maximum (FWHM) andB2 is the group velocity dispersion (GVD) parameter.
By transforming the time frame of Eqs. 1(a) and 1(b) to the frame of an observer movingwith the higher frequency pulse τ = t− z/vg2, we obtain [23]:
∂A1
∂ z+(
1vg1− 1
vg2)
∂A1
∂τ=−i
2ωde f f
n1cA∗1A2 exp(−i∆kz) (3a)
∂A2
∂ z=−i
2ωde f f
n2cA2
1 exp(i∆kz) (3b)
In order to introduce the divergence of the beam into the solution, we apply the assumptionof S. K. Wong, et al [15] by considering the beam as a summation of many plane waves that
#256043 Received 18 Dec 2015; revised 12 Feb 2016; accepted 13 Feb 2016; published 1 Mar 2016 © 2016 OSA 7 Mar 2016 | Vol. 24, No. 5 | DOI:10.1364/OE.24.005212 | OPTICS EXPRESS 5216

travel at slightly different angles with respect to the propagation direction. The central plane-wave component enters the crystal at the phase matching angle while the others have smalldeviation angles. The distribution function of the divergent components and the correspondingwave vector mismatch can be found in the same reference. In this case, the FF and the SH fieldsamplitudes can be estimated from:
∂A1 j
∂ z+(
1vg1− 1
vg2)
∂A1 j
∂τ=
N
∑k=1−i
2ωde f f
n1cA∗1kA2k j exp(−i∆kk jz) (4a)
j = 1,2,3, .....N
∂A2k j
∂ z=−i
2ωde f f
n2cA1kA1 j exp(i∆kk jz) (4b)
j,k = 1,2,3, .....N
The field amplitude of any of the interacting fields is given by:
A =
[N
∑j=1
A jA∗j
]1/2
(5)
Similarly for OPA:
∂As j
∂ z+(
1vgs− 1
vgp)
∂As j
∂τ=
N
∑k=1−i
ωsde f f
nscA∗ik jApk exp(−i∆kk jz) (6a)
j = 1,2,3, .....N
∂Aik j
∂ z+(
1vgi− 1
vgp)
∂Aik j
∂τ=−i
ωide f f
nicA∗s jApk exp(−i∆kk jz) (6b)
j,k = 1,2,3, .....N
∂Ap j
∂ z+
∂Ap j
∂τ=
N
∑k=1−i
ωpde f f
npcAskAik j exp(i∆kk jz) (6c)
j = 1,2,3, .....N
where, s, i and p denote seed, idler and pump respectively.It is worth to note that the Kerr-like nonlinearity [24] is not likely to change the characteristics
of the pulse in the range of the study. In fact, the phase mismatch due to the beam divergence isnot large enough to give rise to a sufficient number cycles of up and down conversion processeswithin the pulse splitting length that can influence the phase of the generated pulses.
The coupled equations are solved numerically when the group velocity and the phase match-ing structures are considered, e.g. for a crystal of thickness comparable to or longer than thepulse splitting length Ls, which is the minimum distance after which the pulses walk away fromeach other [25]
Ls =
∣∣∣∣ 1vg1− 1
vg2
∣∣∣∣−1
T (7)
#256043 Received 18 Dec 2015; revised 12 Feb 2016; accepted 13 Feb 2016; published 1 Mar 2016 © 2016 OSA 7 Mar 2016 | Vol. 24, No. 5 | DOI:10.1364/OE.24.005212 | OPTICS EXPRESS 5217

In case of OPA, GVM is the difference between the group velocity of the pump and the projec-tion of the signal group velocity on the pump direction , vg1 cosΩ, where Ω is the non-collinearangle.
We use the quadratic spectral broadening f to represent the chirp rate of the pulse. f equalszero for TL pulses and is positive for chirped pulses. For a Gaussian pulse f can be defined by[18]:
T =4ln2∆ω
(1+(4 f )2)1/2 (8)
Where, ∆ω is the angular frequency bandwidth of the pulse at the FWHM.Pump depletion, GVM and beam divergence will all affect the spatial profiles of the inter-
acting beams as they propagate along the crystal. Thus, in order to monitor the beam quality asthe beam propagates into the crystal, the quality factor M2 can be calculated from [26]
M2(t) =
∫∞
0
∣∣∣ ∂E∂ r
∣∣∣2 rdr∫
∞
0 |E|2 r3dr− 1
4
∣∣∣∫ ∞
0 r2[
∂E∂ r E∗− ∂E∗
∂ r E]
dr∣∣∣21/2
∫∞
0 |E|2 rdr
(9)
Where E is the normalized transverse electric field amplitude distribution, and r is the transversedimension.
The quality factor of the entire pulse is, then, the power-weighted time average quality pa-rameter [26]. ⟨
M2⟩= ∫∞
−∞M2(t)P(t)dt∫∞
−∞P(t)dt
(10)
We solved the nonlinear coupled equations numerically using the fourth-order Range-Kuttamethod [27]. The input beam is considered as a perfect Gaussian beam in the temporal andthe spatial domains. The simulation code consists of three parts: in the first part the opticalproperties of the crystal and the distribution of the input pulse in time and space are calculatedalong with the angular distribution of the divergent components. The second part is devoted tothe numerical integrations of the coupled equations. Finally, the energies and the intensities ofthe interacting pulses, the conversion efficiency of the process and full characterization of theresulting pulses in time, space, and spectral domains are found in the third part. After everystep of the integration, at every slice of the crystal, the temporal shapes of the interacting fieldsare determined and then fed to the next integration step.
The accuracy of the numerical solution is determined, first, by checking the deviation of thesolution when changing the integration step size and the number of the plane-wave components,second, by verifying the total energy conversion efficiency of the interacting pulses along thecrystal. Finally, the accuracy of the whole simulation is verified by comparing the results of thesimulation with the known solutions in cases of long pulse duration, monochromatic wave andplane-wave approximations.
The simulation code is applicable to a wide range of parameters of the input laser pulse,provided that phase modulations and GVD can be neglected. In terms of dispersion, this is areasonable approximation if the dispersion length of the pulse (see Eq. 2) is much longer thanthe thickness of the crystals. For typical crystal thicknesses of the order of a few millimetres,this translates to a pulse duration exceeding 100 fs [23]. Throughout the rest of the manuscriptwe will refer to ”long pulse duration” to describe pulses for which the splitting length (see Eq.7) is much longer than the length of the crystal, whereas we will use the expression ”short pulseduration” for pulses whose splitting length is comparable to, or shorter than, the length of thecrystal.
In addition, since the nonlinear refractive index of BBO crystal is of the order of 10−16
cm2/W, the maximum difference in refractive index at the peak of a 10 GW/cm2 pulse due
#256043 Received 18 Dec 2015; revised 12 Feb 2016; accepted 13 Feb 2016; published 1 Mar 2016 © 2016 OSA 7 Mar 2016 | Vol. 24, No. 5 | DOI:10.1364/OE.24.005212 | OPTICS EXPRESS 5218

to Kerr-effect is of the order of 10−6 at the beam axis. This obviously indicates that, withina crystal of length of the order of a few millimetres, the nonlinear Kerr-effect in the intensityrange of interest is negligible.
3. Results
According to our initial assumption, we will focus our attention here on pulses of sub-picosecond duration, but longer than 100 fs, and of intensity in the range 1-10 GW/cm2 inBeta Barium Borate (BBO) crystals (de f f = 2.2 pm/V) of different thicknesses. The input beamspectrum is considered to be Gaussian of central wavelength 1053 nm. The calculations includeresults of TL and linearly chirped pulses. Since, in practice, the crystal length is not a parameterthat can be easily fine tuned to give optimum result, we show results of the nonlinear interac-tions for distances that extend beyond the optimum crystal length. Most of the results are for500 fs pulses of spectral bandwidth ∆λ ≈ 3.26, 3.5, 4.2 and 6.2 nm corresponding to values ofthe quadratic spectral broadening of f = 0, 0.1, 0.2, and 0.4 respectively.
3.1. Second Harmonic Generation
3.1.1. The effect of beam divergence on the conversion efficiency in short pulse regime
When a divergent beam of long pulse duration enters a nonlinear medium it experiences sequen-tial up and down frequency conversion processes due to the phase mismatch of the paraxial partsof the beam. Thus, the efficiency of the conversion process has an oscillatory behaviour withfrequency defined by the interplay of the beam divergence and the input intensity. High inputintensity or/and large beam divergence result in a high oscillation frequency [15]. However, inthe case of short pulses, the oscillation is damped due to the temporal walk-off of the inter-acting pulses, which causes changes in the local overlapped-intensities as the pulses propagateinto the nonlinear medium, leading to a derailing in the sequence of the non-linear processes. Itis worth to mention here that, in terms of wave vector mismatch, the effect of convergent beamis equivalent to that of a divergent beam with comparable opening angle. This is true as longas the divergence/convergence of the beam does not significantly alter the beam size inside thecrystal.
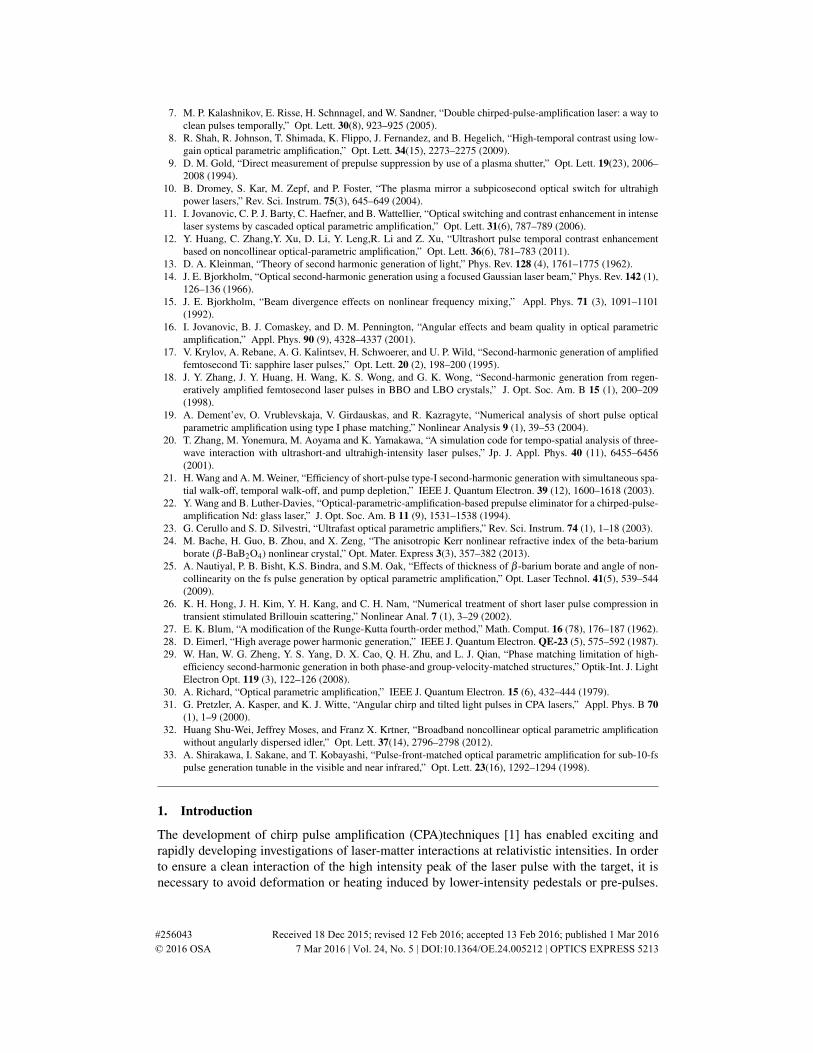
In order to show the dependence of the effect of the beam divergence, or any source of phasemismatching, on the duration of the input pulse, it is more convenient first to find a representa-tion for the coherence length that takes into account pump depletion. For this purpose, we definea characteristic length Lm(∆k, Iωo), which is, in long pulse duration regime, the crystal lengthafter which the SHG process changes its direction from up-conversion to down-conversion, i.e.the length for the first efficiency maxima.
Lm =14
[−L2
NL∆kK(γ)+LNL
√16+L2
NL∆k2K(γ)
](11)
Where, K(γ) is the complete elliptic integral of γ
γ =
−LNL∆k4
+
√1+
L2NL∆k2
16
2
(12)
LNL =c
2ωde f f
√2εon2
ω n2ω cIω
(13)
In fact, Lm represents the interplay of the phase mismatch and pump depletion. Its depen-dence on ∆k and the input intensity is shown in Fig. 2.
#256043 Received 18 Dec 2015; revised 12 Feb 2016; accepted 13 Feb 2016; published 1 Mar 2016 © 2016 OSA 7 Mar 2016 | Vol. 24, No. 5 | DOI:10.1364/OE.24.005212 | OPTICS EXPRESS 5219
0
5
10 2 46 8
10
1
2
3
4
5
6
7
Io
(GW/cm2)
k (1/cm)
Lm
(m
m)
Fig. 2. The dependence of Lm on the initial phase mismatch and the input intensity in BBOcrystal.
Accordingly, for short pulses, the effect of beam divergence, or any source of phase mis-matching, on the conversion efficiency depends on the ratio between Ls and Lm. For pulsesof Ls that is shorter than Lm the divergence of the beam only limits the maximum achievableefficiency and no oscillation can be seen in the nonlinear interaction. This happens because thepulses walk away from each other before the beginning of the back conversion process. How-ever, the down conversion process starts taking place and reduces the SHG intensity as the ratiobetween the Ls and Lm increases.
Figures 3(a)–3(c) present three examples of the SHG conversion efficiency behaviour as afunction of the crystal length. The conversion efficiency is defined as the ratio of SHG intensityto the intensity of the incident beam on the SHG crystal. Figure 3(a) shows the conversionefficiency of pulses of similar divergence 1 mrad, intensity 5 GW/cm2 and bandwidth 5.44 nmbut having different durations, i.e. different Ls. The effect of the reconversion emerges whenthe pulses can stay overlapped for longer distance. In this case, the increment of the maximumachievable efficiency is due to the reduction of the influence of the temporal walk-off of theinteracting fields over the interaction length as the input pulse becomes longer. Figure 3(b)illustrates the effect of shortening the coherence length, i.e. increasing the beam divergence, onthe conversion efficiency of TL pulses of the same duration and intensity. The significance of theback-conversion process rises up as the divergence of the input beam increases. However, thedown-conversion process is terminated gradually as the pulses walk away from each other. Thecurves in Fig. 3(c) are for TL pulses of the same duration and of the same beam divergence, butwith different input intensities. As shown, the same divergence of the input beam can result instronger reconversion process at high input intensity due to the shortening of depletion length.This means, at high input intensity, the optimum crystal length is very critical.
In [28] D. Eimerl concluded that demagnifying a beam of a particular peak power does notenhance the conversion efficiency, but only reduces the required crystal length for maximumefficiency. However, for short pulses the pulse splitting length is an additional parameter thatshould be considered, because telescoping a short pulse is an imperative in order to reach themaximum conversion efficiency within the pulse splitting length. In this case, the incrementof the divergence due to demagnifying the beam has unavoidable effects on the conversionefficiency.
#256043 Received 18 Dec 2015; revised 12 Feb 2016; accepted 13 Feb 2016; published 1 Mar 2016 © 2016 OSA 7 Mar 2016 | Vol. 24, No. 5 | DOI:10.1364/OE.24.005212 | OPTICS EXPRESS 5220

(a) (b)
(c)
0
20
40
60
80
0 1 2 3 4 5
SHG
Eff
icie
ncy
(%)
Crystal Length (mm)
T=300 fsT=500 fsT=700 fs
0
20
40
60
80
0 1 2 3 4 5
SHG
Eff
icie
ncy
(%)
Crystal Length (mm)
θ=0 θ=1 mrad θ=2 mrad θ=4 mrad
0
20
40
60
80
0 2 4
SHG
Eff
icie
ncy
(%)
Crystal Length (mm)
I=5 GW/cm^2I=7 GW/cm^2I=10 GW/cm^2
Fig. 3. SHG efficiency as a function of the crystal length of (a) pulses of 5 GW/cm2 in-tensity, 1 mrad divergence, 5.44 nm bandwidth and of different durations, (b) TL pulses of5 GW/cm2 intensity,500 fs duration, about 3.26 nm bandwidth and different beam diver-gence angles, (c) TL pulses of 500 fs duration and 1 mrad beam divergence, about 3.26 nmbandwidth and different input intensities.
3.1.2. The influence of the chirp rate of the input pulse on the conversion efficiency
The spectral content of the input pulse is another inherent source of phase mismatch that con-trols the efficiency of the frequency conversion process of short pulses. Figure 4(a) shows theSHG conversion efficiency as a function of the crystal length for pulses of the same durationand input intensity but having different spectral bandwidths. A broader spectral bandwidth ofthe input pulse implies that the amount of the pulse energy that deviates from the perfect phasematching increases, limiting the maximum achievable efficiency and causing the down conver-sion process to take place. As an effect, there is a similar dependence on the duration and onthe intensity of the input pulse as for the beam divergence.
On the other hand, for a particular laser system that generates pulses of given energy andbandwidth, broadening of the pulse duration, arising due to imperfect compression or any otherreason, increases the crystal length required for the maximum conversion efficiency, as shownin Fig. 4(b). In addition, for longer input pulses the optimum crystal length is more critical,because broadening of the pulse provides sufficient length for the back conversion process totake place.
3.1.3. The influence of the spectral content of the input pulse on the temporal profile of the SHG pulse
As to what concerns the temporal duration, the bandwidth of the input pulse determines also theduration and the temporal shape of the resulting SHG pulse. At the same input pulse duration,a shorter SH pulse can be obtained from an input pulse of broader bandwidth. This is because,
#256043 Received 18 Dec 2015; revised 12 Feb 2016; accepted 13 Feb 2016; published 1 Mar 2016 © 2016 OSA 7 Mar 2016 | Vol. 24, No. 5 | DOI:10.1364/OE.24.005212 | OPTICS EXPRESS 5221

0
20
40
60
80
0 1 2 3 4 5
SHG
Eff
icie
ncy
(%
)
Crystal length (mm)
f=0
f=0.2
f=0.4
f=0.60
20
40
60
80
0 1 2 3 4 5
SHG
Eff
icie
ncy
(%
)
Crystal length (mm)
Δλ=3.262 nm (TL)
Δλ=4 nm
Δλ=5 nm
Δλ=7 nm
(a) (b)
Fig. 4. SHG efficiency as a function of the crystal length of (a) pulses with 500 fs duration,5 GW/cm2 intensity and different bandwidths, (b) pulses of 5 nm spectral bandwidth anddifferent chirp rates, f values correspond to T = 326, 418, 615 and 850 fs respectively, theinput beam having energy 170 µJ and 2.8 mm diameter, .
for chirped pulses, the spectral components that are at the leading front and the tail of thepulse, i.e. at the wings of the spectrum, undergo low conversion efficiency due to the deviationof these components from the perfect phase matching. Damping these components leads toshortening the resulting SHG pulse. The variation of the duration of the SHG pulse along thecrystal is plotted in Fig. 5. The pulses in the figure are generated from 500 fs input pulses, allwith intensity 5 GW/cm2 but having different bandwidths.
300
350
400
450
500
550
0 1 2 3
SH
G p
uls
e d
ura
tio
n (
fs)
Crystal length (mm)
Δλ=3.262 nm (TL)
Δλ=3.5 nm
Δλ=4.2 nm
Δλ=6.2 nm
Fig. 5. The variation of the duration of the SHG pulses that are generated from input pulsesof different spectral bandwidths all of 500 fs duration and intensity 5 GW/cm2 as a functionof the crystal length.
As shown, over the first slice of the crystal progressive broadening in the pulse duration istaking place due to the GVM between the interacting pulses, after which, for non-TL pulses,the back-conversion process starts competing with the broadening of the pulse. The influence ofthe reconversion process in reducing the pulse duration becomes more pronounced for broaderbandwidth of the input pulse. In fact, this shortening in the generated pulse duration correspondsto a broadening in the TL duration of the pulse due to the reduction in the spectral bandwidth.
#256043 Received 18 Dec 2015; revised 12 Feb 2016; accepted 13 Feb 2016; published 1 Mar 2016 © 2016 OSA 7 Mar 2016 | Vol. 24, No. 5 | DOI:10.1364/OE.24.005212 | OPTICS EXPRESS 5222

3.1.4. The impact of the input intensity on the pulse temporal profile
Another initial parameter that affects the temporal shape of the resulting SHG pulse is theintensity of the input pulse. At high input intensity GVM causes more pulse broadening dueto the high energy exchange level. Figure 6(a) shows the broadening of SHG pulses that aregenerated from TL pulses of different input intensities. The curve at high input intensity isdrawn up to a certain point in the crystal after which the SHG pulse start splitting into multiplepeaks due to the back conversion process, as shown in Fig. 6(b). The crystal length after whichthe SHG pulse is modified depends on the interplay of the initial phase mismatch and the inputintensity.
330
380
430
480
530
580
0 1 2 3
SHG
Pu
lse
Du
rati
on
(fs
)
crystal Length (mm)
I=1 GW/cm^2
I=5 GW/cm^2
I=10 GW/cm^2
(a)
01
23
-0.50
0.5
0
5
10
CrystalLength (mm)Time (ps)
Inte
nsity (
GW
/cm
2)
(b)
Fig. 6. a: SHG pulse duration as a function of the crystal length at different pump intensities,input pulse duration is 500 fs, b: temporal profiles of SHG pulse that is resulting from 500fs pulse of 10 GW/cm2 intensity at different places along the crystal .
3.1.5. The dependence of the spectral and the temporal profiles of the SHG pulse on the beam divergence
Although the divergence of the input beam weakens the overall conversion efficiency, it helpspreserving the bandwidth of the generated SH pulse for distances longer than the optimumlength of the crystal. Figures 7(a)–7(c) show spectra of SHG pulses which are generated fromplane-wave and divergent beams at two thicknesses of the crystal and for two levels of the inputintensity. The reason of this relationship between the beam divergence and the bandwidth ofthe SHG pulse can be explained by examining the configuration of the nonlinear interactionof divergent beams and the dependence function of the conversion efficiency on the phasemismatch angle, as done in the following.
As shown in Fig. 8(a), a monochromatic divergent beam is considered as a summation ofplane-wave components that distribute around the beam axis with slightly different propaga-tion angles ∓θd . The central component is supposed to enter the crystal at the perfect phasematching angle θm with the crystal optical axis. In this case, θd is the deviation angle of eachplane-wave component, which will, in combination with another FF plane-wave component,result in producing a SH plane-wave component that is deviated from the perfect phase match-ing direction. This results in a reduction of the conversion efficiency of the particular plane-wave component and consequently the overall efficiency. On the other hand, for a beam of afinite bandwidth, the phase matching angle is calculated only for the central wavelength. Thus,when the incident beam is assumed to be a plane wave, or to have a very small divergence, thenon-central spectral components will have phase mismatch angles θλ , Fig. 8(b), that result indegrading the conversion efficiency of these components.
In the plane-wave approximation, the phase matching tuning curve is a function of the wave
#256043 Received 18 Dec 2015; revised 12 Feb 2016; accepted 13 Feb 2016; published 1 Mar 2016 © 2016 OSA 7 Mar 2016 | Vol. 24, No. 5 | DOI:10.1364/OE.24.005212 | OPTICS EXPRESS 5223

0
0.2
0.4
0.6
0.8
1
523 525 527 529N
orm
aliz
ed I
nte
nsi
ty
Wavelength (nm)
θ=0
θ=2 mrad
θ=4 mrad
θ=10 mrad
0
0.2
0.4
0.6
0.8
1
523 525 527 529
No
rmal
ized
In
ten
sity
Wavelength (nm)
θ=0
θ=2 mrad
θ=4 mrad
θ=10 mrad
2 mm BBO 5 GW/cm2
3 mm BBO 5 GW/cm2
0
0.2
0.4
0.6
0.8
1
523 525 527 529
No
rmal
ized
In
ten
sity
Wavelength (nm)
θ=0
θ=2 mrad
θ=4 mrad
θ=10 mrad
2 mm BBO 10 GW/cm2
(a) (b)
(c)
0
20
40
60
80
0 1 2 3
SHG
eff
icie
ncy
(%
)
Crystal Length (mm)
I=5 GW/cm^2, θ=10 mrad
I=10 GW/cm^2, θ=10 mrad
I=10 GW/cm^2, θ=1 mrad
(d)
Fig. 7. (a)–(c) Spectra of SHG pulse which are generated from pulses of 500 fs and 6.2nm bandwidth and different beam divergence for two levels of the input intensity and usingtwo crystals of different thicknesses (a) pump intensity 5 GW/cm2 in 2 mm crystal, (b)pump intensity 5 GW/cm2 in 3 mm crystal and (c) pump intensity 10 GW/cm2 in 2 mmcrystal; (d) SHG conversion efficiency of 500 fs pulses having 6.2 nm bandwidth along 3mm BBO. The curve for the smaller beam divergence is presented for comparison.
vector mismatch and the crystal length, as shown in Fig 8(c), which has FWHM and wingsstructure that depend on the input intensity [29]. In the case, where the central spectral compo-nent enters the crystal at the perfect phase matching angle, ∆k is a function of θλ . Accordingly,the conversion efficiency of each spectral component can be represented by a point on the tun-ing curve in Fig 8(c), where the efficiency of the central wavelength is at the peak of the curveand that of the other spectral components distribute around the peak.
When the beam has a non-negligible divergence, the deviation angle of each plane-wavecomponent for each spectral mode will be redefined as the angle between the propagation di-rection of the plane-wave and the phase matching direction of the particular spectral mode, θcin Fig. 8(b). For the central spectral component, where Z-axis is the phase matching direction,the plane-wave components on both sides of the phase matching direction will lead to reducethe conversion efficiency of this spectral component, because it is at the peak of the tuningcurve, point I in Fig. 8(c), and the curve is symmetric at this point. For the non-central spectralcomponents, where the phase matching directions are already off the Z-axis, e.g. the componentZλ , the plane-wave components which are above the Z-axis will help reducing the phase mis-matching angles, while those under the Z-axis will do the opposite. Although the plane wavesdistribute symmetrically around the Z-axis, their influence on the conversion efficiency is notthe same for the non-central spectral components, e.g. points II and III in Fig. 8(c). This is be-cause the tuning curve at these regions is not symmetric, i.e. the enhancement of the efficiencytoward the peak of the curve can be larger than the degradation in the other direction. Generally,the amount of the enhancement or the degradation of the conversion efficiency of a particularspectral component due to the beam divergence depends on the position of this component onthe tuning curve. Consequently, this leads to change the shape of the spectral acceptance func-tion of the crystal, resulting in producing SH pulses of different bandwidths from beams thathave the same input bandwidth but have different divergence angles. Figures 9(a)–9(d) present
#256043 Received 18 Dec 2015; revised 12 Feb 2016; accepted 13 Feb 2016; published 1 Mar 2016 © 2016 OSA 7 Mar 2016 | Vol. 24, No. 5 | DOI:10.1364/OE.24.005212 | OPTICS EXPRESS 5224
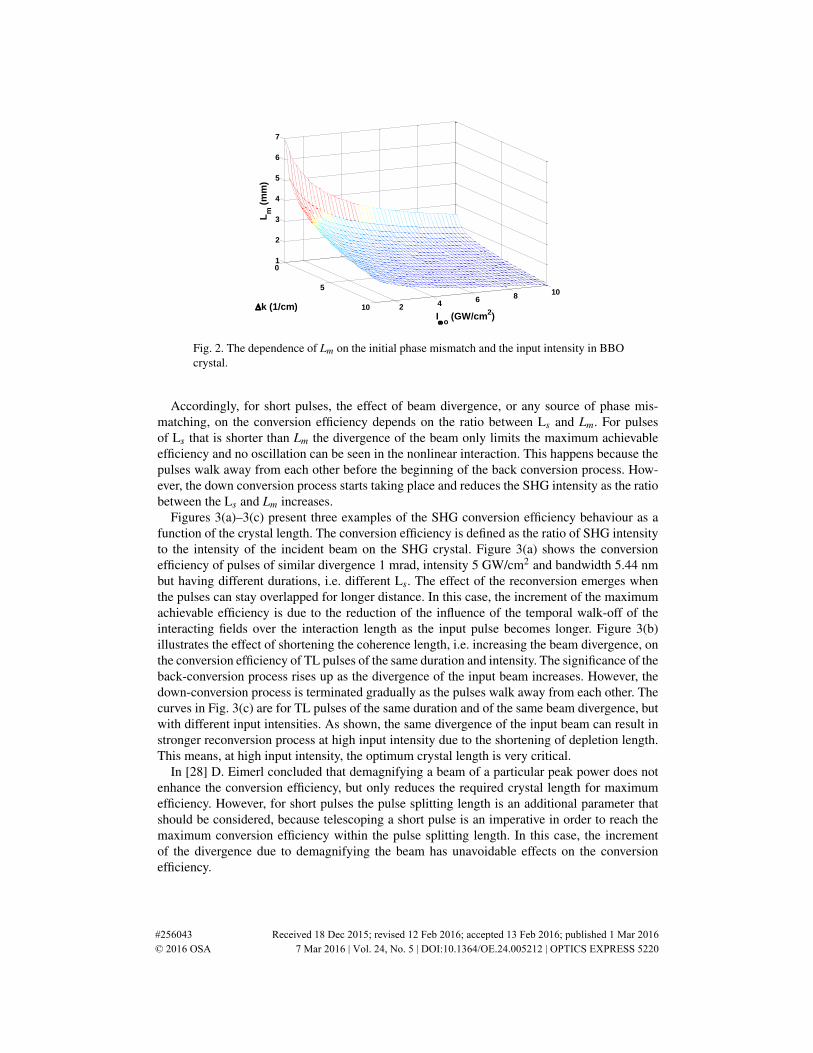
examples for the spectral acceptance function at two levels of the input intensity and for twothicknesses of the non-linear crystal for 500 fs input pulse.
θm
Optical axis
Z axis θ
d
-θ
d
(a)
θm
Optical axis
Z axis θd
θc
Zλ (b)
0
-6 -4 -2 0 2 4 6ΔkL
I
III II
(c)
θλ
Fig. 8. (a) and (b): the configurations and the phase mismatch angles of a monochromaticbeam and a beam of finite bandwidth respectively, (c): the phase matching tuning curve ofthe SHG.
This function, besides the dependence on the divergence of the beam and the crystal prop-erties, it depends on the input intensity and changes with the crystal length, as shown in Figs.9(a)–9(d). On the other hand, increasing the beam divergence above an optimum value, whichis defined by the input pulse characteristics, will not lead to an enhancement in the bandwidthof the SHG. This can be seen clearly in Figs. 7(a)–7(c), where there is no spectral differencebetween the SHG pulses which are generated from beams of 4 mrad and 10 mrad divergence,where 4 mrad is the optimum beam divergence for that input bandwidth.
Moreover, it is clear from comparing Figs 7(a) and 7(c) that increasing the input intensityfrom 5 to 10 GW/cm2 does not result in narrowing the SHG bandwidth in the case when θ=10mrad, as it does for smaller divergence angles, θ=0 and 2 mrad. This could be explained byexamining the frequency conversion process along the crystal for this particular case. When theinput beam has a large divergence angle, the oscillating behaviour in the frequency conversionprocess along the crystal is damped significantly due to phase effects from the different plane-wave components [15], as shown in Fig. 7(d). This termination-like effect in the energy transferbetween the interacting fields, results in fixing the SHG conversion efficiency at approximatelythe same relatively low value even when the input intensity is doubled, as shown in 7(d). Thiseffect also means that the spectral narrowing process along the crystal, which happens due tothe nonlinear interaction, is terminated, i.e. the intensity and the spectrum of the SH pulse arepreserved along the rest of the crystal length. This means that, in case of input beam of largedivergence angle, the nonlinear interaction effectively happens only along a short distance intothe crystal.
The consequence of the bandwidth preservation, in case of chirped pulses, is that the SHGpulse, that is generated from a divergent beam, continues being broadened due to the GVM as
#256043 Received 18 Dec 2015; revised 12 Feb 2016; accepted 13 Feb 2016; published 1 Mar 2016 © 2016 OSA 7 Mar 2016 | Vol. 24, No. 5 | DOI:10.1364/OE.24.005212 | OPTICS EXPRESS 5225

0
20
40
60
80
100
1.04 1.045 1.05 1.055 1.06 1.065
SHG
Con
vers
ion
Effic
ienc
y (%
)
Wavelength (nm)
θ=0
θ=2 mrad
θ=4 mrad
0
20
40
60
80
100
1.04 1.045 1.05 1.055 1.06 1.065
SHG
Con
vers
ion
Effic
ienc
y (%
)
Wavelength (nm)
θ=0
θ=2 mrad
θ=4 mrad I=10 GW/cm^2 L= 3mm
(b)
I=5 GW/cm^2 L= 3mm
0
20
40
60
80
100
1.04 1.05 1.06
SHG
Con
vers
ion
Effic
ienc
y (%
)
Wavelength (nm)
θ=0
θ=2 mrad
θ=4 mrad I=5 GW/cm^2 L= 2mm
(c)
0
20
40
60
80
100
1.04 1.05 1.06
SHG
Con
vers
ion
Effic
ienc
y (%
)
Wavelength (nm)
θ=0 θ=2 mrad θ=4 mrad
I=10 GW/cm^2 L= 2mm
(d)
(a)
Fig. 9. The spectral acceptance function of the SHG process for 500 fs input pulse for (a) 5Gw/cm2 pump intensities in 3 mm crystal, (b) 10 Gw/cm2 pump intensities in 3 mm crystal,(c) 5 Gw/cm2 pump intensities in 2 mm crystal and (d) 10 Gw/cm2 pump intensities in 2mm crystal.
the pulses propagate into the crystal, resulting in a longer SHG pulse, as shown in Fig. 10.
350
370
390
410
430
450
470
490
0 1 2 3
SHG
Pul
se D
urat
ion
(fs)
Crystal Length (mm)
θ=0
θ=2 mrad
θ=4 mrad
Fig. 10. SHG pulse duration as a function of the crystal length, input pulses are of differentdivergence all of 500 fs duration, 6.2 nm bandwidth and 5 GW/cm2 intensity.
3.2. Optical Parametric Amplification
OPA is a second order nonlinear process in which a high intensity pump beam amplifies a lowintensity seed having lower frequency. In addition an idler beam is generated at the frequencythat satisfies the energy conservation law. In a degenerate OPA the pump beam is at the secondharmonic frequency of the seed and the idler, which are at the fundamental harmonic.
The nonlinear interaction of pump, seed and idler at perfect phase matching in a nonlinear
#256043 Received 18 Dec 2015; revised 12 Feb 2016; accepted 13 Feb 2016; published 1 Mar 2016 © 2016 OSA 7 Mar 2016 | Vol. 24, No. 5 | DOI:10.1364/OE.24.005212 | OPTICS EXPRESS 5226

medium consists of cycles of sequential difference and sum frequency generation processes[30]. After the pump is depleted in a difference frequency process, a sum frequency processstarts to create pump photons at the expense of the signal and the idler photons. For the sameinput wavelength and in the same crystal, the conversion length, which is the crystal length overwhich the pump is fully depleted, is a function of the total input intensity. At a constant pumpintensity, the conversion length is a function of the seed intensity.
However, in short pulse OPAs, GVM between the pump and the signal/ idler derails thesequence of the difference and sum frequency processes by changing the local overlapped in-tensities as the pulses propagate along the crystal. Besides limiting the system efficiency, theinterplay of the pump depletion and the GVM, can lead to significant modifications in the spa-tial and temporal profiles of the resulting pulses. Accordingly, in low gain regime, for optimumefficiency and optimum pulse characteristics, the thickness of the crystal should be carefullyselected to fit the optimum conversion length of the incident seed and pump pulses. For fineoptimization in a particular crystal, the seed energy can be tuned, or simply a small delay canbe introduced between the pump and the seed, as will be shown later.
The distortions on the temporal and the spatial profiles of the generated pulses are relatedto the dependence of the non-linear process direction, up or down conversion, on the localoverlapped intensities, i.e. some parts of the signal and the idler pulses may be undergoingamplification while other parts are having up-conversion interaction. In this case and understrong pump depletion the temporal profiles of the signal and the idler can have asymmetricmodifications around the peaks of the pulses. In the same way the generated beams can sufferspatial degradation, which is symmetric around the beam axis when the crystal is much shorterthan the spatial walk-off length of the pump.
When the pump and the seed are divergent beams, certain parts of the beams do not satisfythe perfect phase matching condition. The effect of the dephasing is that the parametric pro-cess is terminated before reaching the point of full pump depletion, resulting in a reduction ofthe maximum conversion efficiency, after which the process starts again without reaching thepoint of zero gain. The deviation of the processes from the perfect sequence increases as thedivergence of the beams increases. However, the results of the simulation show that in the shortpulse regime, where focusing the beams is not required, OPA efficiency is not as sensitive tothe beam divergence such as it is for the SHG process.
In the simulation of the OPA, we consider the output of 3 mm BBO in the SHG stage asthe pump of the OPA. The seed is considered, arbitrarily, as 6% of the input energy of thesystem. The simulation allows to introduce pre-delay between the seed and the pump for thefine optimization of the idler characteristics and the system efficiency. The calculations are forTL and linearly chirped pulses. In case of non-TL pulses, the pump pulses were shorter thanthe seed due to the reduction of the pulse duration in the SHG process.
3.2.1. Transform limited input pulse
Figure 11 shows an example of pump, signal and idler normalized energies behaviour, in non-collinear degenerate OPA, as function of the crystal length, when the input pulse to the system isTL of duration 500 fs and intensity 5 GW/cm2. In this case the seed and the pump are perfectlysynchronized in time and mixed at external angle 0.6o. As shown, for this level of the inputintensities, the point of full pump depletion is not applicable because of the GVM between thepump and the signal/idler.
When this interaction is performed in practice, it is unlikely that a crystal of realistic thick-ness will exactly fit the optimum conversion length, i.e. the thickness can not be tuned. Thus, acrystal slightly shorter than the optimum length (eg. 2 mm in this case) can be used and an idlerpulse that is free from any degradation can be obtained, but this is done at the expense of the
#256043 Received 18 Dec 2015; revised 12 Feb 2016; accepted 13 Feb 2016; published 1 Mar 2016 © 2016 OSA 7 Mar 2016 | Vol. 24, No. 5 | DOI:10.1364/OE.24.005212 | OPTICS EXPRESS 5227

0
0.2
0.4
0.6
0.8
1
0 1 2 3 4 5
No
rmal
ized
En
ergy
Crystal Length (mm)
idlersignalPump
Fig. 11. Normalized energies of pump, signal and idler as functions of the crystal length,total input intensity to the system is 5 GW/cm 2, the seed pulse duration is 500 fs, the pumpis 480 fs and the external non-collinear angle is 0.6o.
process efficiency. However, a degradation-free idler pulse can also be produced by fine tuningthe interacting pulses to fit a crystal of thickness slightly longer than the optimum length. Thiscan be done by introducing a small, suitable delay between the seed and the pump to obtainthe optimum conversion at the exit of the crystal, which can be done, in this case, by delayingthe seed. By using this technique, the spatial, temporal and spectral profiles of the idler can beoptimized and, equally important, the efficiency of the stage can be maximized up to a valuethat can be even higher than that at perfect synchronization. In addition , when the input pulseis non-TL, introducing delay is imperative for the idler frequency shift correction, as will bediscussed later.
In this case, where vgs > vgp, delaying the seed means that this will scan the pump pulse asboth pulses propagate into the crystal and then will gain more energy instead of walking awayfrom the pump after being perfectly matched at the crystal input and the same applies to theidler. The other consequence of delaying the seed is that the effect of GVM in broadening thesignal and the idler pulses is reduced. Figure 12(a) presents the energy conversion efficiency ofthe whole system, in the idler, for the two cases of perfect synchronization and when the seed isdelayed in order to make the conversion length fit 3 mm crystal. The variation of the generatedidler pulse duration along the crystal for both cases in Fig. 12(a) are shown in Fig. 12(b). Thetotal input energy and the pulse duration are the same as for Fig. 11.
For a particular TL input pulse the amount of the optimum delay is defined by two factors: (a)the difference between the conversion length at perfect synchronization and the thickness of thechosen crystal, (b) the difference between the seed and pump group velocities along the pumppropagation direction, which is, for a particular input pulse, a function of the non-collinearangle (Ω), since the velocity difference in this case is (vgs cos(Ω)− vgp).
The enhancement of the intensity-transfer characteristics in OPAs by introducing suitabledelay between the seed and the pump has been studied in [22]. They concluded that, when thegroup velocity mismatched SHG technique is used to generate a short pump pulse, the amountof the required delay in the OPA stage almost does not depend on the seed intensity. However,the case is different for low gain OPA, where the seed intensity is an effective parameter on theconversion length of the OPA, i.e. in a particular crystal, changing the seed intensity effectivelychanges the conversion length of the OPA process, consequently, changing the seed intensitychanges the required delay for optimization. In addition, when the input pulse is a non-TLpulses, the spectral shift of the idler is another factor that defines the required delay in the OPA,
#256043 Received 18 Dec 2015; revised 12 Feb 2016; accepted 13 Feb 2016; published 1 Mar 2016 © 2016 OSA 7 Mar 2016 | Vol. 24, No. 5 | DOI:10.1364/OE.24.005212 | OPTICS EXPRESS 5228

0
2
4
6
8
10
12
14
16
18
0 1 2 3
Syst
em E
ffic
incy
in Id
ler
(%)
Crystal length (mm)
Perfetct SynchronizationSeed Delayed
(a)
300
320
340
360
380
400
420
440
460
480
500
0 1 2 3
Idle
r D
ura
tio
n (
fs)
Crystal Length (mm)
Perfetct SynchronizationSeed Delayed
(b)
Fig. 12. (a) The energy conversion efficiency of the system, idler energy to the total inputenergy to the system, for TL pulse of 500 fs duration and 5 GW/cm2 intensity at the systeminput when the seed and the pump are perfectly synchronized and when the seed is delayed,(b) the variation of the idler pulse duration along the crystal in both cases.
as will be shown later.On the other hand, achieving maximum idler intensity or energy is not the only parameter
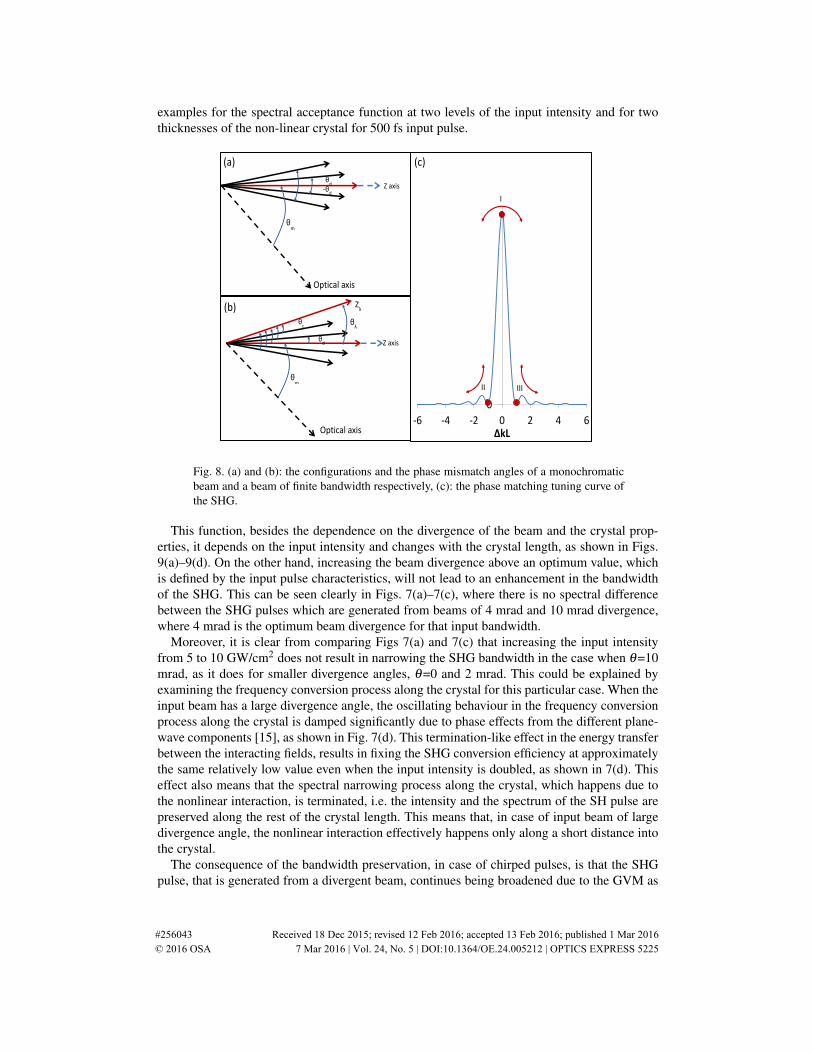
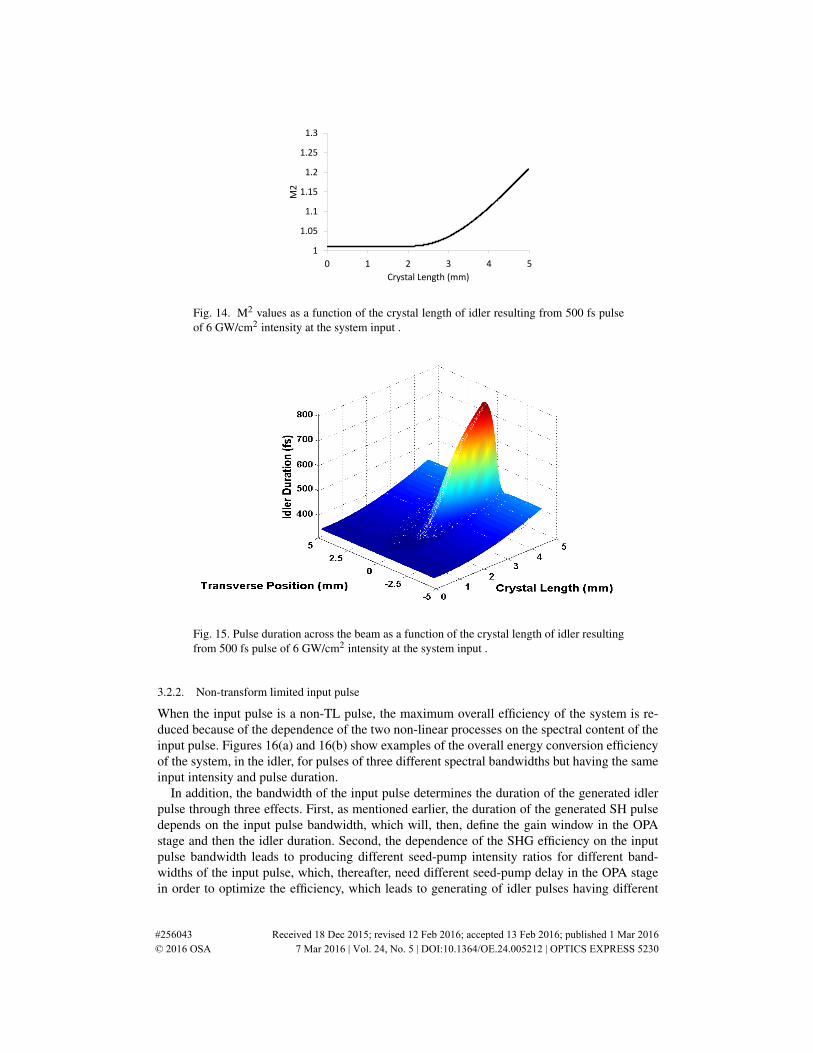
that defines the optimum delay, but also the temporal, the spatial and the spectral profiles of theidler should be considered. Using a thick crystal, for example 4 or 5 mm for the pulse understudy, produces an idler pulse that is deformed in the space, time and spectral domains. Figure13 presents the deformation of the idler pulse in time and space when a 4 mm crystal is used inthe OPA stage. Figure 14 shows the M2 value of the generated idler beam along a 5 mm BBOcrystal.
Fig. 13. Idler pulse resulting from 4 mm crystal in time and space, the input pulse to thesystem is TL of 500 fs duration and 5 GW/cm2 intensity.
Moreover, beyond the optimum crystal length the resulting idler pulse can have differentpulse duration across the beam, as shown in Fig. 15. This happens since the interplay of theGVM and the process saturation affects the resulting pulse differently in space depending onthe local intensity.
#256043 Received 18 Dec 2015; revised 12 Feb 2016; accepted 13 Feb 2016; published 1 Mar 2016 © 2016 OSA 7 Mar 2016 | Vol. 24, No. 5 | DOI:10.1364/OE.24.005212 | OPTICS EXPRESS 5229
1
1.05
1.1
1.15
1.2
1.25
1.3
0 1 2 3 4 5
M2
Crystal Length (mm)
Fig. 14. M2 values as a function of the crystal length of idler resulting from 500 fs pulseof 6 GW/cm2 intensity at the system input .
Fig. 15. Pulse duration across the beam as a function of the crystal length of idler resultingfrom 500 fs pulse of 6 GW/cm2 intensity at the system input .
3.2.2. Non-transform limited input pulse
When the input pulse is a non-TL pulse, the maximum overall efficiency of the system is re-duced because of the dependence of the two non-linear processes on the spectral content of theinput pulse. Figures 16(a) and 16(b) show examples of the overall energy conversion efficiencyof the system, in the idler, for pulses of three different spectral bandwidths but having the sameinput intensity and pulse duration.
In addition, the bandwidth of the input pulse determines the duration of the generated idlerpulse through three effects. First, as mentioned earlier, the duration of the generated SH pulsedepends on the input pulse bandwidth, which will, then, define the gain window in the OPAstage and then the idler duration. Second, the dependence of the SHG efficiency on the inputpulse bandwidth leads to producing different seed-pump intensity ratios for different band-widths of the input pulse, which, thereafter, need different seed-pump delay in the OPA stagein order to optimize the efficiency, which leads to generating of idler pulses having different
#256043 Received 18 Dec 2015; revised 12 Feb 2016; accepted 13 Feb 2016; published 1 Mar 2016 © 2016 OSA 7 Mar 2016 | Vol. 24, No. 5 | DOI:10.1364/OE.24.005212 | OPTICS EXPRESS 5230

pulse durations. Finally, even at fixed seed/pump intensity ratio and pulses durations, the opti-mum delay in the OPA depends on the chirp rate of the the pulses, because of the dependenceof the conversion efficiency on the spectral content of the pulses. This leads to generating ofidler pulses having different durations from input pulses of the same initial duration but ofdifferent bandwidths, as shown in Figs. 16(c) and 16(d) for the cases in Figs. 16(a) and 16(b)respectively.
0
2
4
6
8
10
12
14
16
18
0 1 2 3
Syst
em E
ffic
ien
cy in
idle
r (%
)
Crystal length (mm)
Δλ=3.26 nm (TL)
Δλ=4.2 nm
Δλ=6.2 nm
(a)
0
2
4
6
8
10
12
14
16
18
0 1 2 3
Syst
em E
ffic
ien
cy in
Idle
r (%
)
Crystal Length (mm)
Δλ=3.26 nm (TL)
Δλ=4.2 nm
Δλ=6.2 nm
(b)
300
320
340
360
380
400
420
440
460
480
500
520
0 1 2 3
Idle
r D
ura
tio
n (
fs)
Crystal length (mm)
Δλ=3.26 nm (TL)
Δλ=4.2 nm
Δλ=6.2 nm
(c)
300
320
340
360
380
400
420
440
460
480
500
520
0 1 2 3
Idle
r D
ura
tio
n (
fs)
Crystal Length (mm)
Δλ=3.26 nm (TL)
Δλ=4.2 nm
Δλ=6.2 nm
(d)
Fig. 16. (a) and (b) The overall energy efficiency of the system for pulses of 500 fs durationand 5 GW/cm2 intensity but of different spectral bandwidths in case of perfect synchro-nization and when the seed is delayed respectively, (c) and (d) the duration of the resultingidler along the crystal for the cases (a) and (b) respectively, the non-collinear angle is 0.6o.
The simulation shows that the required delay for simultaneously optimizing the conversionefficiency and the idler characteristics is the delay that maximises the summation of the timeand the frequency integrations of the generated idler pulse.
In the range of interest, where the relatively narrow bandwidth of the pulse and the thick-nesses of the crystals allow ignoring the dispersion effects in the crystal and the input intensityis in the range where the self and the cross phase changes are negligible, the effect of the signof the pulse chirp on the conversion efficiency of the system cannot be noticed. This can beunderstood by considering that negligible dispersion effects in the crystal and the minor phasechanges at this intensity level will not compress or broaden the interacting pulses. The conver-sion efficiency is thus not affected by the sign of the chirp. However, for a broad bandwidthor/and high input intensity, the sign and the order of the chirp can significantly affect the con-version efficiency in addition to the spectral and the temporal effects. On the other hand, evenfor narrow input bandwidth, the chirp sign is an important parameter in defining the directionof the idler frequency shift, as will be discussed later.
#256043 Received 18 Dec 2015; revised 12 Feb 2016; accepted 13 Feb 2016; published 1 Mar 2016 © 2016 OSA 7 Mar 2016 | Vol. 24, No. 5 | DOI:10.1364/OE.24.005212 | OPTICS EXPRESS 5231

0
0.2
0.4
0.6
0.8
1
1040 1050 1060 1070
Nor
mal
ized
Inte
nsity
Wavelength (nm)
Input SpectrumPerfect Synchronization, L=2 mmSeed Delayed, L=3 mm
(a)
0
0.2
0.4
0.6
0.8
1
1040 1050 1060 1070
Nor
mal
ized
Inte
nsity
wavelength (nm)
Input Spectrum
Negatively Chirped
Positively Chirped
(b)
Fig. 17. The spectra of idler pulse which is produced from 500 fs pulse of 5 GW/cm2
intensity at 0.6o non-collinear angle when (a) the input pulse is TL, L is the crystal length(b) the input pulse having 6.2 nm bandwidth.
3.2.3. The spectral profile of the generated idler
Working with a degenerate OPA, the bandwidth of the beam can be preserved throughout thesystem, due to the broadband amplification ability of the OPA in this regime. When the inputpulse is TL, the generated idler pulse spectrally can be broader than the input pulse without anyfrequency shift when a crystal of an optimum length is used. In addition, delaying the fasterpulse, for efficiency optimization, in a crystal that is slightly longer than the optimum thicknessdoes not cause any reduction in the spectrum of the resulting idler, but, on the contrary, slightlyenhances the idler bandwidth. Figure 17(a) shows two examples of the resulting idler spectrawhen the pump and the seed are perfectly synchronized at the input of 2 mm crystal, and whenthe seed is delayed to match the conversion length to a 3 mm crystal.
On the other hand, when the input pulse is chirped, the spectrum of the generated idleris shifted from the input spectrum due to GVM between the signal/idler and the pump. Theshift direction depends on the chirp sign of the input pulse, blue shift when the input pulse isnegatively chirped and red shift for the positively chirped, as shown in Fig. 17(b). In low-gainregime, the amount of the spectral shift depends on the initial chirp of the input pulse and thesaturation level of the process, which is dependent upon the seed/pump intensity ratio and thecrystal length.
The influence of GVM, in this case, can be eliminated by mixing the seed and the pump at anangle at which vgs cos(Ω) = vgp. However, this leads to generated idler beam with large angulardispersion, as will be discussed later. Another way for bringing back the spectrum of the idlerto match the input spectrum is delaying the seed pulse relative to the pump. The required delayis defined by the GVM of the pulses in the OPA crystal, the chirp rate of the input pulse and thedifference between the conversion length of the OPA and the thickness of the crystal. Accordingto the numerical simulation, the required delay for optimizing the conversion efficiency in acrystal that is a bit longer than the conversion length is equivalent to that which is required forbringing the spectrum to the desired position. Thus, using a crystal that is slightly longer thanthe conversion length and delay the faster pulse ensure optimum efficiency for the process andeliminate the spectral shift in the idler at the same time.
3.2.4. The spatial profile of the generated idler
At optimum working conditions of the system, the idler beam radius is about 70-80% of theinput beam radius depending on the saturation level of the processes. On the other hand, in such
#256043 Received 18 Dec 2015; revised 12 Feb 2016; accepted 13 Feb 2016; published 1 Mar 2016 © 2016 OSA 7 Mar 2016 | Vol. 24, No. 5 | DOI:10.1364/OE.24.005212 | OPTICS EXPRESS 5232
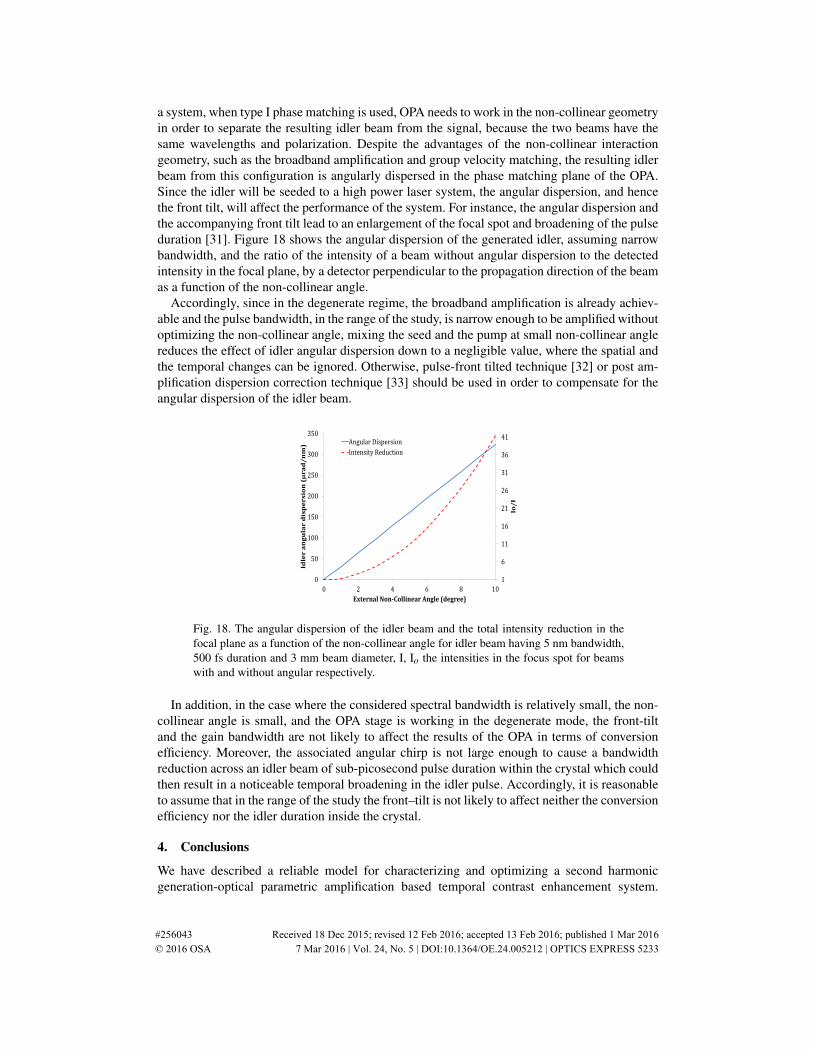
a system, when type I phase matching is used, OPA needs to work in the non-collinear geometryin order to separate the resulting idler beam from the signal, because the two beams have thesame wavelengths and polarization. Despite the advantages of the non-collinear interactiongeometry, such as the broadband amplification and group velocity matching, the resulting idlerbeam from this configuration is angularly dispersed in the phase matching plane of the OPA.Since the idler will be seeded to a high power laser system, the angular dispersion, and hencethe front tilt, will affect the performance of the system. For instance, the angular dispersion andthe accompanying front tilt lead to an enlargement of the focal spot and broadening of the pulseduration [31]. Figure 18 shows the angular dispersion of the generated idler, assuming narrowbandwidth, and the ratio of the intensity of a beam without angular dispersion to the detectedintensity in the focal plane, by a detector perpendicular to the propagation direction of the beamas a function of the non-collinear angle.
Accordingly, since in the degenerate regime, the broadband amplification is already achiev-able and the pulse bandwidth, in the range of the study, is narrow enough to be amplified withoutoptimizing the non-collinear angle, mixing the seed and the pump at small non-collinear anglereduces the effect of idler angular dispersion down to a negligible value, where the spatial andthe temporal changes can be ignored. Otherwise, pulse-front tilted technique [32] or post am-plification dispersion correction technique [33] should be used in order to compensate for theangular dispersion of the idler beam.
1
6
11
16
21
26
31
36
41
0
50
100
150
200
250
300
350
0 2 4 6 8 10
Io/
I
Idle
r a
ng
ula
r d
isp
er
sio
n (
µr
ad
/n
m)
External Non-Collinear Angle (degree)
Angular Dispersion
Intensity Reduction
Fig. 18. The angular dispersion of the idler beam and the total intensity reduction in thefocal plane as a function of the non-collinear angle for idler beam having 5 nm bandwidth,500 fs duration and 3 mm beam diameter, I, Io the intensities in the focus spot for beamswith and without angular respectively.
In addition, in the case where the considered spectral bandwidth is relatively small, the non-collinear angle is small, and the OPA stage is working in the degenerate mode, the front-tiltand the gain bandwidth are not likely to affect the results of the OPA in terms of conversionefficiency. Moreover, the associated angular chirp is not large enough to cause a bandwidthreduction across an idler beam of sub-picosecond pulse duration within the crystal which couldthen result in a noticeable temporal broadening in the idler pulse. Accordingly, it is reasonableto assume that in the range of the study the front–tilt is not likely to affect neither the conversionefficiency nor the idler duration inside the crystal.
4. Conclusions
We have described a reliable model for characterizing and optimizing a second harmonicgeneration-optical parametric amplification based temporal contrast enhancement system.
#256043 Received 18 Dec 2015; revised 12 Feb 2016; accepted 13 Feb 2016; published 1 Mar 2016 © 2016 OSA 7 Mar 2016 | Vol. 24, No. 5 | DOI:10.1364/OE.24.005212 | OPTICS EXPRESS 5233

The model assumes a common source for the second harmonic generation and the opticalparametric amplification and simultaneously takes into account the group velocity mismatch,the beam divergence, the pump depletion, and the spectral content of the input pulse fortransform and non-transform limited pulses. Numerical solutions of the model predict theperformance of both the related nonlinear processes and give clear evidence of the dependenceof the system performance on the input pulse characterization and the system configuration.The group velocity mismatch, the pump depletion, the crystal length, and the spectral contentof the input pulse are the most effective parameters that affect the performance of the opticalparametric stage. In addition, the beam divergence determines the efficiency, the temporaland the spectral shapes of the resulting pulse in the second harmonic generation stage. Acriterion has been set to show the way in which the beam divergence affects the efficiency ofthe second harmonic generation by defining a length that represents the coherence length atpump depletion regime. The efficiency of the system and the idler characteristics is efficientlyoptimized by using a crystal slightly longer than the conversion length and introducing smalldelay between the seed and the pump. Using this way the spectral shift of the idler, in caseof non-transform limited input pulse, can be corrected simultaneously. The efficiency and thetemporal shape of the generated idler pulse depend on the spectral content of the input pulseand on the seed-pump synchronization. The study provides a comprehensive understandingfor the temporal contrast enhancement unit and enables implementing the enhancement in away that ensures generating a high contrast and high quality seed for a high power laser system.
Acknowledgments
We acknowledge the financial support from EPSRC (grant numbers EP/I029206/1 and EP/L013975/1) and the Iraqi Ministry of Higher Education and Scientific Research. We also acknowledge the assistance of the Center of Plasma Physics staff at Queen’s University Belfast.
#256043 Received 18 Dec 2015; revised 12 Feb 2016; accepted 13 Feb 2016; published 1 Mar 2016 © 2016 OSA 7 Mar 2016 | Vol. 24, No. 5 | DOI:10.1364/OE.24.005212 | OPTICS EXPRESS 5234