comprehensive performance measurement systems design and
TRANSCRIPT

1
Comprehensive Performance Measurement Systems Design
and Organizational Effectiveness
Lorenzo LucianettiDepartment of Management and Business Administration, University of Chieti and Pescara
Valentina BattistaCranfield School of Management, Cranfield University
Xenophon KoufterosMays Business School, Texas A&M University
Abstract
Purpose – The paper aims to provide empirical evidence regarding the relationship between
the level of comprehensiveness of a Performance Measurement System (PMS) and its respec-
tive organizational effectiveness. The extant literature has highlighted that a PMS may suc-
cessfully contribute to the implementation of the organizational strategy, with the Balanced
Scorecard (BSC) serving as an exemplar of a strategy performance management tool and
playing a primary role to this end. However, the reasons for the overall high rate of failure in
the implementation of the BSC remain unexplained and, to date, little empirical research ex-
ists regarding the design of PMSs such as the BSC and its constituent elements.
Design/methodology/approach – Using a survey of 103 Italian managers, the paper
advances a model describing a comprehensive BSC design, after identifying the key attributes
from the performance management literature. Data were analyzed using cluster analysis and
multiple regression analysis.
Findings – Results suggest that organizations are implementing the BSC following two dif-
ferent approaches, which vary from a less comprehensive to a more comprehensive design.
More importantly, the BSC design explains variation across three organizational effectiveness
measures: (1) improvements in translating the organizational strategy into operational goals,
(2) understanding cause-effect relationships, and (3) enhancing internal communication
among employees.
Originality/value – The paper builds on and extends the previous literature on performance
management in two ways. First, via a literature review, it introduces a model describing a
comprehensive BSC design which includes 12 attributes. Second, it demonstrates that organi-
zational effectiveness varies positively with the level of comprehensiveness of the BSC de-
sign.
Keywords Comprehensive performance measurement systems, balanced scorecard design,
organizational effectiveness, performance management
Paper type Research paper

2
Introduction
Understanding the impact of Performance Measurement Systems (PMSs) on organization-
al effectiveness is arguably an intriguing area of research in the performance management
literature (Franco-Santos et al., 2012; Koufteros et al., 2014; Maestrini et al., 2018a). A par-
ticular concern is whether the actual PMSs that are deployed provide coverage for the domain
of the specific management tools they are intended to represent. For instance, do companies
that claim to use the Balanced Scorecard (BSC) actually design their PMSs to adequately rep-
resent the basic tenets of the BSC (an exemplar of PMSs) related to learning and growth,
internal business processes, customers, and financial dimensions? Is there an adequate and
diverse number of measures deployed? Furthermore, is the BSC design comprehensive
enough to produce measurements for variables such as ease of production, delivery speed, on-
time delivery performance, delivery accuracy, storage costs, internal and external quality fail-
ures and respective costs, distribution costs, material costs, labor costs, inventory turns, and
obsolescence amongst others? And, are those measurements updated on a regular basis? Is the
incentive structure conducive to produce desired results? Are financial vis-à-vis non-financial
measures evenly weighted?
Previous research found that PMSs have a positive impact on organizational effectiveness
(Upadhaya et al., 2014) by aligning employee capabilities, activities, and performance with
the organizational strategic goals (de Leeuw and van den Berg, 2011). Leung et al. (2006, p.
659) note that “the BSC has been viewed as a vehicle to articulate the strategies of a
company, to communicate these strategies to employees, and to help align individual and
organizational initiatives for the realization of company goals. In this way, the BSC may be
used as part of a larger management system of communication, information sharing, and
learning” and serves as the most prolific representation of a PMS.
Moreover, in order to contribute to the development, communication, and review of the
organizational strategy, operations management scholars (e.g., de Waal et al., 2009; Laihonen
and Pekkola, 2016) have emphasized the importance of considering the level of comprehen-
siveness of PMSs. In the eighties, traditional PMSs have been criticized for being dominated
by short-term and backward-looking metrics, for the lag of financial metrics, and for being
internally oriented and poorly linked to the organizational strategy (Neely et al., 1995). To
overcome these problems, Kaplan and Norton (1992) introduced the BSC. Successively, they

3
developed its concept to provide organizations with a set of financial and non-financial per-
formance measures that gave “a fast but comprehensive view of the business” (p. 71) by sup-
porting the strategy implementation, increasing performance, and improving strategic deci-
sion making. In the last two decades, the BSC has represented one of the major innovations in
the field of performance management techniques.
Over the years, organizations have massively designed and implemented BSC systems.
Although there have been considerable contributions in the performance management
literature (e.g., Bititci et al., 2015; Bourne et al., 2000; 2002; Pekkola and Ukko, 2016),
several features related to its design remain unexplored, and little empirical information exists
about the relationships between the level of comprehensiveness of PMSs and the
organizational effectiveness it may engender (Maestrini et al., 2018b). For these reasons,
management studies have highlighted the need for empirical research to look beyond the sim-
ple inclusion of financial and non-financial measures when considering PMSs. Some scholars
(de Waal et al., 2009) note the importance of identifying factors that may contribute to the
success of PMS projects keeping down the overall high rate of failure of BSC
implementations (Johanson et al., 2006; Maestrini et al., 2018a). For example, Wiersma
(2009) argues that the BSC is “treated as a black box with no information given about the de-
sign of the scorecard, its quality of implementation, or sophistication” (p. 250). In a similar
vein, De Geuser et al. (2009) highlight the importance of analyzing the contribution of the
BSC at different levels of its development. More recently, Hu et al. (2017) underline that suc-
cess in strategy implementation can be increased simply by changing the design and infor-
mation content of a BSC. Similarly, Cao et al. (2015) noted that the BSC forces senior man-
agers to consider all the important operational measures (some of which conflict) at the same
time, preventing sub-optimization. The rationale is that the implementation of a comprehen-
sive PMS, such as the BSC, is a complex task that requires continual efforts and adjustments.
But, successful implementation rests on the design attributes of the BSC, which may vary
across organizations. Unfortunately, these design attributes are rarely addressed in the empiri-
cal literature, and it is unknown whether and to what extent they contribute to the effective-
ness of the BSC. Indeed, as observed by Speckbacher et al. (2003), BSC spread, content, and
implementation, as well as users’ experiences, are likely to vary depending on the particular
design of a BSC that is deployed.
Therefore, this research aims to extend previous literature in operations management,
which explicitly calls for a better operational definition of PMS roles which should be ex-
plored further with emphasis on PMS design. The paper relies on two streams of literature:
the literature (e.g., Pellinen et al., 2016) that examines the BSC as an exemplar of a
comprehensive PMS linking together the corporate strategy with the key scorecard
dimensions (i.e., learning and growth, internal business processes, customer, and financial),
4
and the literature (e.g., de Leeuw and van den Berg, 2011; Pekkola and Ukko, 2016) that
explores the relationships with organizational effectiveness. In this way, the paper aims to
make a twofold contribution to the theory and the practice in the operations management
field. First, it seeks to identify the key design attributes of a comprehensive BSC enhancing
the understanding of factors contributing to the BSC success, and second, it empirically
investigates whether the level of comprehensiveness of the BSC, as articulated via the design
attributes, does relate positively with organizational effectiveness.
The remainder of the paper is structured as follows: it begins with a review of the PMS lit-
erature while contextualizing the evolution of the BSC concept and identifying the key attrib-
utes for a comprehensive BSC design. Then, it continues with a description of data collection,
measures, methods of analysis, and results. Finally, the paper provides a conclusion and a dis-
cussion of the main contributions to theory and practice, as well as limitations and directions
for further research.
Literature Review
Performance Measurement Systems and Organizational Effectiveness
Hall (2008) defines comprehensive PMSs as systems able to provide a broad set of
measures which are integrated with the strategy across all the various functional entities.
Micheli and Mura (2017) stressed the importance of considering the level of
comprehensiveness of PMSs and claim that it is not merely the use of PMSs that impacts
performance; indeed, the type of measures used and, most importantly, the extent to which
they are comprehensive may be rather salient factors in explaining success. Upadhaya et al.
(2014) noted that the use of comprehensive PMSs, which embed non-financial indicators, is
tightly coupled with organizational effectiveness. As Chenhall (2005) suggests, there is a
wide variation across PMSs, which range in their design from combinations of a few financial
and non-financial measures to more comprehensive systems able to link operations to the di-
mensions of a PMS. A basic question that begs attention is what makes a PMS ‘comprehen-
sive’. What are the constituent elements of a comprehensive PMS? To this regard, the litera-
ture has identified some important characteristics or elements.
Ittner et al. (2003b) suggest that an important aspect of a comprehensive PMS is what
they coin ‘measurement diversity’ defined as “supplementing traditional financial measures
with a diverse mix of non-financial measures that are expected to capture key strategic per-
formance dimensions that are not accurately reflected in short-term accounting measures” (p.
717). Henri (2010) adds that a PMS should provide performance information for all of the
areas of the organization. It follows that two aspects need to be considered when designing a
comprehensive PMS: first, a PMS must include measures representing all areas and

5
operations of the organization, and second, it must define links between its measures and the
organizational strategy and objectives (Smith and Bititci, 2017). The second aspect invokes
relationships between the design of a comprehensive PMS and organizational effectiveness.
Indeed, these systems may have positive implications on organizational effectiveness in at
least two ways. First, a comprehensive PMS acts as a catalyst linking long-term strategic ob-
jectives with short-term actions, and second, it can support managers in communicating the
intended strategy up and down the organization. Moreover, a comprehensive PMS can
encourage companies to pursue strategic learning initiatives in order to create a more
collaborative environment within their organizations while enhancing the employees’
understanding regarding how they may personally contribute to the company’s vision and
direction. This, in turn, may result in a better alignment of each individual’s performance with
the overall strategy (Pekkola and Ukko, 2016). Laihonen and Pekkola (2016) examined how
the utilization of a new PMS influences supply chain management (SCM) and the kind of
impact the new system has on the performance of the supply chain. Using a longitudinal
design, the findings demonstrate that a PMS serves as a catalyst of inter-organizational
knowledge transfer and promotes shared learning, which in turn led to improved performance
of the supply chain. They further illustrate practical mechanisms through which performance
measurement (PM) provides value for SCM. Finally, Micheli and Mura (2017) highlight that
comprehensive PMSs have the potential to support organizations in setting future goals, link-
ing rewards to performance measures and conducting periodic performance reviews to ad-
vance changes in their strategies.
An Exemplar of a Comprehensive PMS: The BSC
The concept of the BSC, as envisioned by Kaplan and Norton (1992), suggests that the
BSC should derive from the corporate strategy and it should include financial and non-
financial performance measures organized around the key dimensions (as they relate to
learning and growth, internal business processes, customers, and financials). Also, the BSC
needs to include cause and effect relationships between measures and tie compensation to
non-financial indicators. However, present-day conceptualizations differ.
Ittner et al. (2003b) note that many organizations claim to be utilizing the BSC just
because they use a mixture of some financial and non-financial measures. In the same vein,
Chenhall (2005) highlights the presence of a wide variety of BSC designs, which range from
specifying combinations of a few financial and non-financial performance measures to more
comprehensive systems which are able to link operations management to the four BSC
dimensions and to business strategies. Hall (2008) also argues that the design of the BSC may
vary from a less comprehensive system (with delimited information) to a more comprehensive
system which furnishes managers with fairly inclusive performance information.

6
Furthermore, only a few studies have considered what a BSC is and how it can be
translated into concepts and practice (Malmi, 2001; Speckbacher et al., 2003). In fact, many
firms claiming to have implemented a BSC, do not adopt in practice any, or just a few, of
Kaplan and Norton’s prescriptions. Ittner et al. (2003b) suggest that research needs to
examine what organizations mean by BSC while considering that the ‘one-size-fits-all’ model
may not be efficacious for all organizations (Johanson et al., 2006). In fact, the design aspects
of a BSC have been overlooked within the realm of the performance management literature.
Given the lack of understanding of what makes a PMS comprehensive, we focus our
attention on the design of a comprehensive BSC model. In the next section we review the
PMS literature as it relates to the BSC and identify the key design attributes for a
comprehensive BSC model.
Review of the BSC Design Attributes
Leung et al. (2006) point that “although the conceptual framework of the BSC has been
widely accepted in the business community, the proper method of implementing the frame-
work remains an issue” (p. 683). Implementation rests on design attributes, but there is very
little in the form of a review of the design attributes affecting the implementation of a BSC.
Therefore, an in-depth review of the extant literature has been undertaken to explore the cru-
cial attributes.
The first step in the literature review process was to conduct a scouting study to identify
the key sources of research, the type of evidence available, and the main keywords required
for finding relevant studies. The vast majority of research on the implementation of BSC sys-
tems emerged from different disciplines related mainly to accounting, operations manage-
ment, and general management. Thus, we searched articles in these fields. While it is not very
surprising that research on BSC implementation is embedded in various disciplines and de-
scribed both in the public and private sectors, it appears interesting to underscore that only a
small portion of these articles features issues related to BSC design.
The list of papers we deployed focused only on the most prominent literature addressing
BSC design, as reflected by citations. It includes the work of Decoene and Bruggeman
(2006), De Geuser et al. (2009), Franco-Santos et al. (2012), Malmi (2001), and Speckbacher
et al. (2003). We examined these seminal papers and their respective references for guidance
in our quest to uncover salient articles. After examining the extant literature, the authors re-
convened to discuss critical keywords and conveying using two main keywords: “perfor-
mance measurement system design” and “balanced scorecard design”. Based on the insights
extracted from our scouting study, we defined the criteria for selecting those studies that
would constitute the data set for our literature review. The main objective of these selection
criteria was to narrow the scope of our research and allow its replication.
7
The first criterion was based upon the perceived quality of the journal: almost exclusively,
3+ journals from the Chartered Association of Business Schools journal list were considered.
An exception was made regarding two papers from the journal ‘Management Decision’ as the
authors concluded that their respective content and quality would contribute significantly and
positively towards this inquiry. Furthermore, this study focused only on the disciplines that
typically produce manuscripts in this domain; this includes production and operations man-
agement, operational research, and management accounting.
The second criterion related to the fitness of the content. The search relied on the Scopus
database and specified a range from the year 2000 to 2018 (year 2000 was the starting point
as this was when Kaplan and Norton published their seminal and best-selling book). Over
2,000 papers were identified. At this point the authors read the abstracts and selected the pa-
pers that met the selection criteria, after debating the inclusion of a small number of articles.
The researchers then downloaded the full manuscripts and identified further relevant literature
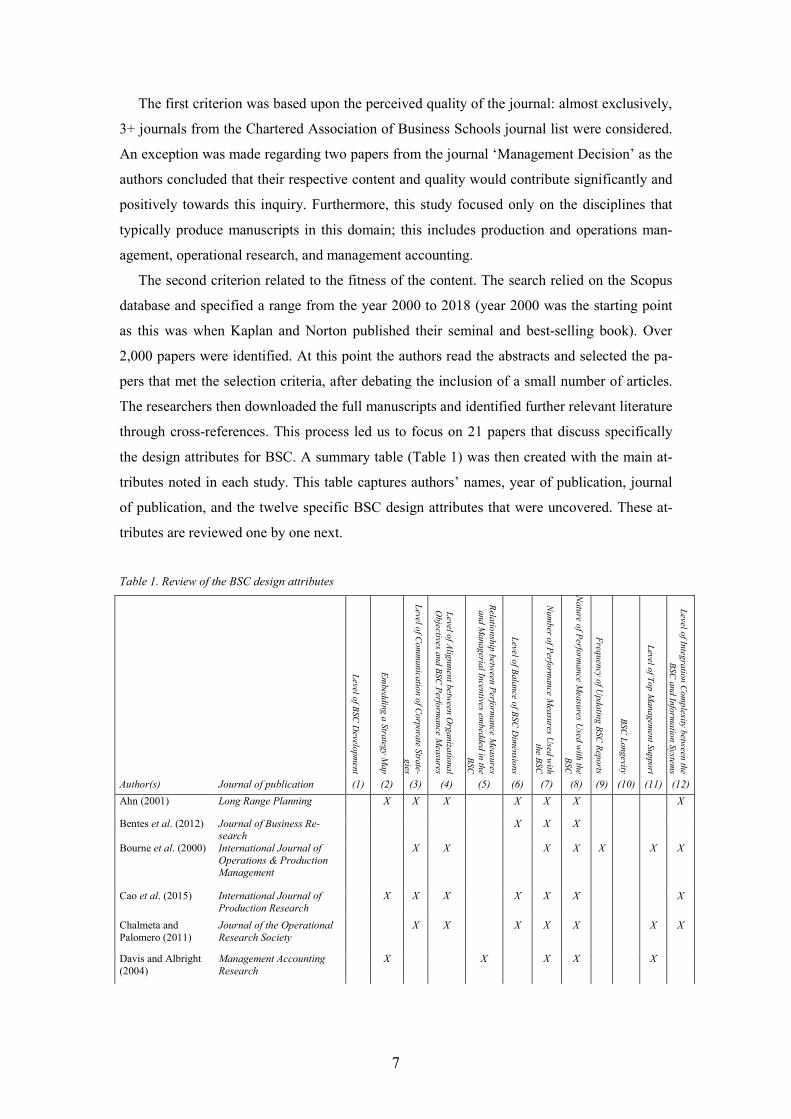
through cross-references. This process led us to focus on 21 papers that discuss specifically
the design attributes for BSC. A summary table (Table 1) was then created with the main at-
tributes noted in each study. This table captures authors’ names, year of publication, journal
of publication, and the twelve specific BSC design attributes that were uncovered. These at-
tributes are reviewed one by one next.
Table 1. Review of the BSC design attributes
Level
ofB
SC
Develo
pm
ent
Em
beddinga
Stra
tegyM
ap
Level
ofC
omm
unication
ofC
orpora
teStrate-
gies
Level
ofA
lignmen
tbetw
eenO
rganiza
tional
Objectives
andB
SCP
erforman
ceM
easures
Relatio
nshipbetw
eenP
erform
ance
Measures
andM
anagerial
Incentivesem
beddedin
the
BS
C
Level
ofB
alance
ofB
SCD
imen
sions
Num
berof
Perform
ance
Measu
resU
sedw
ithth
eB
SC
Nature
ofP
erformance
Measures
Used
with
theB
SC
Frequency
ofU
pdatin
gB
SCR
eports
BSC
Lo
ngevity
Level
ofT
opM
anag
ement
Suppo
rt
Level
ofIntegration
Co
mp
lexitybetw
eenthe
BSC
andInform
ation
Systems
Author(s) Journal of publication (1) (2) (3) (4) (5) (6) (7) (8) (9) (10) (11) (12)
Ahn (2001) Long Range Planning X X X X X X X
Bentes et al. (2012) Journal of Business Re-search
X X X
Bourne et al. (2000) International Journal ofOperations & ProductionManagement
X X X X X X X
Cao et al. (2015) International Journal ofProduction Research
X X X X X X X
Chalmeta andPalomero (2011)
Journal of the OperationalResearch Society
X X X X X X X
Davis and Albright(2004)
Management AccountingResearch
X X X X X

8
Decoene and Brug-geman (2006)
International Journal ofOperations & ProductionManagement
X X X X X
Hu et al. (2017) European Journal of Opera-tional Research
X X X X
Ittner et al. (2003a) The Accounting Review X X X X X X
Ittner et al. (2003b) Accounting, Organizationsand Society
X X X X X
Kim and Rhee(2012)
International Journal ofProduction Research
X X X X X
Kolehmainen (2010) Long Range Planning X X X X X X
Liang (2015) International Journal ofProduction Research
X X X X X
Llach et al. (2017) Management Decision X X X
López-Ospina et al.(2017)
Management Decision X X X X
Malmi (2001) Management AccountingResearch
X X X X
Nielsen and Nielsen(2012)
Production Planning &Control
X X X X X X
Papalexandris et al.(2004)
Long Range Planning X X X X X X X X X X
Rajesh et al. (2012) International Journal ofProduction Economics
X X X X
Speckbacher et al.(2003)
Management AccountingResearch
X X X X X
Ukko et al. (2007) International Journal ofProduction Economics
X X X X
(1) Level of BSC Development. One of the first design elements for a BSC is the level of
the development that is desired as managers need to consider whether the design will be ra-
ther rudimentary and thus cover the most elemental expectations, or be rather comprehensive
and thus more inclusive and informative. Kaplan and Norton’s main works suggest that there
are three levels of development in the design and subsequent implementation of a BSC sys-
tem:
1. Level 1 (Kaplan and Norton, 1992) – BSC is developed as a PMS encompassing a co-
herent set of financial and non-financial performance measures covering different per-
spectives of the organization.
2. Level 2 (Kaplan and Norton, 1996) – BSC is transformed into a strategic management
system describing management processes and principles to develop and implement a
strategy-focused and aligned management system.
3. Level 3 (Kaplan and Norton, 2006) – BSC is conceived as a comprehensive manage-
ment philosophy embracing strategy maps. According to Kaplan and Norton (2006) the
strategy-focused organization is based on a set of five principles: (i) translate the
strategy into operational terms; (ii) align the organization to the strategy; (iii) make

9
strategy everyone’s day job; (iv) make strategy a continual process and (v) mobilize
leadership for change.
For instance, at Level 1 the organization may collect and monitor a variety of measures re-
lated to delivery performance while at Level 2 these measures may be linked to customer re-
tention levels and at Level 3 the organization may mobilize resources and make delivery per-
formance part of everyone’s daily job.
With the notable exception of Speckbacher et al. (2003), no other studies on BSC design
have explicitly highlighted this important attribute. The rationale for inclusion is that BSC
diffusion, content, and implementation challenges, as well as users’ experiences, are likely to
vary depending on the level of development that is designed in a BSC. As an organization
anticipates the introduction of a BSC, managers have to make choices whether the BSC will
be designed as a rather rudimentary or comprehensive tool.
(2) Embedding a Strategy Map – Kaplan and Norton developed the idea of mapping causal
relationships between BSC dimensions and their respective measures into a strategy map in
their first book (1996). According to Kaplan and Norton (2006), the most important conse-
quence when an organization embeds a strategy map in the design is the ability to communi-
cate the strategy to the entire organization. To this end, Malmi (2001) observed that most or-
ganizations which have not yet developed a strategy map model are facing problems in de-
scribing cause-and-effect relationships. Nielsen and Nielsen (2012) suggest that the cause and
effect relationships among the different measurement dimensions in a strategy map are fun-
damental for a BSC system.
The design of a strategy map has not been widely discussed in the literature (Cao et al.,
2015; Davis and Albright, 2004), and generally the cause-and-effect relations amongst BSC
dimensions are generated subjectively using managerial experience and judgment. A notable
exception is the study of López-Ospina et al. (2017) which proposes a quantitative methodol-
ogy. Using a linear programming model (i.e., DEMATEL), they selected those relationships
that should be included in a strategy map. Using a strategic-operations research perspective,
Hu et al. (2017) show that participants do not make better decisions when facing a reduced set
of strategy-related indicators that are assigned to strategic themes and grouped into the four
classic BSC dimensions. Instead, the BSC strategy map concept integrated into decision-
supporting dashboards, such as the BSC, increases strategy-implementation performance.
This result highlights the fact that success in strategy implementation can be increased just by
changing the design and information content of a dashboard (e.g., introducing information on
causal relations and showing next-quarter goals).
(3) Level of Communication of Corporate Strategies – The diffusion of corporate strategy
across the hierarchy is vital if employees at the trenches are to contribute positively towards
10
the corporate strategy. For example, shop-floor employees need to be communicated what is
important in order to support the corporate strategy, or how their work impacts specific
measures – the importance of quality or delivery performance for instance can be stressed and
linked with the customer dimension. The design of a BSC is critical in this respect as it can
serve as a vehicle to diffuse the corporate strategy across the organization (Rajesh et al.,
2012; Chalmeta and Palomero, 2011). Kaplan and Norton (1996) suggest that BSC can be
used to communicate strategy to all the members of the organization and this would represent
the greatest benefit for the organization. Previous studies (e.g., Speckbacher et al., 2003) sug-
gest that given that BSCs are primarily implemented at higher organizational levels, it is in-
teresting to see the extent to which these are used as instruments for communicating the strat-
egy to lower organizational levels. Bititci et al. (2006) illustrate that using a BSC system
would improve the internal communication of the strategy, promoting closer collaboration
and better knowledge sharing among employees. Papalexandris et al. (2004) highlight how
using BSCs would strengthen the focus on the achievement of results and enhance clarity.
Finally, Ukko et al. (2007) produce evidence about the positive impact of the BSC in generat-
ing more specific and exploitable information which in turn provides a more solid base for
management-employee communication.
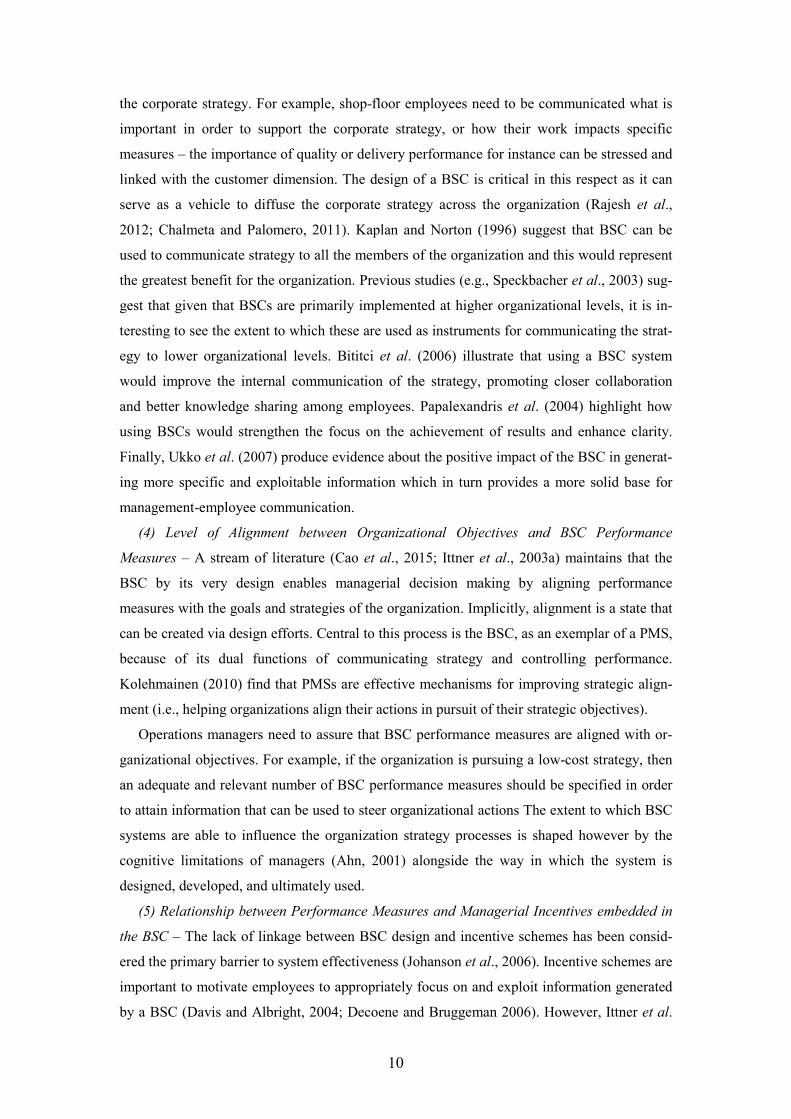
(4) Level of Alignment between Organizational Objectives and BSC Performance
Measures – A stream of literature (Cao et al., 2015; Ittner et al., 2003a) maintains that the
BSC by its very design enables managerial decision making by aligning performance
measures with the goals and strategies of the organization. Implicitly, alignment is a state that
can be created via design efforts. Central to this process is the BSC, as an exemplar of a PMS,
because of its dual functions of communicating strategy and controlling performance.
Kolehmainen (2010) find that PMSs are effective mechanisms for improving strategic align-
ment (i.e., helping organizations align their actions in pursuit of their strategic objectives).
Operations managers need to assure that BSC performance measures are aligned with or-
ganizational objectives. For example, if the organization is pursuing a low-cost strategy, then
an adequate and relevant number of BSC performance measures should be specified in order
to attain information that can be used to steer organizational actions The extent to which BSC
systems are able to influence the organization strategy processes is shaped however by the
cognitive limitations of managers (Ahn, 2001) alongside the way in which the system is
designed, developed, and ultimately used.
(5) Relationship between Performance Measures and Managerial Incentives embedded in
the BSC – The lack of linkage between BSC design and incentive schemes has been consid-
ered the primary barrier to system effectiveness (Johanson et al., 2006). Incentive schemes are
important to motivate employees to appropriately focus on and exploit information generated
by a BSC (Davis and Albright, 2004; Decoene and Bruggeman 2006). However, Ittner et al.

11
(2003a) found no evidence that the BSC enhanced managers’ understanding of business
goals. Instead, they revealed that by placing weight on financial metrics, by considering
scorecard-non-related factors in performance evaluation, by modifying evaluation criteria
quarterly, and by ignoring predictive measures of future financial performance while
weighting non predictive metrics, managers were able to distort the ‘equilibrium’ in bonuses.
This “high level of subjectivity in the BSC plan led many branch managers to complain about
favoritism in bonus awards and uncertainty in the criteria being used to determine rewards.
The system ultimately was abandoned in favor of a formulaic bonus plan based solely on rev-
enues” (Ittner et al., 2003a, p. 725).
Papalexandris et al. (2004) noted that the use of incentives in a BSC setting caused ten-
sions between members of a project team and thus this practice was abandoned, as top man-
agement believed that managerial cooperation towards achieving targets was more important
than competing for bonuses. Epstein and Manzoni (1998) note that many organizations are
adopting a ‘wait while we learn’ approach, while Malmi (2001) questions whether the incen-
tive system is compatible with the BSC and, eventually, how such compatibility could be im-
proved. Therefore, the relationship between comprehensive BSC design and managerial in-
centives deserves further attention, given that the potential BSC system tends to be reinforced
when the performance measures are linked to reward schemes (Franco-Santos et al., 2012).
(6) Level of Balance of BSC Dimensions – BSC designs should highlight the balance
amongst its four dimensions (i.e., learning and growth, internal business processes, customer,
and financial). Kaplan and Norton (2001) recommend equal weighting, suggesting that non-
financial measures are at least as important as financial measures and that the BSC rules out
suboptimal decision making, forcing managers to consider all the relevant components. The
assumption is that an equal allocation of attention is most optimal and resembles a compre-
hensive measurement system as suggested by Braam and Nijssen (2004). Recently, Llach et
al. (2017) revealed that internal processes and customer dimensions are found to be equally
important in terms of the contribution to financial results and that a balance between the four
components is needed. They empirically show how “a non-appropriate behavior of the second
or third perspectives could cause a 50 percent decrease in financial results, which is consistent
with the original ideas developed by Kaplan and Norton (1996)” (p. 2194).
Contrarily to the perspective of Jensen (2001), who argues that the financial dimension is
always the sole priority, Jääskeläinen et al. (2014) highlight the notion that the four BSC per-
spectives are all interrelated and are equally important. However, some studies introduce also
new perspectives. Chalmeta and Palomero (2011) provide practical examples of 16 organiza-
tions that embedded the dimensions of ecological and social sustainability within their strate-
gic considerations and then decided to manage them using the BSC. A succinct example of

12
weighing for a comprehensive BSC is Bentes et al. (2012), who formally explain how to
weigh the importance of the dimensions.
(7) Number of Performance Measures Used with the BSC – Studies on BSC (e.g., Hen-
ri, 2010; Liang, 2015) accentuate the importance of incorporating a set of performance
measures in the design that provide a balanced usage of the different dimensions. Ittner et al.
(2003b) find consistent evidence suggesting that firms making more extensive use of a broad-
er set of financial and (particularly) of non-financial measures than firms with similar strate-
gies or value drivers, have higher measurement system satisfaction and stock market returns.
Using a Delphi study, Rajesh et al. (2012) demonstrate how managers can design a BSC to
measure and evaluate day-to-day business operations across the four BSC dimensions. They
underscore the importance to balance a set of financial and non-financial measures and fur-
nish weights for each BSC dimension. Malmi (2001) reports that the number of measures in a
BSC ranges between a minimum of 4 and a maximum of 25 while Van der Stede et al. (2006)
find that increasing the number of performance measures may help organizations obtain better
organizational performance, maintaining that managers would have an incentive to focus on
those activities for which their performance is measured and evaluated on, often at the ex-
pense of other relevant but non-measured activities. Operations managers can contribute a
number of important measures, which are linked to the overall strategy of the organization
(Hu et al., 2017). These measures can vary from product innovation, to productivity, invento-
ry, lead time, quality, and cost amongst others (Kolehmainen, 2010).
(8) Nature of Performance Measures Used with the BSC – Libby et al. (2004) addressed
the importance of choosing the right performance measures in line with the business unit
strategy and avoiding the ‘one-size-fits-all’ approach which could lead, for example, to the
usage of common or standardized performance measures for diverse business units. In partic-
ular, Kaplan and Norton’s prescriptions suggest that a BSC design should rely on both finan-
cial and non-financial performance measures. This is an overall design consideration on how
to apportion performance measures across financial and non-financial categories (Chalmeta
and Palomero, 2011; Llach et al., 2017). Bryant et al. (2004) found significant differences
between organizations implementing BSC systems using both financial and non-financial per-
formance measures versus organizations with BSCs relying solely on financial measures,
suggesting that the inclusion of both financial and non-financial performance measures is in-
dispensable for a comprehensive BSC design.
(9) Frequency of Updating BSC Reports – The frequency in updating BSC reports is an-
other key attribute that should be embedded in the design of a comprehensive BSC. Review-
ing and updating PMSs based on environmental changes are as important as developing and
implementing them. In essence, a BSC should be dynamic in nature. Operations managers
need current information in order to mobilize resources where necessary in an environment
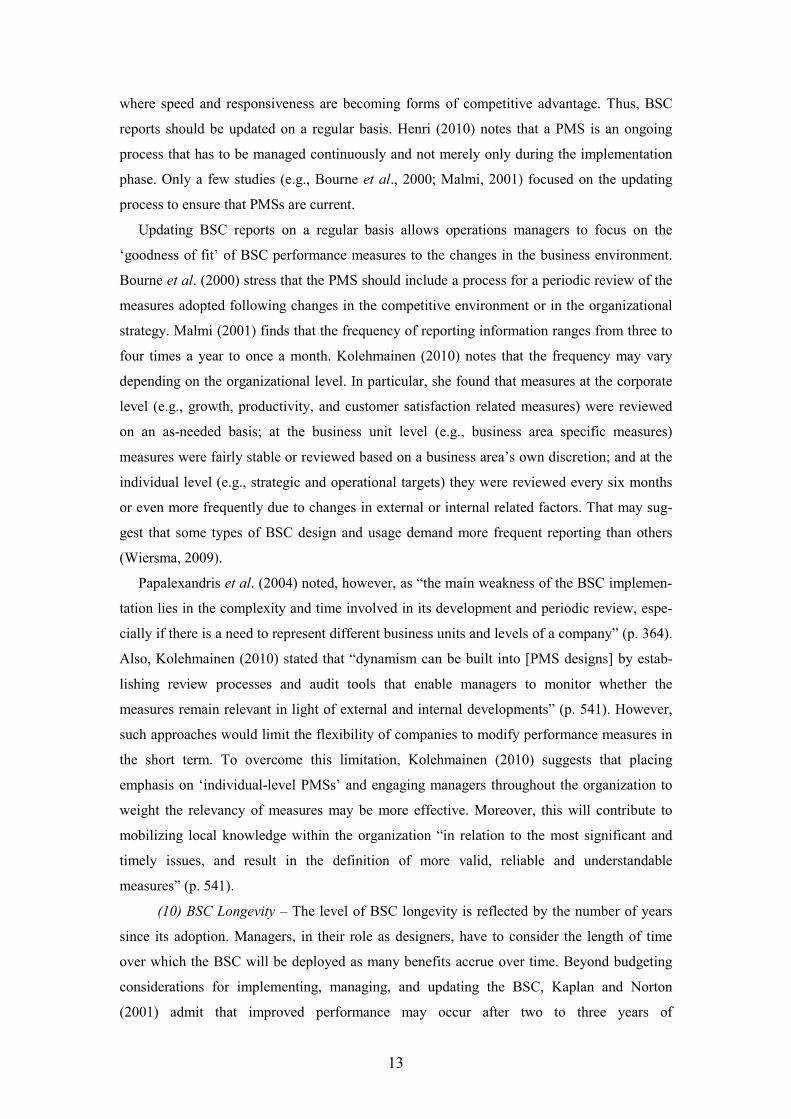
13
where speed and responsiveness are becoming forms of competitive advantage. Thus, BSC
reports should be updated on a regular basis. Henri (2010) notes that a PMS is an ongoing
process that has to be managed continuously and not merely only during the implementation
phase. Only a few studies (e.g., Bourne et al., 2000; Malmi, 2001) focused on the updating
process to ensure that PMSs are current.
Updating BSC reports on a regular basis allows operations managers to focus on the
‘goodness of fit’ of BSC performance measures to the changes in the business environment.
Bourne et al. (2000) stress that the PMS should include a process for a periodic review of the
measures adopted following changes in the competitive environment or in the organizational
strategy. Malmi (2001) finds that the frequency of reporting information ranges from three to
four times a year to once a month. Kolehmainen (2010) notes that the frequency may vary
depending on the organizational level. In particular, she found that measures at the corporate
level (e.g., growth, productivity, and customer satisfaction related measures) were reviewed
on an as-needed basis; at the business unit level (e.g., business area specific measures)
measures were fairly stable or reviewed based on a business area’s own discretion; and at the
individual level (e.g., strategic and operational targets) they were reviewed every six months
or even more frequently due to changes in external or internal related factors. That may sug-
gest that some types of BSC design and usage demand more frequent reporting than others
(Wiersma, 2009).
Papalexandris et al. (2004) noted, however, as “the main weakness of the BSC implemen-
tation lies in the complexity and time involved in its development and periodic review, espe-
cially if there is a need to represent different business units and levels of a company” (p. 364).
Also, Kolehmainen (2010) stated that “dynamism can be built into [PMS designs] by estab-
lishing review processes and audit tools that enable managers to monitor whether the
measures remain relevant in light of external and internal developments” (p. 541). However,
such approaches would limit the flexibility of companies to modify performance measures in
the short term. To overcome this limitation, Kolehmainen (2010) suggests that placing
emphasis on ‘individual-level PMSs’ and engaging managers throughout the organization to
weight the relevancy of measures may be more effective. Moreover, this will contribute to
mobilizing local knowledge within the organization “in relation to the most significant and
timely issues, and result in the definition of more valid, reliable and understandable
measures” (p. 541).
(10) BSC Longevity – The level of BSC longevity is reflected by the number of years
since its adoption. Managers, in their role as designers, have to consider the length of time
over which the BSC will be deployed as many benefits accrue over time. Beyond budgeting
considerations for implementing, managing, and updating the BSC, Kaplan and Norton
(2001) admit that improved performance may occur after two to three years of

14
implementation of the BSC due to the lag effect between its adoption and performance gains.
Maestrini et al. (2018a) find that PMS maturity can lead to higher performance. Based on
eight case organizations deploying the BSC, Ukko et al. (2007) report that the maturity of the
BSC is one of the key factors behind its positive impact. The longevity of the BSC enabled
the transformation of PM data to usable and exploitable information. By using this
information, it was possible to allocate the resources to the right activities, which led to higher
financial performance. Ittner et al. (2003b) noted that the effects on performance results are
stronger in their subsample of firms with more mature BSC systems, suggesting that BSC
yields economic results with some time lag. Thus, managers need to consider that BSC
longevity may affect organizational performance, with ‘mature’ BSCs being more effective in
gaining better results (Bititci et al., 2015).
(11) Level of Top Management Support – Previous research in the field of performance
management (Bourne et al., 2002) reports that top management support is an indispensable
design factor able to influence the effectiveness of the BSC. Bourne et al. (2002) find that
such support is fundamental for the implementation and for the on-going usage of PMSs.
Ukko et al. (2007) show that top management commitment and leadership are key factors in
enhancing PMS effectiveness. Kennerley and Neely (2002) note that attaining top
management support is critical for PMS design and subsequent implementation and that the
amount of time managers dedicate to PMS measures is vital for the effectiveness of the
system (Tung et al., 2011). Melnyk et al. (2004) noted that “the BSC excels at its ability to
force top management to recognize that multiple activities must be carried out for corporate
success and the management and monitoring of these activities must be balanced” (p. 213).
If operations managers, for instance, desire to attain specific performance measures, then
tangible and intangible resources have to be committed to make this a reality, aspects of
organizational structure and reporting have to be altered, and information systems need to be
adjusted or implemented to source the relevant information (Chalmeta and Palomero, 2011).
Without top management involvement, this may be a futile exercise. Kim and Rhee (2012)
noted that the support from managers was key to implementing the BSC successfully in a
green supply chain context. More recently, Gutierrez et al. (2015) present empirical findings
of a longitudinal field study which shed new light on the dynamics of top management
commitment and demonstrate an important role played by top managers. Therefore, the
deployment of a BSC needs constant support, by design, from the top management to avoid
compromising organizational effectiveness (Liang, 2015).
(12) Level of Integration Complexity between the BSC and Information Systems –
Papalexandris et al. (2004) suggest that BSC is a control package that work together with
information systems to deliver certain outcomes. In the realm of a BSC, such integration may
be complex and demanding since BSC works together with other management systems that

15
may need to be integrated too (Nielsen and Nielsen, 2012). However, despite the complexity
that the integration of such a system may fashion, it is essential to consider that low levels of
BSC integration with the information systems have the potential to undermine the
effectiveness of the BSC itself (Cao et al., 2015). For example, Kim and Rhee (2012) reported
that in the causal relations between the critical success factors of green supply chain
management and the BSC performance, the integration of infrastructure has a positive direct
and indirect effect on financial performance.
Theoretical framework
Previous research suggests that the design of BSCs appears highly malleable compared
with the original conceptualization proposed by Kaplan and Norton (1992), ranging from a
less comprehensive to a more comprehensive design. We posit here that organizational
effectiveness improvements can be achieved by carefully designing the BSC and its
constituent attributes. Our detailed review of the literature revealed 12 salient attributes and
the extant literature implicitly suggests that the absence of one or some of the constituent
attributes (e.g., the presence of a strategy map or a good mix of financial and non-financial
indicators) may result in a deficient design, which may incite fatal flaws in the
implementation process and potentially curtail organizational effectiveness. Indeed, the PM
literature has found that PMSs have a positive impact on organizational effectiveness by
aligning employee capabilities, activities, and performance with the organizational strategic
goals. The BSC has been viewed as a vehicle to articulate the strategies of a company, to
communicate these strategies to employees, and to help align individual and organizational
initiatives for the realization of company goals. Figure 1 depicts our theoretical framework,
which highlights the 12 BSC design attributes. The inclusion/exclusion of them, together with
the extent to which they are deployed, will result in the BSC design which ranges from a less
to a more comprehensive model.
The link between BSC design and organizational effectiveness is also examined. This link
is imperative as over the years organizations have massively designed and implemented BSC
systems, but yet little empirical evidence exists regarding the relationship between the level of
comprehensiveness of PMSs and the organizational effectiveness it may engender (Maestrini
et al., 2018b). A more comprehensive design, for example, spurs communication across and
between internal and external constituents, links organizational actions with organizational
goals, and proffers frequent performance updates along with incentivizing employees to steer
proper resources and action. Such attributes empower adaptation to the evolving environment
while facilitating exploitation and mobilization of tangible and intangible resources.
To this end, understanding factors that may undermine the success of BSC design appears
to be instrumental in minimizing the risk of failure. The paper argues that BSCs should be

16
comprehensive and carefully designed to avoid pitfalls and unintended consequences such as
opportunistic behavior by employees who exploit misaligned incentive arrangements. There-
fore, the research question we aim to address is: does a more comprehensive BSC design
enhance organizational effectiveness?.
Figure 1. Theoretical Framework
To respond to our research question, we apportion subject firms into groups in such a way
that firms within each group display similar scores across the set of the 12 BSC design
attributes; in other words, they exhibit homogeneity. On the other hand, firms across groups
display dissimilarity in their scores. The implicit assumption is that higher scores reported on
these attributes reflect a more comprehensive BSC design, which in turn renders the
organization more capable in adapting its life to its intended strategy, in gaining a better
appreciation of strategic intent and attempting to make it a reality, and in mobilizing people
via better communication and motivation, culminating into building consensus.
Methodology
Sample
This study relies on responses obtained from 103 Italian companies that have implemented
a BSC. The extant empirical research has employed field studies that furnished valuable
information but only from a small set of firms (e.g., Malmi, 2001) and this raises
17
generalizability concerns. Instead, this inquiry deploys a survey-based approach, which aims
to complement the prior studies by collecting information from a broader cross-section of
organizations.
Based on the research purposes and objectives of the study, the survey population was
selected to ensure that it adequately covered the target population (Van der Stede et al., 2005).
This process was conducted in two stages. In the first stage, an in-depth and time-consuming
research was undertaken to identify which Italian companies may be deploying a BSC
approach. We read through several management books, specialized magazines, academic
journals, working papers, internet websites, conference proceedings, and relied on personal
knowledge from past research, while excluding relatively Small and Medium Enterprises
(SMEs). This decision was motivated by our long experience in this domain which suggests
that SMEs are less likely to be using complex management control systems, such as the BSC
approach. Next, telephone calls were made to verify whether these organizations were still
deploying the BSC and to further stimulate interest in the research project. Overall, 260
organizations that currently deploy BSCs were targeted. In the second stage, and in order to
increase the sample size, an additional 250 organizations were identified via personal contacts
and connections with the sponsoring university. After contacting each organization to ensure
they were users of the BSC, we added 124 organizations to our target list. Ultimately, a
sample of 384 organizations deploying at least some kind or level of the BSC approach was
compiled.
Subjects were invited via email to respond to the questionnaire survey. An introductory
letter clarifying the purposes and objectives of the research project preceded the
administration of the survey instrument. The primary goal of the study was to gather
information from organizations regarding the design aspects of their respective BSC and
subsequent organizational implications. Target respondents were promised an overall
benchmark report in order to elicit higher levels of commitment.
We assembled survey items based on a careful review of the literature and then pre-tested
the survey instrument to assess whether respondents could correctly understand the questions.
Feedback from subject matter experts aimed to improve the quality of the survey by
promoting clarity. A preliminary draft was also discussed with four academic scholars with
expertise in PMSs in order to assure that the content domain has adequate coverage (i.e.,
content validity) before pre-testing the instrument with a group of three operations managers
and three controllers in six organizations. The feedback we received helped us improve the
clarity, comprehensiveness, and relevance of the survey instrument measures; we discarded
and modified some measures. The operationalization of the variables appears in Table A1.
We targeted subjects at 384 firms, but after follow-up e-mails and multiple phone calls to
non-respondents, we obtained 111 questionnaires from primarily top and middle management.

18
Some returned questionnaires had missing data/incomplete responses and thus 8 surveys were
excluded from data analysis. A final sample of 103 surveys was utilized for data analytic
purposes. Respondents were CEOs and general managers (17%), financial managers (9%),
operations managers (49%), information system managers (7%), internal process and total
quality managers (15%), and other organizational members (3%). Participants are highly
educated and possess significant experience as reflected by the age and experience
distributions respectively (Table 2). The organizational profiles suggest that a large proportion
(44.66%) of firms is in the manufacturing industry as expected, and about 67% of the
organizations employ more than 500 employees (Table 3).
Table 2. Organizations’ Profile
Frequency Percent
Industry (INDUSTRY)
Mining and quarrying 5 4.85
Manufacturing 46 44.66
Water supply, sewerage, waste management and remediation activities 1 0.97
Construction 2 1.94
Wholesale and retail trade; repair of motor vehicles and motorcycles 3 2.91
Transport and storage 3 2.91
Information and communication 2 1.94
Financial and insurance activities 8 7.77
Public administration and defense; compulsory social security 23 22.33
Human health and social work activities 9 8.74
Other service activities 1 0.97
Total 103 100.00
Number of employees (SIZE)
Up to 250 21 20.39
251 – 500 13 12.62
501 – 1000 19 18.45
1001 – 5000 34 33.01
More than 5000 16 15.53
Total 103 100.00
Table 3. Respondents’ Personal Profile
Frequency Percent
Age (AGE)
Less than 30 years 8 7.77
31 – 40 40 38.83
41 – 50 39 37.86
51 – 60 16 15.53
Total 103 100.00
Experience (EXP)
1 year 8 7.77
2 – 4 years 43 41.75
5 – 7 years 29 28.16
8 – 9 years 7 6.80
More than 10 years 16 15.53
Total 103 100.00
Education

19
Degree in Economics 53 51.46
Degree in Engineering 10 9.71
Degree in Maths/Statistical Sciences 2 1.94
Other Degree 17 16.50
Graduate 21 20.39
Total 103 100.00
The state and level of BSC implementation are reported in Table 4. Regarding the former,
the majority of the organizations (70%) are currently using a BSC approach, others (21%) are
starting to introduce it with a pilot project, and a small proportion (9%) is considering
abandoning it. Kaplan and Norton (1996) argue that the BSC should be primarily applied at
the business unit level since it is usually at this level that competitive strategies become
salient; the responses suggest that 74% of the responding firms apply the BSC at the business
unit level. However, 15% of the surveyed organizations do deploy a corporate level scorecard
while few BSCs tend to be used at lower hierarchical levels, such as at the plant (9%) or
departmental (2%) levels.
Table 4. State and Level of BSC implementation
State of BSC implementationCurrently adopted
viapilot project
PresentlyDeployed
Considerabandoning it Total
Level of BSCimplementa-
tion
Corporate 4 11 1 16 (15%)Businessunit
16 53 7 76 (74%)
Plant 0 8 1 9 (9%)
Department 2 0 0 2 (2%)
Total22
(21%)72
(70%)9
(9%)103
(100%)
Given that the survey has a response rate of 29%, it is essential to assess non-response
bias. We deployed two separate procedures: the first procedure is based on time responses,
and we rely on the specific approach advocated by Armstrong and Overton (1977). A t-test
was conducted but failed to detect any significant differences in the mean scores of the 12
BSC design attributes between the early half of the respondents (52) and the late half (51).
Using the second procedure, we examined whether there were differences in the mean scores
of the 12 BSC design attributes in relation to industry and job position, finding however no
significant mean differences (at p-value < 0.05). Hence, it appears that non-response bias is
not a major concern in this sample.
Organizational Effectiveness
The organizational effectiveness of the BSC is resting on the seminal inquiries of Kaplan
and Norton (1996; 2001). More recently, the concept of organizational effectiveness has been
used by Upadhaya et al. (2014) in the context of PMSs. To investigate the level of

20
effectiveness associated with the adoption of the BSC, the survey asked respondents to rate
the extent to which their organizations had attained 13 different organizational benefits (see
Table 5) after implementing the BSC approach by using a Likert scale (1=completely
disagree, 7=completely agree). To examine the underlying structure of the data, Principal
Component Analysis (PCA) along with Varimax rotation was performed. Three meaningful
factors with eigenvalues greater than one were extracted explaining almost 65% of the
variance.
The first factor is labeled Aligning (ORG_Aligning, Cronbach’s alpha=.851) and reflects
how the organization adapts its life to its intended strategy. The following indicators are
related to this latent factor: (i) translating strategy into operational goals; (ii) aligning the
organization with the strategy; (iii) making strategy everyone’s daily job; (iv) improving
employees’ knowledge on how they are evaluated; and (v) making the linkages among short
and long-term objectives clearer.
The second factor is labeled Exploiting (ORG_Exploiting, Cronbach’s alpha=.754) as the
organization gains a better appreciation of strategic intent and attempts to make it a reality.
The following five indicators reflect the second latent factor: (i) spending more time and
effort on strategic related issues; (ii) adopting new performance measures; (iii) explicating
cause-and-effect relationships; (iv) increasing the participation of top management in the
formalization of the strategy; and (v) linking performance measures to corporate strategy.
The third factor includes three measures related to the consequences of the BSC as means
to Mobilize (ORG_Mobilizing, Cronbach’s alpha=.809) people via better communication and
motivation, culminating into building consensus. Specifically, the three measures are: (i)
improving internal communication among people; (ii) motivating human resources (in
comprehending their role within the organization); and (iii) building consensus around the
organization’s vision and strategy.
Table 5. Factor analysis of BSC Organizational Effectiveness
ORG_Aligning ORG_Exploiting ORG_Mobilizing
(1) Translating strategy into operational goals 0.847 0.218 0.100
(2) Aligning the organization with the strategy 0.814 0.144 0.264
(3) Making strategy everyone’s dayly job 0.641 0.271 0.300
(4) Improving employees’ knowledge on how they areevaluated
0.610 -0.142 0.502
(5) Making the linkages among short and long-termobjectives clearer
0.518 0.292 0.069
(6) Spending more time and effort on strategic relatedissues
0.157 0.784 0.189
(7) Adopting new performance measures 0.045 0.715 0.180
(8) Explicating cause-and-effect relationships 0.164 0.643 0.167
(9) Increasing the participation of top management inthe formalization of the strategy
0.560 0.613 -0.097

21
(10) Linking performance measures to corporatestrategy
0.354 0.582 0.261
(11) Improving internal communication among people 0.053 0.243 0.863
(12) Motivating human resources (in comprehendingtheir role within the organization)
0.359 0.255 0.728
(13) Building consensus around the organization’svision and strategy
0.287 0.387 0.620
Extraction sums of squared loadings 5.82 1.42 1.18
Variance explained (%) 44.78 10.90 9.06
Total variance explained (%) 44.78 55.68 64.74
Cronbach’s alpha 0.851 0.754 0.809
KMO Sampling adequacy 0.88
Approx. chi-square 612.39***
*** Significant at the 0.001 levelExtraction Method: Principal Component AnalysisRotation Method: Varimax with Kaiser Normalization. Rotation converged in 7 iterations.
Control variables
Firm Size (SIZE) – Firm size may influence the effectiveness of a BSC. As Hoque and
James (2000) note, BSC usage is positively associated with organization size. Larger
organizations have more tangible and intangible resources they can deploy towards
organizational effectiveness. In essence, large organizations may undertake a more
comprehensive approach to a BSC, and thus organizational effectiveness may be impacted to
a larger degree.
Respondent’s Age (AGE) – Age is highly correlated with the breadth and depth of life
experiences, and thus older respondents may view the impact of the 12 attributes on
organizational effectiveness differently than younger respondents.
Respondent’s experience (EXP) – Respondents with long experiences tend to view
relationships between variables more spherically; they gain a better understanding of cause-
and-effect issues due to multiple experiences over time. Thus, their responses may be
different than those of respondents that have limited experience.
Type of Industry (INDUSTRY) – Not-for-profit organizations may have different motives
as compared to for-profit organizations and are structured differently from for-profit
organizations; they may have to adjust the design of their BSCs as some dimensions are more
salient than others in their realm. More than 30 companies out of 103 in our sample are
associated with not-for-profit organizations (e.g., public administration and defense,
compulsory social security, human health and social work activities) and thus we created a
dummy variable representing for-profit versus not for profit organizations to account for
industry type.
Challenges Imposed by the BSC Design (CHALLENGES) – The more challenging/difficult
it is to integrate/manage the BSC, the more hurdles lie ahead to attain any potential benefits or
consequences afforded by the BSC usage. This variable was measured by asking respondents

22
to indicate on a 7-point scale (1=completely disagree, 7=completely agree) the extent to
which they agreed with the following four items: (1) managing and updating the information
system of the BSC is complex; (2) the integration of BSC in strategic planning and in
budgeting processes is a difficult task; (3) projecting BSC architecture and fitting it to
company environment is a difficult task; and (4) in terms of benefits/costs, BSC is
unprofitable.
Analysis and Results
Cluster Analysis
Given that the paper aims to propose a model regarding design attributes of a comprehensive
BSC, meant as a system ascribed with internal consistency among multiple structural BSC
attributes, cluster analysis was deployed to apportion organizations into respective
homogeneous groups. Hotho (2014) notes that cluster analysis is essential in determining tax-
onomies, configurations, or strategic groups, and following Brusco et al. (2017), hierarchical
and non-hierarchical cluster analyses were performed using standardized measures to prevent
different scale intervals from affecting the clustering procedures. A hierarchical procedure
(using Ward’s method for distance) was first used to establish the number of clusters and to
specify initial cluster seed points. Subsequently, a K-means cluster analysis was performed by
using the centroid values of the previous hierarchical analysis. This procedure combined the
advantages of the hierarchical method along those engendered by the non-hierarchical proce-
dure, with the latter being able to ‘fine-tune’ the results by allowing the switching of cluster
membership. Ultimately, analysis of variance (ANOVA) and Cohen’s d factor were deployed
to identify and measure differences between the clusters. Tables 6 and 7 report the main dif-
ferences between the clusters.
Table 6. BSC Design
Less ComprehensiveBSC design
(53)
More ComprehensiveBSC design
(50)
Distance betweengroups a
1. BSC_Development Less developed More developed Large
2. BSC_Strategy Map Rarely adopted Frequently adopted Large
3. BSC_Strategies Communication Top Management-oriented Employee Level-oriented Large
4. BSC_Internal Alignment Less alignment Greater alignment Large
5. BSC_Managerial Incentives Less linked to incentives More linked to incentives Large
6. BSC_Balanced Dimensions Less balanced More balanced Moderate
7. BSC_Number of PerformanceMeasures
Fewer measures (<20) More measures (>21) Large
8. BSC_Nature of Performance Measures More financial focused Less financial focused Small
9. BSC_Reports Updating Less frequently updated More frequently updated Small
10. BSC_Longevity Less adoption experience More adoption experience Large
11. BSC_Management Support Medium support Medium – High support Small
12. BSC_IT Integration Less integrated More integrated Moderatea Based upon Cohen’s d factors (Table 7). Cohen (1988) suggests interpreting the standardized difference between two means as small (d =0.2), moderate (d = 0.5), and large (d = 0.8).

23
Almost all 12 attributes display statistical and substantive differences across the two clus-
ters. The two clusters varied the most when considering the BSC_ Development and BSC_
Strategy Map attributes. On the other hand, the two clusters varied the least when considering
the BSC_Nature of Performance Measures and BSC_Reports Updating. Collectively, the re-
sults suggest that organizations can be classified into two main levels of comprehensiveness
regarding their BSC design, i.e., less comprehensive to more comprehensive design.
Table 7. Cluster analysis results – BSC Design
CLUSTERS ANOVA EFFECT SIZE
Less Comprehensive BSCDesign
MoreComprehensive BSC
DesignF
ratio Sig.Cohen’s
dEffectsize r
1. BSC_Development 1.47 2.68 78.89 0.00 1.76 0.66
2. BSC_Strategy Map 0.34 0.96 72.44 0.00 1.69 0.64
3. BSC_Strategies Communica-tion
1.74 2.42 24.09 0.00 0.96 0.43
4. BSC_Internal Alignment 4.53 5.60 32.72 0.00 1.12 0.49
5. BSC_Managerial Incentives 3.41 4.53 20.27 0.00 0.89 0.41
6. BSC_Balanced Dimensions 43.26 59.46 4.98 0.03 0.44 0.21
7. BSC_Number of PerformanceMeasures
3.96 5.80 23.60 0.00 0.96 0.43
8. BSC_Nature of PerformanceMeasures
3.50 3.34 0.24 0.63 0.10 0.05
9. BSC_Reports Updating 3.12 3.38 1.62 0.21 0.25 0.12
10. BSC_Longevity 2.68 4.14 16.72 0.00 0.80 0.37
11. BSC_Management Support 5.83 6.24 3.06 0.08 0.35 0.17
12. BSC_IT Integration 3.90 4.74 6.42 0.01 0.50 0.24
Number of Cases 53 50
Note: Cohen’s d effect size less than 0.3 is small, around 0.5 is medium and more than 0.8 is large. Cohen’s d is an index measuring the magni-tude of a treatment effect. Unlike significance tests, this index is independent of sample size. Cohen (1988) defines d as the difference betweenthe means divided by the pooled standard deviation.
Cluster 1: A less comprehensive BSC design
The design of the BSC in this cluster suggests a less comprehensive BSC design, as the
cluster scores would imply. For instance, the balanced dimensions cluster score is 43.26 while
for more comprehensive BSC it is 59.46 (Fdiff=4.98, p<.03). In terms of actual scores, the
score for the less comprehensive BSC cluster is 51.13 while the score for a more comprehen-
sive BSC cluster is 60.00 (see Table A2), where a score of 100 reflects a perfectly balanced
BSC. The strategy map for a less comprehensive BSC is less advanced than the strategy map
for a more comprehensive BSC (Fdiff=72.44, p<.000). This type of a BSC appears to be an
early stage managerial tool with a BSC_Development cluster score of 1.47 while for a more
comprehensive BSC the cluster score is 2.68 (Fdiff=78.89, p<.000).
Cluster 2: A more comprehensive BSC design
This cluster is described by firms that exhibit a more mature level of development
(Fdiff=78.89, p<.000) and of deployment of strategy maps (Fdiff=72.44, p<.000) and conse-
quently internal alignment between organizational objectives and BSC performance measures
(Fdiff=32.72, p<.000). As a strategy communication device, this design of BSC is more

24
oriented towards employees than top management (Fdiff=24.09, p<.000), and it reflects a
greater diversity in the use of performance measures, as suggested by a more balanced use of
BSC dimensions (Fdiff=4.98, p<.03) and via broader incentives (Fdiff=20.27, p<.000). This
more comprehensive BSC design also contains a broader number of performance measures
(Fdiff=23.60, p<.000), which are used in multiple ways to support management activities and
are well integrated into the organizational routines. Furthermore, this design is conceived with
greater longevity (Fdiff=16.72, p<.000) and can be described with a higher level of complexity
in integrating IT systems with the BSC (Fdiff=6.42, p<.01)
Regression Analysis
Tables 8 and 9 report the descriptive statistics and the correlation matrix of the variables
included in the regression analyses. The highest VIF across the three regression models (one
for each effectiveness variables) is 1.18, and the highest condition index is 15.359, suggesting
that the level of multicollinearity is fairly low.
Table 8. Descriptive Statistics
Mean Median Min MaxTheoretical
rangeSkew Kurt SD
Compositereliability
BSC_Designa 1.49 1.00 1 2 - 0.06 -2.04 0.50 -
ORG_Aligning 23.61 23.00 7 35 [7-35] -0.42 0.01 6.12 0.89
ORG_Exploiting 22.68 23.00 9 35 [7-35] -0.29 -0.48 5.83 0.84
ORG_Mobilizing 13.18 13.00 3 20 [3-21] -0.49 -0.17 3.99 0.88
SIZE 3.02 3.02 1.23 5.19 - 0.24 0.38 0.79 -
AGE 41.58 42.00 26 60 - 0.15 -0.81 8.32 -
EXP 5.88 5.00 1 30 - 2.47 7.52 5.22 -
INDUSTRYb 0.31 0.00 0 1 - 0.46 0.83 -1.34 -
CHALLENGES 14.49 14.00 4 25 [4-28] 0.02 -0.60 4.61 0.78a Dummy variable equal to 1 for a less comprehensive BSC design, it is equal to 2 for a more comprehensive BSC design.b Dummy variable coded as 0 for-profit industries and 1 for non-profit sectors.
Table 9. Correlation matrix
1 2 3 4 6 7 8 9 10
(1) BSC_Design 1
(2) ORG_Aligning 0.55** 1
(3) ORG_Exploiting 0.46** 0.58** 1
(4) ORG_Mobilizing 0.46** 0.62** 0.55** 1
(6) SIZE 0.10 0.02 0.02 0.15 1
(7) AGE 0.07 0.11 -0.04 0.03 0.03 1
(8) EXP -0.03 -0.00 -0.05 -0.18 -0.29** 0.38** 1
(9) INDUSTRY 0.18 0.07 0.16 0.08 -0.01 0.25** 0.03 1
(10) CHALLENGES -0.22* -0.24* -0.09 -0.05 0.06 -0.11 0.10 -0.11 1
* Significant at the 0.10 level; ** Significant at the 0.01 level; *** Significant at the 0.001 level (two-tailed).
We furnished empirical evidence earlier that suggests two different levels of
comprehensiveness in the design of the BSC; different levels of comprehensiveness may be
associated with different organizational effectiveness. Therefore, we investigate the
relationship between the level of comprehensiveness of BSC design and the three types of
organizational effectiveness we identified earlier via factor analysis:

25
BSC Organizational Effectiveness = β0 + β1 SIZE + β2 AGE + β3 EXP + β4 INDUSTRY +
+ β5 CHALLENGES + β6 BSC_Design + ε
Table 10 reports the results, which suggest that the level of comprehensiveness of the BSC
design has a positive association with all three types of organizational effectiveness. When the
ORG_Aligning variable is considered, the R2 (0.33) and R2Adj (0.28) values indicate that the
model can explain a sizable portion of the variance. After accounting for the control variables,
the level of comprehensiveness in BSC design explains a statistically significant (Δ F-
value=35.68) and substantive (Δ R2=0.25) portion of the variance.
The second dependent variable that was specified is ORG_Exploiting. The results were
similar to the former example. The R2 (0.23) and R2Adj (0.19) values indicate that the specified
model can explain a sizable portion of the variance for this variable. After accounting for the
control variables, the level of comprehensiveness in BSC design explains a statistically
significant (Δ F-value=23.90) and substantive (Δ R2=0.19) portion of the variance for
ORG_Exploiting.
Finally, the results for the third dimension (i.e., ORG_Mobilizing) resemble the earlier
findings for the other two dimensions. The R2 (0.24) and R2Adj (0.19) values indicate that the
specified model can explain a sizable portion of the variance for this variable as well. After
accounting for the control variables, the level of comprehensiveness in BSC design explains a
statistically significant (Δ F-value=24.14) and substantive (Δ R2=0.19) portion of the variance
for ORG_Mobilizing.
Table 10. Regression results
BSC Organizational Effectiveness
ORG_Aligning ORG_Exploiting ORG_Mobilizing
β coefficient t-value β coefficient t-value β coefficient t-value
Intercept 14.93 4.94*** 17.04 5.55*** 7.22 3.45**
Control variables
SIZE −0.03 −0.40 −0.02 −0.21 0.09 0.98
AGE 0.05 0.51 −0.10 -1.03 -0.00 -0.05
EXP −0.06 −0.63 −0.03 -0.34 −0.09 −0.97
INDUSTRY −0.04 −0.46 0.10 1.04 0.01 0.10
CHALLENGES −0.12 −1.44 0.01 0.15 0.05 0.52
Main Effects VariableBSC_Design 0.53 5.97*** 0.46 4.89*** 0.46 4.91***
Overall model fit
R2 0.33 0.23 0.24
Adj.R2 0.28 0.19 0.19
Δ F-value 35.68 *** 23.90 *** 24.14 ***
Δ R2 0.25 0.19 0.19
* Significant at the 0.10 level; ** Significant at the 0.01 level; *** Significant at the 0.001 level (two-tailed).

26
Overall, the results suggest that a more comprehensive PMS (with BSC serving as an
exemplar) leads to higher levels of organizational effectiveness. Specifically, the analysis
supports the idea that the level of comprehensiveness of the BSC explains how organizations
align and translate the corporate vision and strategy to everyone in the organization
(ORG_Aligning, β=0.53, p<0.001), attain better appreciation of strategic intent and attempt to
bring it to fruition (ORG_Exploiting, β=0.46, p<0.001), and communicate and motivate
people, culminating in building consensus (ORG_Mobilizing, β=0.46, p<0.001).
Discussion and Conclusions
This study has examined the relationship between the level of comprehensiveness of the
BSC design and the respective organizational effectiveness it may engender. Findings suggest
that the organizations implementing less comprehensive BSC designs are less likely to report
a positive impact on their organizational effectiveness. On the contrary, the organizations
implementing BSC systems with a more comprehensive design, report positive organizational
effectiveness to a greater extent in terms of aligning and translating the corporate strategy into
the organization (β=0.53, p<0.001), exploiting cause-and-effect relationships (β=0.46,
p<0.001), and mobilizing people (β=0.46, p<0.001).
Furthermore, cluster analysis (Tables 6 and 7) suggests that three design attributes do not
differentiate between less and more comprehensive BSC designs. These include BSC_Nature
of Performance Measures (F=.24, p>0.05), BSC_Reports Updating (F=1.62, p>0.05), and
BSC_Management Support (F=3.06, p>0.05). In essence, the extent to which financial per-
formance measures are more important than non-financial performance measures, the fre-
quency of updating reports, and whether there is direct top management support did not mate-
rially differentiate between the two clusters. More comprehensive designs instead are de-
scribed by a more mature level of development, a more intense deployment of strategy maps,
internal alignment between strategic objectives and BSC performance measures, and the de-
sign of BSC is more oriented towards employees than just top management. It also reflects
greater diversity in the use of performance measures, as suggested by a more balanced use of
BSC dimensions and via broader incentives, and it contains a broader number of performance
measures which are used in multiple ways to support management activities and are well
integrated into the organizational routines. Finally, it is conceived with greater longevity, and
it can be described with a higher level of complexity in integrating IT systems with the BSC.
The failure to design and implement a more comprehensive BSC can be consequential. A
less comprehensive BSC, for instance, may undermine strategic performance for those
organizations that are not clearly visualizing the links between the BSC perspectives through

27
cause-and-effect diagrams (i.e., the strategy maps). A less comprehensive BSC design may
also compromise the choice of adequate measures to promote understanding and learning of
the employees who are intended to be the most valuable resources in modern organizations.
As a matter of fact, implementing less comprehensive systems means adopting less balanced
measures selected primarily for financial purposes.
This inquiry supports claims that no single or uniform BSC design exists, as the descrip-
tive statistics manifest significant variation (Table A2). Findings suggest that the notion of
BSC remains open to various interpretations and applications and that many organizations
which claim to use a comprehensive BSC design are instead adopting only a limited or in-
complete design version of it. However, this choice is not costless as the organizational effec-
tiveness of the BSC depends on the level of its comprehensiveness. The implementation of a
comprehensive PMS is a complex task that requires continual efforts and adjustments. Fur-
thermore, a comprehensive BSC design may have, in the long run, the potential to enhance
the overall organizational strategic performance when considering the economic and the
commercial aspects. Improved cost efficiency (Chenhall, 2005), enhanced shareholder returns
(Crabtree and DeBusk, 2008), and intensified market orientation (Braam and Nijssen, 2004)
can be cited as notable examples in this regard.
The paper extends previous PM literature on performance management in two ways. First,
it introduces a theoretical model (Figure 1) for a comprehensive BSC design by identifying 12
design attributes and testing and validating them using a cluster analysis methodology with
the objective of forming homogeneous groups which are as distinct across one another as
possible. That furnished a methodology for developing taxonomies with managerial
relevance. Second, the analyses allow us to respond to our research question whether a more
comprehensive BSC design enhances organizational effectiveness. The results suggest that
adopting a comprehensive BSC model will culminate in an improved capability of aligning
and translating the corporate strategy throughout the organization, of exploiting cause-and-
effect relationships, and of mobilizing people and organizational action.
The findings here have numerous implications for the theory and practice of operations
management. The deployment of a BSC offers an opportunity for operations management to
have its voice heard and issues that materially affect organizational performance be
addressed. The operations management leadership needs to participate in the deliberations
regarding the level of BSC that is to be pursued and whether this is an endeavor for the long
term. Would it be implemented more at the rudimentary level or a more holistic level? A
more holistic level demands more work because it makes strategy everyone’s never-ending
job. The desired longevity will also have significant implications regarding the resources
needed to implement the respective BSC level. The leadership will also need to be concerned
with identifying fitting performance measures for operations management that are aligned
28
with organizational objectives. These performance measures need to be salient but yet
practical and not awfully taxiing on the time of employees who contribute towards PM and
not cumbersome for the IT systems that are tasked with PM. Holding people accountable for
performance measures for which they do not have control and taxiing individuals with the
burdensome task of collecting excessive amounts of performance data, which may never be
used, will not bode well with employees, damping their motivation and excitement with the
implementation and use of a BSC. For example, monitoring quality via quality control charts
only to file those charts without materially using them would be wasteful and would
demotivate people on the front lines. Along those lines, the leadership in operations
management needs to consider the types of incentives that are to be offered to operations
managers in order to steer organizational action towards the intended strategic goals. These
incentives have to be well thought-out in order to avoid gaming by the managers who may act
opportunistically. The leadership may consider incentives which are more rounded and rely
on both team and individual performance as well as rely on financial and non-financial
performance metrics. It is imperative that the operations leadership works with its
counterparts in other parts of the organization in order to assure that strategic goals are
pursued in harmony; operational performance should not counter sales performance, for
instance. The performance measures that are deployed along with the specific incentives that
are offered communicate necessarily what matters to the leadership and the organization at
large. Is there a balance across the BSC dimensions when one examines the performance
measures and the incentives related to operations management? The operations leadership
needs to also use the strategy map to demonstrate the cause and effect relations between
operational aspects and customer processes. For example, if the organization desires to
increase market share, a reduction in throughput time, lead time, or the percent of defective
units can improve productivity, cost, and quality with subsequent cascading positive effects
on customer satisfaction, word-of-mouth, loyalty and ultimately market share. Articulating
these links to upper management and shop-floor employees alike demonstrates the importance
of operations management and helps in issue selling (Dutton et al., 2001) when resources
need to be mobilized towards improving operations.
This suggests however that the operations leadership will need to work with respective
employees to articulate specific performance measures which will be embedded within the
BSC. What would the assortment look like in terms of type and number? Would it be a blend
of financial (such as ROA, or inventory turns) and non-financial (such as responsiveness)
measures? How many of each? For example, delivery performance can be measured via
numerous metrics (Beamon, 1999, p. 283): “(1) Product lateness. Delivery date minus due
date, (2) Average lateness of orders. Aggregate lateness divided by the number of orders, (3)
Average earliness of orders. Aggregate earliness divided by the number of orders, and (4)

29
Percent on- time deliveries. Percent of orders delivered on or before the due date”. Should the
operations leadership come up with a single or aggregate measure of delivery performance for
the purposes of a BSC? This is an empirical question and future research can address such
issues.
Finally, it seems appropriate to recognize that this study presents some limitations. Firstly,
given the response rate is below 50%, the survey per se should be viewed with some caution
(Van der Stede et al., 2005). This research represents a first step investigating the relationship
between BSC design and organizational effectiveness. Therefore, further research is needed to
understand and explain this relationship in more depth. Moreover, the research design is
based on a cross-sectional study where data is collected at one point in time. A longitudinal
perspective would be useful to identify causal mechanisms (lag effects) and to examine
consequences of a more comprehensive BSC design over a more extended period. Secondly,
the views of managers affected by BSC benefits may be susceptible to bias. Cook and
Campbell (1979) have pointed out that people tend to report what they believe the researcher
expects to see, or report what reflects positively on their abilities, knowledge, beliefs, and
opinions. Respondents personally involved in the BSC project may have a positive attitude
towards BSC. They are often the champions of the BSC adoption. Thus, it may be
problematic to obtain critical comments from these managers. They are more likely to exhibit
an ownership bias, especially if they are the primary BSC sponsors. In addition, management
and the employees may see PM from different perspectives, which should be considered when
designing, implementing and using a PMS (Ukko et al., 2007). Thirdly, we acknowledge that
the methodology of self-reported data often casts doubt especially when managers rate
organizational effectiveness or performance. This may provoke biases and measurement
errors due to common method bias. However, we tried to overcome issues of common source
bias by following the advice of Huber and Power (1985) to focus on people who possess the
direct knowledge and hold respective organizational positions. The vast majority of the
respondents to the survey was represented by upper or middle managers who were likely to
have a solid overview of PMS because of their involvement in performance reviews and
planning processes. Moreover, we have tried to address the potential problem of common
method variance attributed to the single-respondent approach both ex-ante in the design of the
survey instrument by protecting the respondent’s anonymity and ex-post by examining the
correlation matrix (Table 9). Barring the correlation between our dependent variables, which
are expected to be high, the highest correlation is 0.55, which is below the recommended
threshold of the suggested 0.80 value (Bagozzi et al., 1991). Moreover, Harman’s one-factor
test was conducted on the full survey data to address common method variance bias concerns.
Using principal component analysis as the extraction method, all latent factor measures we
forced to load under one constrained factor. The single factor that emerged explained

30
significantly less than 50 percent of the variance (34.75%). Thus, common method bias does
not threaten the validity of the findings.
Future research should provide answers to some interesting research questions related to
the strategic consequences generated by a more (or less) comprehensive BSC, an aspect
which remains somewhat controversial. As noted by Malmi (2001), the performance conse-
quences of BSC are expected to vary depending on how the BSC is designed and
implemented. This implies that it may be interesting to investigate further how the design at-
tributes are employed during the implementation and development levels of the BSC, which
would add a new insight in the investigation of the performance consequences of more (or
less) comprehensive BSC design.
References
Ahn, H. (2001), “Applying the balanced scorecard concept: an experience report”, LongRange Planning, Vol. 34 No. 4, pp. 441-461.
Armstrong, J.S. and Overton, T.S. (1977), “Estimating non-response bias in mail surveys”,Journal of Marketing Research, Vol. 14 No. 3, pp. 396-402.
Bagozzi, R.P., Yi, Y. and Phillips, L.W. (1991), “Assessing construct validity inorganizational research”, Administrative Science Quarterly, Vol. 36 No. 3, pp. 421-458.
Beamon, B.M. (1999), “Measuring supply chain performance,” International Journal ofOperations & Production Management, Vol. 19 No. 3, pp. 275-292.
Bentes, A.V., Carneiro, J., da Silva, J.F. and Kimura, H. (2012), “Multidimensionalassessment of organizational performance: Integrating BSC and AHP”, Journal ofBusiness Research, Vol. 65 No. 12, pp. 1790-1799.
Bititci, U.S., Mendibil, K., Nudurupati, S., Garengo, P. and Turner, T. (2006), “Dynamics ofperformance measurement and organisational culture”, International Journal ofOperations & Production Management, Vol. 26 No. 12, pp. 1325-50.
Bititci, U.S., Garengo, P., Ates, A. and Nudurupati, S. (2015), “Value of maturity models inperformance measurement”, International Journal of Production Research, Vol. 53 No.10, pp. 3062-3085.
Bourne, M., Mills, J., Wilcox, M. and Neely, A. (2000), “Designing, implementing andupdating performance measurement systems”, International Journal of Operations &Production Management, Vol. 20 No. 7, pp. 754-771.
Bourne, M., Neely, A., Platts, K. and Mills, J. (2002), “The success and failure ofperformance measurement initiatives”, International Journal of Operations & ProductionManagement, Vol. 22 No. 11, pp. 1288-310.
Braam, G.J. and Nijssen, E.J. (2004), “Performance Effects of Using the BalancedScorecard: a Note on the Dutch Experience”, Long Range Planning, Vol. 37 No. 49, pp.335-349.
Bryant, L., Jones, D.A., and Widener, S.K. (2004), “Managing value creation within thefirm: An examination of multiple performance measures”, Journal of ManagementAccounting Research, Vol. 16 No. 1, pp. 107-131.
Brusco, M.J., Singh, R., Cradit, J.D. and Steinley, D. (2017), “Cluster analysis in empiricalOM research: survey and recommendations”, International Journal of Operations &Production Management, Vol. 37 No. 3, pp. 300-320.
Cao, Y., Zhao, K., Yang, J. and Xiong, W. (2015), “Constructing the integrated strategicperformance indicator system for manufacturing companies”, International Journal of

31
Production Research, Vol. 53 No. 13, pp. 4102-4116.Chalmeta, R. and Palomero, S. (2011), “Methodological proposal for business sustainability
management by means of the Balanced Scorecard”, Journal of the Operational ResearchSociety, Vol. 62 No. 7, pp. 1344-1356.
Chenhall, R.H. (2005), “Integrative Strategic Performance Measurement Systems, StrategicAlignment of Manufacturing, Learning and Strategic Outcomes: an Exploratory Study”,Accounting Organizations and Society, Vol. 30 No. 5, pp. 395-422.
Cohen, J. (1988), Statistical power analysis for the behavioral sciences, 2nd Edition.Cook, T.D. and Campbell, D.T. (1979), Quasi-experimentation: Design and analysis issues,
Houghton Mifflin Company, Boston.Crabtree, A.D. and DeBusk, G.K. (2008), “The effects of adopting the balanced scorecard on
shareholder returns”, Advances in Accounting, Vol. 24 No. 1, pp. 8-15.Davis, S. and Albright, T. (2004), “An investigation of the effect of balanced scorecard
implementation on financial performance”, Management Accounting Research, Vol. 15No. 2, pp. 135-153.
Decoene, V. and Bruggeman, W. (2006), “Strategic alignment and middle-level managers’motivation in a balanced scorecard setting”, International Journal of Operations &Production Management, Vol. 26 No. 3/4, pp. 429-448.
De Geuser, F., Mooraj, S. and Oyon, D. (2009), “Does the Balanced Scorecard Add Value?Empirical Evidence on Its Effect on Performance”, European Accounting Review, Vol. 18No. 1, pp. 93-122.
de Leeuw, S. and van den Berg, J.P. (2011), “Improving Operational Performance byInfluencing Shopfloor Behavior via Performance Management Practices”, Journal ofOperations Management, Vol. 29 No. 3, pp. 224-235.
de Waal, A., Kourtit, K. and Nijkamp, P. (2009), “The relationship between the level ofcompleteness of a strategic performance management system and perceived advantagesand disadvantages”, International Journal of Operations & Production Management,Vol. 29 No. 12, pp. 1242-1265.
Dutton, J.E., Ashford, S.J., O’Neill, R.M. and Lawrence, K.A. (2001), “Moves that matter:Issue selling and organizational change”, Academy of Management Journal, Vol. 44 No.4, pp. 716-736.
Epstein, M.J. and Manzoni, J.F. (1998), “Implementing Corporate Strategy: From TableauxDe Bord To Balanced Scorecards”, European Management Journal, Vol. 16 No. 2, pp.190-213.
Franco-Santos, M., Lucianetti, L. and Bourne, M. (2012), “Contemporary performancemeasurement systems: a review of their consequences and a framework for research”,Management Accounting Research, Vol. 23 No. 2, pp. 79-119.
Gutierrez, D.M., Scavarda, L.F., Fiorencio, L. and Martins, R.A. (2015), “Evolution of theperformance measurement system in the Logistics Department of a broadcastingcompany: An action research”, International Journal of Production Economics, Vol. 160,pp. 1-12.
Hall, M. (2008), “The effect of comprehensive performance measurement systems on roleclarity, psychological empowerment and managerial performance”, Accounting Organiza-tions and Society, Vol. 33 No. 2/3, pp. 141-163.
Henri, J.F. (2010), “The Periodic Review of Performance Indicators: An EmpiricalInvestigation of the Dynamism of Performance Measurement Systems”, EuropeanAccounting Review, Vol. 19 No. 1, pp. 73-96.
Hoque, Z. and James, W. (2000), “Linking balanced scorecard measures to size and marketfactors: impact on organizational performance”, Journal of Management AccountingResearch, Vol. 12, pp. 1-17.
Hotho, J.J. (2014), “From typology to taxonomy: A configurational analysis of nationalbusiness systems and their explanatory power”, Organization Studies, Vol. 35 No. 5, pp.671-702.
32
Hu, B., Leopold-Wildburger, U. and Strohhecker, J. (2017), “Strategy map concepts in abalanced scorecard cockpit improve performance”, European Journal of OperationalResearch, Vol. 258 No. 2, pp. 664-676.
Huber, G. and Power, D.J. (1985), “Retrospective Reports of Strategic-Level Managers:Guidelines for Increasing Their Accuracy”, Strategic Management Journal, Vol. 6 No. 2,pp. 171-180.
Ittner, C.D., Larcker, D.F. and Meyer, M.W. (2003a), “Subjectivity and the weighting ofperformance measures: evidence from a balanced scorecard”, The Accounting Review,Vol. 78 No. 3, pp. 725-758.
Ittner, C.D., Larcker, D.F. and Randall, R. (2003b), “Performance Implications of StrategicPerformance Measurement in Financial Services Firms”, Accounting, Organizations andSociety, Vol. 28 No. 7/8, pp. 715-741.
Jääskeläinen, A., Laihonen, H. and Lönnqvist, A. (2014), “Distinctive features of serviceperformance measurement”, International Journal of Operations & ProductionManagement, Vol. 34 No. 12, pp.1466-1486.
Jensen, M. (2001), “Value maximizations, shareholder theory, and the corporate objectivefunction”, European Financial Management, Vol. 7 No. 3, pp. 297-317.
Johanson, U., Skoog, M., Backlund, A. and Almqvist, R. (2006), “Balancing Dilemmas ofthe Balanced Scorecard”, Accounting, Auditing and Accountability Journal, Vol. 19 No.6, pp. 842-857.
Kaplan, R.S. and Norton, D.P. (2006), “How to implement a new strategy without disruptingyour organization”, Harvard Business Review, Vol. 84, pp. 100-109.
Kaplan, R.S. and Norton, D.P. (2001), The Strategy-Focused Organization – How BalancedScorecard Companies Thrive in the New Business Environment, Harvard Business SchoolPress, Boston, MA.
Kaplan, R.S. and Norton, D.P. (1996), The Balanced Scorecard – Translating Strategy intoAction, Harvard Business School Press, Boston, MA.
Kaplan, R.S. and Norton, D.P. (1992), “The balanced scorecard – measures that driveperformance”, Harvard Business Review, Vol. 70 No. 1, pp. 71-79.
Kennerley, M. and Neely, A. (2002), “A framework of the factors affecting the evolution ofperformance measurement systems”, International Journal of Operations & ProductionManagement, Vol. 22 No. 11, pp. 1222-1245.
Kim, J. and Rhee, J. (2012), “An empirical study on the impact of critical success factors onthe balanced scorecard performance in Korean green supply chain managemententerprises”, International Journal of Production Research, Vol. 50 No. 9, pp. 2465-2483.
Kolehmainen, K. (2010), “Dynamic strategic performance measurement systems: balancingempowerment and alignment”, Long Range Planning, Vol. 43 No. 4, pp. 527-554.
Koufteros, X.A., Verghese, A.J. and Lucianetti, L. (2014), “The Effect of PerformanceMeasurement Systems on Firm Performance: A Cross-Sectional And A LongitudinalStudy”, Journal of Operations Management, Vol. 32 No. 6, pp 313-336.
Laihonen, H. and Pekkola, S. (2016), “Impacts of using a performance measurement systemin supply chain management: a case study”, International Journal of ProductionResearch, Vol. 54 No. 18, pp. 5607-5617.
Leung, L.C., Lam, K.C. and Cao, D. (2006), “Implementing the balanced scorecard using theanalytic hierarchy process & the analytic network process”, Journal of the OperationalResearch Society, Vol. 57 No. 6, pp. 682-691.
Liang, Y.H. (2015), “Performance measurement of interorganizational information systemsin the supply chain”, International Journal of Production Research, Vol. 53 No. 18, pp.5484-5499.
Libby, T., Salterio, S. and Webb, A. (2004), “The balanced scorecard: the effects ofassurance and process accountability on managerial judgment”, The Accounting Review,Vol. 79 No. 4, pp. 1075-1094.

33
Llach, J., Bagur, L., Perramon, J. and Marimon, F. (2017), “Creating value through thebalanced scorecard: how does it work?”, Management Decision, Vol. 55 No. 10, pp.2181-2199.
López-Ospina, H., Quezada, L.E., Barros-Castro, R.A., Gonzalez, M.A. and Palominos, P.I.(2017), “A method for designing strategy maps using DEMATEL and linearprogramming”, Management Decision, Vol. 55 No. 8, pp. 1802-1823.
Maestrini, V., Luzzini, D., Caniato, F., Maccarrone, P. and Ronchi, S. (2018a), “The impactof supplier performance measurement systems on supplier performance: A dyadic lifecy-cle perspective”, International Journal of Operations & Production Management,https://doi.org/10.1108/IJOPM-10-2016-0589.
Maestrini, V., Martinez, V., Neely, A., Luzzini, D., Caniato, F. and Maccarrone, P. (2018b),“The relationship regulator: a buyer-supplier collaborative performance measurement sys-tem”, International Journal of Operations & Production Management,https://doi.org/10.1108/IJOPM-10-2016-0595.
Malmi, T. (2001), “Balanced scorecards in Finnish companies: a research note”,Management Accounting Research, Vol. 12 No. 2, pp. 207-220.
Melnyk, S.A., Stewart, D.M. and Swink, M. (2004), “Metrics and performance measurementin operations management: dealing with the metrics maze”, Journal of OperationsManagement, Vol. 22 No. 3, pp. 209-218.
Micheli, P. and Mura, M. (2017), “Executing strategy through comprehensive performancemeasurement systems”, International Journal of Operations & Production Management,Vol. 37 No. 4, pp. 423-443.
Neely, A., Gregory M. and Platts, K. (1995), “Performance measurement system design. Aliterature review and research agenda”, International Journal of Operations & ProductionManagement, Vol. 15 No. 4, pp. 80-116.
Nielsen, S. and Nielsen, E.H. (2012), “Discussing feedback system thinking in relation toscenario evaluation in a balanced scorecard setup”, Production Planning & Control, Vol.23 No. 6, pp. 436-451.
Pekkola, S. and Ukko, J. (2016), “Designing a performance measurement system forcollaborative network”, International Journal of Operations & Production Management,Vol. 36 No. 11, pp.1410-1434.
Pellinen, J., Teittinen, H. and Järvenpää, M. (2016), “Performance measurement system inthe situation of simultaneous vertical and horizontal integration”, International Journal ofOperations & Production Management, Vol. 36 No. 10, pp.1182-1200.
Papalexandris, A., Ioannou, G. and Prastacos, G.P. (2004), “Implementing the balancedscorecard in Greece: a software firm’s experience”, Long Range Planning, Vol. 37 No. 4,pp. 347-62.
Rajesh, R., Pugazhendhi, S., Ganesh, K., Ducq, Y. and Koh, S.L. (2012), “Generic balancedscorecard framework for third party logistics service provider”, International Journal ofProduction Economics, Vol. 140 No. 1, pp. 269-282.
Smith, M. and Bititci, U.S. (2017), “Interplay between performance measurement andmanagement, employee engagement and performance”, International Journal ofOperations & Production Management, Vol. 37 No. 9, pp. 1207-1228.
Speckbacher, G., Bischof, J. and Pfeiffer, T. (2003), “A descriptive analysis of theimplementation of balanced scorecard in German-speaking countries”, ManagementAccounting Research, Vol. 14 No. 4, pp. 361-387.
Tung, A., Baird, K. and Schoch, H.P. (2011), “Factors influencing the effectiveness ofperformance measurement systems”, International Journal of Operations & ProductionManagement, Vol. 31 No. 12, pp. 1287-1310.
Ukko, J., Tenhunen, J. and Rantanen, H. (2007), “Performance Measurement Impacts onManagement and Leadership: Perspectives of Management and Employees”,International Journal of Production Economics, Vol. 110 No. 1/2, pp. 39-51.
Upadhaya, B., Munir, R. and Blount, Y. (2014), “Association between performancemeasurement systems and organisational effectiveness”, International Journal ofOperations & Production Management, Vol. 34 No. 7, pp. 853-875.

34
Van der Stede, W.A., Young, S.M. and Chen, C.X. (2005), “Assessing the quality ofevidence in empirical management accounting research: The case of survey studies”,Accounting, organizations and society, Vol. 30 No. 7/8, pp. 655-684.
Van der Stede, W.A., Chow, C.W. and Lin, T.W. (2006), “Strategy, choice of performancemeasures, and performance”, Behavioral Research in Accounting, Vol. 18 No. 1, pp. 185-205.
Wiersma, E. (2009), “For which purposes do managers use balanced scorecards? Anempirical study”, Management Accounting Research, Vol. 20 No. 4, pp. 239-251.
Appendix A – Cluster Analysis
Table A1. Operationalization of Measures Comprehensive BSC Design Attributes
Level of BSC development (BSC_Development)
Managers were asked to choose only one among three different statements related to theBSC development Speckbaker et al. (2003). A Level III BSC denotes a morecomprehensive BSC design as it is the most inclusive.Level I BSC: a specific multidimensional framework for strategic performancemeasurement that combines financial and non-financial strategic measures.Level II BSC: builds on Level I BSC but additionally describes strategy by using cause-and-effect relationships.Level III BSC: a Level II BSC that also implements the strategy by defining objectives,action plans, results and connecting incentives with BSC.
Embedding a Strategy Map (BSC_Strategy Map)
Respondents had to report whether their respective company or business unit wasemploying a strategy map in association with the BSC framework. The strategy mapdescribes, in a visual form, the one-way chains of cause-and-effect by linking the learningand growth perspectives (employee actions) to the financial perspective (outcomes forshareholders) via the internal efficiency and the customer dimensions. Adopting a strategymap implies a more comprehensive BSC design.
Level of Communication of Corporate Strategies(BSC_Strategies Communication)
The survey asked respondents to indicate the level at which the BSC aimed tocommunicate the strategy: (1) top management, (2) middle management, and (3)employee level. A high score on this variable suggests a use of BSC to communicatecorporate strategies to even the lowest level employees in an organization and thusrepresents a more comprehensive design.
Level of Alignment between Organizational Ob-jectives and BSC Performance Measures(BSC_Internal Alignment)
A survey item asked participants to specify the degree of internal alignment between thestrategic objectives of the company and the performance measures included in the BSCusing a scale from 1 (low) to 7 (high) where a higher score reflects a higher level ofalignment and thus connotes a more comprehensive BSC design.
Relationship between Performance Measures andManagerial Incentives embedded in the BSC(BSC_Managerial Incentives)
Participants were asked to indicate, using a scale from 1 (completely disagree) to 7(completely agree), the level of agreement/disagreement on five statements: (1) in theBSC, the incentive schemes rely on team performance; (2) in the BSC, the incentiveschemes rely on non-financial performance measures; (3) in the organization, theincentive schemes rely on the BSC system; (4) in the BSC, the incentive schemes rely onfinancial performance measures; and (5) in the BSC, the incentive schemes rely onindividual performance. Collectively, higher scores imply a more comprehensive BSCdesign where a multitude of incentives are deployed instead of relying merely on a fewselect performance measures (typically, financial)

35
Level of Balance of BSC Dimensions(BSC_Balanced Dimensions)
Respondents were asked to distribute 100 points between the dimensions of the BSC (i.e.,learning and growth, internal processes, customers, and financial). To examine whetherindustry-specific factors may be salient, the survey provided respondents with theopportunity to specify two additional components beyond the classical four. The weighteddimensions were then rolled into a single index while considering a basic premise of thebalancing approach that advocates that good performance in all areas is desired. Tooperationalize the concept of Balanced Dimensions (BSC_BMS), the formula developedby Braam and Nijssen (2004) was used:
BSC_BMS = 100 – ∑i=1n (Weighti – 100/n);
Where:n is equal to the number of components used in the BSC by an organization and Weighti isequal to the weight of the i-dimension. However, for those organizations using up to sixdimensions, the BSC_BMS formula is weighted by multiplying the result with the follow-ing factor: (6 – n) × (100/n). A high score (e.g., 100) reflects a situation where all fouraspects are equally taken into account suggesting comprehensive measurement, whereas alow score (e.g., 0) indicates an extremely unbalanced use with 100 percent focus on asingle dimension.1
Number of Performance Measures Used with theBSC (BSC_Number of Performance Measures)
Respondents reported the total number of performance measures used within the realm ofBSC. A higher number reflects a more comprehensive treatment as the organization ismore inclusive in its attempt to display a more holistic picture regarding performance.
Nature of Performance Measures Used with theBSC (BSC_Nature of Performance Measures)
The respondents indicated (on a 7-point scale, 1=completely disagree, 7=completelyagree) the extent to which financial performance measures are more important than non-financial performance measures. A high value of this variable indicates a focus onfinancial performance measures and thus a less comprehensive BSC design.
Frequency of Updating BSC Reports(BSC_Reports Updating)
Two measures were deployed and were rated based on a 7-point scale (1=every year;2=every six months; 3=every three months; 4=every month; 5=every fifteen days;6=every week; 7=every day): (1) the extent to which the BSC was periodically updated byBSC managers, (2) the extent to which BSC managers regularly discussed the BSC. Bothitems Higher scores imply a more intense and frequent updating process, reflecting a morecomprehensive BSC design.
BSC Longevity (BSC_Longevity)
Respondents indicated on a 7-point scale the length of time the BSC was implemented intheir respective organization (1=one year; 2=two years; 3=three years; 4= four years;5=five years; 6=six years; 7=more than six years). A high value on this variable denotesmore years of BSC implementation and a more mature and comprehensive design.
Level of Top Management Support(BSC_Management Support)
The level of top management support was measured by asking managers to indicatewhether they considered that top management support was crucial for the BSCeffectiveness in their organization, using a scale from 1 (completely disagree that topmanagement was crucial) to 7 (completely agree that top management was crucial). Topmanagement involvement is crucial when the design is more comprehensive and complex,necessitating that the top management uses its organizational clout to effectuateorganizational changes and channel requisite tangible and intangible resources.
Level of Integration Complexity between the BSCand Information Systems (BSC_IT Integration)
The respondents indicated (on a 7-point scale) the extent to which the integration betweenthe BSC and information systems was complex (1=completely disagree that theintegration between BSC and information systems was complex; 7=completely agree thatthe integration between BSC and information systems was complex). A morecomprehensive design implies that more connections need to be drawn, creating a morechallenging environment to link the BSC and information systems.
Table A2. Descriptive statistics - BSC attributes
Mean Median Min MaxTheoretical
rangeSD
1. BSC_Development 2.06 2.00 1 3 [1-3] 0.922. BSC_Strategy Mapa
0.64 1.00 0 1 [0-1] 0.48
3. BSC_Strategies Communication 2.07 2.00 1 3 [1-3] 0.78
4. BSC_Internal Alignment 5.05 5.00 2 7 [1-7] 1.09
5. BSC_Managerial Incentives 3.95 4.00 1 7 [1-7] 1.38
6. BSC_Balanced Dimensions 51.13 60.00 0 100 [0-100] 37.52
1 The maximum score of BSC_BMS variable reflects a situation where all BSC dimensions (n) are equally takeninto accounting (score = 100), all having the same weight. That suggests a perfectly balanced measurement system(e.g., n=4, weight = 25% → score = 100). Instead the lowest score denotes an extremely unbalanced use with 100 percent focus on a single dimension (e.g., n = 1, weight 100% → score = 0). A medium value is 50 (e.g., n = 4, weight1 = 50%, weight2 = 20%, weight3 = 10%, weight4 = 20%).

36
7. BSC_Number of Performance Measuresb4.85 5.00 1 7 [1-7] 2.12
8. BSC_Nature of Performance Measures 3.42 3.00 1 7 [1-7] 1.67
9. BSC_Reports Updating 3.25 3.00 1 7 [1-7] 1.06
10. BSC_Longevityc3.39 3.00 1 7 [1-7] 1.95
11. BSC_Management Support 6.03 6.00 2 7 [1-7] 1.20
12. BSC_IT Integration 4.33 5.00 1 7 [1-7] 1.72a The variable has been coded as follows: 0 = not implementing a strategy map; 1 = implementing a strategy map.b The variable has been coded as follows: 1 [< 9 measures], 2 [10-12 measures], 3 [13-16 measures], 4 [17-20 measures], 5 [21-23 measures], 6 [24-25measures], 7 [> 25 measures].c The variable has been coded as follows: 1 [1 year], 2 [2 years], 3 [3 years], 4 [4 years], 5 [5 years], 6 [6 years], 7 [>6 years].