comprehensive proteomic profiling of wheat gluten using a ......subhra chakraborty, national...
TRANSCRIPT
ORIGINAL RESEARCHpublished: 10 January 2017
doi: 10.3389/fpls.2016.02020
Frontiers in Plant Science | www.frontiersin.org 1 January 2017 | Volume 7 | Article 2020
Edited by:
Subhra Chakraborty,
National Institute of Plant Genome
Research (NIPGR), India
Reviewed by:
Joshua L. Heazlewood,
University of Melbourne, Australia
Gregory John Tanner,
Retired, Australia
*Correspondence:
Sophie N. L. Bromilow
sophie.bromilow@
postgrad.manchester.ac.uk
Specialty section:
This article was submitted to
Plant Proteomics,
a section of the journal
Frontiers in Plant Science
Received: 17 August 2016
Accepted: 19 December 2016
Published: 10 January 2017
Citation:
Bromilow SNL, Gethings LA,
Langridge JI, Shewry PR, Buckley M,
Bromley MJ and Mills ENC (2017)
Comprehensive Proteomic Profiling of
Wheat Gluten Using a Combination of
Data-Independent and
Data-Dependent Acquisition.
Front. Plant Sci. 7:2020.
doi: 10.3389/fpls.2016.02020
Comprehensive Proteomic Profilingof Wheat Gluten Using aCombination of Data-Independentand Data-Dependent AcquisitionSophie N. L. Bromilow 1*, Lee A. Gethings 2, James I. Langridge 2, Peter R. Shewry 3,
Michael Buckley 4, Michael J. Bromley 5 and E. N. Clare Mills 1
1 Faculty of Biology, Medicine and Health, Infection, Immunity and Respiratory Medicine, Manchester Academic Health
Sciences Centre, Manchester Institute of Biotechnology, University of Manchester, Manchester, UK, 2Waters Corporation,
Wilmslow, UK, 3 Rothamsted Research, Harpenden, UK, 4 School of Chemistry, Manchester Institute of Biotechnology,
University of Manchester, Manchester, UK, 5 Synergy Health, Hebden Bridge, UK
Wheat is the most important food crop in the world, the unique physiochemical
properties of wheat gluten enabling a diverse range of food products to be manufactured.
However, genetic and environmental factors affect the technological properties of
gluten in unpredictable ways. Although newer proteomic methods have the potential
to offer much greater levels of information, it is the older gel-based methods that
remain most commonly used to identify compositional differences responsible for the
variation in gluten functionality, in part due to the nature of their primary sequences. A
combination of platforms were investigated for comprehensive gluten profiling: a QTOF
with a data independent schema, which incorporated ion mobility (DIA-IM-MS) and a
data dependent acquisition (DDA) workflow using a linear ion trap quadrupole (LTQ)
instrument. In conjunction with a manually curated gluten sequence database a total of
2736 gluten peptides were identified with only 157 peptides identified by both platforms.
These data showed 127 and 63 gluten protein accessions to be inferred with a minimum
of one and three unique peptides respectively. Of the 63 rigorously identified proteins, 26
were gliadin species (4 ω-, 14 α-, and 8 γ-gliadins) and 37 glutenins (including 29 LMW
glutenin and 8 HMW glutenins). Of the HMW glutenins, three were 1Dx type and five were
1Bx type illustrating the challenge of unambiguous identification of highly polymorphic
proteins without cultivar specific gene sequences. The capacity of the platforms to
sequence longer peptides was crucial to achieving the number of identifications, the
combination of QTOF-LTQ technology being more important than extraction method to
obtain a comprehensive profile. Widespread glutamine deamidation, a post-translational
modification, was observed adding complexity to an already highly polymorphic mixture
of proteins, with numerous insertions, deletions and substitutions. The data shown is the
most comprehensive and detailed proteomic profile of gluten to date.
Keywords: proteomics, plant proteomics, mass spectrometry, chymotrypsin, QTOF-MS/MS, LTQ-Orbitrap, gluten,
coeliac disease
Bromilow et al. Proteomic Profiling of Gluten
INTRODUCTION
Wheat is arguably the most important grain in the world andforms a staple part of the modern diet (Shewry and Tatham,2016), being present in many processed foods including breads,noodles, pasta, biscuits, cakes and sauces (Kamal et al., 2009;Gao et al., 2016). Its versatility as a food ingredient results fromthe unique physicochemical properties of the gluten fraction ofwheat seed protein. One of the earliest proteins to be studied,gluten was first described by Beccari in 1728 (Bailey, 1941), andis readily isolated from wheat flour as a viscoelastic mass bymaking dough and then washing it with dilute salt solutions.Gluten comprises the major storage proteins of wheat grain,which are traditionally divided into two groups based on theirsolubility called gliadins and glutenins (Osborne, 1907). Thegliadins comprise monomeric subunits which are soluble inalcohol-water mixtures and are further classified, based on theirmobility on electrophoresis at low pH, into α-,γ-, andω-gliadins.The glutenins comprise two groups of subunits, called highmolecular weight (HMW) and low molecular weight (LMW)glutenin subunits (Bietz and Wall, 1973, 1980), which formalcohol-insoluble polymers stabilized by inter-chain disulfidebonds. However, when the disulfide bonds are reduced, theglutenin subunits become soluble in aqueous alcohol and aminoacid sequences show that gliadins and glutenin subunits arerelated. A characteristic of both groups is that they contain fewarginine and lysine residues and are rich in the amino acidsproline and glutamine, which result from the presence of largedomains comprising repetitive short peptide sequence motifsdominated by proline and glutamine. It is therefore usual todefine both as prolamins, the name originally applied only towheat gliadins and related proteins from other species.
Wheat is very diverse, with thousands of different typescultivated across the world, and over 40 cultivars currently beingrecommended for growth in the UK alone. The bread makingquality of wheat is associated particularly with allelic variationin the HMW subunits of glutenin but these are not the soledeterminants of quality. Many other factors are involved such asvariation in gluten proteins other than HMW subunits, especiallythose that may modify polymer formation. However, these aregenerally poorly understood and make bread making qualityof difficult to predict (Groger et al., 1997; Liu et al., 2016).Gel-based methods have long been used to identify variationsin gluten protein composition associated with bread makingquality (Dupont et al., 2011) whilst more recently methodsemploying MS alone in bottom-up approaches has been usedfor profiling gluten proteins (Mamone et al., 2011; Prandi et al.,
Abbreviations: ATEE, N–Acetyl–L–tyrosine ethyl ester; BCIP, 5-bromo-4-chloro-3′-indolyphosphate p-toluidine salt; CCD, Charge coupled device; CD, Coeliacdisease; cv., Cultivar; DDA, Data dependent acquisition; DIA, Data independentacquisition; DIA-IM-MS, Data independent acquisition with incorporated ionmobility mass spectrometry; EIC, Extracted Ion Chromatogram; ELISA, Enzymelinked immunosorbent assay; FDR, False discovery rate; HMW, High molecularweight; IEF, Isoelectric focusing; LDS, Lithium Dodecyl Sulphate; LTQ, Linear iontrap; LMW, Low molecular weight; mAbs, Monoclonal Antibody; Mr, MolecularMass; NBT, Nitro-blue tetrazolium chloride; QTOF, Quadrupole time of flight;T3PQ, Top 3 protein quantification; Tris, Tris (hydroxymethyl) aminomethane.
2014; Colgrave et al., 2015; Manfredi et al., 2015; Wang et al.,2015; van den Broeck et al., 2015; Barro et al., 2016; Martínez-Esteso et al., 2016). One study using data independent acquisition(DIA) identified only a few gluten proteins as a consequenceof employing only tryptic digestion (Uvackova et al., 2013).Data dependent acquisition (DDA) of classical Osborne fractionsprepared from flour has also allowed identification of severalhundred gluten peptides (Fiedler et al., 2014), whilst anotherstudy identified more than 80 wheat-specific proteins, includinggluten, albumin and globulin proteins using a gluten-enrichedfraction (Colgrave et al., 2015). A more recent analysis of agluten food ingredient, coupled with fractionation to enrichgluten proteins also allowed identification of several hundredgluten-specific peptides (Martínez-Esteso et al., 2016). Due tothe complexity of gluten, a large proportion of the current MSanalysis carried out on gluten has been focused to profile HMWglutenin subunits initially (Lagrain et al., 2013;Wang et al., 2014).
Wheat variety Hereward, which is classified as a group 1winter wheat, shows consistent baking and milling properties,and is well suited to bread making (Nabim Wheat Guide,1978). However, this does not explain its good bread makingquality as Hereward contains a combination of HMW subunits(called subunits Bx7+By9 and Dx3+Dy12) which are associatedwith poor quality (Shewry et al., 2012; Bekderok et al., 2013).Using Hereward as a model wheat we aim to comprehensivelycharacterize the gluten proteome using a linear ion trap (LTQ)instrument in a DDA mode and a quadrupole time of flight(QTOF) instrument incorporating ion mobility in a DIA mode.A curated database containing only full length gluten proteinsequences was used for annotation in order to overcomeshortcomings of uncurated public repositories.
METHODS
Plant Materials and ReagentsGrain of the bread making wheat (Triticum aestivum) cultivarHereward was grown at Rothamsted Research, Harpenden. Totalprotein was determined by nitrogen analysis of wholemeal flourusing the Dumas combustion method (Serrano et al., 2013)multiplied by a factor of 5.7 giving a mean of 13.5% protein bydry weight for three replicate 1 g samples.
All reagents used were analytical grade unless statedotherwise. Formic acid, acetonitrile and water used inchromatography were all HPLC grade (Sigma-Aldrich, Dorset,UK). α-Chymotrypsin (Merck Chemicals, Nottingham, UK)with an activity of ≥300U/mg (measured by ATEE assay) and aspecific activity 400 U/mg of protein was used for digestion ofthe gluten proteins. RapigestTM (a patented surfactant used toenhance enzymatic digestion of proteins by helping solubilizeproteins, making them more susceptible to enzymatic cleavagewithout inhibiting enzyme activity; Yu and Gilar, 2009) andHi3 PhosB standard (Waters 186006011, Wilmslow UK) wereprovided by Waters Corporation, Manchester. ZipTips C18
(Sigma-Aldrich, Dorset, UK) with a volume of 0.1-10 µL wereused for the as part of the mass spectrometry preparationstep. NuPAGE Bis-tris gels (12%), NuPAGE lithium dodecylsulfate (LDS) buffer (4X, pH 8.4) and SimplyBlueTM safestain
Frontiers in Plant Science | www.frontiersin.org 2 January 2017 | Volume 7 | Article 2020
Bromilow et al. Proteomic Profiling of Gluten
were from Invitrogen (Shropshire, UK). Mark 12TM markerand SeeBlueTM prestained marker were also from Invitrogen.Secondary anti-mouse IgG labeled with alkaline phosphataseand nitro-blue tetrazolium chloride (NBT)/5-bromo-4-chloro-3’indolyphosphate p-toluidine salt (BCIP) substrate solutionwere sourced from ThermoScientific (Leicestershire, UK).Blotting membrane 0.2 µm pore size was sourced from BioRad,Hertfordshire, UK. Mouse monoclonal antibodies (mAbs) IFRN0610 (toward QPFP epitope; Brett et al., 1999), G12 (anti-gliadin33mer; Morón et al., 2008; were provided by Adrian Rogers,Romer Labs UK Ltd) and R5 (toward QXPFP, QQQFP, LQPFP;Valdés et al., 2003; Kahlenberg et al., 2006; Operon, Zaragoza,Spain) were used in immunoblot analysis.
Experimental Design and StatisticalRationaleA sample of seeds (n = 100 grain) was weighed after discardingany shriveled seeds and the average grain weight found to be49.47 mg. Three plump seeds per extraction were selected to berepresentative and had a weight similar to the average weight forthe total seed sample (±7.13 mg). Three seeds were extractedper type of buffer and each extract analyzed in triplicate byLC-MS using the QTOF (giving pooled data from 27 analysesfrom nine seeds) and in duplicate using the LTQ (giving pooledfrom 18 analyses from nine seeds). Three technical replicatesof the MS acquisition were used to calculate the mean proteinabundances and allow statistical analysis to be carried out inmeasurements. A summary of the experimental workflow can befound in Supplementary Material, Figure S1.
Controls implemented include the use of LeuEnk during thedetector set up of the mass spectrometer and Hi3 PhosB standard(Waters, Wilmslow, UK) was used as a standard for all samplepreparation and verifying instrument performance. Samples wererandomized for analysis and blank injections of MilliQ waterwere carried out every three injections.
Variation between protein extractions was calculated as thestandard deviation. Variation was also accessed on a run to runbasis for all peptides residues to investigate the occurrence in thebiological and technical replicates.
Protein ExtractionIndividual wheat grains (cv Hereward) were crushed betweenfilter paper using pliers, and transferred to a clean Eppendorf. Tothree crushed grains (per extraction) 250 µL of extraction bufferwas added.
(E1) 50 mM Tris-HCl (pH 8.8), 50 mM DTT and (0.2% w/v)RapigestTM.(E2) 50 mM Tris-HCl (pH 8.8), 50 mM DTT, (0.2% w/v)RapigestTM and 75% (v/v) ethanol.(E3) Two Step Sequential extraction: 50 mM Tris-HCl (pH8.8), 50 mM DTT, Rapigest (0.2% w/v), with the pelletresuspended using 50 mM Tris-HCl (pH 8.8), 50 mM DTT,Rapigest (0.2% w/v), 75% ethanol (v/v).
RapigestTM was included in all extracts at 0.2% (w/v) in orderto improve protease digestion. All extractions were carried outfor 15min with sonication in a water bath heated to 60◦C
(VWR, Leicestershire, UK), vortexing every 5min. Extracts werethen centrifuged at 10,000 × g for 10 min, the supernatantcollected and transferred to a clean microcentrifuge tube. Threebiological replicates were extracted with each buffer. Proteinconcentration of the biological replicates for each extraction wasinitially determined using 2D Quant AssayTM (GE Healthcare,Buckinghamshire UK) as per the manufacturer’s instructionsusing bovine serum albumin as a standard. The proteinextraction rate was calculated as a percentage of the total grainprotein determined with a Kjeldhal analysis using the Dumascombustion method for each extraction.
SDS PAGE and ImmunoblotsOne of each of the triplicate biological replicates for eachextraction was prepared for SDS PAGE and immunoblot analysisas per (Smith et al., 2015).
Sample Preparation for Mass SpectrometrySamples extracted using buffers E1–E3 (25 µL) were reduced byaddition of 330 µL of 50 mM ammonium bicarbonate and 40 µLof 50mM DTT and heated to 80◦C for 10 min. After allowingto cool to room temperature, 45 µL of 150 mM iodoacetamidewas added and samples were incubated at room temperature inthe dark for 30 min. A two-step digestion protocol was used asfollows: (1) to each sample 25 µL of 0.1 mg/mL chymotrypsinwas added and incubated in 37◦C for 4 h; (2), 25µL of 0.1 mg/mLof chymotrypsin was then added and the samples incubatedovernight at 37◦C. Each sample then underwent off-line desaltingon C18 Ziptips and was diluted to 1 mg/mL protein using 0.2%(v/v) acetonitrile containing 0.1% (v/v) formic acid. Hi3 PhosBstandard (Waters 186006011, Wilmslow, UK) was spiked intosamples at 100 fmol and samples were loaded on column at100 ng/µL.
Each sample was subject to liquid chromatography coupledwith tandem mass spectrometry (LC-MS/MS) analysis on bothQTOF (quadrupole time of flight) (Waters, Wilmslow, UK) andLTQ (linear ion trap quadrupole) (Thermo Fisher Scientific,Waltham, MA, USA) MS platforms. Only two of the threebiological replicates were analyzed by LTQ.
QTOF (quadrupole time of flight): Aliquots (1 µL) of digestedsample extracts E1-E3 were chromatographically separated onan M-class ACQUITY UPLC system (Waters, Wilmslow, UK)using a NanoEase 1.8 µm HSS T3 C18 (75µm × 150 mm)column (Waters) using a linear gradient (flow rate 300 nL/min)from 3 to 40% (v/v) solvent B over 90 min. The mobile phasesconsisted of solvent A (0.1% (v/v) formic acid/99.9% (v/v) water)and solvent B (0.1% (v/v) formic acid/99.9% (v/v) acetonitrile).The eluate was directed into the electrospray ionization source ofthe Synapt G2-SiTM (Waters Corporation Wilmslow, U.K). Datawas acquired in ion mobility assisted data independent analysis(IMDIA)mode. MS analysis was performed in positive ionmodeover the mass rangem/z 50–2000 with a 0.5 s spectral acquisitiontime. One cycle of low and elevated energy data was acquiredevery 1 s.(Rodriguez-Suarez et al., 2013)
LTQ: Data acquisition was carried out by the BiologicalMass Spectrometry Facility of the University of Manchester.Aliquots (1 µL) of digested sample extracts E1-E3 were
Frontiers in Plant Science | www.frontiersin.org 3 January 2017 | Volume 7 | Article 2020
Bromilow et al. Proteomic Profiling of Gluten
chromatographically separated using an UltiMate R© 3000 RapidSeparation LC (RSLC, Dionex Corporation, Sunnyvale, CA)coupled to an Orbitrap Elite (Thermo Fisher Scientific,Waltham,MA, USA) mass spectrometer. Peptide mixtures were separatedusing a gradient from 92% (v/v) A (0.1%(v/v) formic acid/99.9%(v/v) water) and 8%(v/v) B (0.1%(v/v) formic acid/99.9%(v/v)acetonitrile) to 33% (v/v) B, in 44 min at 300 nL min−1, using a75mm× 250µm, 1.7 ÅM BEH C18, analytical column (Waters,Wilmslow UK). Data was acquired in the DDA mode. MSanalysis was performed in positive ion mode over the mass rangem/z 350–1500 with a 0.01 s spectral acquisition time. Peptideswere selected for fragmentation automatically by data dependentanalysis; +2 or +3 precursor ions and previously observedions were excluded from fragmentation for a 30 s accumulationperiod.
Data ProcessingThe LC-MS data from both platforms were processed usingProgenesis QI for proteomics v2.0 (Li et al., 2009), andsearched against a curated gluten database (Glu.Pro Ver1)that was based on well characterized sequences (Khan andShewry, 2009). Searching of the two data sets were carriedout differently due to the inherent differences in the dataproduced from the different instruments, LTQ data was searchedusing MASCOT whereas the QTOF gathered data was searchedusing PLGS. The database was curated from BLAST searchingwell annotated gluten sequences against the entire UniProtdatabase, and downloading the resulting sequences. The resultingsequences were manually interrogated to remove sequencesthat were fragments, duplicates or assigned to a grass otherthan Triticum. The database comprises 634 unique full lengthcDNA sequences and was curated using Clustal Omega, DB-toolkit and Jalview (Martens et al., 2005; Waterhouse et al.,2009; McWilliam et al., 2013). Phylogenetic trees of thecomplete curated database were created using Figtree, andthe Neighbor Joining BLOSUM62 algorithm (Rambaut, 2007).Carbamidomethylation of cysteine residues (+57.02 Da) wasselected as a fixed modification, whilst oxidized methionine(+15.99 Da) and deamidated asparagine/glutamine (+0.984 Da)were selected as variable modifications. Chymotrypsin was thedigestion enzyme of choice with the cleavage specificity set totyrosine, tryptophan, phenylalanine and leucine unless precededby a proline. Up to two missed cleavage sites were acceptablefor chymotrypsin digestion. The false discovery rate (FDR) wasset to 1%. Data from both platforms were handled identically toensure data standardization and to allow for a robust comparisonof mass spectrometry platforms. Mass tolerance for the precursorand fragments ions were set to 10 and 20 ppm respectivelyand the peptide threshold score set to 5 (Li et al., 2009).Quantification was done using top 3 protein quantification(T3PQ) (Silva et al., 2006) where for each protein identifiedby a set of unique peptides, the average of the three mostefficiently ionized peptides correlates to the protein abundanceobserved. Uniqueness of peptides was considered using (1) onlyunmodified peptide sequences; and (2) peptide sequences withthe inclusion of modifications resulting in different peptides ofthe same sequence. When deamidation was observed in multiple
positions for one peptide sequence these were considered to bea single unique peptide as the exact location of the modificationcannot be certain.
In silico DigestionIn silico digestion was carried out on two HMW gluteninprotein sequences (Uniprot accession P08489 and D0IQ05)attributed to two different HMW subunits to identify alltheoretical peptides. The in silico digestion was carried outusing ExPASy (http://www.expasy.org/) utilizing the PeptideMass tool with cleavage rules of chymotrypsin (C-term toF/Y/W/M/L, not before P) set. The mass range was unlimited.The lists of resulting peptides for both proteins were downloadedand compared, and unique peptides for both proteins wereidentified.
RESULTS
The effectiveness of different types of buffer on the extractionand detection of gluten proteins was initially assessed usingseveral gluten-specific antibody preparations in order to identifya simple single step extraction method that was effectiveand compatible with subsequent MS workflows. Buffer E1,previously used for extraction of peanut proteins (Johnsonet al., 2016) which primarily extracts the water-soluble (albumin)and salt-soluble (globulin) proteins of wheat, recovered 24.9%protein from the grain (Figure 1A) and revealed a complexmixture of polypeptides of 6–116 kDa (Figure 1B). Althoughimmunoblotting with the mAb IFRN 0610 indicated that somegliadin and glutenin polypeptides had been extracted, onlyweakly reactive polypeptides were observed with the G12 and R5antibodies (Figure 1C). In order to improve the extractability ofthe gliadin and glutenin fraction 75% (v/v) ethanol was addedto buffer E1 to give buffer E2. It slightly reduced the extent ofprotein extraction to 19.8% but SDS-PAGE analysis revealed apattern of polypeptides much more consistent with the patternobserved for gliadins and glutenins with the HMW subunitsof cv Hereward (7 + 9, 3 + 12) being clearly visible. The E2extract was strongly reactive with all three antibodies, althoughmore polypeptides were recognized by the Mab IFRN0610 thaneither the R5 or G12 antibodies. This might be expected since theIFRN 0610 epitopes are present in many different seed storageprolamins from wheat (Brett et al., 1999; Kahlenberg et al.,2006; Mokarizadeh et al., 2015). Thus, the inclusion of reducingagent and ethanol improved the solubilization of gliadins andglutenins.
The two-step extraction which involved extraction of thealbumin and globulins prior to that of the gliadins and gluteninsgave a slightly higher rate of overall protein extraction butthe variation in extraction efficiency between samples wasincreased (Figure 1A). This is probably due to the difficulties inundertaking the two-step extraction rather than inherent seed-to-seed variation in protein content because seeds of a similar sizeand therefore protein content were used for all extractions. Thistwo-step extraction approach yielded a pattern of polypeptidesfollowing SDS-PAGE analysis very similar to that of the buffer
Frontiers in Plant Science | www.frontiersin.org 4 January 2017 | Volume 7 | Article 2020

Bromilow et al. Proteomic Profiling of Gluten
FIGURE 1 | Effect of different buffers on extraction of proteins from wheat grain c.v Hereward. (A) Box and whisker plots of % protein recovery for buffers
E1-E3. Percentage protein recovery was calculated as (protein extracted/protein present) x 100. Extraction solutions were as follows: (E1) 50 mM Tris-HCl (pH 8.8), 50
mM DTT, Rapigest (0.2% w/v), (E2) 50 mM Tris-HCl (pH 8.8), 50 mM DTT, Rapigest (0.2% w/v), 75% (v/v) ethanol; (E3) 2 Step extraction: 50 mM Tris-HCl (pH 8.8), 50
mM DTT, Rapigest (0.2% w/v), with the pellet resuspended using 50 mM Tris-HCl (pH 8.8), 50 mM DTT, Rapigest (0.2% w/v), 75% (v/v) ethanol. (B) SDS-PAGE
analysis of protein extracts. Samples were prepared with buffers E1, E2, and E3 using one of the three biological replicates used for subsequent analysis. Mark 12
prestained molecular weight markers were used, with key gluten protein bands highlighted. (C) Immunoblotting analysis of protein extracts prepared with buffers E1,
E2, and E3. Immunoblots were developed using anti-gluten antibodies as follows: (1) Mab IFRN 0610; (2) R5, and (3) G12 Molecular weight markers were prestained
Seeblue markers. Key gluten protein bands are highlighted.
E2 extract and showed the same pattern of reactivity with thedifferent antibodies (Figure 1C).
The same extracts were then subjected to LC-MS analysisusing two different platform technologies operating in differentacquisition modes. The LTQ is a linear trap quadrupole madeup of two mass analyser the first being an ion trap that actsas a mass filter, followed by a quadrupole were the filteredions are separated according to the m/z as they pass alongthe central axis of four parallel rods in an electrostatic field.Whereas the QTOF incorporated ion mobility separates theions as described previously (Allen et al., 2016) followed byadditional separation in the time of flight tube that acceleratesions by an electric field, and the time taken to travel a knowndistance is recorded. The ion mobility adds an additional level ofseparation of the ions in the gas phase based on the shape andcharge of the ions, (Allen et al., 2016) The LTQ was operated
in DDA mode of acquisition, where MS/MS scans are onlyacquired on a subset of precursors detected in an MS “survey”scan adhering to a minimum threshold, and is biased to pickpeptides of the highest intensity (Egertson et al., 2015). TheQTOF was operated using a DIA mode of acquisition wherebyall peptides are fragmented andMS/MS scans collected regardlessof signal intensity (Doerr, 2015). The resulting spectral librarieswere analyzed using an in-house curated wheat gluten proteinsequence database. This allowed a total of 2,736 gluten peptidesto be identified across all the extracts analyzed, of which 1548were identified by the QTOF and 1031 by the LTQ, with only 157gluten peptides matched by both platforms. Subsequently thesedata were used to identify proteins on the basis that the sameunique peptide(s) were observed in at least two replicate analysesof each extract from at least two seeds. Individual peptide scoresranged from 5 to 70.78 showing the confidence in the protein
Frontiers in Plant Science | www.frontiersin.org 5 January 2017 | Volume 7 | Article 2020
Bromilow et al. Proteomic Profiling of Gluten
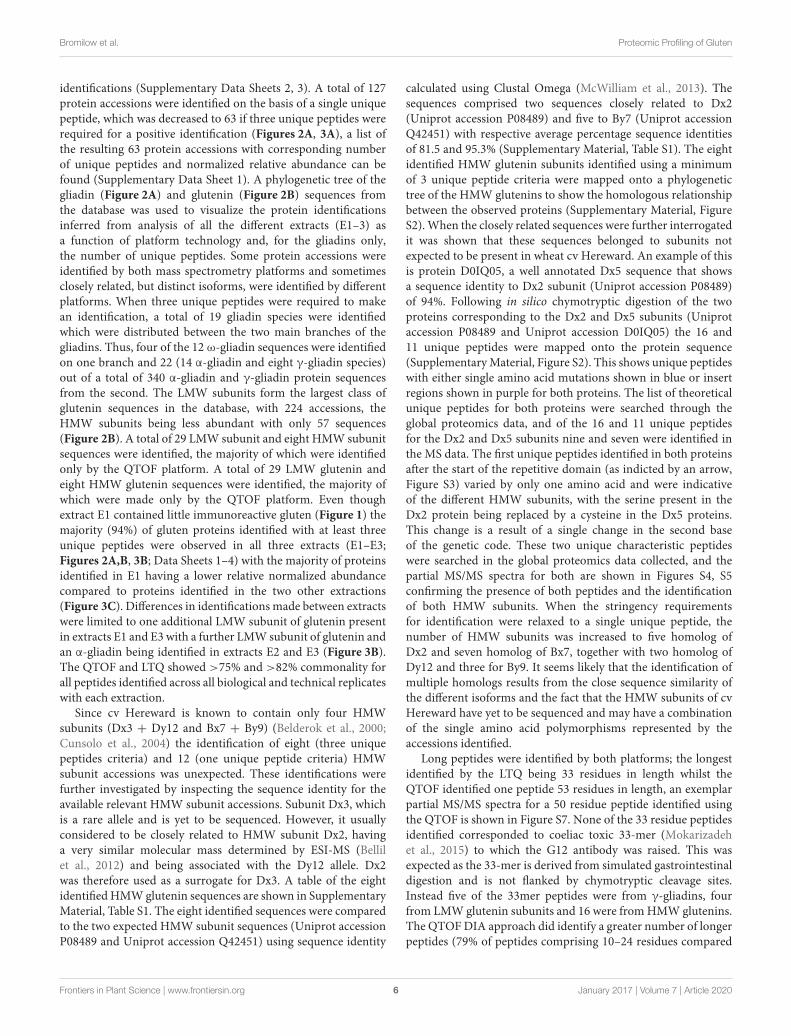
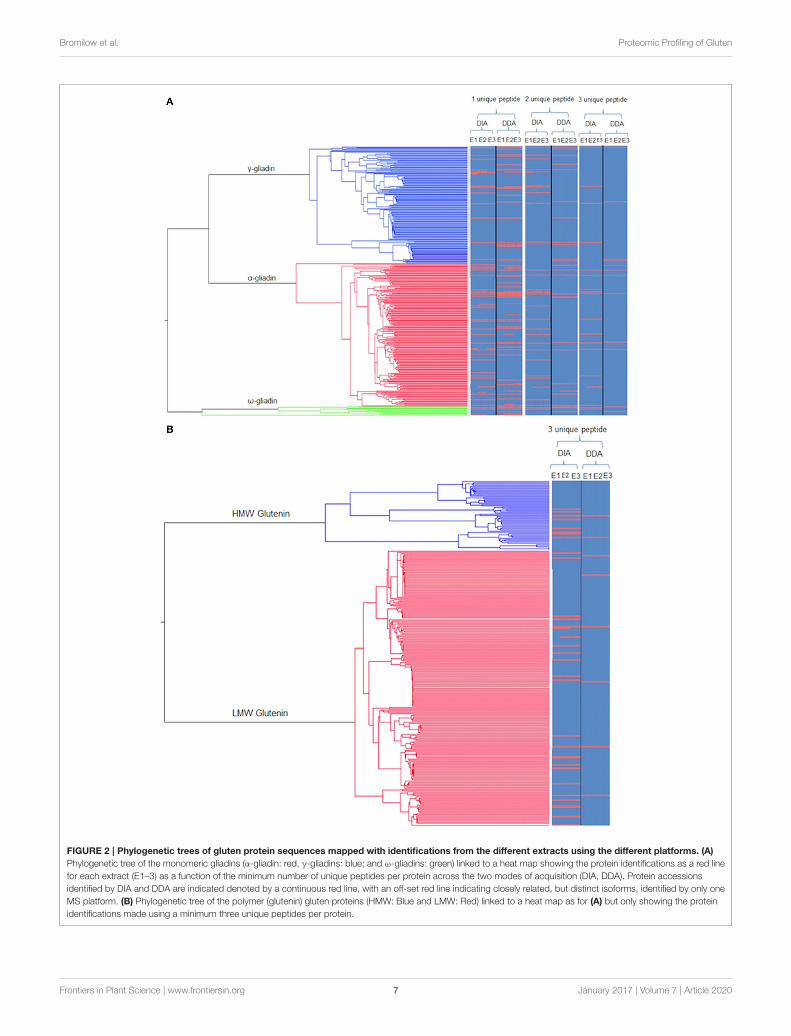
identifications (Supplementary Data Sheets 2, 3). A total of 127protein accessions were identified on the basis of a single uniquepeptide, which was decreased to 63 if three unique peptides wererequired for a positive identification (Figures 2A, 3A), a list ofthe resulting 63 protein accessions with corresponding numberof unique peptides and normalized relative abundance can befound (Supplementary Data Sheet 1). A phylogenetic tree of thegliadin (Figure 2A) and glutenin (Figure 2B) sequences fromthe database was used to visualize the protein identificationsinferred from analysis of all the different extracts (E1–3) asa function of platform technology and, for the gliadins only,the number of unique peptides. Some protein accessions wereidentified by both mass spectrometry platforms and sometimesclosely related, but distinct isoforms, were identified by differentplatforms. When three unique peptides were required to makean identification, a total of 19 gliadin species were identifiedwhich were distributed between the two main branches of thegliadins. Thus, four of the 12 ω-gliadin sequences were identifiedon one branch and 22 (14 α-gliadin and eight γ-gliadin species)out of a total of 340 α-gliadin and γ-gliadin protein sequencesfrom the second. The LMW subunits form the largest class ofglutenin sequences in the database, with 224 accessions, theHMW subunits being less abundant with only 57 sequences(Figure 2B). A total of 29 LMW subunit and eight HMW subunitsequences were identified, the majority of which were identifiedonly by the QTOF platform. A total of 29 LMW glutenin andeight HMW glutenin sequences were identified, the majority ofwhich were made only by the QTOF platform. Even thoughextract E1 contained little immunoreactive gluten (Figure 1) themajority (94%) of gluten proteins identified with at least threeunique peptides were observed in all three extracts (E1–E3;Figures 2A,B, 3B; Data Sheets 1–4) with the majority of proteinsidentified in E1 having a lower relative normalized abundancecompared to proteins identified in the two other extractions(Figure 3C). Differences in identifications made between extractswere limited to one additional LMW subunit of glutenin presentin extracts E1 and E3 with a further LMW subunit of glutenin andan α-gliadin being identified in extracts E2 and E3 (Figure 3B).The QTOF and LTQ showed >75% and >82% commonality forall peptides identified across all biological and technical replicateswith each extraction.
Since cv Hereward is known to contain only four HMWsubunits (Dx3 + Dy12 and Bx7 + By9) (Belderok et al., 2000;Cunsolo et al., 2004) the identification of eight (three uniquepeptides criteria) and 12 (one unique peptide criteria) HMWsubunit accessions was unexpected. These identifications werefurther investigated by inspecting the sequence identity for theavailable relevant HMW subunit accessions. Subunit Dx3, whichis a rare allele and is yet to be sequenced. However, it usuallyconsidered to be closely related to HMW subunit Dx2, havinga very similar molecular mass determined by ESI-MS (Bellilet al., 2012) and being associated with the Dy12 allele. Dx2was therefore used as a surrogate for Dx3. A table of the eightidentified HMWglutenin sequences are shown in SupplementaryMaterial, Table S1. The eight identified sequences were comparedto the two expected HMW subunit sequences (Uniprot accessionP08489 and Uniprot accession Q42451) using sequence identity
calculated using Clustal Omega (McWilliam et al., 2013). Thesequences comprised two sequences closely related to Dx2(Uniprot accession P08489) and five to By7 (Uniprot accessionQ42451) with respective average percentage sequence identitiesof 81.5 and 95.3% (Supplementary Material, Table S1). The eightidentified HMW glutenin subunits identified using a minimumof 3 unique peptide criteria were mapped onto a phylogenetictree of the HMW glutenins to show the homologous relationshipbetween the observed proteins (Supplementary Material, FigureS2).When the closely related sequences were further interrogatedit was shown that these sequences belonged to subunits notexpected to be present in wheat cv Hereward. An example of thisis protein D0IQ05, a well annotated Dx5 sequence that showsa sequence identity to Dx2 subunit (Uniprot accession P08489)of 94%. Following in silico chymotryptic digestion of the twoproteins corresponding to the Dx2 and Dx5 subunits (Uniprotaccession P08489 and Uniprot accession D0IQ05) the 16 and11 unique peptides were mapped onto the protein sequence(SupplementaryMaterial, Figure S2). This shows unique peptideswith either single amino acid mutations shown in blue or insertregions shown in purple for both proteins. The list of theoreticalunique peptides for both proteins were searched through theglobal proteomics data, and of the 16 and 11 unique peptidesfor the Dx2 and Dx5 subunits nine and seven were identified inthe MS data. The first unique peptides identified in both proteinsafter the start of the repetitive domain (as indicted by an arrow,Figure S3) varied by only one amino acid and were indicativeof the different HMW subunits, with the serine present in theDx2 protein being replaced by a cysteine in the Dx5 proteins.This change is a result of a single change in the second baseof the genetic code. These two unique characteristic peptideswere searched in the global proteomics data collected, and thepartial MS/MS spectra for both are shown in Figures S4, S5confirming the presence of both peptides and the identificationof both HMW subunits. When the stringency requirementsfor identification were relaxed to a single unique peptide, thenumber of HMW subunits was increased to five homolog ofDx2 and seven homolog of Bx7, together with two homolog ofDy12 and three for By9. It seems likely that the identification ofmultiple homologs results from the close sequence similarity ofthe different isoforms and the fact that the HMW subunits of cvHereward have yet to be sequenced and may have a combinationof the single amino acid polymorphisms represented by theaccessions identified.
Long peptides were identified by both platforms; the longestidentified by the LTQ being 33 residues in length whilst theQTOF identified one peptide 53 residues in length, an exemplarpartial MS/MS spectra for a 50 residue peptide identified usingthe QTOF is shown in Figure S7. None of the 33 residue peptidesidentified corresponded to coeliac toxic 33-mer (Mokarizadehet al., 2015) to which the G12 antibody was raised. This wasexpected as the 33-mer is derived from simulated gastrointestinaldigestion and is not flanked by chymotryptic cleavage sites.Instead five of the 33mer peptides were from γ-gliadins, fourfrom LMW glutenin subunits and 16 were fromHMWglutenins.The QTOFDIA approach did identify a greater number of longerpeptides (79% of peptides comprising 10–24 residues compared
Frontiers in Plant Science | www.frontiersin.org 6 January 2017 | Volume 7 | Article 2020
Bromilow et al. Proteomic Profiling of Gluten
FIGURE 2 | Phylogenetic trees of gluten protein sequences mapped with identifications from the different extracts using the different platforms. (A)
Phylogenetic tree of the monomeric gliadins (α-gliadin: red, γ-gliadins: blue; and ω-gliadins: green) linked to a heat map showing the protein identifications as a red line
for each extract (E1–3) as a function of the minimum number of unique peptides per protein across the two modes of acquisition (DIA, DDA). Protein accessions
identified by DIA and DDA are indicated denoted by a continuous red line, with an off-set red line indicating closely related, but distinct isoforms, identified by only one
MS platform. (B) Phylogenetic tree of the polymer (glutenin) gluten proteins (HMW: Blue and LMW: Red) linked to a heat map as for (A) but only showing the protein
identifications made using a minimum three unique peptides per protein.
Frontiers in Plant Science | www.frontiersin.org 7 January 2017 | Volume 7 | Article 2020

Bromilow et al. Proteomic Profiling of Gluten
FIGURE 3 | Effect of extraction buffer on gluten protein identifications. (A) Summary of the total number of proteins identified for all three extractions that are
common and unique to the two mass spectrometry platforms when a criteria of three unique peptides is set. (B) Effect of extraction conditions platform on protein
identification on QTOF when a criteria of three unique peptides is set. (C) Quantification curve of all proteins identified across the three extractions with E1, E2, and E3
being shown in red, green and blue respectively. Data are summarized in Data Sheet 1.
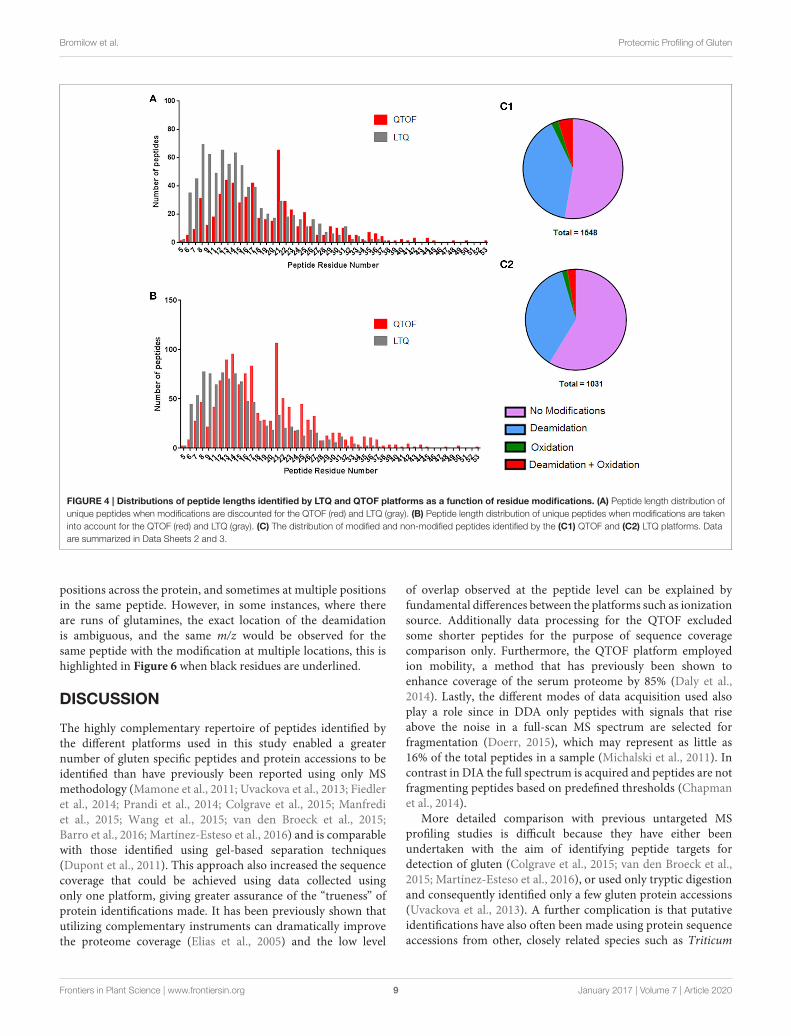
to 63% with the LTQ; Figure 4A), many of which representedmissed cleavages, with the shorter peptides identified on theLTQ often being derived from the longer peptides identifiedby the QTOF. The shorter peptides have a lower probabilityof spanning a variant amino acid position in a given proteinsequence, reducing their capacity to support identification ofindividual isoforms of different gluten proteins compared to thelonger peptides.
In the data gathered using the QTOF, a significant increasein the number of peptides identified was observed for peptidesof 21 residues in length, with a peak of 106 peptides that doesnot fit the general distribution curve observed. The dynamicrange of intensity for these peptide peaks was within the rangeobserved for all the peptides identified suggesting they did notionize any differently to the other peptides andmay simply reflectthe distribution of chymotryptic cleavage sites (Figure S6). Afull list of the 21 residue peptides observed can be found inSupplementary Material, Data Sheet 4, with the correspondingprotein accession, peptide sequence and modifications. Whilstthe majority of peptides identified by both platforms wereunmodified (Figures 4C1,C2) deamidation was observed in 40and 37% of peptides identified respectively by theQTOF and LTQplatforms (Figures 4B,C). In general, deamidation was observed
irrespective of peptide length apart from 21 residue peptides, 75%of which were deamidated (Figure 4B). In contrast, oxidation ofmethionine, which commonly occurs during sample preparation,was identified in ∼3% of peptides identified by both platforms.In order to ascertain whether the deamidation was extensive, therelative normalized abundance of the unmodified and modifiedpeptides were defined (Figure 5A). These data indicate that thedeamidation was a widespread modification that spanned therange of abundancies observed.
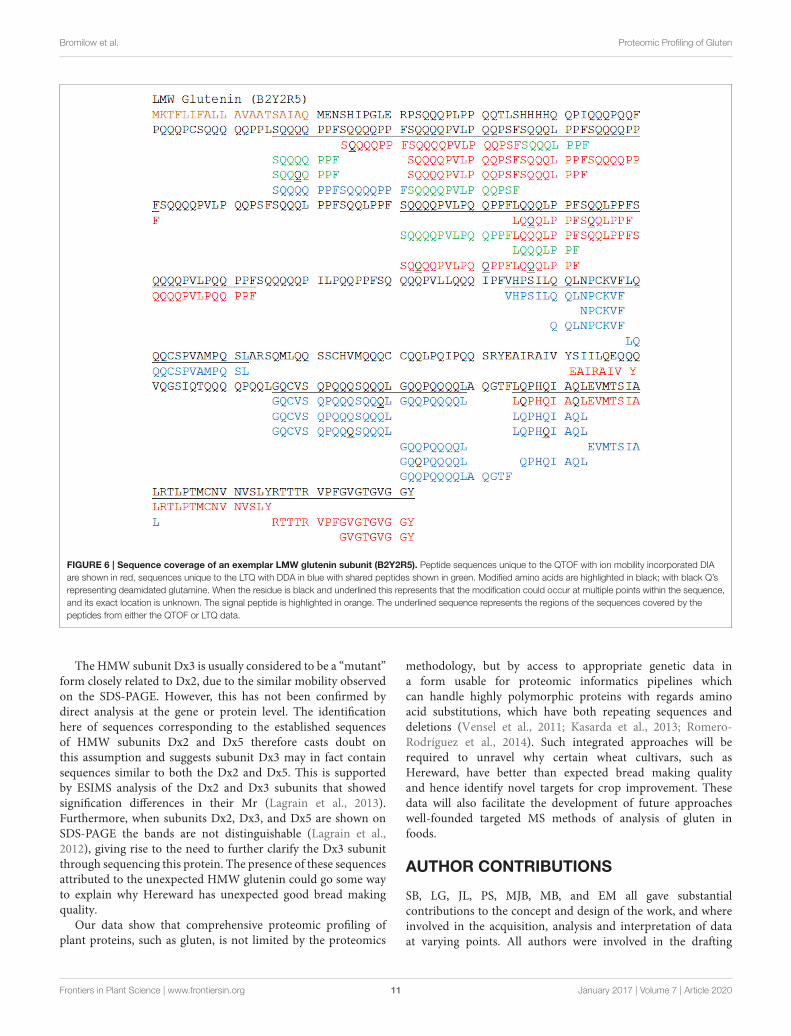
The combined data from the QTOF and LTQ platformsenabled vastly improved sequence coverage to be obtained formany protein identifications made, as illustrated in Figure 6 forthe LMW glutenin protein, B2Y2R5. The N-terminal sequencesof the LMW glutenins are distinctive and have been used toclassify this gluten sub-group (Shewry et al., 1986). B2Y2R5should classically have an N-terminal sequence starting atresidue 21 with the sequence 21MENSHIPGL29, distinctive ofa LMW-s glutenin subunit (Shewry et al., 1986). However,no peptide corresponding to this N-terminal sequence wasidentified; however due to the extensive sequence coverage andfour peptides unique to that protein being observed on bothplatforms it can be confidentially identified. Deamidated residues(highlighted in black in Figure 6) were observed at various
Frontiers in Plant Science | www.frontiersin.org 8 January 2017 | Volume 7 | Article 2020
Bromilow et al. Proteomic Profiling of Gluten
FIGURE 4 | Distributions of peptide lengths identified by LTQ and QTOF platforms as a function of residue modifications. (A) Peptide length distribution of
unique peptides when modifications are discounted for the QTOF (red) and LTQ (gray). (B) Peptide length distribution of unique peptides when modifications are taken
into account for the QTOF (red) and LTQ (gray). (C) The distribution of modified and non-modified peptides identified by the (C1) QTOF and (C2) LTQ platforms. Data
are summarized in Data Sheets 2 and 3.
positions across the protein, and sometimes at multiple positionsin the same peptide. However, in some instances, where thereare runs of glutamines, the exact location of the deamidationis ambiguous, and the same m/z would be observed for thesame peptide with the modification at multiple locations, this ishighlighted in Figure 6 when black residues are underlined.
DISCUSSION
The highly complementary repertoire of peptides identified bythe different platforms used in this study enabled a greaternumber of gluten specific peptides and protein accessions to beidentified than have previously been reported using only MSmethodology (Mamone et al., 2011; Uvackova et al., 2013; Fiedleret al., 2014; Prandi et al., 2014; Colgrave et al., 2015; Manfrediet al., 2015; Wang et al., 2015; van den Broeck et al., 2015;Barro et al., 2016; Martínez-Esteso et al., 2016) and is comparablewith those identified using gel-based separation techniques(Dupont et al., 2011). This approach also increased the sequencecoverage that could be achieved using data collected usingonly one platform, giving greater assurance of the “trueness” ofprotein identifications made. It has been previously shown thatutilizing complementary instruments can dramatically improvethe proteome coverage (Elias et al., 2005) and the low level
of overlap observed at the peptide level can be explained byfundamental differences between the platforms such as ionizationsource. Additionally data processing for the QTOF excludedsome shorter peptides for the purpose of sequence coveragecomparison only. Furthermore, the QTOF platform employedion mobility, a method that has previously been shown toenhance coverage of the serum proteome by 85% (Daly et al.,2014). Lastly, the different modes of data acquisition used alsoplay a role since in DDA only peptides with signals that riseabove the noise in a full-scan MS spectrum are selected forfragmentation (Doerr, 2015), which may represent as little as16% of the total peptides in a sample (Michalski et al., 2011). Incontrast in DIA the full spectrum is acquired and peptides are notfragmenting peptides based on predefined thresholds (Chapmanet al., 2014).
More detailed comparison with previous untargeted MSprofiling studies is difficult because they have either beenundertaken with the aim of identifying peptide targets fordetection of gluten (Colgrave et al., 2015; van den Broeck et al.,2015; Martínez-Esteso et al., 2016), or used only tryptic digestionand consequently identified only a few gluten protein accessions(Uvackova et al., 2013). A further complication is that putativeidentifications have also often been made using protein sequenceaccessions from other, closely related species such as Triticum
Frontiers in Plant Science | www.frontiersin.org 9 January 2017 | Volume 7 | Article 2020

Bromilow et al. Proteomic Profiling of Gluten
FIGURE 5 | Quantification curve for all peptides (modified and unmodified) identified on the QTOF. Gray circles, peptides with no modifications; yellow
circles, peptides with oxidized methionine residues; green circles, peptides with deamidated glutamine residues; blue circles, peptides carrying both oxidized
methionine and deamidated glutamine residues; pink circles, peptides carrying Carbamidomethyl modifications. Relative normalized abundance is shown on the y axis
and the protein index shown on the x-axis.
diccocum and Aegilops squarrosa (Martínez-Esteso et al., 2016).Surprisingly, almost exactly the same proteins were profiled inextracts prepared using reducing agent and 75% (v/v) ethanol(E2 and E3) as were identified in an extract containing littleimmunoreactive gluten. Thus, unexpectedly, sample preparationwas not the limiting factor in the capacity to comprehensivelyprofile the gluten proteins. This highlights the highly sensitivenature of the mass spectrometry platforms able to detect proteinsthat are not optimized for extraction.
Widespread deamidation was observed in all the differenttypes of gluten proteins identified, and observation also made byMartínez-Esteso et al. (2016) in their analysis of a gluten foodingredient. This may be a methodological artifact as, althoughglutamine is usually much less susceptible to deamidation thanasparagine under neutral and alkaline conditions (Robinson,2002) acidic conditions appear to favor the deamidation ofglutamine residues (Joshi andKirsch, 2002), even though the onlyacidic environment experienced by the proteins for a prolongedperiod of time is exposure to dilute formic acid solutions. It isalso possible that deamidation occurs naturally in the plant, sincetrains of spots of the same Mr and different pI are frequentlyobserved in 2D PAGE profiles of gluten. Although these areoften attributed to sample preparation procedures (Johnsonet al., 2016) they are present in protein from freshly isolatedprotein bodies which has not been exposed to extreme conditionsbefore analysis (Field et al., 1982). Further studies modifyingthe extraction methods could be used to identify whether thedeamidation of gluten is an artifact of the analysis or a genuine,previously unidentified, post-translational modification or an
artifact of the extraction and analytical procedures. AnomalousN-terminal proteolytic processing of a LWM subunit was alsoobserved, with a long peptide identified which spans the signalpeptidase cleavage site to give the well-defined N-terminalconsensus motif METSRV. Ragged N-terminal processing is notuncommon in plant seed proteins and has been described inpurified plant proteins, such as the 2S albumins from Brazil nut(Moreno et al., 2004) and there is some variation in furtherproteolytic processing of gluten protein’s by a putative vascularasparaginyl endoprotease (Egidi et al., 2014).
The low content of arginine and lysine residues in glutenproteins means that protease digestion must be carried outusing less-commonly used and less predictable enzymes suchas chymotrypsin. However, the distribution of chymotrypticcleavage sites in many proteins means this enzyme typicallygenerates longer peptides than are generally encounteredwhen digesting proteins with trypsin. These longer peptidesmay present a challenge for data acquisition using MS. Thecapacity to sequence longer peptides in the current study,especially by the QTOF platform (often resulting from missedcleavages) also enabled greater sequence coverage and supportedgreater specificity of protein identification and the individualisoform level. This was also observed when profiling peanutallergens (Johnson et al., 2016) and hence whilst there havebeen many concerns about efficiency of protease digestionsteps, which maybe crucial for effective quantification, foridentification purposes missed cleavages may enhance levels ofidentification when using platforms able to sequence longerpeptides.
Frontiers in Plant Science | www.frontiersin.org 10 January 2017 | Volume 7 | Article 2020
Bromilow et al. Proteomic Profiling of Gluten
FIGURE 6 | Sequence coverage of an exemplar LMW glutenin subunit (B2Y2R5). Peptide sequences unique to the QTOF with ion mobility incorporated DIA
are shown in red, sequences unique to the LTQ with DDA in blue with shared peptides shown in green. Modified amino acids are highlighted in black; with black Q’s
representing deamidated glutamine. When the residue is black and underlined this represents that the modification could occur at multiple points within the sequence,
and its exact location is unknown. The signal peptide is highlighted in orange. The underlined sequence represents the regions of the sequences covered by the
peptides from either the QTOF or LTQ data.
The HMW subunit Dx3 is usually considered to be a “mutant”form closely related to Dx2, due to the similar mobility observedon the SDS-PAGE. However, this has not been confirmed bydirect analysis at the gene or protein level. The identificationhere of sequences corresponding to the established sequencesof HMW subunits Dx2 and Dx5 therefore casts doubt onthis assumption and suggests subunit Dx3 may in fact containsequences similar to both the Dx2 and Dx5. This is supportedby ESIMS analysis of the Dx2 and Dx3 subunits that showedsignification differences in their Mr (Lagrain et al., 2013).Furthermore, when subunits Dx2, Dx3, and Dx5 are shown onSDS-PAGE the bands are not distinguishable (Lagrain et al.,2012), giving rise to the need to further clarify the Dx3 subunitthrough sequencing this protein. The presence of these sequencesattributed to the unexpected HMW glutenin could go some wayto explain why Hereward has unexpected good bread makingquality.
Our data show that comprehensive proteomic profiling ofplant proteins, such as gluten, is not limited by the proteomics
methodology, but by access to appropriate genetic data ina form usable for proteomic informatics pipelines whichcan handle highly polymorphic proteins with regards aminoacid substitutions, which have both repeating sequences anddeletions (Vensel et al., 2011; Kasarda et al., 2013; Romero-Rodríguez et al., 2014). Such integrated approaches will berequired to unravel why certain wheat cultivars, such asHereward, have better than expected bread making qualityand hence identify novel targets for crop improvement. Thesedata will also facilitate the development of future approacheswell-founded targeted MS methods of analysis of gluten infoods.
AUTHOR CONTRIBUTIONS
SB, LG, JL, PS, MJB, MB, and EM all gave substantialcontributions to the concept and design of the work, and whereinvolved in the acquisition, analysis and interpretation of dataat varying points. All authors were involved in the drafting
Frontiers in Plant Science | www.frontiersin.org 11 January 2017 | Volume 7 | Article 2020
Bromilow et al. Proteomic Profiling of Gluten
of the manuscript, and gave approval prior to submission.All authors acknowledge accountability for all aspects of thework.
ACKNOWLEDGMENTS
This work was funded through a BBSRC CASE awarded to SB.We would like to thank the Biological Mass Spectrometry Facility(Bio-MS) and David Knight of the University of Manchesterfor their assistance and support with MS analysis. We would
also like to thank Adrian Rogers at Romer Labs for providingG12 antibody and helpful discussions. Thanks are given toVictoria Lee for continuous support with data analysis andhelpful discussions throughout.
SUPPLEMENTARY MATERIAL
The Supplementary Material for this article can be foundonline at: http://journal.frontiersin.org/article/10.3389/fpls.2016.02020/full#supplementary-material
REFERENCES
Allen, S. J., Giles, K., Gilbert, T., and Bush, M. F. (2016). Ion mobilitymass spectrometry of peptide, protein, and protein complex ionsusing a radio-frequency confining drift cell. Analyst 141, 884–891.doi: 10.1039/C5AN02107C
Bailey, C. H. (1941). A translation of Beccari’s lecture “Concerning Grain” (1728).J. Cereal Chem. 18, 555–561.
Barro, F., Iehisa, J. C. M., Giménez, M. J., García-Molina, M. D., Ozuna, C. V.,Comino, I., et al. (2016). Targeting of prolamins by RNAi in bread wheat:effectiveness of seven silencing-fragment combinations for obtaining linesdevoid of coeliac disease epitopes from highly immunogenic gliadins. PlantBiotechnol. J. 14, 986–996. doi: 10.1111/pbi.12455
Bekderok, B., Mesdag, H., and Donner, D. A. (2013). “Wheat breeding after 1945,”in Break-Making Quality of Wheat: A Century of Breeding in Europe, ed D. A.Donner (New York, NY: Springer Science and Business Media), 110–127.
Belderok, B., Mesdag, H., and Donner, D. A. (2000). Bread-Making Quality of
Wheat - a Century of Breeding in Europe. New York, NY: Springer.Bellil, I., Bouziani, M. C., and Khelifi, D. (2012). Genetic diversity of high and low
molecular weight glutenin subunits in saharan bread and durum wheats fromalgerian oases. Czech J. Genet. Plant Breed. 48, 23–32.
Bietz, J. A., and Wall, J. S. (1980). Identity of high molecular weight gliadinand ethanol-soluble glutenin subunits of wheat: relation to gluten structure. J.Cereal Chem. 57, 6.
Bietz, J. A., and Wall, J. S. (1973). Isolation and Characterization of gliadin-likesubunits from glutenins. J. Cereal Chem. 50, 10.
Brett, G. M., Mills, E. N. C., Goodfellow, B. J., Fido, R. J., Tatham, A. S.,Shewry, P. R., et al. (1999). Epitope mapping studies of broad specificitymonoclonal antibodies to cereal prolamins. J. Cereal Sci. 29, 117–128.doi: 10.1006/jcrs.1998.0234
Chapman, J. D., Goodlett, D. R., andMasselon, C. D. (2014). Multiplexed and data-independent tandem mass spectrometry for global proteome profiling. Mass
Spectrom. Rev. 33, 452–470. doi: 10.1002/mas.21400Colgrave, M. L., Goswami, H., Byrne, K., Blundell, M., Howitt, C. A., and Tanner,
G. J. (2015). Proteomic profiling of 16 cereal grains and the applicationof targeted proteomics to detect wheat contamination. J. Proteome Res. 14,2659–2668. doi: 10.1021/acs.jproteome.5b00187
Cunsolo, V., Foti, S., Saletti, R., Gilbert, S., Tatham, A. S., and Shewry, P.R. (2004). Structural studies of the allelic wheat glutenin subunits 1Bx7and 1Bx20 by matrix-assisted laser desorption/ionization mass spectrometryand high-performance liquid chromatography/electrospray ionization massspectrometry. J. Mass Spectrom. 39, 66–78. doi: 10.1002/jms.558
Daly, C. E., Ng, L. L., Hakimi, A., Willingale, R., and Jones, D. J. L.(2014). Qualitative and quantitative characterization of plasma proteins whenincorporating traveling wave ion mobility into a liquid chromatography–mass spectrometry workflow for biomarker discovery: use of product ionquantitation as an alternative data analysis tool for label free quantitation.Anal.Chem. 86, 1972–1979. doi: 10.1021/ac403901t
Doerr, A. (2015). DIA mass spectrometry. Nat. Meth. 12, 35. doi: 10.1038/nmeth.3234
Dupont, F. M., Vensel, W. H., Tanaka, C. K., Hurkman, W. J., and Altenbach,S. B. (2011). Deciphering the complexities of the wheat flour proteome using
quantitative two-dimensional electrophoresis, three proteases and tandemmass spectrometry. Proteome Sci. 9:10. doi: 10.1186/1477-5956-9-10
Egertson, J. D., MacLean, B., Johnson, R., Xuan, Y., and MacCoss, M. J. (2015).Multiplexed peptide analysis using data-independent acquisition and Skyline.Nat. Protoc. 10, 887–903. doi: 10.1038/nprot.2015.055
Egidi, E., Sestili, F., Janni, M., D’Ovidio, R., Lafiandra, D., Ceriotti, A., et al. (2014).An asparagine residue at the N-terminus affects the maturation process oflow molecular weight glutenin subunits of wheat endosperm. BMC Plant Biol.
14:64. doi: 10.1186/1471-2229-14-64Elias, J. E., Haas, W., Faherty, B. K., and Gygi, S. P. (2005). Comparative evaluation
of mass spectrometry platforms used in large-scale proteomics investigations.Nat. Meth. 2, 667–675. doi: 10.1038/nmeth785
Fiedler, K. L., McGrath, S. C., Callahan, J. H., and Ross, M. M. (2014).Characterization of grain-specific peptidemarkers for the detection of gluten bymass spectrometry. J. Agric. Food Chem. 62, 5835–5844. doi: 10.1021/jf500997j
Field, J. M., Shewry, P. R., Miflin, B. J., andMarch, J. F. (1982). The purification andcharacterization of homologous high molecular weight storage proteins fromgrain of wheat, rye and barley. Theor. Appl. Genet. 62, 329–336.
Gao, X., Liu, T., Yu, J., Li, L., Feng, Y., and Li, X. (2016). Influence of high-molecular-weight glutenin subunit composition at Glu-B1 locus on secondaryand micro structures of gluten in wheat (Triticum aestivum L.). Food Chem.197, 1184–1190. doi: 10.1016/j.foodchem.2015.11.085
Groger, S., Oberforster, M., Werteker, M., Grausgruber, H., and Lelley, T. (1997).HMW glutenin subunit composition and bread making quality of Austriangrown wheats. Cereal Res. Commun. 25, 955–962.
Johnson, P. E., Sayers, R. L., Gethings, L. A., Balasundaram, A., Marsh, J. T.,Langridge, J. I., et al. (2016). Quantitative proteomic profiling of peanutallergens in food ingredients used for oral food challenges. Anal. Chem. 88,5689–5695. doi: 10.1021/acs.analchem.5b04466
Joshi, A. B., and Kirsch, L. E. (2002). The relative rates of glutamine and asparaginedeamidation in glucagon fragment 22–29 under acidic conditions. J. Pharm. Sci.
91, 2332–2345. doi: 10.1002/jps.10213Kahlenberg, F., Sanchez, D., Lachmann, I., Tuckova, L., Tlaskalova, H.,
Méndez, E., et al. (2006). Monoclonal antibody R5 for detection ofputatively coeliac-toxic gliadin peptides. Eur. Food Res. Technol. 222, 78–82.doi: 10.1007/s00217-005-0100-4
Kamal, A. H. M., Kim, K., Shin, D., Seo, H., Shin, K., Park, C., et al. (2009).Proteomics profile of pre-harvest sprouting wheat by using MALDI-TOFMassSpectrometry. Plant Omics. 2, 110–119.
Kasarda, D. D., Adalsteins, E., Lew, E. J., Lazo, G. R., and Altenbach, S.B. (2013). Farinin: characterization of a novel wheat endosperm proteinbelonging to the prolamin superfamily. J. Agric. Food Chem.. 61, 2407–2417.doi: 10.1021/jf3053466
Khan, K., and Shewry, P. R. (2009). “Wheat grain proteins, Chapter 8,” Wheat:
Chemistry and Technology, 4th Edn (St. Paul, MN: AACC International).Lagrain, B., Brunnbauer, M., Rombouts, I., and Koehler, P. (2013). Identification of
intact high molecular weight glutenin subunits from the wheat proteome usingcombined liquid chromatography-electrospray ionization mass spectrometry.PLoS ONE 8:e58682. doi: 10.1371/journal.pone.0058682
Lagrain, B., Rombouts, I., Wieser, H., Delcour, J. A., and Koehler, P. (2012). Areassessment of the electrophoretic mobility of high molecular weight gluteninsubunits of wheat. J. Cereal Sci.. 56, 726–732. doi: 10.1016/j.jcs.2012.08.003
Frontiers in Plant Science | www.frontiersin.org 12 January 2017 | Volume 7 | Article 2020
Bromilow et al. Proteomic Profiling of Gluten
Li, G.-Z., Vissers, J. P. C., Silva, J. C., Golick, D., Gorenstein,M. V., andGeromanos,S. J. (2009). Database searching and accounting of multiplexed precursor andproduct ion spectra from the data independent analysis of simple and complexpeptide mixtures. Proteomics 9, 1696–1719. doi: 10.1002/pmic.200800564
Liu, H., Wang, K., Xiao, L., Wang, S., Du, L., Cao, X., et al. (2016). Comprehensiveidentification and bread-making quality evaluation of common wheat somaticvariation line AS208 on glutenin composition. PLoS ONE 11:e0146933.doi: 10.1371/journal.pone.0146933
Mamone, G., Picariello, G., Addeo, F., and Ferranti, P. (2011). Proteomic analysisin allergy and intolerance to wheat products. Expert Rev. Proteomics. 8, 95–115.doi: 10.1586/epr.10.98
Manfredi, A., Mattarozzi, M., Giannetto, M., and Careri, M. (2015). Multiplexliquid chromatography-tandem mass spectrometry for the detection of wheat,oat, barley and rye prolamins towards the assessment of gluten-free productsafety. Anal. Chim. Acta 895, 62–70. doi: 10.1016/j.aca.2015.09.008
Martens, L., Vandekerckhove, J., and Gevaert, K. (2005). DBToolkit: processingprotein databases for peptide-centric proteomics. Bioinformatics 21,3584–3585. doi: 10.1093/bioinformatics/bti588
Martínez-Esteso, M. J., Nørgaard, J., Brohée, M., Haraszi, R. Maquet, A., andO’Connor, G. (2016). Defining the wheat gluten peptide fingerprint via adiscovery and targeted proteomics approach. J. Proteomics 147, 156–168.doi: 10.1016/j.jprot.2016.03.015
McWilliam, H., Li, W., Uludag, M., Squizzato, S., Park, Y. M., Buso, N., et al.(2013). Analysis Tool Web Services from the EMBL-EBI. Nucleic Acids Res. 41,W597–W600. doi: 10.1093/nar/gkt376
Michalski, A., Cox, J., and Mann, M. (2011). More than 100,000 detectablepeptide species elute in single shotgun proteomics runs but the majority isinaccessible to data-dependent LC−MS/MS. J. Proteome Res. 10, 1785–1793.doi: 10.1021/pr101060v
Mokarizadeh, A., Esmaeili, P., Soraya, H., Hassanzadeh, K., Jalili, A., Abdi, M.,et al. (2015). Antibody against α-gliadin 33-mer peptide: is the key initiatingfactor for development of multiple sclerosis during gluten sensitivity? J. Med.
Hypotheses Ideas 9, 38–44. doi: 10.1016/j.jmhi.2015.02.002Moreno, F. J., Jenkins, J. A., Mellon, F. A., Rigby, N. M., Robertson, J. A., Wellner,
N., et al. (2004). Mass spectrometry and structural characterization of 2Salbumin isoforms from Brazil nuts (Bertholletia excelsa). Biochim. Biophys.
Acta 1698, 175–186. doi: 10.1016/j.bbapap.2003.11.007Morón, B., Cebolla, Á., Manyani, H., Álvarez-Maqueda, M., Megías, M., Thomas,
M. C., et al. (2008). Sensitive detection of cereal fractions that are toxic to celiacdisease patients by using monoclonal antibodies to a main immunogenic wheatpeptide. Am. J. Clin. Nutr. 87, 405–414.
NabimWheat Guide (1978).Wheat Varieties. London: nabim publication.Osborne, T. B. (1907). The Proteins of the Wheat Kernel, by Thomas B. Osborne.
Washington, DC: Carnegie Institution of Washington.Prandi, B., Faccini, A., Tedeschi, T., Cammerata, A., Sgrulletta, D., D’Egidio,
M. G., et al. (2014). Qualitative and quantitative determination of peptidesrelated to celiac disease in mixtures derived from different methods ofsimulated gastrointestinal digestion of wheat products. Anal. Bioanal. Chem.
406, 4765–4775. doi: 10.1007/s00216-014-7858-9Rambaut, A. (2007).Molecular Evoultion, Phylogenetics and Epidemiology - Figtree.
Robinson, N. E. (2002). Protein deamidation. Proc. Natl. Acad. Sci. U.S.A. 99,5283–5288. doi: 10.1073/pnas.082102799
Rodriguez-Suarez, E., Hughes, C., Gethings, L., Giles, K., Wildgoose, J., Stapels,M., et al. (2013). An ion mobility assisted data independent LC-MS strategyfor the analysis of complex biological samples. Curr. Anal. Chem. 9, 199–211.doi: 10.2174/1573411011309020006
Romero-Rodríguez, M. C., Pascual, J., Valledor, L., and Jorrín-Novo, J. (2014).Improving the quality of protein identification in non-model species.Characterization of Quercus ilex seed and Pinus radiata needle proteomesby using SEQUEST and custom databases. J. Proteomics 105, 85–91.doi: 10.1016/j.jprot.2014.01.027
Serrano, S., Rincón, F., and García-Olmo, J. (2013). Cereal protein analysis viaDumas method: standardization of a micro-method using the EuroVectorElemental Analyser. J. Cereal Sci. 58, 31–36. doi: 10.1016/j.jcs.2013.04.006
Shewry, P. R., Mitchell, R. A. C., Tosi, P., Wan, Y., Underwood, C., Lovegrove, A.,et al. (2012). An integrated study of grain development of wheat (cv. Hereward).J. Cereal Sci. 56, 21–30. doi: 10.1016/j.jcs.2011.11.007
Shewry, P. R., and Tatham, A. S. (2016). Improving wheat to removecoeliac epitopes but retain functionality. J. Cereal Sci. 67, 12–21.doi: 10.1016/j.jcs.2015.06.005
Shewry, P. R., Tatham, A. S., Forde, J., Kreis, M., and Miflin, B. J. (1986). Theclassification and nomenclature of wheat gluten proteins: a reassessment. J.Cereal Sci. 4, 97–106. doi: 10.1016/S0733-5210(86)80012-1
Silva, J. C., Gorenstein, M. V., Li, G.-Z., Vissers, J. P. C., and Geromanos,S. J. (2006). Absolute quantification of proteins by LCMSE: avirtue of parallel ms acquisition. Mol. Cell. Proteomics 5, 144–156.doi: 10.1074/mcp.M500230-MCP200
Smith, F., Pan, X., Bellido, V., Toole, G. A., Gates, F. K., Wickham, M.S. J., et al. (2015). Digestibility of gluten proteins is reduced by bakingand enhanced by starch digestion. Mol. Nutr. Food Res. 59, 2034–2043.doi: 10.1002/mnfr.201500262
Uvackova, L., Skultety, L., Bekesova, S., McClain, S., and Hajduch, M.(2013). The MSE-proteomic analysis of gliadins and glutenins in wheatgrain identifies and quantifies proteins associated with celiac diseaseand baker’s asthma. J. Proteomics 93, 65–73. doi: 10.1016/j.jprot.2012.12.011
Valdés, I., García, E., Llorente, M., and Méndez, E. (2003). Innovative approach tolow-level gluten determination in foods using a novel sandwich enzyme-linkedimmunosorbent assay protocol. Eur. J. Gastroenterol. Hepatol. 15, 465–747.doi: 10.1097/01.meg.0000059119.41030.df
van den Broeck, H. C., Cordewener, J. H. G., Nessen, M. A., America, A. H. P., andvan der Meer, I. M. (2015). Label free targeted detection and quantification ofceliac disease immunogenic epitopes by mass spectrometry. J. Chromatogr. A
1391, 60–71. doi: 10.1016/j.chroma.2015.02.070Vensel, W. H., Dupont, F. M., Sloane, S., and Altenbach, S. B. (2011).
Effect of cleavage enzyme, search algorithm and decoy database on massspectrometric identification of wheat gluten proteins. Phytochemistry 72,1154–1161. doi: 10.1016/j.phytochem.2011.01.002
Wang, A., Liu, L., Peng, Y., Islam, S., Applebee, M., Appels, R., et al. (2015).Identification of low molecular weight glutenin alleles by matrix-assistedlaser desorption/ionization time-of-flight mass spectrometry (MALDI-TOF-MS) in common wheat (Triticum aestivum L.). PLoS ONE 10:e0138981.doi: 10.1371/journal.pone.0138981
Wang, K., Islam, S., Ma, J., Anwar, M., Chen, J., Yan, Y., et al. (2014). An improvedMALDI-TOF mass spectrometry procedure and a novel DNA marker foridentifying over-expressed Bx7 glutenin protein subunit in wheat. Hereditas151, 196–200. doi: 10.1111/hrd2.00069
Waterhouse, A. M., Procter, J. B., Martin, D. M. A., Clamp, M., and Barton, G. J.(2009). Jalview Version 2—a multiple sequence alignment editor and analysisworkbench. Bioinformatics 25, 1189–1191. doi: 10.1093/bioinformatics/btp033
Yu, Y. Q., and Gilar, M. (2009). RapiGest SF Surfactant: An Enabling Tool for
in -Solution Enzymatic Protein Digestions. Boston, MA: Waters Corporation.
Conflict of Interest Statement: LG and JL declare a financial relationshipthat could be perceived to influence or give the appearance of potentiallyinfluencing the work submitted as both are employed by the one of themass spectrometry vendors reviewed in this paper. MJB declares a potentialconflict of interest as he works within a consulting capacity for SynergyHealth Plc, who carry out analysis to detect and quantify gluten in foodproducts.
The other authors declare that the research was conducted in the absence ofany commercial or financial relationships that could be construed as a potentialconflict of interest.
Copyright © 2017 Bromilow, Gethings, Langridge, Shewry, Buckley, Bromley
and Mills. This is an open-access article distributed under the terms of
the Creative Commons Attribution License (CC BY). The use, distribution
or reproduction in other forums is permitted, provided the original
author(s) or licensor are credited and that the original publication in this
journal is cited, in accordance with accepted academic practice. No use,
distribution or reproduction is permitted which does not comply with these
terms.
Frontiers in Plant Science | www.frontiersin.org 13 January 2017 | Volume 7 | Article 2020