comprehensive study of heat transfer and pressure drop in
TRANSCRIPT

Purdue University Purdue University
Purdue e-Pubs Purdue e-Pubs
International Refrigeration and Air Conditioning Conference School of Mechanical Engineering
2021
Comprehensive Study of Heat Transfer and Pressure Drop in Comprehensive Study of Heat Transfer and Pressure Drop in
Regenerator and Optimization of Solid-state Caloric Cooling Regenerator and Optimization of Solid-state Caloric Cooling
Cycles Using Realistic Hydraulic Diameter of Regenerator Cycles Using Realistic Hydraulic Diameter of Regenerator
Minwoong Kang University of Illinois, [email protected]
Stefan Elbel University of Illinois
Follow this and additional works at: https://docs.lib.purdue.edu/iracc
Kang, Minwoong and Elbel, Stefan, "Comprehensive Study of Heat Transfer and Pressure Drop in Regenerator and Optimization of Solid-state Caloric Cooling Cycles Using Realistic Hydraulic Diameter of Regenerator" (2021). International Refrigeration and Air Conditioning Conference. Paper 2240. https://docs.lib.purdue.edu/iracc/2240
This document has been made available through Purdue e-Pubs, a service of the Purdue University Libraries. Please contact [email protected] for additional information. Complete proceedings may be acquired in print and on CD-ROM directly from the Ray W. Herrick Laboratories at https://engineering.purdue.edu/Herrick/Events/orderlit.html
210035, Page 1
Comprehensive study of heat transfer and pressure drop in regenerator and optimization
of solid-state caloric cooling cycles using realistic hydraulic diameter of regenerator
Minwoong Kang1, Stefan Elbel1,2,*
1 Air Conditioning and Refrigeration Center, Department of Mechanical Science and Engineering, University of Illinois at Urbana-Champaign, 1206 West Green Street, Urbana, IL 61801, USA
2 Creative Thermal Solutions, Inc., 2209 North Willow Road, Urbana, IL 61802, USA
* Corresponding Author
Email: [email protected]
ABSTRACT
Many researchers have used very small hydraulic diameters in regenerators of solid-state caloric cooling cycles,
because smaller diameters can generate higher cooling capacity and system COP. However, using very small diameters
hardly represent the real performance of the caloric cooling cycle, because they cannot be manufactured for a real
system. Therefore, this paper has used more realistic hydraulic diameter which is used in commercial heat exchangers.
To get the more accurate heat transfer coefficient and friction factor, the model used in this paper incorporates
hydrodynamic and thermal developing regions which are usually neglected in other papers. This paper shows that
COP is a function of heat transfer coefficient, pressure drop and displacement ratio. Higher heat transfer coefficient,
lower pressure drop and the optimal displacement ratio can generate higher COP in magnetocaloric refrigeration cycle.
From simple analytical comparison, it is expected that plate type regenerators can generate the highest cooling capacity
and COP. The regenerator with smaller hydraulic diameter has higher performance, but 0.3mm hydraulic diameter
has been chosen in this paper due to manufacturing limitation.
In addition, this paper has investigated the effect of the length of the regenerator, the cycle frequency and the
regenerator’s porosity on heat transfer phenomena in the regenerator. The cycle frequency has a large effect on cooling
capacity and system efficiency while the effects of length and porosity of the regenerator are marginal. For the plate-
type regenerator with 0.3mm hydraulic diameter, the system with 0.2m length of the regenerator, 0.45Hz cycle
frequency and 0.5 porosity has the highest COP of 2.3 to generate 100W kg-1 cooling capacity for a temperature lift
of 20°C. This paper provides detailed information of heat transfer phenomena in the solid-state cooling cycles, which
need to be understood thoroughly in order to efficiently utilize caloric effects.
1. INTRODUCTION
Magnetocaloric refrigeration has been emphasized as alternative with the best experimentally achieved exergy
efficiency among 20 different technologies (Brown and Domanski, 2014). Elastocaloric refrigeration represents the
most promising alternative, and magnetocaloric refrigeration is a very promising alternative for future applications
(Goetzler et al., 2014). Also, many companies have developed magnetic cooling systems. The reasons are that the
technology has theoretically high efficiency and does not cause any environmental problem, such as global warming
effect due to conventional vapor compression cycles.
However, the regenerator in the solid-state cooling system undergoes cyclic temperature changes. The cyclic
temperature change causes cyclic losses because the regenerator needs to recover its original temperature. This
characteristic is different from vapor compression cycle. In the vapor compression cycle, hot spot always stays hot
and cold spot always stays cold. That’s the reason why different heat exchanger designs are required for solid-state
cooling system. Also, there is another difference. In the vapor compression cycle, higher flow rate can make higher
cooling or heating effect due to the higher heat transfer coefficient. However, in solid-state cooling, higher mass flow
rate does not guarantee higher cooling or heating effects because flow is laminar in regenerator. Moreover, too high
flow rate decreases cooling and heating capacity, because high flow rate can decrease temperature gradient in the
regenerator by mixing cold and hot side fluid. This is another reason why very different heat exchanger design is
required for solid-state cooling system. Therefore, this paper has investigated the heat transfer phenomena between
solid and liquid in the regenerator and the optimized regenerator design for solid-state caloric cycles.
18th International Refrigeration and Air Conditioning Conference at Purdue, May 24-28, 2021

Piston Magnet
Regenerator
Magnet
HTC (W m·2 K ·1) Cooling capacity (W) COP
25 180 3
20 2.5
15 120 2
I I I 1.5
I 10 I 60 I l 5 0.5
0 0 0 0.4mm 0.31lllll 0.2mm 0.4mm 0.3mm 0.21lllll 0 .41lllll 0. 31lllll 0. 21lllll
210035, Page 2
Figure 1: Schematic of modeled solid-state caloric cooling cycle
2. NUMERICAL MODEL
2.1 Schematic of solid-state caloric cooling cycle Figure 1 shows the schematic of the modeled solid-state caloric cooling cycles. The system is made up of a regenerator,
two heat exchangers (cooling heat exchanger and heating heat exchanger) and a permanent magnet. The regenerator
is filled with plate type of magnetocaloric material (MCM) through which heat transfer fluid (HTF) passes. The
regenerator is magnetized and demagnetized repeatedly by entering and exiting a magnetic field caused by a moving
permanent magnet. The performance of this cycle using 2 Tesla of magnetic field is investigated using 1D model.
2.2 Correlations of heat transfer coefficient and pressure drop in parallel plate This paper has used Nickolay and Martin correlation (2002) for heat transfer coefficient given in Equation (1) and
Shah correlation (1974) for friction factor given in Equation (2). They are chosen because they include both developing
and developed regions and are known as more accurate than any other correlation.
▪ Nickolay and Martin (2002) 1/3.592 3.592 = [7.5413.592 (1) 𝑁𝑢𝐷 + (1.841 ∙ 𝐺𝑧1/3) ]
▪ Shah (1978)
3.44 24 + 0.674/(4𝑥+) − 3.44/(𝑥+)1/2
𝑓 ∙ 𝑅𝑒 = 4 × ( + ) (2) (𝑥+)1/2 1 + 0.000029 ∙ (𝑥+)−2
2.3 Selection of hydraulic diameter Many researches have used very small hydraulic diameter of regenerator, such as 0.05mm or 0.1mm, in their models
for solid-state caloric cooling cycles, because a decrease in hydraulic diameter increases heat transfer coefficient and
specific surface area, which cause an increase in cooling capacity and cycle efficiency as shown in Figure 2. Figure 2
Figure 2: Heat transfer coefficient, cooling capacity and COP for the hydraulic diameter of 0.2, 0.3 and 0.4mm
18th International Refrigeration and Air Conditioning Conference at Purdue, May 24-28, 2021

Table 1: Nusselt number and friction factor for different type of regenerator (Laminar & L >> 𝑑ℎ)
Friction factor Compared
w/ base Nu
Compared w/ base
Circular (Base) 64/Re - 3.66 -
Rectangular 57/Re 89 % 3.55 97 %
Plate 96/Re 150 % 7.54 206 %
210035, Page 3
shows the heat transfer coefficient, cooling capacity and COP for the hydraulic diameter of 0.2, 0.3 and 0.4mm when
using same volume of regenerator. However, there is the limitation of hydraulic diameter because of the manufacturing
limitation.
Tušek et al. (2012) used 0.2 mm hydraulic diameter for his parallel-plate type of regenerator which is manufactured
by laser welding technology and Kirol and Dacus (1987) used the parallel-plate regenerator with 0.25mm hydraulic
diameter which made by the photochemical machining. The hydraulic diameter of 0.3 ~ 0.4mm is known as the
minimum value in the industrial field. Therefore, this paper has used the hydraulic diameter of 0.3mm.
3. RESULTS AND DISCUSSION
3.1 Comparison of difference type of regenerator Table 1 shows Nusselt number and friction factor for different micro-channel type of the regenerator when flow is
laminar, and the length of regenerator is much the larger hydraulic diameter of channel. The geometric type of the
regenerator is directly related to the heat transfer coefficient and friction factor as shown in Table 1. Therefore, the
effect of type of regenerator on the system performance can be simply anticipated by checking their Nusselt number
and friction factor and the effect of Nusselt number and friction factor on the system performance when other
parameters, such as mass flow rate, cycle frequency, specific surface area, volume of regenerator and porosity which
are not related to the geometry of regenerator are fixed. It is known that the effect of heat transfer coefficient on the
system performance is 1.5 to 2.0 times higher than the effect of friction factor. The plate type of regenerator is expected
to have the highest system efficiency among three different type of regenerator because it has almost two times higher
Nusselt number although it also has the highest friction factor. Therefore, this paper has used the plate type of
regenerator for solid-state caloric cooling cycle.
3.2 Consideration of developing regions Table 2 and Table 3 represent operating conditions and performance results to compare the model including
developing regions with the model neglecting developing regions. When cycle frequency is 1Hz, two model are similar
to each other but when cycle frequency is 5Hz, the results of two model are very different as shown in Table 2. This
is because developing regions comprise larger part of blow period at 5Hz than at 1Hz. An increase rate of Nu is bigger
Table 2: Operating conditions
Length (m) 0.2
Porosity (-) 0.6
Cycle frequency (Hz) 1 5 -2 -1)Mass flux (kg m s 150 250
Table 3: Performance results of the model neglecting developing regions and the model including developing
regions (1Hz and 5Hz)
1Hz 5Hz
Neglecting
developing
regions
Including
developing
regions
Neglecting
developing
regions
Including
developing
regions
COP (-) 1.37 1.38 0.22 0.35
Qc/MCM (W kg-1) 123 125 49 78
Nu (-) 7.5 7.7 7.5 8.2
Pressure drop (Pa) 18 19 29 31
18th International Refrigeration and Air Conditioning Conference at Purdue, May 24-28, 2021

£
8.0
, ..
80 10
10
'0
1.0
o o Dimensionless length
' 0
0 O Olmeosionless length
210035, Page 4
(a) (b)
Figure 3: Nu for (a) model neglecting developing regions and (b) model including developing regions during
cold to hot blow period
(a) (b)
Figure 4: Friction factor for (a) model neglecting developing regions and (b) model including developing regions
during cold to hot blow period
than increase rate of pressure drop (Nu: 9.3%, pressure drop: 5.4%) because thermal entrance length is longer than
hydrodynamic entry length due to relatively large Prandtl number of water. Therefore, when cycle frequency is high,
developing regions should be considered in model. Figure 3 and Figure 4 show Nu and friction factor for (a) model
neglecting developing regions and (b) model including developing regions during cold to hot blow period. These
graphs represent developing regions of entrance of regenerator as well as after flow direction is changed.
3.3 Mass flux (Displacement ratio) Table 4 shows operating conditions and Figure 5 shows COP and cooling and heating capacity along mass flux. When
other conditions are fixed and only mass flux changes, mass flux is directly proportional to the displacement ratio (��). The displacement ratio is given in Equation (3), which is the ratio of the volume of the displaced fluid to the total
volume of fluid in the regenerator as shown in Figure 6.
𝑉𝑓,𝑑𝑖𝑠𝑝𝑙𝑎𝑐𝑒𝑑
𝑉 = (3) 𝑉𝑓
Thus, the performance change graph of mass flux is similar to that of the displacements. When mass flux is low and
increased, the temperature difference between MCM and HTF is maintained and heat transfer is increased as new
fluids are introduced rapidly. Therefore, cooling and heating capacity increases. However, further increase of mass
flux eventually leads to very cold fluid flowing into the hot side of generator and very warm fluid entering the cold
Table 4: Operating conditions
Temperature span 20°C (5 – 25°C)
Frequency 0.45Hz
Porosity 0.6
Hydraulic diameter 0.0003m
18th International Refrigeration and Air Conditioning Conference at Purdue, May 24-28, 2021

2.5
2.0
~
' 1.5
~
~ 0 u LO
0.5
0.0 25
2 1.5
Q,.
0 u
0.5
0 0
...... - - - - -.. _ -
- • - COP ( cooling)
--- Qc/kgofMCM
- Qh/kgofMCM
50 75 100 125 150 mass flux (kg s·1 m·2)
I ---- ------.
' ' Start of blow period
-+ L _________ J -+ -------7
End of blow period
20
lB) Vf,displaced
' _______ J
,----: V L---- [ ,total
40 60 80 Cooling capacity / mass of MCM (W kg·')
180
"' 160 "' " = 140 .. .,
C. ..... 120 c~ ·c JI
100 a~ i;~
80 l>J)~
.s u -..~ 60 ~~
~ 40 l>J)
= 20 ~
0 u 0
175 200
100 120
210035, Page 5
Figure 5: COP, cooling & heating capacity versus mass flux
Figure 6: Volume of the displaced fluid and total volume of fluid in the regenerator
Figure 7: COP versus cooling capacity / mass of MCM
side of generator, reducing the temperature inside the register and eventually reducing cooling and heating capacity.
COP also increases at the beginning of mass flow increase. It tends to decrease in the latter half. This is because the
thermal conductivity change rate of the water is greater when the temperature is lower than when the temperature is
high. In other words, when the thermal conductivity is low, the change rate of HTC is high and when the change rate
of the thermal conductivity is high the change rate of HTC is low. As a result, when the water temperature entering
the CHX decreases and the water temperature entering the HHX increases, the former shows a greater variation than
the latter, indicating increasing the COP. However, when the water temperature entering the CHX increases and the
water temperature entering the HHX decreases, the COP decreases. In addition, higher mass flux causes higher
pressure drop. Therefore, COP is a function of heat transfer coefficient, pressure drop and displacement ratio. Higher
heat transfer coefficient, lower pressure drop and the optimal displacement ratio can generate higher COP in
magnetocaloric refrigeration cycle.
Figure 7 represents COP versus cooling capacity per mass of MCM. This paper has often used this type of graph
because it can represent COP and cooling capacity together, making it easy to compare graphs under different
conditions. In this graph, the x-axis is cooling capacity per mass of magnetocaloric material. Therefore, it is easy to
18th International Refrigeration and Air Conditioning Conference at Purdue, May 24-28, 2021

2.5
1.5 ~
~ ········· 100mm ~ 0 u - - - 200mm
--300mm
0.5 -·- 400mm
- - SOOmm 0
0 20 40 60 80 100 120
Cooling capacity / mass ofMCM (W kg·1)
3-00 ..... 0.5 --+-mass flux "ie. e..., 250 -+-dissipation loss -" - 0.4 ~
-+-conduction loss ._ ,,, "'
NS 200 --vise. + cond.Ioss = ]
~ ..... 0.3 " :,
150 -0
"' = :, 0 ,::: 0.2 U ,,,
~ ,,, 100
" = e ~ 0.1 " 50 C.
·:;; .:a Q
0 ~- 0 100 150 200 250 3-00 350 400 450 500
Length of regenerator (mm)
210035, Page 6
calculate how much mass of MCM is needed to generate certain cooling capacity under different conditions. Also,
this paper has used 100 W kg-1 of MCM as standard to compare different conditions, because it is known as the
moderate and subsequently cooling capacity and COP decreases. This graph features show that there are two mass
flux points that can generate a constant cooling capacity and therefore two COPs. In general, the only upper graphs
with higher efficiency have been used to compare the efficiency of other conditions.
cooling capacity. As Figure 7 shows, as mass flux increases, the graph heads to the upper right, to the lower right and
finally to the lower left. This is because COP and cooling capacity increases at the beginning and then COP decreases.
3.4 Length of regenerator Many papers have shown the effect of aspect ratio on the system performance. However, if the hydraulic diameter is
fixed in the channel type of the regenerator, the effect of height and width of the regenerator on system performance
is just superposed. Therefore, it is reasonable to look at the effects of length than aspect ratio of regenerator rather.
Figure 8 shows the COP versus cooling capacity for various length. Figure 9 represents the optimal mass flux to
generate maximum cooling capacity, dissipation loss, conduction loss and total loss for different length. Loss effect
in the Figure 9 means the percentage of loss to total heat transfer between MCM and HTF during one blow period.
The regenerator with higher length needs higher mass flux to reach the optimal displacement ratio, which causes an
increase in pressure per unit length. Therefore, a dissipation loss increases as length of regenerator increases. It can
also be seen that the temperature gradient ratio decreases as the length increases and so the conductive loss per length
decreases until they are all at 200mm. However, after that, the effect of the increase in mass flux cancels out the
decrease in the temperature gradient ratio. Therefore, total loss is the minimum when the length is about 200mm, and
the performance is then the highest. However, both are pretty small compared to heat transfer between MCM and
HTF. Length of regenerator has little effect on system performance.
Figure 8: COP versus cooling capacity for various length
Figure 9: Optimal mass flux, dissipation loss, conduction loss and total loss for various length of regenerator
18th International Refrigeration and Air Conditioning Conference at Purdue, May 24-28, 2021

~ u ~ .... 0
~
" = ;;--;,~ :a ~ .. ~ 0.
" " 01)
= ~ 0 u
2.5
2 Q., 1.5 0 u
0.5
140
120
JOO
80
60
40
20
- · - 5 Hz
1.67 Hz
-- lHz
- · - 0.71 Hz
----- 0.56 Hz
.. .. .. .. . 0.45Hz
--0.38Hz
50
·.---· ~ -.-.
,..-/
JOO
,..- . ...... . / ,..-
....... . --
150 200 mass flux (kg m·2 s·1)
-·-·- ·-·-· -·-·-
- ·- · - · - ·. - ·· - · -::=.·;;- ··
-·-5Hz \
· · 1.67 Hz
--lHz
- · - 0.71 Hz -----0.56 Hz
......... 0.45Hz
--0.38Hz
250 300
Actual working condition
350
~ ., !"'
" 0 0
6' IJQ
" ., "C ., "
~------------------------------------'~ 20
1.67 Hz
--HTF
- - - :\ICM ,
,
t: :,
l , ',, 'f Not enough time
• ':F_,,, 0.03 0.06 0.09 0.12 0.1~
Dimensionless longitmlinal position
~ ~ ~ ~
Cooling capacity / mass ofMCM (W kg·1)
!Hz
t:
120 140
0.38 Hz
--HTF
--- MCM
Appropriate time i ,,--t-- , , ., 7 ' c. 1, ,' Too much time e .. _ , ~
6
5 O.OJ 0.06 0.09 0.12 0.15 0 0.03 0.06 0.09 0. 11
Dimensionless longitudinal position Dimensionless longitudinal position 0.15
210035, Page 7
Figure 10: Cooling capacity versus mass flux for various frequency
Figure 11: COP versus cooling capacity for various frequency
(a) (b) (c)
Figure 12: Temperature gradient of MCM and HTF at the end of hot to cold blow
of (a) 1.67Hz (b) 1Hz (c) 0.38Hz
(using different mass flux for each frequency to generate maximum cooling capacity)
3.5 Cycle frequency Figure 10 and figure 11 show cooling capacity versus mass flux and COP versus cooling capacity for various
frequency, respectively. The frequency sensitively affects cooling capacity and system efficiency. If cycle time is too
long, MCM and HTF already are in thermal equilibrium at the end of blow period and system uselessly spends pump
power, because there is no heat transfer between MCM and HTF. Also, hot fluid enters cold side of regenerator and
decreases temperature of cold side during hot to cold blow, thereby decreasing temperature difference between cold
18th International Refrigeration and Air Conditioning Conference at Purdue, May 24-28, 2021
2.6
2.4
2.2
~
~
~ 1.8 0 u
1.6
1.4
1.2
50
1.8
1.6
1.4
1.2
I 0.4
----------- ····· ··--- -- --~~-~~ -----
········· Porosity 0.4
- - - Porosity 0.5
- · - Porosity 0.6
--Porosity 0.7
60
----------- ---
70 80 90
Cooling capacity / mass ofMCM (W kg·')
Total HT from MCM to HTF / mass of MCM (kJ kg 1)
0.5 0.6
Porosity (-)
100 llO
0.7
210035, Page 8
and hot side of regenerator and cooling capacity, and vice versa. If cycle time is too short, there is no enough time for
heat transfer between MCM and HTF. Therefore, it could decrease temperature difference between cold and hot side
of regenerator and cooling capacity. Also, COP could decrease because magnetic power cannot be used efficiently.
When frequency increases (cycle time decreases), the optimal mass flux to generate maximum cooling capacity
increases as shown in Figure 10, which is related to displacement ratio. When frequency increases, maximum cooling
capacity increases because only coldest fluid can enter into the cold side heat exchanger. If frequency further increases,
time is limited for heat transfer and temperature of HTF cannot be decreased enough. The COP to generate maximum
cooling capacity increases with an increase in cycle time. The system with frequency of 0.45Hz can generate 100W
kg-1 cooling capacity with COP of 2.25. Based on figure 11, the AMRRC cycle can be controlled using system
frequency. It is difficult to change length of the regenerator while system is operating, but the AMRRC system can
easily change the cycle frequency to get optimized COP at the required cooling capacity.
Figure 12 represents temperature profiles of MCM and HTF in the regenerator at the end of hot to cold blow for cycle
frequency of 1.67Hz, 1Hz and 0.38Hz. From these graphs, it can be noticed that 1.67Hz cycle frequency does not have
enough time to transfer heat between HTF and MCM so they are not in thermal equilibrium at at the end of hot to cold
blow and only very cold fluid neat the cold side of the regenerator can enter the CHX. Therefore, the system with
1.67Hz can generate higher cooling capacity but lower COP, because it cannot efficiently use caloric effect. However,
vice versa for 0.38Hz cycle frequency because it has too much time for heat transfer between MCM and HTF.
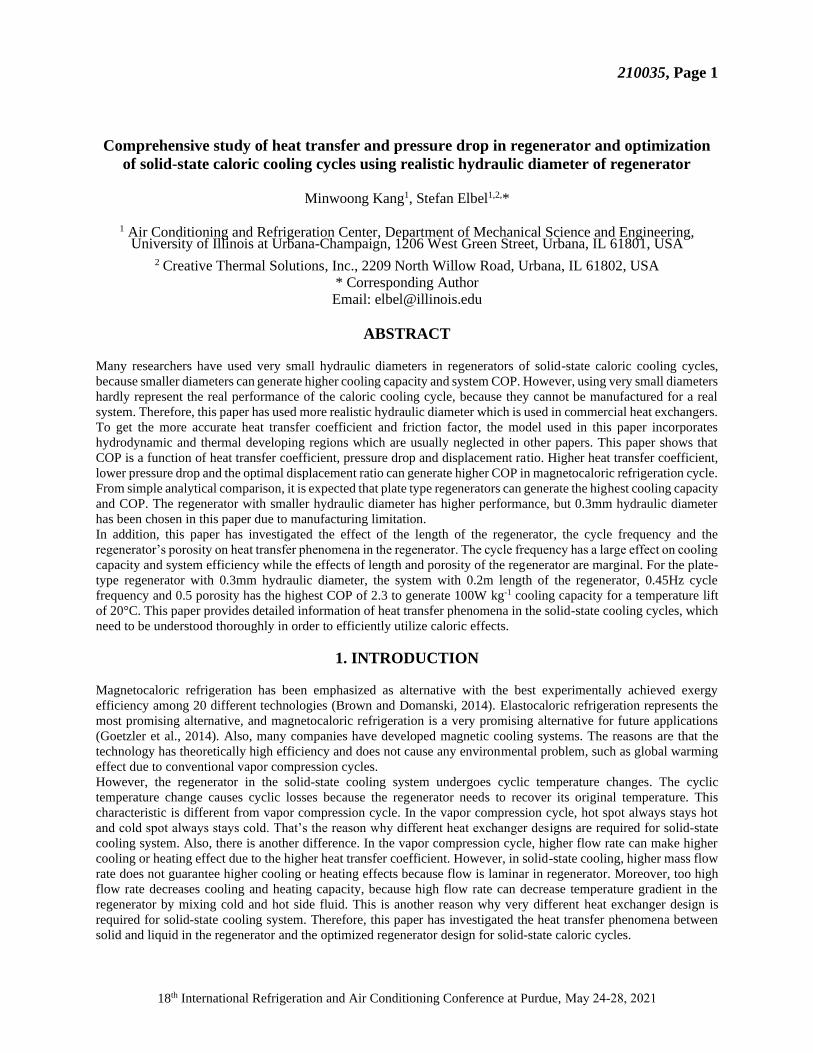
3.6 Porosity Figure 13 and 14 show the temperature gradient of MCM and HTF at the end of hot to cold blow and total heat transfer
between MCM and HTF per mass of MCM during one blow period, respectively. Porosity affects specific surface
area (=heat transfer area / volume) and magnetocaloric effect. As porosity increases, specific surface area increases
Figure 13: Temperature gradient of MCM and HTF at the end of hot to cold blow
Figure 14: Total heat transfer between MCM and HTF per mass of MCM during one blow period
18th International Refrigeration and Air Conditioning Conference at Purdue, May 24-28, 2021

porosity ■ 1.5-1.6 ■ 1.6-1.7
■ 1.7-1.8 1.8-1.9
■ 1.9-2 ■ 2-2.1
2.3 ■ 2.1-2.2 ■ 2.2-2.3
2.2
2.1
~ 2 0 1.9 u
0.4 1.8
1.7 0.36 '-' 1.6 .c
0.2 0!) 1.5 = .. 0.45
'"'" 0.56
0.71 0.1
Frequency (Hz) 1.00
210035, Page 9
Figure 15: COP along cycle frequency and length of regenerator at 0.5 porosity (100 W kg-1)
but caloric effect decreases due to a decrease in mass of MCM. As porosity increases total heat transfer between MCM
and HTF per mass of MCM increases due to the increase in specific area. However, total heat transfer decrease after
0.5 porosity because the caloric effect decreases. Therefore, Regenerator with porosity of 0.5 has biggest heat transfer
from MCM to HTF per mass of MCM and the highest COP to generate 100W kg-1.
Figure 15 shows COPs as a function of cycle frequency and length of regenerator at 0.5 porosity and the regenerator
with 200mm length, 0.45Hz cycle frequency and 0.5 porosity has the highest COP of 2.28 to generate 100W kg-1
cooling capacity under the temperature span of 20˚C (5 ~ 25).
4. CONCLUSIONS
This paper has incorporated heat transfer coefficient of Nickolay and Martin correlation (2002) and friction factor of
Shah correlation (1974) to take into account developing region. This paper has used these equations for not only entry
developing region but also the developing region after changing flow direction. There is no paper which consider both
developing regions. The model including the developing regions has similar heat transfer coefficient and friction factor
to those of the model neglecting them when cycle frequency is low. However, as frequency increases the difference
between both models increases. When cycle frequency is 5Hz, the Nu of former model is 9.3% higher than the Nu of
latter model. Pressure drop increases by 5.4% when using new model. Therefore, when system has high cycle
frequency, both developing regions should be considered. This is meaning result because the performance of solid-
state caloric cooling system is dependent on heat transfer coefficient. Moreover, as heat transfer coefficient increases,
optimal cycle frequency increases.
As mass flux increases, cooling capacity, heating capacity and COP increase and then decrease again. This is because
when mass flux increases at the first time, heat transfer increases. Therefore, cooling and heating capacity increase.
However, when mass flux increases further, cold fluid enters into hot side and hot fluid enters into cold side. Therefore,
cooling and heating capacity decrease again. Furthermore, the reason of COP change trend is the change rate of
thermal conductivity of water. As length of the regenerator increase, optimal mass flux to reach to the optimal
displacement ratio increases and temperature gradient rate decreases. Therefore, conduction loss decreases and
dissipation loss increases. Finally, the regenerator with 200mm has the smallest total loss and the most efficient to
generate 100W kg-1 of MCM. However, the length of the regenerator has little effect on system performance. It is
noticed that the cycle frequency has significant effect on cooling capacity and COP. This is because the cycle
frequency affects the amount of heat transfer fluid entering the regenerator, heat transfer between fluid and solid and
outlet temperature of fluid. Especially, high frequency does not allow enough time for heat transfer and temperature
gradient in the regenerator is decreased at low frequency. Therefore, it is necessary to find appropriate cycle frequency
to increase system efficiency. It is also noticed that cycle frequency can be easily controlled to get the required cooling
capacity and optimized COP. As porosity increases specific heat transfer area increases but total magnetocaloric effect
18th International Refrigeration and Air Conditioning Conference at Purdue, May 24-28, 2021

210035, Page 10
decreases. Therefore, porosity should be optimized to increase system efficiency. For plate type of regenerator with
0.3mm hydraulic diameter, the regenerator with 200mm length, 0.45Hz cycle frequency and 0.5 porosity has highest
COP of 2.3 to generate 100W kg-1 cooling capacity under the temperature span of 20˚C. Finally, by applying univariate
method this regenerator has been verified as optimal point.
REFERENCES
Abraham, J. P., Sparrow, E. M., & Minkowycz, W. J. (2011). Internal-flow Nusselt numbers for the low-Reynolds-
number end of the laminar-to-turbulent transition regime. Int. J. Refrig., 54, 584-588.
Aprea, C., Greco, A., & Maiorino, A. (2013). The use of the first and of the second order phase magnetic transition
alloys for an AMR refrigerator at room temperature: A numerical analysis of the energy performances. Energy
Conversion and Management, 70, 40-55.
Barclay J. A., Steyert W. A. (1982). Active magnetic regenerator. US Patent No 4.332.135
Brown, J. S., & Domanski, P.A. (2014). Review of alternative cooling technologies. Applied Thermal Engineering,
64, 252–262.
Dixon, A. G., & Cresswell, D. L. (1979). Theoretical predictions of effective heat transfer mechanisms in regular
shaped packed beds. AIChE Journal, 25, 663–676.
Engelbrecht, K. (2004). A numerical model of an active magnetic regenerator refrigeration system. (Masters
dissertation), The University of Wisconsin-Madison.
Goetzler, W., Zogg, R., Young, J., & Johnson, C. (2014). Alternatives to vapor-compression HVAC technology.
ASHRAE J. 56 (10), 12-23.
Kirol, L. D. & Dacus, M. W. (1987). Rotary recuperative magnetic heat pump. Cryogenic engineering conference
(757–765), St. Charles, IL, USA
Kitanovski, A., Egolf, P. W., & Poredoš, A., (2012). Rotary magnetic chillers with permanent magnets. Int. J. Refrig.,
35(4), 1055–1066
Kitanovski, A., Tusek, J., Tomc, U., Plaznik, U., Ozbolt, M., & Poredos, A. (2015). Magnetocaloric energy
conversion. New York: Springer
Petersen, T. F., (2007). Numerical modelling and analysis of a room temperature magnetic refrigeration system. (PhD
thesis), Technical University of Denmark, Departmant of energy conversion and storage, Denmark
Nickolay, M. & Martin, H. (2002). Improved approximation for the Nusselt number for hydrodynamically developed
laminar flow between parallel plates. Int. J. Heat & Mass Transf. 45, 3263-3266
Petersen, T. F., Pryds, N., Smith, A., Hattel, J., Schmidt, H, & Knudsen, H. H. (2008). Two-dimensional mathematical
model of a reciprocating room-temperature active magnetic regenerator. Int. J. Refrig., 31, 432-443.
Shah, R. K. (1978). A correlation for laminar hydrodynamic entry length solutions for circular and noncircular ducts.
J. Fluids Eng. 100, 177-179
Steyert W. A. (1978). Stirling-cycle rotating magnetic refrigerators and heat engines for use near room temperature. J
Appl Phys, 49, 1216–1226
Tishin, A. M., Gschneidner, K. A., & Percharsky, V. K. (1999). Magnetocaloric effect and heat capacity in the phase-
transition region. Physical review B, 59(1), 503-511
Tušek, J., Kitanovski, A., Tomc, U., Favero, C. & Poredos, A. (2014) Experimental comparison of multi-layered La-
fe-Co-Si and single-layered Gd active magnetic regenerators for use in a room-temperature magnetic refrigerator. Int
J Refrig, 37, 117–126
Wakao, N., & Kaguei, S. (1982) Heat and Mass Transfer in Packed Beds, New York: Gordon and Breach.
Engelbrecht, K. (2008). A numerical model of an active regenerator refrigerator with experimental validation
(Doctoral dissertation). The University of Wisconsin-Madison.
Wu, J., Liu, C., Hou P., Huang, Y., Ouyang, G., & Chen, Y. (2014). Fluid choice and test standardization for magnetic
regenerators operating at near room temperature. Int. J. Refrig., 37, 135–146
ACKNOWLEDGEMENT
The authors would like to thank the member companies of the Air Conditioning and Refrigeration Center at the
University of Illinois at Urbana-Champaign for their financial and technical support. The authors would like to thank
Creative Thermal Solutions, Inc. (CTS) for providing technical support and equipment.
18th International Refrigeration and Air Conditioning Conference at Purdue, May 24-28, 2021