computational design and performance prediction of creep ... library/events/2017/crosscutting... ·...
TRANSCRIPT

Computational Design and Performance Prediction of Creep-
Resistant Ferritic Superalloys(FE0024054)
Investigators: Peter K. Liaw1, David C. Dunand2, and Gautam Ghosh2
Collaborator: Chuan Zhang3
Students: Shao‐Yu Wang1, Zongyang Lyu1, Gian Song1, Zhiqian Sun1, Michael Rawings2,
and Sungil Baik2
1The University of Tennessee, Knoxville (UTK)2Northwestern University (NU)
3CompuTherm, LLC (CTL)
1

Acknowledgements
(1) Richard Dunst(2) Vito Cedro(3) Patricia Rawls(4) Robert Romanosky(5) Regis Conrad(6) Jessica Mullen(7) Mark D. Asta (8) C. T. Liu(9) Nicholas Anderson, for their kind support and encouragement, and (11) National Energy Technology Laboratory (NETL) for sponsoring this
project
2

Outline
Technical Background of the ProjectMethodsCurrent Progress Modeling & Calculations Experimental Results
Papers, Presentations, and AwardsSummaries and Current StatusFuture Plan
3

Technical Background of the Project
Plants operating above 22 MPa at 538 to 565 oC are ”supercritical”, and above 565 oC are “ultra‐supercritical (USC)”.
• Viswanathan, Henry, Tanzosh, Stanko, Shingledecker, Vitalis, Purgert, 2005, and Swanekamp, 2002
US-DOE Advanced Power SystemGoal 60% efficiency from coalgeneration Steam condition: 760 oC- 35 MPa
Each 1% increase in efficiencyeliminates ~1,000,000 tons of CO2emissions over the lifetime of an800-MW plant.
4
Subcritical
Effic
iency Im
prov
emen
t

https://www.netl.doe.gov/File%20Library/Events/2008/fem/Holcomb_pres.pdf
FBB8: Fe-6.5Al-10Cr-10Ni-3.4Mo-0.25Zr-0.005B, weight percent (wt.%)NiAl (B2 phase)Fe (α phase)
Fe Ni
Al
Ni
Al
Ti
Ni2TiAl (L21)
By adding Ti, there will be L21‐Ni2TiAl formed. The creep strength of L21between 753 and 1,000 oC is about three times that of NiAl.
Carbon SteelCrMo Low Alloy Steel9‐12%Cr Steel18%Cr‐8%Ni Steel15%Cr‐8%Ni Steel20‐25%Cr Austenitic SteelHigh Cr‐High Ni Steel
5
Technical Background of the Project (Cont’d)
Carbon SteelCrMo Low Alloy Steel
9‐12%Cr Steel18%Cr‐8%Ni Steel
15%Cr‐8%Ni Steel20‐25%Cr Austenitic Steel
High Cr‐High Ni Steel
G. Song, Z. Sun, J. D. Poplawsky, Y. Gao, P. K. Liaw, Acta Mater., 127 (2017) 1‐16.G. Song, Z. Sun, L. Li, X. Xu, M. Rawlings, C.H. Liebscher, B. Clausen, J. Poplawsky, D.N. Leonard, S. Huang, Z. Teng, C.T. Liu, M.D. Asta, Y. Gao,D.C. Dunand, G. Ghosh, M. Chen, M.E. Fine, and P.K. Liaw, Scientific Report, 5 (2015) 16327.

Objectives:
Based on FBB8 [Fe‐6.5Al‐10Cr‐10Ni‐3.4Mo‐0.25Zr‐0.025B (wt. %)]:• Develop and integrate modern computational tools and algorithms, i.e.,predictive first‐principles calculations, computational‐thermodynamicmodeling, and meso‐scale dislocation dynamics simulations, to designhigh‐temperature alloys for applications in fossil‐energy‐power plants.
• Understand the processing‐microstructure‐property‐performance linksunderlying the creep behavior of novel ferritic alloys strengthened byhierarchical coherent B2/L21 precipitates.
6
Technical Background of the Project (Cont’d)
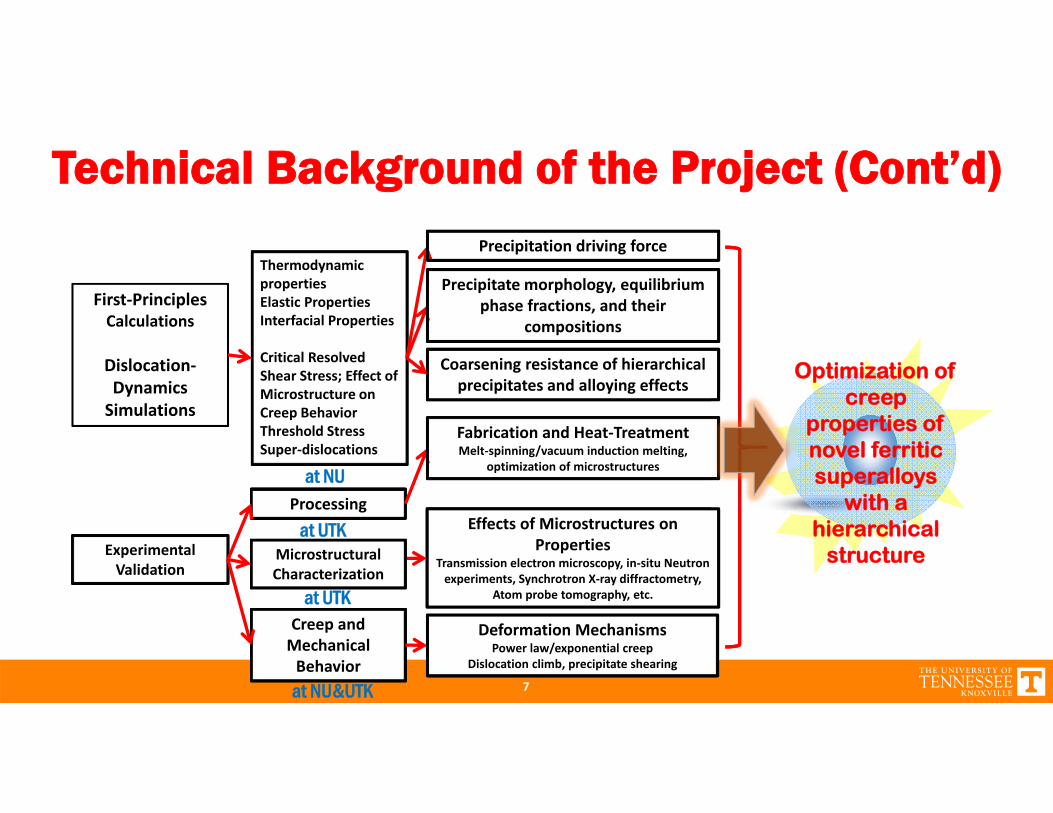
First‐Principles Calculations
Dislocation‐Dynamics Simulations
Experimental Validation
Thermodynamic properties Elastic PropertiesInterfacial Properties
Critical Resolved Shear Stress; Effect of Microstructure on Creep Behavior Threshold StressSuper‐dislocations
Processing
Microstructural Characterization
Creep and Mechanical Behavior
Effects of Microstructures on Properties
Transmission electron microscopy, in‐situ Neutron experiments, Synchrotron X‐ray diffractometry,
Atom probe tomography, etc.
Deformation MechanismsPower law/exponential creep
Dislocation climb, precipitate shearing
Optimization of creep
properties of novel ferritic superalloys
with a hierarchical
structure
Precipitation driving force
Precipitate morphology, equilibrium phase fractions, and their
compositions
Coarsening resistance of hierarchical precipitates and alloying effects
at NU
at UTK
at NU&UTK
at UTK
Fabrication and Heat‐TreatmentMelt‐spinning/vacuum induction melting,
optimization of microstructures
7
Technical Background of the Project (Cont’d)

Methods - Computational - thermodynamic Modeling
• Conducting CALculation of PHAse Diagrams (CALPHAD)
• Requiring database, not available for every system.
• Providing information about phases,volume fractions…etc.
http://www.calphad.com/nickel-chromium.html8
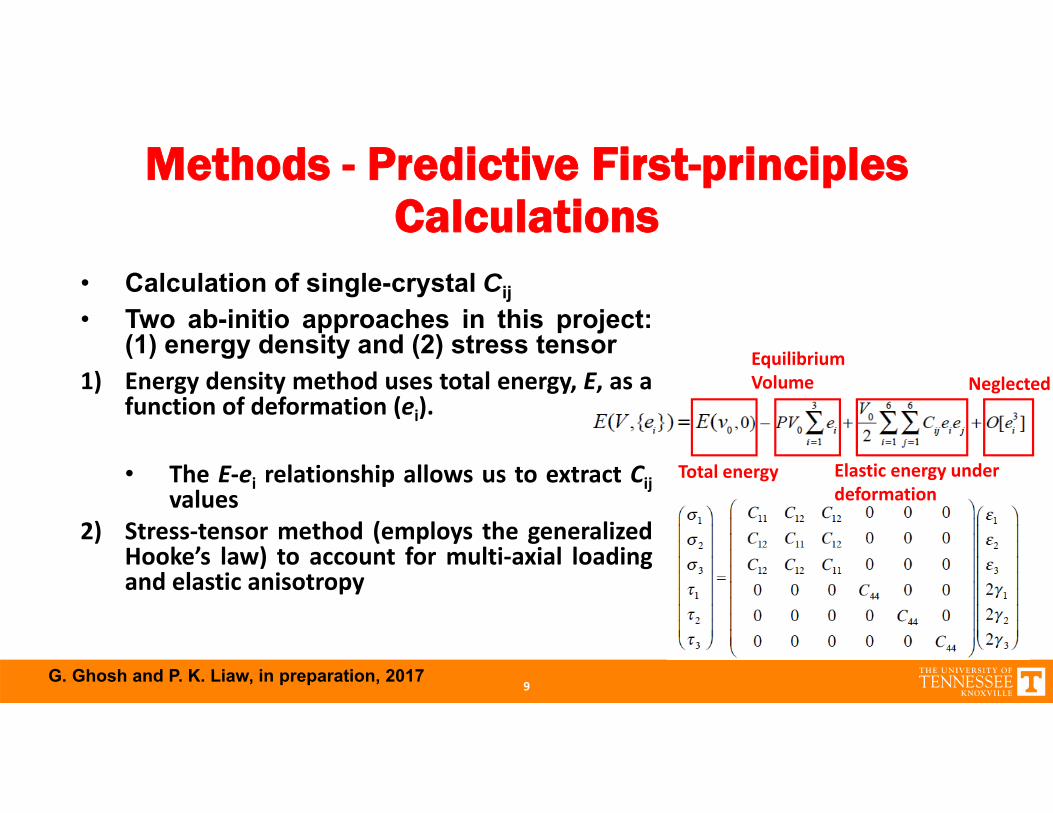
Methods - Predictive First-principles Calculations
• Calculation of single-crystal Cij• Two ab-initio approaches in this project:
(1) energy density and (2) stress tensor1) Energy density method uses total energy, E, as a
function of deformation (ei).
• The E‐ei relationship allows us to extract Cijvalues
2) Stress‐tensor method (employs the generalizedHooke’s law) to account for multi‐axial loadingand elastic anisotropy
G. Ghosh and P. K. Liaw, in preparation, 2017
Total energy
Equilibrium Volume
Elastic energy under deformation
Neglected
9

Methods - Experiments
• All alloy samples homogenized at 1,200 oC for 0.5 hour, and aged at700 oC for 100 hours.
• Microstructural Characterization: scanning‐electron microscopy(SEM), transmission‐electron microscopy (TEM), local electrodeatom‐probe (LEAP), neutron/synchrotron diffraction techniques.
• Mechanical Tests: tensile and compressive creep tests.
10

Current Progress - Brief Summaries
FBB8 + Ti alloys FBB8 + Hf alloys FBB8 + Zr alloys• In‐situ Neutron• TEM• LEAP• Creep Test
• SEM• TEM• LEAP• Creep Test
• SEM
Calculations• First‐principle Calculations on the elastic properties of ‐Fe, B2‐NiAl, and
L21‐Ni2TiAl• CALPHAD Calculations on FBB8 + Ti alloys and FBB8 + Zr alloys
11
G. Song, Z. Sun, J. D. Poplawsky, Y. Gao, c, P. K. Liaw, Acta Mater., 127 (2017) 1‐16.Z. Sun, G. Song, T. Sisneros, B. Clausen, C. Pu, L. Li, Y. Gao, and P. K. Liaw, Scientific Reports 6 (2016) 23137.
M. J. S. Rawlings, C. H. Liebscher, M. Asta, D. C. Dunand, Acta Mater., 128 (2017) 103‐112.
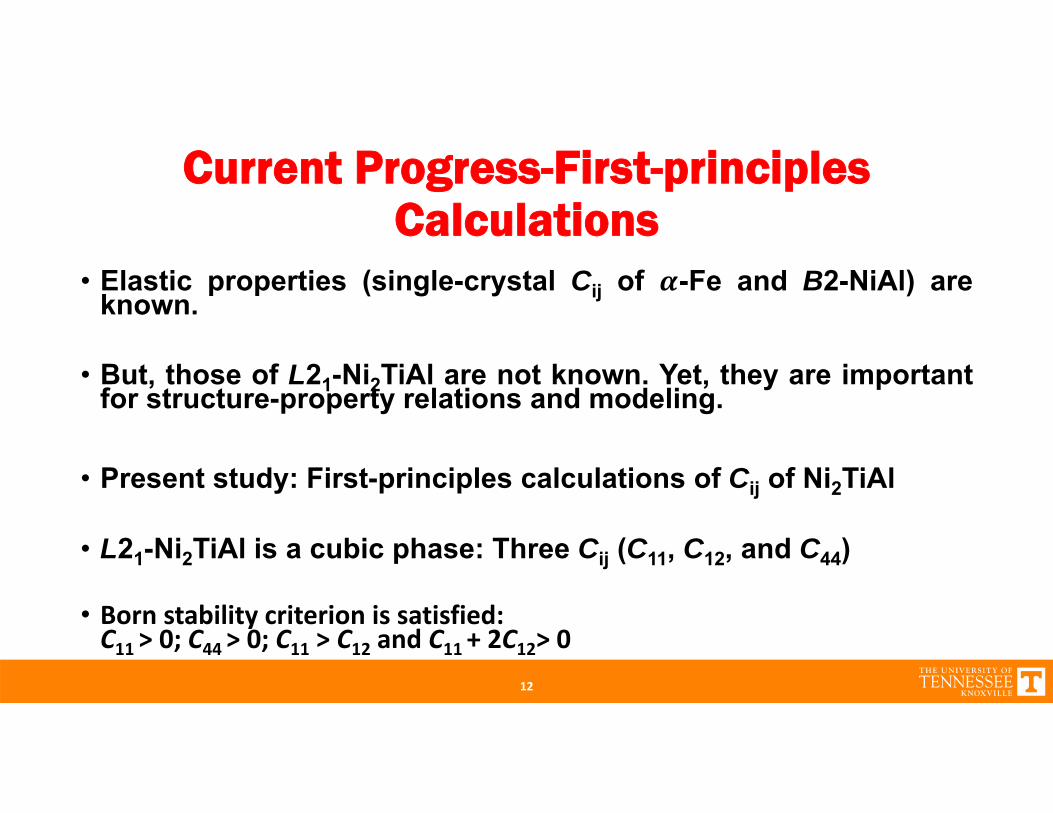
Current Progress-First-principles Calculations
• Elastic properties (single-crystal Cij of -Fe and B2-NiAl) areknown.
• But, those of L21-Ni2TiAl are not known. Yet, they are importantfor structure-property relations and modeling.
• Present study: First-principles calculations of Cij of Ni2TiAl
• L21-Ni2TiAl is a cubic phase: Three Cij (C11, C12, and C44)
• Born stability criterion is satisfied: C11 > 0; C44 > 0; C11 > C12 and C11 + 2C12> 0
12
13
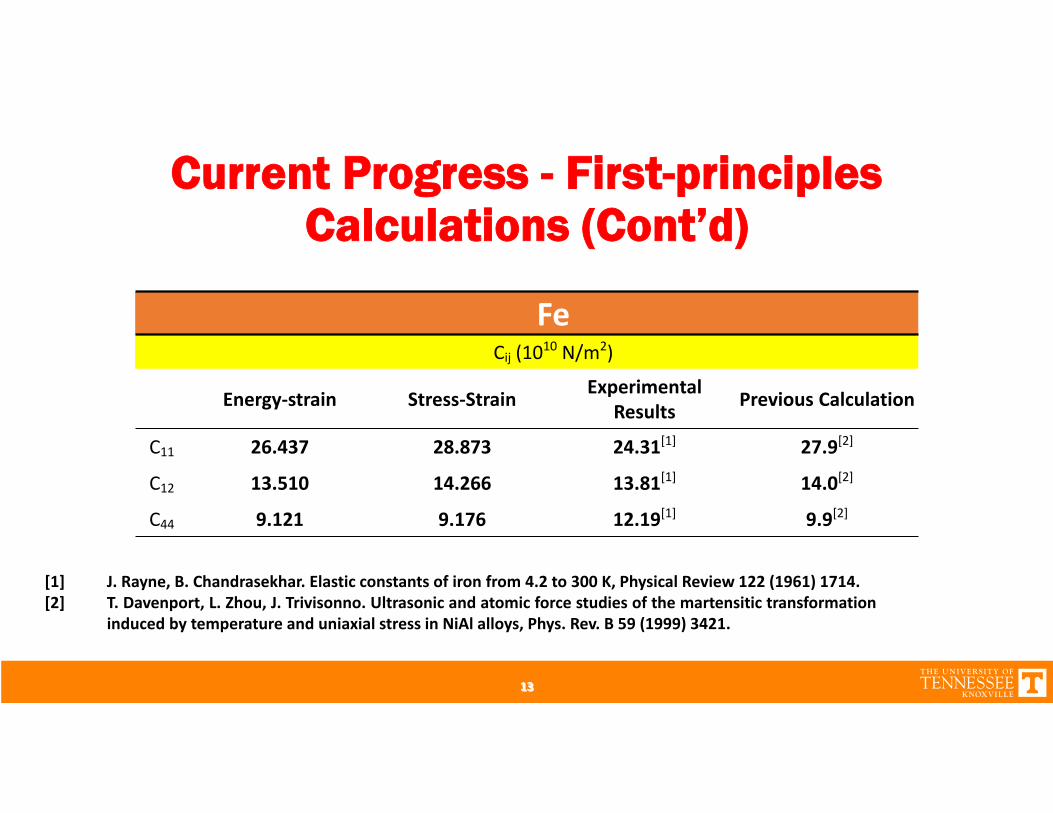
Current Progress - First-principles Calculations (Cont’d)
FeCij (1010 N/m2)
Energy‐strain Stress‐Strain Experimental Results Previous Calculation
C11 26.437 28.873 24.31[1] 27.9[2]
C12 13.510 14.266 13.81[1] 14.0[2]
C44 9.121 9.176 12.19[1] 9.9[2]
[1] J. Rayne, B. Chandrasekhar. Elastic constants of iron from 4.2 to 300 K, Physical Review 122 (1961) 1714.[2] T. Davenport, L. Zhou, J. Trivisonno. Ultrasonic and atomic force studies of the martensitic transformation
induced by temperature and uniaxial stress in NiAl alloys, Phys. Rev. B 59 (1999) 3421.
13

14
Current Progress - First-principles Calculations (Cont’d)
B2‐NiAlCij (1010 N/m2)
Energy‐strain Stress‐Strain Experimental Results Previous Calculation
C11 20.730 20.844 20.67[4] 23.3[3], 23.6[5], 17.23[6]
C12 13.548 13.571 13.54[4] 17.3[3], 16.7[5], 14.6[6]
C44 11.618 11.720 11.68[4] 11.5[3], 14.0[5], 10.03[6]
[3] G. Guo, H. Wang. Gradient‐corrected density functional calculation of elastic constants of Fe, Co and Ni in bcc, fcc and hcpstructures, Chin. J. Phys 38 (2000) 949‐961.
[4] X. Huang, I.I. Naumov, K.M. Rabe. Phonon anomalies and elastic constants of cubic NiAl from first principles, Phys. Rev. B 70(2004) 064301.
[5] H. Fu, D. Li, F. Peng, T. Gao, X. Cheng. Ab initio calculations of elastic constants and thermodynamic properties of NiAl underhigh pressures, Computational Materials Science 44 (2008) 774‐778.
[6] J.F. Nye. Physical properties of crystals: their representation by tensors and matrices, Oxford university press, 1985.14

Current Progress - First-principles Calculations (Cont’d)
L21‐Ni2TiAlCij (1010 N/m2)
Energy‐strain Stress‐Strain Experimental Results
Previous Calculation
C11 21.169 22.459 None None
C12 14.347 13.725 None None
C44 8.139 9.192 None None
1515
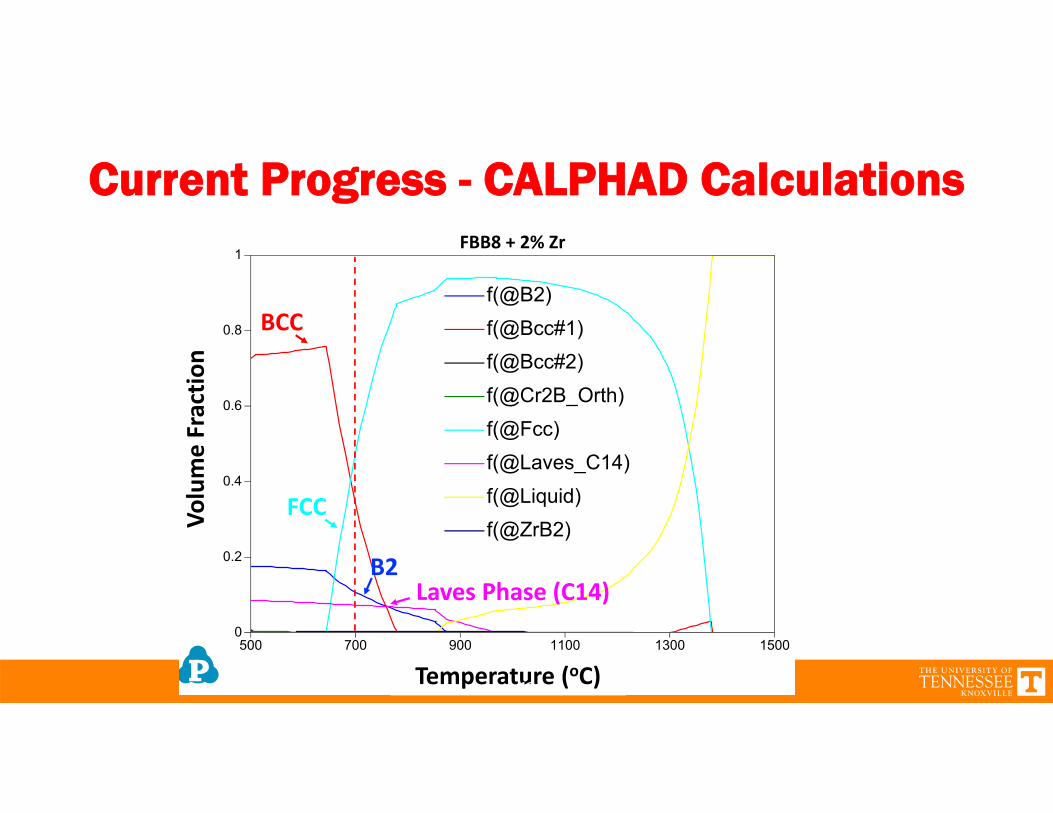
Current Progress - CALPHAD Calculations
500 700 900 1100 1300 15000
0.2
0.4
0.6
0.8
1
T[C]
f(@B2)f(@Bcc#1)f(@Bcc#2)f(@Cr2B_Orth)f(@Fcc)f(@Laves_C14)f(@Liquid)f(@ZrB2)
FBB8 + 2% Zr
Volume Fractio
n
Temperature (oC)
Laves Phase (C14)B2
BCC
FCC
16

Current Progress - CALPHAD Calculations (Cont’d)
FBB8 + 2% Ti
Volume Fractio
n
Temperature (oC)
f
FBB8 + 4% Ti
Temperature (oC)
Volume Fractio
n
L21B2
BCC
L21B2
BCC
17

Current Progress - Microstructural Characterization with LEAP
B2‐NiAl +L21 Ni2TiAl
0 Ti 2 Ti
B2‐NiAl
20nm
4 Ti
FeCr rich phase + L21 TiNi2Al
6 Ti
L21 Ni2TiAl
Average concentrations in precipitates
Ti ↑ Fe ↑; Ni, Al↓
B2 L21
Fe
Al
Ni
Ti
18
FBB8
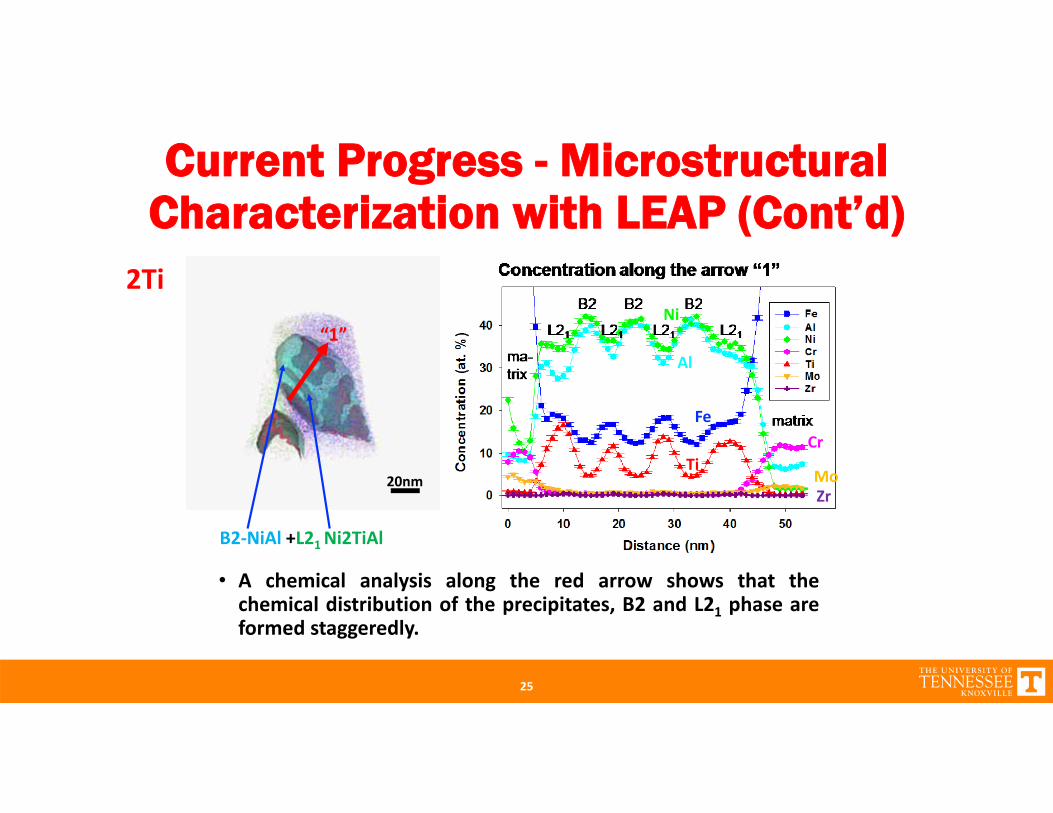
Current Progress - Microstructural Characterization with LEAP (Cont’d)
2Ti
20nm
• A chemical analysis along the red arrow shows that thechemical distribution of the precipitates, B2 and L21 phase areformed staggeredly.
Fe
Ni
Al
TiCr
MoZr
25
B2‐NiAl +L21 Ni2TiAl
“1”

Current Progress - Microstructural Characterization with LEAP (Cont’d)
4Ti
20nm
• A chemical analysis along the red arrow shows that thechemical distributions of the precipitates, B2 and L21 phases areformed staggeredly.
26
FeNiAlTi
CrMo Zr
FeCr rich phase + L21 Ni2TiAl

• The FBB8 + 2 wt.% Hf alloy shows a complicated microstructure on SEM images. At least, two kinds of precipitates are present.
Current Progress - Microstructural Characterization on FBB8 + 2 wt.% Hf
10 μm50 μm
Major Strengthener
Laves Phase
21

Current Progress - Microstructural Characterization on FBB8 + 2 wt.% Zr
• Microstructure, very similar to FBB8 + 2 wt.% Hf alloy.
10 μm 2 μm
Major Strengthener
Laves Phase
22

Current Progress - Microstructural Characterization on FBB8 + 1 wt.% Hf-1 wt.% Ti
Grain boundary films
10 μm 200 nm
B2-NiAl zones
• 1 wt.% Hf forms high Z‐contrast secondary phase along the grain boundaries, and 1 wt.% Ti does not enough to form the L21 phase.

Current Progress - Microstructural Characterization on FBB8 + 0.5 wt.% Hf - 1.5 wt.% Ti
• Very clean microstructure, compared to FBB8 + 2 wt.% Hf and FBB8 + 2 wt.% Zr.
100 μm 5 μm
Major Strengthener
24

Current Progress - Creep Tests
• Creep tests on FBB8 + 2 wt.% Hf showed no creep‐resistance enhancement. Its creep‐resistance is similar to FBB8. 2% Hf alloy
2% Ti alloy4% Ti alloy2% Hf alloyFBB8P92P122
G. Song, Z. Sun, L. Li, X. Xu, M. Rawlings,C.H. Liebscher, B. Clausen, J. Poplawsky,D.N. Leonard, S. Huang, Z. Teng, C.T. Liu,M.D. Asta, Y. Gao, D.C. Dunand, G. Ghosh, M.Chen, M.E. Fine, and P.K. Liaw, ScientificReport, 5 (2015) 16327.
26
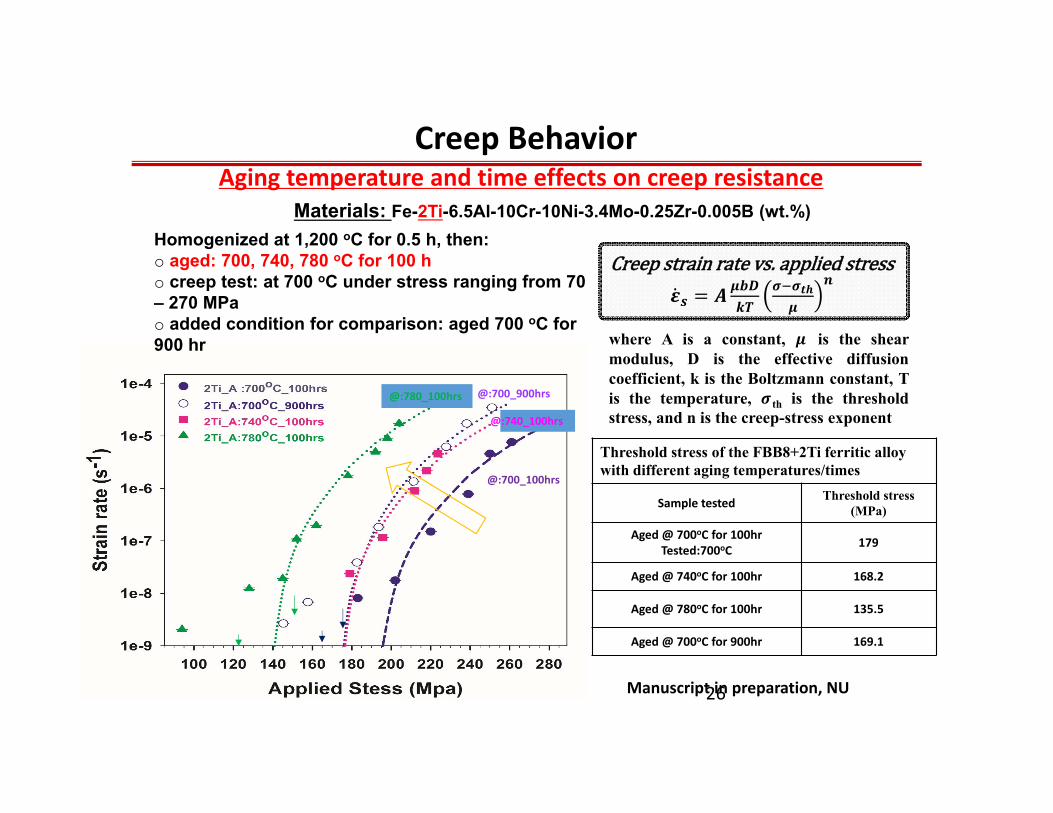
Materials: Fe-2Ti-6.5Al-10Cr-10Ni-3.4Mo-0.25Zr-0.005B (wt.%)Homogenized at 1,200 oC for 0.5 h, then:o aged: 700, 740, 780 oC for 100 ho creep test: at 700 oC under stress ranging from 70 – 270 MPao added condition for comparison: aged 700 oC for 900 hr
Creep Behavior
Manuscript in preparation, NU
Creepstrainratevs.appliedstress
where A is a constant, is the shearmodulus, D is the effective diffusioncoefficient, k is the Boltzmann constant, Tis the temperature, th is the thresholdstress, and n is the creep-stress exponent
@:700_100hrs
@:700_900hrs@:780_100hrs
@:740_100hrs
Threshold stress of the FBB8+2Ti ferritic alloy with different aging temperatures/times
Sample tested Threshold stress (MPa)
Aged @ 700oC for 100hrTested:700oC 179
Aged @ 740oC for 100hr 168.2
Aged @ 780oC for 100hr 135.5
Aged @ 700oC for 900hr 169.1
Aging temperature and time effects on creep resistance
Papers, Presentations, and Awards• Papers
1. Z. K. Teng, M. K. Miller, G. Ghosh, C. T. Liu, S. Huang, K. F. Russel, M. E. Fine, and P. K.Liaw, Scripta Materialia, 2010;63:61.
2. S. Huang, D. L. Worthington, M. Asta, V. Ozolins, G. Ghosh, and P. K. Liaw, ActaMaterialia, 2010;58:1982.
3. S. Huang, B. Clausen, D. Brown, Z. K. Teng, Y. F. Gao, and P. K. Liaw, Metallurgical andMaterials Transactions A, 2012;43:1497.
4. Z. K. Teng, F. Zhang, M. K. Miller, C. T. Liu, S. Huang, Y. T. Chou, R. H. Tien, Y. A. Chang,and P. K. Liaw, Materials Letters, 2012;71:36.
5. Z. K. Teng, G. Ghosh, M. K. Miller, S. Huang, B. Clausen, D. W. Brown, and P. K. Liaw.Acta Mater. 2012;60:5362.
6. Z. K. Teng, C. T. Liu, M. K. Miller, G. Ghosh, E. A. Kenik, S. Huang, and P. K. Liaw,Materials Science and Engineering A, 2012;541:22.
27

Papers, Presentations, and Awards (Cont’d)
7. H. Ding, S. Huang, G. Ghosh, P. K. Liaw, and M. Asta, Scripta Mater. 2012;67:732.
8. S. Huang, G. Ghosh, X. Li, J. Ilavsky, Z. K. Teng, and P. K. Liaw, Metallurgical andMaterials Transactions A. 2012;43:3423.
9. C. H. Liebscher, V. Radmilovic, U. Dahmen, M. Asta and G. Ghosh, Journal ofMaterials Science, 2013;48:2067.
10. Z. Sun, C. H. Liebscher, S. Huang, Z. Teng, G. Song, G. Wang, M. Asta, M. Rawlings, M.E. Fine, and P. K. Liaw, Scripta Materialia, 2013;68:384.
11. H. Ding, V. I. Razumovsky, and M. Asta, Self Diffusion Anomaly in FerromagneticMetals: A Density‐Functional‐Theory Investigation of Magnetically Ordered andDisordered Fe and Co, Acta Mater., 70 (2014) 130‐136.
12. H. Ding, V.I. Razumovskiy, M. Asta, Acta Mater., 70 (2014) 130‐136.
13. S. Huang, Y. Gao, K. An, L. Zheng, W. Wu, Z. Teng, and P.K. Liaw, Acta Mater., 83(2015) 137‐148.
28
Papers, Presentations, and Awards (Cont’d)
14. Z. Sun, G. Song, J. Ilavsky, and P.K. Liaw, Materials Research Letters, (2015) 128‐134.
15. C.H. Liebscher, V.R. Radmilović, U. Dahmen, N.Q. Vo, D.C. Dunand, M. Asta, and G.Ghosh, Acta Mater., 92 (2015) 220‐232.
16. G. Song, Z. Sun, L. Li, X. Xu, M. Rawlings, C.H. Liebscher, B. Clausen, J. Poplawsky,D.N. Leonard, S. Huang, Z. Teng, C.T. Liu, M.D. Asta, Y. Gao, D.C. Dunand, G. Ghosh,M. Chen, M.E. Fine, and P.K. Liaw, Scientific Report, 5 (2015) 16327.
17. Z. Sun , G. Song , J. Ilavsky , G. Ghosh, and P.K. Liaw, Scientific Report, 5 (2015) 16081.
18. Z. Sun, G. Song, T. Sisneros, B. Clausen, C. Pu, L. Li, Y. Gao, and P. K. Liaw, ScientificReports 6 (2016) 23137.
19. G. Song, Z. Sun, J. D. Poplawsky, Y. Gao, and P. K. Liaw, Acta Mater., 127 (2017) 1‐16.
20. G. Song, Z. Sun, , J. D. Poplawsky, X. Xu, M. Chen, and P. K. Liaw, Journal of Alloys andCompounds 706, (2017) 584–588.
29

Papers, Presentations, and Awards (Cont’d)
21. G. Song, Z. Sun, B. Clausen, and P. K. Liaw, Journal of Alloys and Compounds 693,(2017) 921–928.
22. M. J. S. Rawlings, C. H. Liebscher, M. Asta, and D. C. Dunand, Acta Mater., 128 (2017)103‐112.
30

Papers, Presentations, and Awards (Cont’d)
• Presentations1. Z. K. Teng, F. Zhang, M. K. Miller, C. T. Liu, A. Y. Chuang, S. Y. Huang, R. H. Tien, Y. T.
Chou, and P. K. Liaw. 2011 TMS Meeting, San Diego, 02/27 – 03/04.
2. S. Y. Huang, B. Clausen, D. Brown, Z. Teng, G. Ghosh, M. Fine, and P. K. Liaw, 2011TMS Meeting, San Diego, 02/27 – 03/04.
3. P. K. Liaw, Z. Teng, S. Huang, C. T. Liu, M. E. Fine, G. Ghosh, M. D. Asta, and G. Wang,The Annual University Coal Research/Historically Black Colleges and Universitiesand Other Minority Institutions Conference, Pittsburgh, Pennsylvania, 06/07 –06/08, 2011
4. S. Huang, Y. F. Gao, K. An, W. Wu, L. Zheng, M. Rawlings, D. Dunand, and P. K. Liaw,2012 TMS Meeting, Orlando, Florida , 03/11 – 03/15.
5. P. K. Liaw, M. D. Asta, D. C. Dunand, M. E. Fine, G. Ghosh, and C. T. Liu, NationalEnergy Technology Laboratory, Pittsburgh, Pennsylvania, 04/18, 2012
31
Papers, Presentations, and Awards (Cont’d)
6. C. H. Liebscher, V. Radmilovic, U. Dahmen, M. Asta, and G. Gosh, Microscopy &Microanalysis 2012 Meeting, Phoenix, Arizona, 07/29 ‐ 08/02
7. C. H. Liebscher, V. Radmilovic, U. Dahmen, M. Asta, and G. Gosh, Materials Scienceand Technology 2012 Meeting, Pittsburgh, Pennsylvania, 08/07 ‐ 08/11
8. H. Ding, S. Huang, G. Ghosh, P. K. Liaw, and M. Asta, Materials Science andTechnology 2012 Meeting, Pittsburgh, Pennsylvania, 08/07 ‐ 08/11
9. Z. Sun, G. Song, Z. Teng, G. Ghosh, and P. K. Liaw , 2012 MRS Fall Meeting & Exhibit,Boston, 11/25 – 11/30
10. P. K. Liaw, M. Asta, D, Dunand, M. Fine, G. Ghosh, C. Liu, H. Ding, S. Huang, M.Rawlings, Z. Sun, G. Song, Z. Teng, G. Wang, and C. Liebscher, 2013 TMS Meeting ,San Antonio, Texas, 03/03 – 03/07
11. Z. Sun, S. Huang, Z. Teng, G. Song, G. Wang, and P. K. Liaw, 2013 TMS Meeting, SanAntonio, Texas, 03/03 – 03/09
32

Papers, Presentations, and Awards (Cont’d)
12. G. Song, Z. Sun, G. Wang, H. Ding, C. Liebscher, M. D. Asta, G. Ghosh, D. C. Dunand,M. Rawlings, N. Q Vo, and P. K. Liaw, 2015 TMS Meeting, Orlando, Florida, 3/15 –3/19
13. Z. Sun, G. Song, J. Ilavsky, and P. K. Liaw, 2015 Materials Science & TechnologyConference (MS&T), Columbus, Ohio, 10/4 – 10/8
14. G. Song, Z. Sun, L. Li, X. Xu, M. Rawlings, C. Liebscher, B. Clausen, J. Poplawsky, D.Leonard, S. Huang, Z. Teng, C. Liu, M. Asta, Y. Gao, D. Dunand, G. Ghosh, M. Chen, M.Fine, and P. K. Liaw, 2015 Materials Science & Technology Conference (MS&T),Columbus, Ohio, 10/4 – 10/8
15. G. Song, Z. Sun, D. Dunand, M. Rawlings, G. Ghosh, and P. K. Liaw, 2016 TMSMeeting, Nashville, Tennessee, 02/14 – 02/18
16. G. Song, Y. Gao, Z. Sun, J. Poplawsky, and P. K. Liaw , 2016 TMS Meeting, Nashville,Tennessee, 02/14 – 02/18
17. Z. Sun, G. Song, J. Ilavsky, G. Ghosh, and P. K. Liaw, 2016 TMS Meeting, Nashville,Tennessee, 02/14 – 02/18
33

Papers, Presentations, and Awards (Cont’d)
• Awards1. Zhiqian Sun, TMS Best Paper Contest – Graduate Division – First Place, TMS 2016
Annual Meeting & Exhibition, Feb. 14‐18, 2016, Nashville, Tennessee
2. Gian Song, TMS Best Paper Contest – Graduate Division – Second Place, TMS 2016Annual Meeting & Exhibition, Feb. 14‐18, 2016, Nashville, Tennessee
3. Gian Song, TMS Best Paper Contest – Graduate Division – First Place, TMS 2017Annual Meeting & Exhibition, Feb. 26‐Mar. 2, 2017, San Diego, California
34
Summaries and Current Status
• Single‐crystal elastic constants (Cij) are calculated using the first‐principles method in a hierarchical microstructure.
• Calculated results show a good agreement with experimental data,when available. As of now, there is no experimental Cij data of L21‐Ni2TiAl. Thus, present calculations fill an important knowledge gap.
• CALPHAD calculations help in predicting microstructures in alloysystems.
35

Summaries and Current Status (Cont’d)
• Current investigations on theFBB8 + Hf and FBB8 + Zr alloysystems show poor tendencyto form L21 phase, which leadsto no enhancement on creep‐resistance.
Hf TiDisarray. Segregations along grain boundary and within grains.Strengthener: B2 phase.
Uniform. Limited amount of segregation.Strengthener: B2 or L21phase.
ZrSimilar microstructure as FBB8 + 2% Hf.Disarray Segregations along grain boundary and within grains.Strengthener: B2 phase.
36

Future Plan
• We will focus on the FBB8 + Ti alloy system to determine theoptimum Ti content in order to achieve greatest creep resistance.
• FBB8 + 2.5 wt.% Ti, FBB8 + 3 wt.% Ti, and FBB8 + 3.5 wt.% Ti alloyshave been fabricated. SEM, TEM, LEAP, and creep tests are inprogress and will be completed in the near future.
• In‐situ neutron experiments will be performed, in order tocharacterize the microscopic mechanical information.
37

-The End-Any Questions?
38
Current Progress - First-principles Calculations (Cont’d)
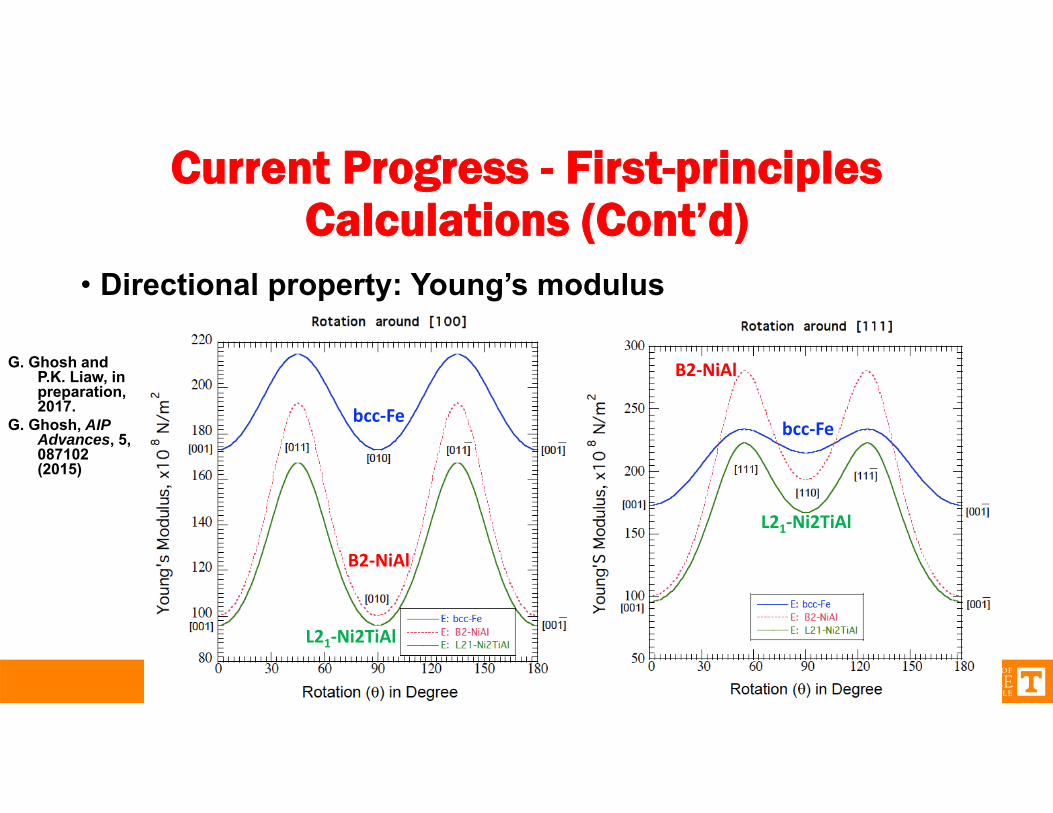
• Directional property: Young’s modulus
G. Ghosh and P.K. Liaw, in preparation, 2017.
G. Ghosh, AIP Advances, 5, 087102 (2015)
39
bcc‐Fe
B2‐NiAl
L21‐Ni2TiAl
bcc‐Fe
B2‐NiAl
L21‐Ni2TiAl
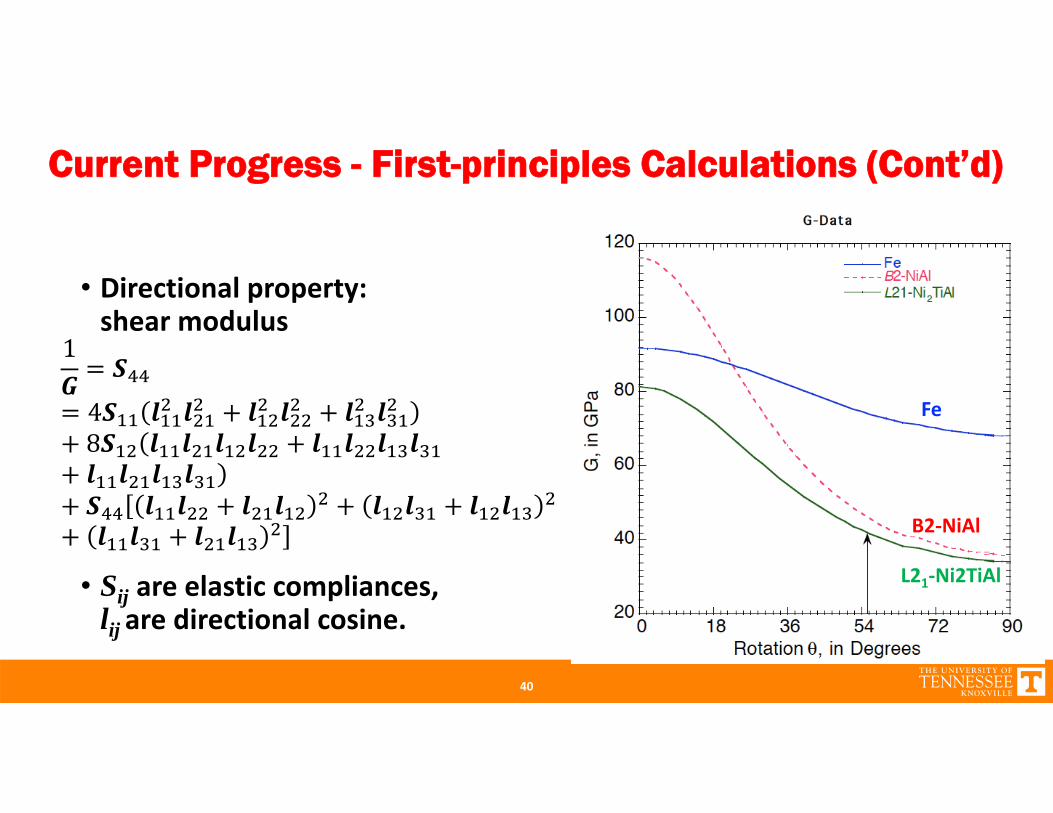
Current Progress - First-principles Calculations (Cont’d)
• Directional property: shear modulus
• Sij are elastic compliances,lij are directional cosine.
1
48
40
Fe
L21‐Ni2TiAl
B2‐NiAl

Current Progress - First-principles Calculations (Cont’d)
• From single-crystal Cij data polycrystalline average(“isotropic property”)
• Four distinct methods: (i) Voigt’s method, (ii) Reuss’ method,and (iii) Hill’s method (also called VRH), (iv) Hashin andShtrikman using variational principles
• In polycrystalline limit, there are only two independent elasticconstants: (i) Bulk modulus (B) and (ii) Shear modulus ( ),others. [Young’s modulus (E or Y) and Poisson’s ratio ( ) arerelated to B and ].
41

Current Progress - First-principle Calculations (Cont’d)• Voigt’s method: assumes uniform local strain across grains
i.e., ⁄ , where εij is the strain tensor, and x is the spatial coordinate.
→yields upper bound value• Reuss’ method: assumes uniform local stress across grains
i.e., ⁄ , where σij is the stress tensor.→yields lower bound value
• Hill’s or VRH method: usually considers arithmetic, geometric orharmonic mean of Voigt and Reuss values
• Hashin and Shtrikman method: either stress or strain or both could be thevariational quantity(ies) yielding lower and upper bounds of the property.
G. Ghosh and P. K. Liaw, in preparation, 2017.G. Ghosh, AIP Advances, 5, 087102 (2015) 42
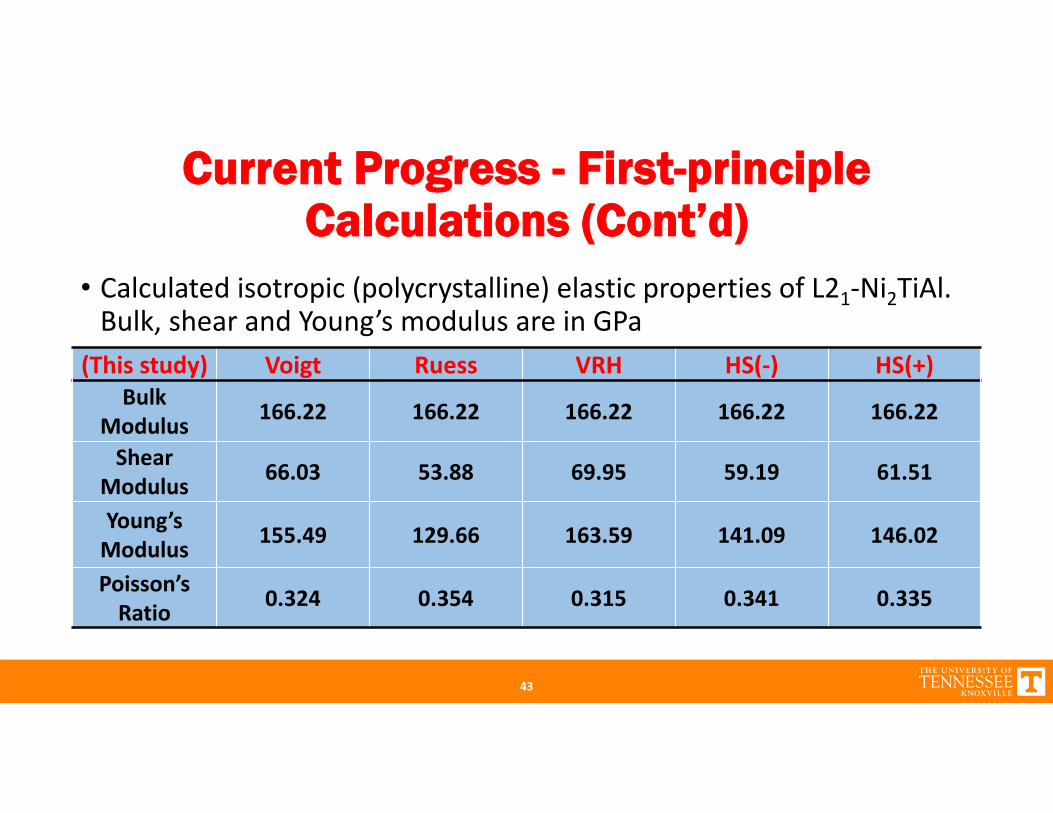
Current Progress - First-principle Calculations (Cont’d)
• Calculated isotropic (polycrystalline) elastic properties of L21‐Ni2TiAl. Bulk, shear and Young’s modulus are in GPa
(This study) Voigt Ruess VRH HS(‐) HS(+)Bulk
Modulus 166.22 166.22 166.22 166.22 166.22
Shear Modulus 66.03 53.88 69.95 59.19 61.51
Young’s Modulus 155.49 129.66 163.59 141.09 146.02
Poisson’s Ratio 0.324 0.354 0.315 0.341 0.335
43

Current Progress - Microstructural Characterization on FBB8 + 1 wt.% Hf-1 wt.% Ti
ElementPhase Al Ti Cr Fe Ni Zr Mo Hf
ppt 21.0 ± 0.07 1.8 ± 0.01 1.3 ± 0.03 17.9 ± 0.14 57.2 ± 0.23 0.2 ± 0.04 0.3 ± 0.08 0.3 ± 0.11
Matrix 5.2 ± 0.45 1.3 ± 0.05 12.4 ± 0.13 75.3 ± 0.76 3.3 ± 0.14 0.1 ± 0.05 2.2 ± 0.03 ‐

Summaries and Current Status
Milestones
DesignationMilestone description Due Date
Revised
Due Date
Completion
Date1 First‐principles study of
thermodynamics 12/31/2015 09/30/2017 03/31/2016
2 First‐principles study of elastic properties 12/31/2015 09/30/2017 01/31/2017
3 First‐principles study of interfacial properties 12/31/2015 09/30/2017
4 Design and fabrication of model alloys 12/31/2015 06/30/2017
45
Milestones
DesignationMilestone description Due Date
Revised
Due Date
Completion
Date
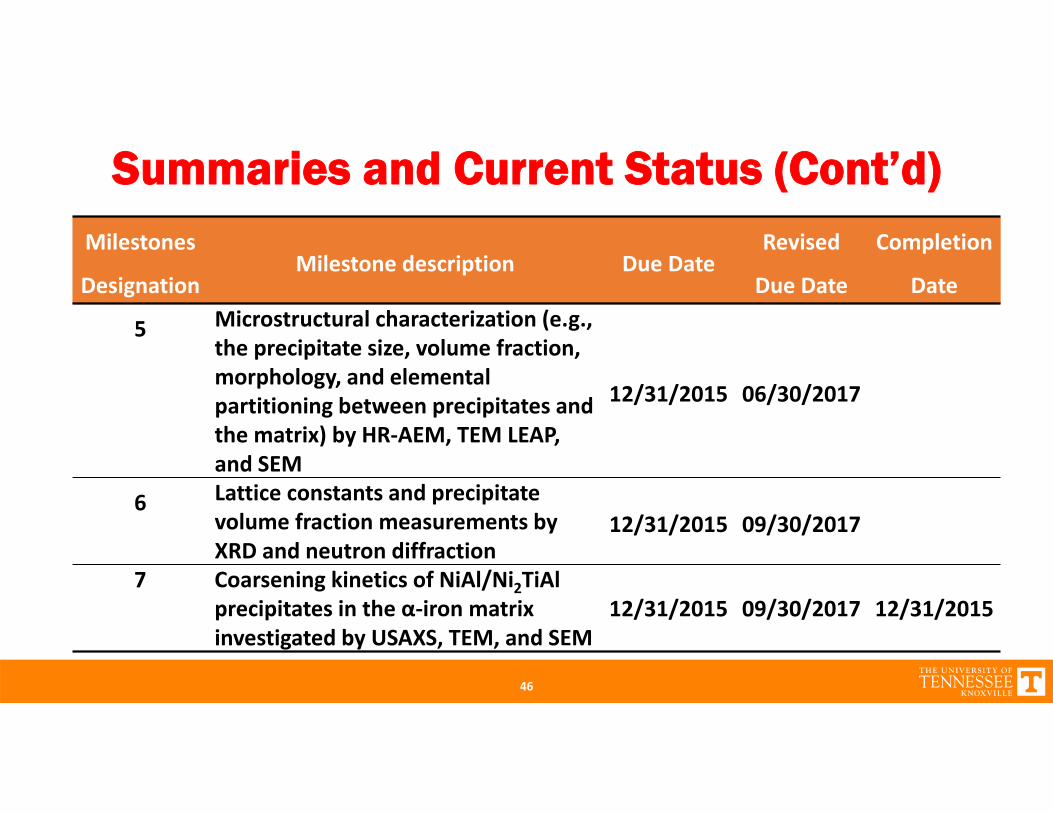
5 Microstructural characterization (e.g., the precipitate size, volume fraction, morphology, and elemental partitioning between precipitates and the matrix) by HR‐AEM, TEM LEAP, and SEM
12/31/2015 06/30/2017
6 Lattice constants and precipitate volume fraction measurements by XRD and neutron diffraction
12/31/2015 09/30/2017
7 Coarsening kinetics of NiAl/Ni2TiAl precipitates in the α‐iron matrix investigated by USAXS, TEM, and SEM
12/31/2015 09/30/2017 12/31/2015
46
Summaries and Current Status (Cont’d)

Summaries and Current Status (Cont’d)
Milestones Designation Milestone description Due Date Revised
Due DateCompletion
Date8 Mechanical properties of model
alloys (e.g., compression, tension, hardness tests)
12/31/2015 09/30/2017
9 Systematical creep study on model alloys 12/31/2015 09/30/2017
10 Dislocation structures of crept specimens by TEM and STEM 12/31/2015 09/30/2017
11 In‐situ creep study on model alloys under neutron diffraction 12/31/2015 09/30/2017 12/31/2015
12 Dislocation‐dynamics simulations of creep resistance 12/31/2015 06/30/2017 12/31/2015
47

Summaries and Current Status (Cont’d)
FBB8+2% TiHierarchical
Structure, L21+B2
FBB8+2% Zr
B2 Phase
FBB8+2% Hf
B2 PhaseFBB8+1% Hf-1% Zr
Not yet determined
TiAs Ti content increases
FBB8+0% Ti
B2 Phase
FBB8+4% Ti
Majorly L21 Phase
FBB8+6% Ti
L21 Phase
48

https://www.netl.doe.gov/File%20Library/Events/2008/fem/Holcomb_pres.pdf
FBB8: Fe-6.5Al-10Cr-10Ni-3.4Mo-0.25Zr-0.005B, weight percent (wt.%)NiAl (B2 phase)Fe (α phase)
Fe Ni
Al
Ni
Al
Ti
Ni2TiAl (L21)
By adding Ti, there will be L21‐Ni2TiAl formed. The creep strength of L21between 753 and 1,000 oC is about three times that of NiAl.
Carbon SteelCrMo Low Alloy Steel9‐12%Cr Steel18%Cr‐8%Ni Steel15%Cr‐8%Ni Steel20‐25%Cr Austenitic SteelHigh Cr‐High Ni Steel
49
Technical Background of the Project (Cont’d)
Carbon SteelCrMo Low Alloy Steel
9‐12%Cr Steel18%Cr‐8%Ni Steel
15%Cr‐8%Ni Steel20‐25%Cr Austenitic Steel
High Cr‐High Ni Steel
G. Song, Z. Sun, J. D. Poplawsky, Y. Gao, P. K. Liaw, Acta Mater., 127 (2017) 1‐16.G. Song, Z. Sun, L. Li, X. Xu, M. Rawlings, C.H. Liebscher, B. Clausen, J. Poplawsky, D.N. Leonard, S. Huang, Z. Teng, C.T. Liu, M.D. Asta, Y. Gao,D.C. Dunand, G. Ghosh, M. Chen, M.E. Fine, and P.K. Liaw, Scientific Report, 5 (2015) 16327.

Creep experiment and microstructural analysis for
NiAl (B2) and Ni2TiAl (L21) precipitate hardened ferritic alloy
Sungil BaikM. J. S. RawlingsDavid C. Dunand
Northwestern Univ.

Crept microstructure
51
N.Q. Vo et al. / Acta Materialia 71 (2014)
A BF‐STEM image of an HPSFA (2wt.% Ti) sample crept at 140 MPa and 973 K, at the creep time of 200 hours
DC‐STEM image of FBB8 (0% Ti) after the creep test (after entering a steady‐state creep regime)
Gian Song et. al., Scientific Reports 2015
What increase the resistance of dislocation precipitate bypass via dislocation loops or climb over coherent hierarchical L21 (Ni2TiAl) and B2 (NiAl) precipitate
1. Precipitate size, volume fractions controlled by temperature, aging time
2. Lattice parameter mismatches (structure change (B2L21) controlled by Ti concentration changes
500 nm
100 nm
Creep mechanisms(i) Dislocation detachment from precipitates, (ii) Precipitate shearing,(iii) Dislocations climbing over precipitates(iv) Precipitate bypass by Orowan dislocation
looping,

Dislocation dynamics (DD) simulation
52
a b c
M. J. S. Rawlings, D. C. Dunand To be submitted, NU
0LineDislocationModel
whereτext istheexternalstressappliedtothesystem,τobst isthestressassociatedwiththedislocationinteractingwiththeprecipitates,τdisloc isthestressinducedbythedislocationinteractingwithitselfand/orotherdislocationsandτdrag isthestressduetoviscousdragwhichisproportionaltothenodeslocalvelocitynormaltothedislocationline
Thedislocationdynamics(DD)modelsimulatesoneortwodislocationspropagatingthroughafieldofprecipitatesembeddedwithinamatrix,actingasobstaclestothemotionofdislocations.
DD‐simulations(a) shearing small precipitates,(b) looping around large precipitates,(c) coupled super dislocations
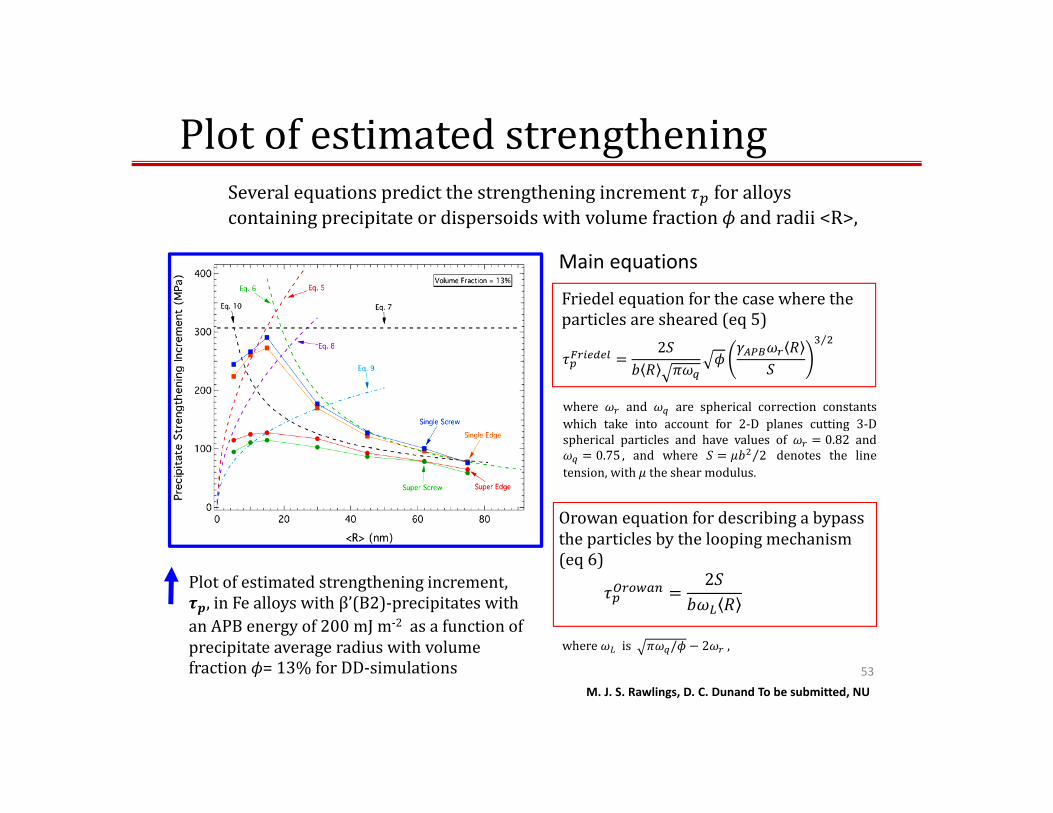
Plotofestimatedstrengthening
53
Plotofestimatedstrengtheningincrement,, inFealloyswithβ’(B2)‐precipitateswith
anAPBenergyof200mJm‐2 asafunctionofprecipitateaverageradiuswithvolumefractionϕ=13%forDD‐simulations
Severalequationspredictthestrengtheningincrement foralloyscontainingprecipitateordispersoidswithvolumefractionϕ andradii<R>,
Friedelequationforthecasewheretheparticlesaresheared(eq5)
2 ⁄
Main equations
Orowanequationfordescribingabypasstheparticlesbytheloopingmechanism(eq6)
2
where and are spherical correction constantswhich take into account for 2‐D planes cutting 3‐Dspherical particles and have values of 0.82 and
0.75 , and where 2⁄ denotes the linetension, with the shear modulus.
where is / 2 ,
M. J. S. Rawlings, D. C. Dunand To be submitted, NU

54
OtherequationsInthecaseofasquarelattice,themaximumforce, ,ofaparticleandtheminimuminter‐particledistance, , areemployedtodetermineatheoreticalpeakstrengthening
Eq. 7 2⁄ with 2
For alloys in the under‐aged condition where the shearing mechanism is dominant, thestrengthening increment is:
Eq. 82
4
foralloyswithhighvolumefractionsofparticles
Eq. 10
2 , where
⁄
and .Eq. 9
Finally,forshearingofparticlesbyclosely‐coupleddislocation,wheretwodislocationsresideinthesameparticle,thefollowingequationwasderived
0.69, where is a fitting parameter equal to unity.

55
Materials: Fe-2Ti-6.5Al-10Cr-10Ni-3.4Mo-0.25Zr-0.005B (wt.%)Homogenized at 1,200 oC for 0.5 h, then:o aged: 700, 740, 780 oC for 100 ho creep test: at 700 oC under stress ranging from 70 – 270 Mpao added condition for comparison: aged 700 oC for 900 hr
Creep Behavior
Manuscript in preparation, NU
Creepstrainratevsappliedstress
where A is a constant, is the shearmodulus, D is the effective diffusioncoefficient, k is the Boltzmann constant, Tis the temperature, th is the thresholdstress, and n is the creep-stress exponent
@:700_100hrs
@:700_900hrs@:780_100hrs
@:740_100hrs
Threshold stress of the FBB8+2Ti ferritic alloy with different aging temperature
Sample tested Threshold stress (Mpa)
Aged @ 700oC for 100hrTested:700oC 179
Aged @ 740oC for 100hr 168.2
Aged @ 780oC for 100hr 135.5
Aged @ 700oC for 900hr 169.1
Aging temperature effect on creep resistance

R/Ro0.0 0.5 1.0 1.5 2.0
Prob
ablil
ity
0.0
0.2
0.4
0.6
0.8
1.0
1.2
1.4
1.6Modified LSW model
Microstructure Comparisons
56
Aged at 700oC for 100 hrs Aged at 780oC for 100 hrsChemical etching + SEM observations
‹r› : 46.2 ± 7.5 nm Φ : 27.2 ± 1.9 %
‹r› : 135.3 ± 19.1 nm Φ : 21.6 ± 1.2 %500 nm 500 nm
Aging temperature increase (from 700oC to 780oC for 100hr) mean precipitate size ‹r› increases (from 46.2 ± 7.5 nm to 132.5 ± 19.1 nm) and area fraction (Φ) decreases (from 27.2 ± 1.9 to 21.6 ± 1.2 %) at the 2wt.%Ti +FBB8 sample
This is relating with the threshold stress change of 2wt.% Ti +FBB8 sample (decreases from 179± 1 MPa at 700oC to 135.5 ± 2 Mpa at 780oC for 100hrs aging time).
R/Ro0.0 0.5 1.0 1.5 2.0
Prob
ablil
ity
0.0
0.5
1.0
1.5
2.0 LSW modelModified LSW model

Applied Stess (Mpa)80 100 120 140 160 180 200 220 240 260 280
Stra
in ra
te (s
-1)
1e-9
1e-8
1e-7
1e-6
1e-5
1e-4 2Ti_A :700oC_T:700oC2Ti_A :760oC_T:700oC2Ti_A :760oC_T:740oC2Ti_A :780oC_T:700oC2Ti_A :780oC_T:740oC
57
Creep Behavior II (cont’d)Aging temperature + Creep temperature effect Aged 760 and 800 oC, Creep test temperature at 700 and 740 oC
Threshold stress of the FBB8+2Tiferritic alloy with different operating
creep temperature
Sample testedThreshold
stress (MPa)
Aged @ 700oC for 100hr,Tested:700oC 179
Aged @ 760oC for 100hrTested:700oC 167.9
Aged @ 760oC for 100hrTested:740oC 154.1
Aged @ 800oC for 100hrTested:700oC 129.8
Aged @ 800oC for 100hrTested:740oC 71.2
Aged @ 760_100hrs
Aged @ 800_100hrs
Aged @ 700_100hrsTest @ 700oC
13.8 MPa decrease
57.8 MPa decrease
Manuscript in preparation, NU

Microstructure Comparisons
58
Aged at 760oC for 100 hrs Aged at 800oC for 100 hrsSEM observations
500 nm 500 nm R/Ro
0.0 0.5 1.0 1.5 2.0
Prob
ablil
ity
0.0
0.2
0.4
0.6
0.8
1.0
1.2
1.4Modified LSW model
R/Ro0.0 0.5 1.0 1.5 2.0
Prob
ablil
ity
0.0
0.2
0.4
0.6
0.8
1.0
1.2
1.4Modified LSW model
Aging temperature increase (from 760oC to 800oC for 100hr) mean precipitate size ‹r› increases(from 107.6 ± 14.1 nm to 152.4 ± 21.0 nm) and area fraction (Φ) increases to from 22.5 ± 2.1 to 20.2 ± 1.8 % at the 2wt.%Ti +FBB8 sample
The larger size and smaller fraction of precipitate decrease the Orowan stress between precipitate and matrix, that might be introduce the decrease the larger threshold stress in the 2wt.% Ti +FBB8 sample aged at 800 oC for 100hrs than 760 for 100hr. (the amount of decreases increase to 57.8 ± 4 MPa at the 800oC aged sample from 13.8 ± 4 MPa at 780oC sample). The other possibility is the increase of austenite transformation at the higher temperature.
‹r› : 107.6 ± 14.1 nmΦ : 22.5 ± 2.1 %
‹r› : 152.4 ± 21.0 nmΦ : 20.2 ± 1.8 %
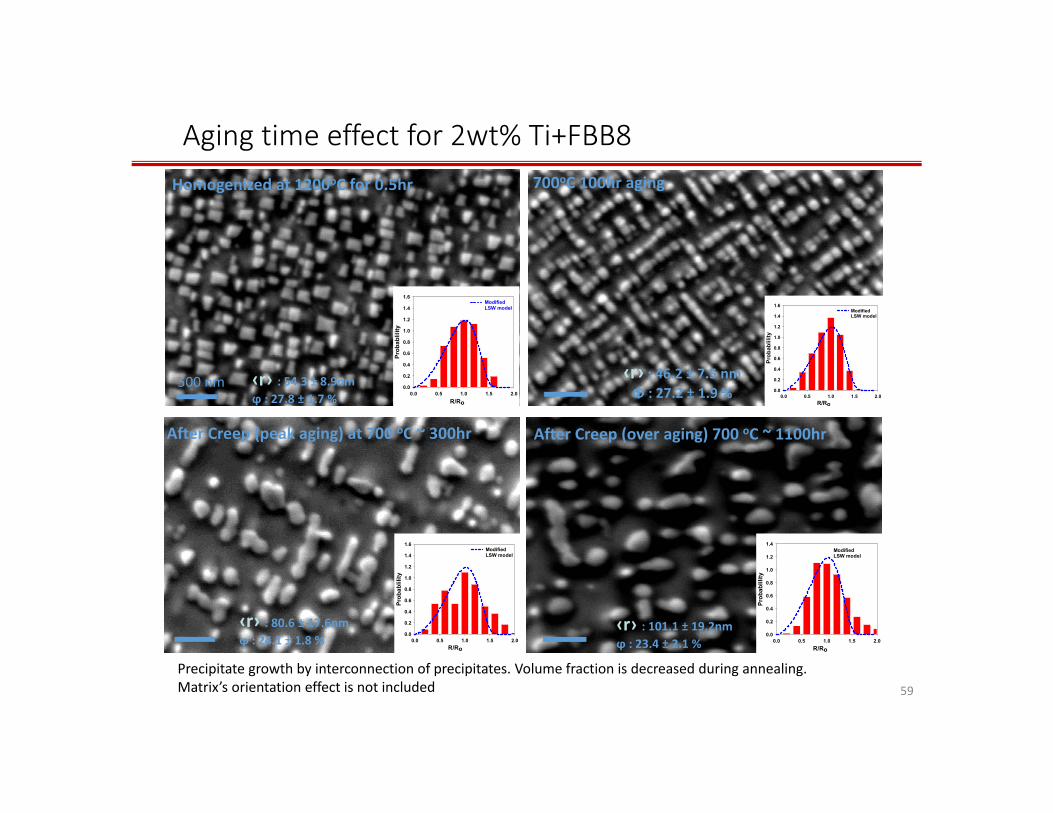
Aging time effect for 2wt% Ti+FBB8
59
Homogenized at 1200oC for 0.5hr
(Ro=52.35 nm)
500 nm (Ro=55.4 nm)
700oC 100hr aging
After Creep (peak aging) at 700 oC ~ 300hr After Creep (over aging) 700 oC ~ 1100hr
‹r› : 46.2 ± 7.5 nm Φ : 27.2 ± 1.9 %
R/Ro0.0 0.5 1.0 1.5 2.0
Prob
ablil
ity
0.0
0.2
0.4
0.6
0.8
1.0
1.2
1.4
1.6Modified LSW model
‹r› : 54.3 ± 8.9nm ϕ : 27.8 ± 1.7 % R/Ro
0.0 0.5 1.0 1.5 2.0Pr
obab
lility
0.0
0.2
0.4
0.6
0.8
1.0
1.2
1.4
1.6Modified LSW model
Precipitate growth by interconnection of precipitates. Volume fraction is decreased during annealing.Matrix’s orientation effect is not included
‹r› : 80.6 ± 17.6nm ϕ : 24.1 ± 1.8 %
R/Ro0.0 0.5 1.0 1.5 2.0
Prob
ablil
ity
0.0
0.2
0.4
0.6
0.8
1.0
1.2
1.4
1.6Modified LSW model
‹r› : 101.1 ± 19.2nm ϕ : 23.4 ± 2.1 % R/Ro
0.0 0.5 1.0 1.5 2.0
Prob
ablil
ity
0.0
0.2
0.4
0.6
0.8
1.0
1.2
1.4Modified LSW model

60
(G. Song et al. / Acta Materialia 127 (2017))
Coherency breaking after 500 hrs aging
BF‐TEM
Segregation of L21 structure + radius increase during aging
Radius and fraction changes with aging time (2wt.% Ti sample)
Aging time (hrs)0 200 400 600 800 1000 1200
Rad
ius
(nm
)
50
100
150
Aging time (hrs)0 200 400 600 800 1000 1200
Are
a fr
actio
n (%
)
15
20
25
30
35
Radius change with aging time at 700oC in 2wt.% Ti alloy
Fraction change with aging time at 700oC in 2wt.% Ti alloy
Peak aging Overaging

61
Creep Behavior III (cont’d)Hf addition effect
Threshold stress of the FBB8, 0.5Hf+0.5Ti, 2Ti ferritic alloyAged @ 700oC for 100hrsTested @ 700oC
Sample tested Threshold stress (MPa)
FBB8 (0%Ti)Aged @ 700 for 100hrs
Tested at 700oC70.8
FBB8+0.5%Hf+1.5%Ti 121.5
Aged @ 780 for 100hrs 179
Materials: Fe - 0.5Hf - 1.5Ti - 6.5Al-10Cr-10Ni-3.4Mo-0.25Zr-0.005B (wt.%)
0.5Hf +1.5Ti aged @ 700_100hrs
2Ti_aged @ 700_100hrs
FBB8 + 0Taged @ 700_100hrs
Manuscript in preparation, NU

Microstructure Comparisons
62
Aged at 700oC for 100 hrs Crept sample ~ 300 hrs aging @700 oCSEM observations
0.5Hf+1.5%Ti
500 nm 500 nm R/Ro
0.0 0.5 1.0 1.5 2.0
Prob
abili
ty
0.0
0.2
0.4
0.6
0.8
1.0
1.2
1.4
1.6 Modified LSW model
R/Ro0.0 0.5 1.0 1.5 2.0
Prob
abili
ty
0.0
0.2
0.4
0.6
0.8
1.0
1.2
1.4
1.6 Modified LSW model
The addition of (0.5wt%Hf+ 1.5wt%Ti) in FBB8 sample mean precipitate size decreases (to 23.7 ± 3.4 from 46.2 ± 7.5 nm at 2wt.% Ti sample aging 700 oC for 100hr ) and area fraction decreases (to 21.3 ± 4.1 from 27.2 ± 1.9 % at 2wt. % Ti sample aging 700 oC for 100hr ). But the growth rate of the precipitate during creep (~300hrs) in the 0.5Hf+1.5Ti sample is much faster than 2wt.% Ti sample (mean radius = 130.3± 14.9 nm, area fraction=25.7± 1.2 ) which is relating with decrease of creep resistance with respect to the 2wt.% Ti+FBB8 sample.
‹r› : 23.7 ± 3.4 nm ϕ : 21.3 ± 4.1 %
‹r› : 130.3 ± 14.9 nm ϕ : 25.7 ± 1.2 %
63
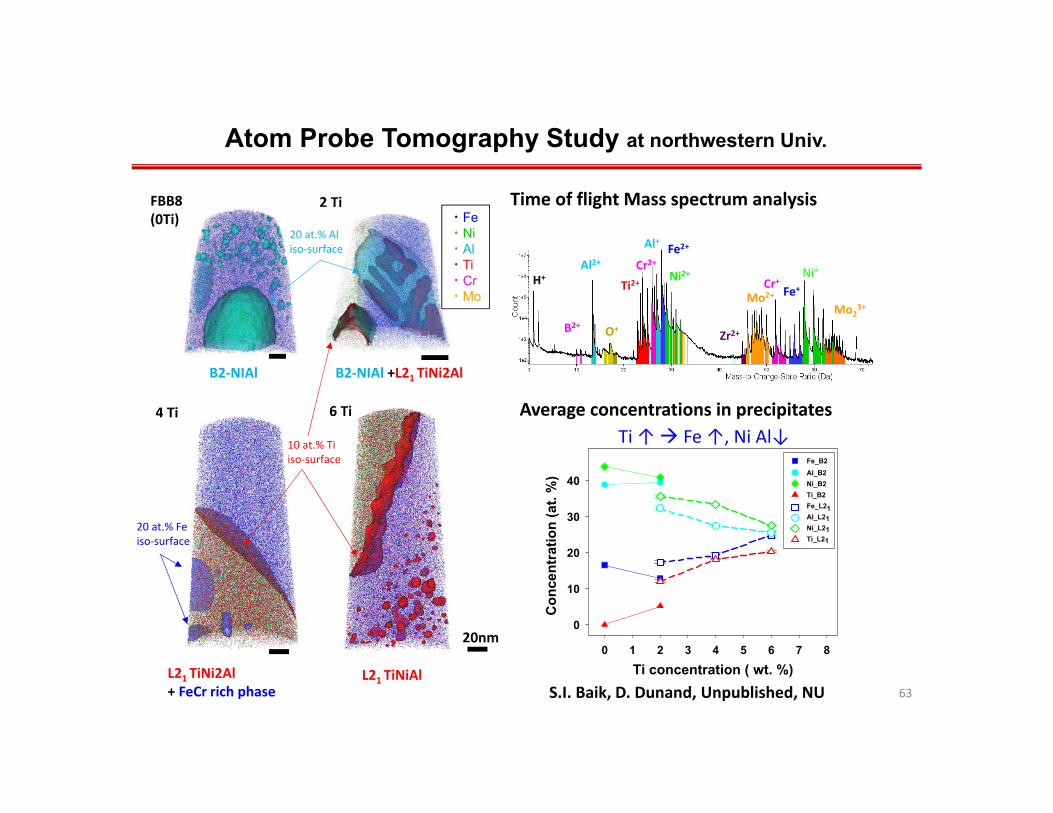
Atom Probe Tomography Study at northwestern Univ.
Ti concentration ( wt. %)0 1 2 3 4 5 6 7 8
Con
cent
ratio
n (a
t. %
)
0
10
20
30
40
Fe_B2Al_B2Ni_B2Ti_B2Fe_L21Al_L21Ni_L21Ti_L21
20nm
FBB8(0Ti)
2 Ti
4 Ti
B2‐NIAl B2‐NIAl +L21 TiNi2Al
L21 TiNi2Al + FeCr rich phase
Average concentrations in precipitates6 Ti
B2+
Al2+
O+
Ti2+
Fe2+
Ni2+
Mo2+
Ni+Cr2+Al+
Cr+
Mo23+
Fe+
Time of flight Mass spectrum analysis
L21 TiNiAl
Ti ↑ Fe ↑, Ni Al↓
Zr2+
H+
S.I. Baik, D. Dunand, Unpublished, NU
10 at.% Ti iso‐surface
20 at.% Al iso‐surface
20 at.% Fe iso‐surface
ㆍFeㆍNiㆍAlㆍTiㆍCrㆍMo

Atom Probe Tomography (cont’d)Concentration along the arrow “1”
L21 L21 L21B2B2B2
matrix
ma‐trix
L21‐precipitate
Fe, Cr richprecipitate
4Ti
2Ti
20nm
20nm
FeCr rich phase
L21 TiNi2Al
L21 TiNi2Al
B2NiAl
L21
64
“1”
Two proximity concentration histograms across BCC matrix ‐ L21 ‐ FeCr rich precipitates
BCC matrix

Size difference with Ti concentration
65
FBB8 2%Ti
4%Ti 6%Ti
(after homogenization at 1200oC for 0.5hr)
500 nm (Ro=35.1 nm) (Ro=52.35 nm)
‹r› : 23.7 ± 3.4 nm ϕ : 21.3 ± 4.1 %
‹r› : 54.3 ± 8.9nm ϕ : 27.8 ± 1.7 %
R/Ro0.0 0.5 1.0 1.5 2.0
Prob
ablil
ity
0.0
0.2
0.4
0.6
0.8
1.0
1.2
1.4
1.6Modified LSW model
‹r› : 110.4 ± 17.9 nm ϕ : 28.3 ± 1.7 %
‹r› : 179.6 ± 28.1 nm ϕ : 32.8 ± 1.9 %
R/Ro0.0 0.5 1.0 1.5 2.0
Prob
ablil
ity
0.0
0.2
0.4
0.6
0.8
1.0
1.2
1.4
1.6
R/Ro0.0 0.5 1.0 1.5 2.0
Prob
ablil
ity
0.0
0.2
0.4
0.6
0.8
1.0
1.2
1.4
1.6
R/Ro0.0 0.5 1.0 1.5 2.0
Prob
ablil
ity
0.0
0.2
0.4
0.6
0.8
1.0
1.2
1.4
1.6Modified LSW model

Ti concentration (wt.%)0 2 4 6
Rad
ius
(nm
)
0
50
100
150
200
Radius and fraction changes with Ti additions
66
Radius change with 0‐6 wt%Ti concentration after homogenization
Ti concentration (wt.%)0 2 4 6
Thre
shol
d st
ress
( Pa
)
60
80
100
120
140
160
180
200th
Peak age
thOver age
Area fraction change with 0‐6 wt%Ti.
Creep behavior in 0‐6 wt.Ti +FBB8 Ferritic alloy,
Threshold values in Creep experimentTest:100 at 700oC
Michael J.S. Rawlings et al.// Acta Materialia 128 (2017)
G. Song et al. / Acta Materialia 127 (2017)
BF‐TEM image for 4wt% Ti samole after homogenization‐treated at 1473 K for 0.5 h
Breaking coherency
Precipitate size and volume fraction increase with Ti addition.The coherency is breaking at 4% which might be from the L21structure + radius? increase L21 volume fraction and also size control are needed.
Ti concentration (wt.%)0 2 4 6
Are
a fr
actio
n (%
)10
20
30
40
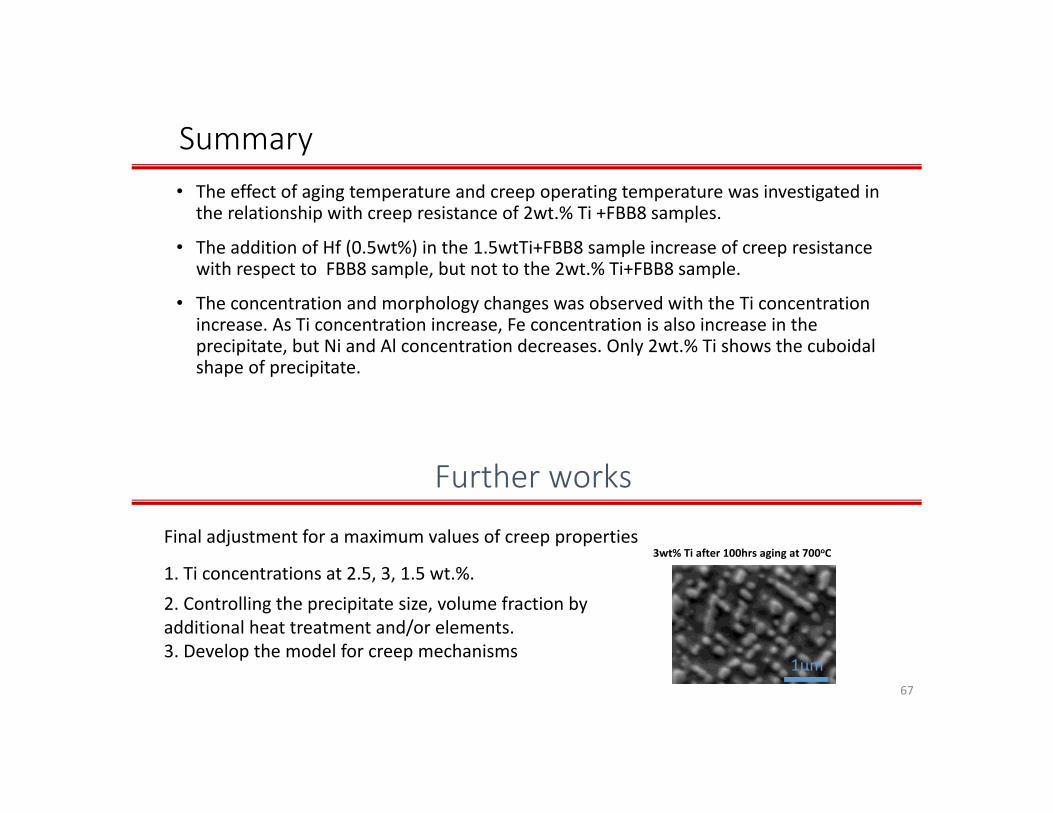
Summary• The effect of aging temperature and creep operating temperature was investigated in
the relationship with creep resistance of 2wt.% Ti +FBB8 samples.
• The addition of Hf (0.5wt%) in the 1.5wtTi+FBB8 sample increase of creep resistance with respect to FBB8 sample, but not to the 2wt.% Ti+FBB8 sample.
• The concentration and morphology changes was observed with the Ti concentration increase. As Ti concentration increase, Fe concentration is also increase in the precipitate, but Ni and Al concentration decreases. Only 2wt.% Ti shows the cuboidal shape of precipitate.
67
Further works
Final adjustment for a maximum values of creep properties
1. Ti concentrations at 2.5, 3, 1.5 wt.%.2. Controlling the precipitate size, volume fraction by additional heat treatment and/or elements.3. Develop the model for creep mechanisms
3wt% Ti after 100hrs aging at 700oC
1μm
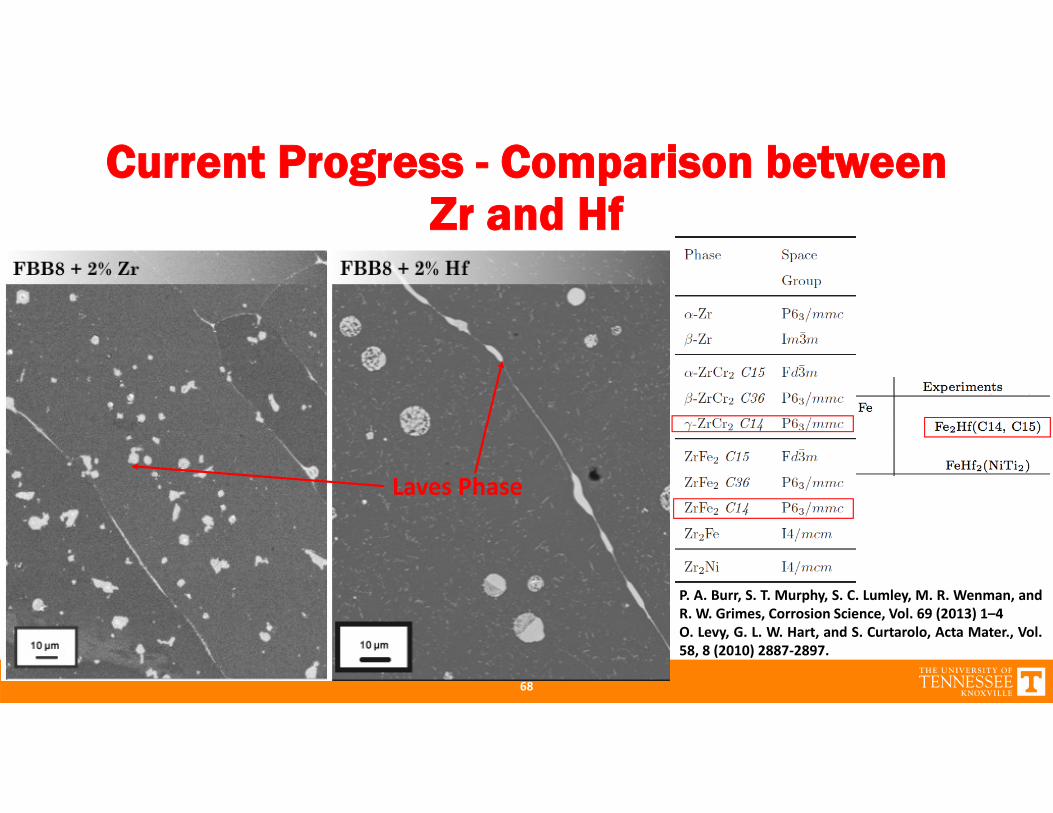
Current Progress - Comparison between Zr and Hf
P. A. Burr, S. T. Murphy, S. C. Lumley, M. R. Wenman, andR. W. Grimes, Corrosion Science, Vol. 69 (2013) 1–4O. Levy, G. L. W. Hart, and S. Curtarolo, Acta Mater., Vol.58, 8 (2010) 2887‐2897.
Laves Phase
68

Current Progress - CALPHAD Calculations(Cont’d)
• Phase diagram for the FBB8 + Hf system cannot be obtained in thismethod due to lack of database.
• The FBB8 + Ti system shows the presence of L21 phase.
• However, in the FBB8 + Zr system, there’s no L21 phase formed.Instead, Laves phase formed in the FBB8 + Zr system.
69
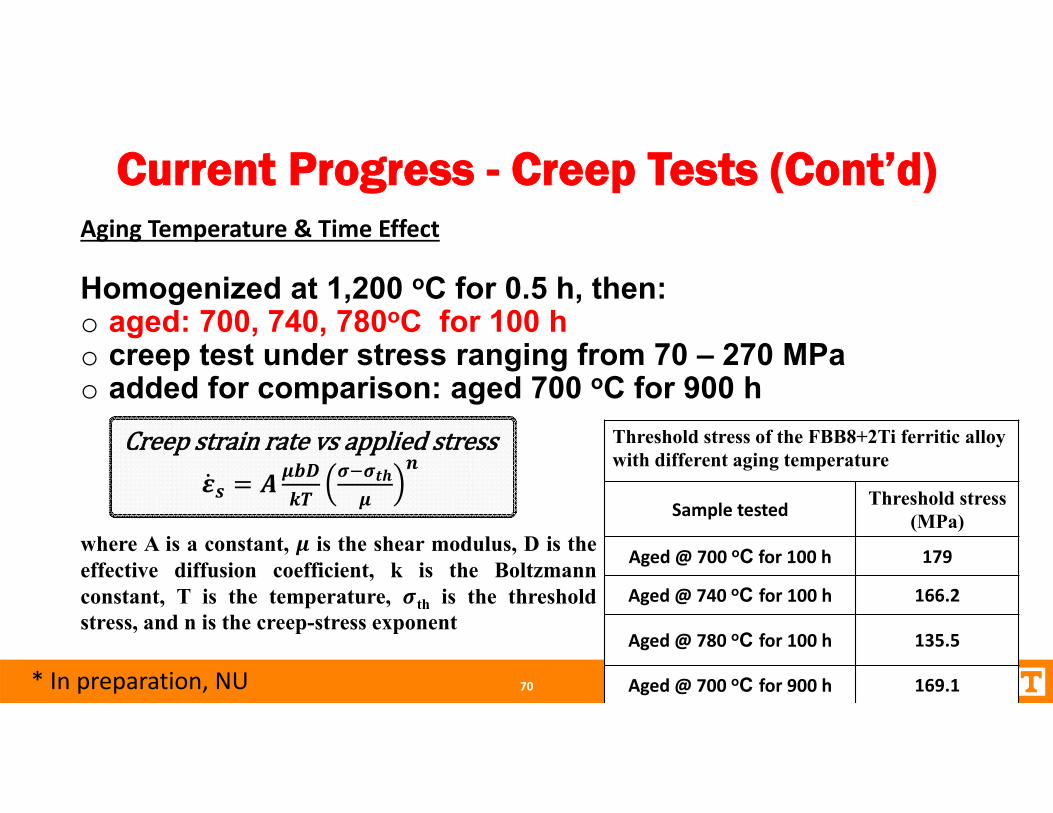
Homogenized at 1,200 oC for 0.5 h, then:o aged: 700, 740, 780oC for 100 ho creep test under stress ranging from 70 – 270 MPao added for comparison: aged 700 oC for 900 h
Current Progress - Creep Tests (Cont’d)
Creepstrainratevsappliedstress
where A is a constant, is the shear modulus, D is theeffective diffusion coefficient, k is the Boltzmannconstant, T is the temperature, th is the thresholdstress, and n is the creep-stress exponent
Threshold stress of the FBB8+2Ti ferritic alloy with different aging temperature
Sample tested Threshold stress (MPa)
Aged @ 700 oC for 100 h 179
Aged @ 740 oC for 100 h 166.2
Aged @ 780 oC for 100 h 135.5
Aged @ 700 oC for 900 h 169.170* In preparation, NU
Aging Temperature & Time Effect
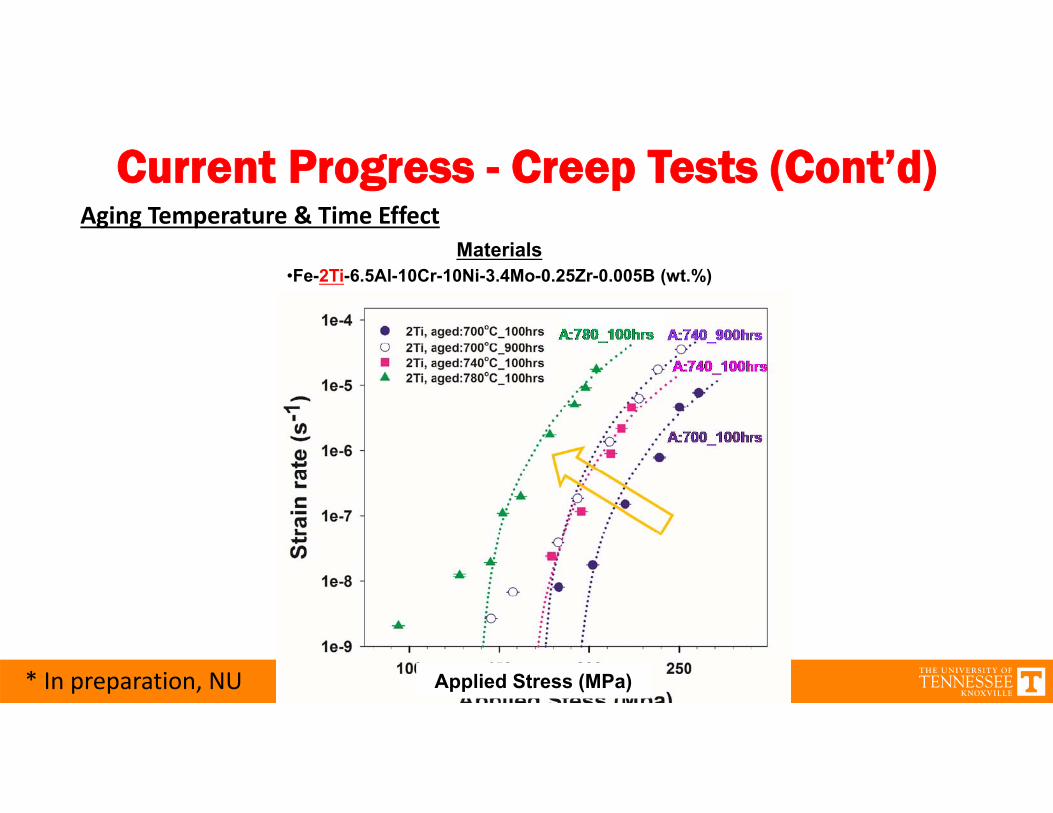
Current Progress - Creep Tests (Cont’d)
Materials•Fe-2Ti-6.5Al-10Cr-10Ni-3.4Mo-0.25Zr-0.005B (wt.%)
Applied Stress (MPa)
Aging Temperature & Time Effect
* In preparation, NU

Current Progress - Creep Tests (Cont’d)
Materials•Fe-2Ti-6.5Al-10Cr-10Ni-3.4Mo-0.25Zr-0.005B (wt.%)
Applied Stress (MPa)
Aging Temperature & Time Effect
* In preparation, NU

Current Progress - Creep Tests (Cont’d)
Materials•Fe-2Ti-6.5Al-10Cr-10Ni-3.4Mo-0.25Zr-0.005B (wt.%)
Applied Stress (MPa)
Aging Temperature & Time Effect
* In preparation, NU