computational grids: current status and future directions · computational grids: current status...
TRANSCRIPT

1
Computational Grids:Current Status and Future Directions
Rick StevensDirector, Mathematics and Computer Science Division
Argonne National Laboratory
Professor, Department of Computer ScienceDirector, Computation Institute
The University of Chicago
Outline
• Brief History of Grid Computing• Overview of some US based grid projects• The NSF supported TeraGrid project• Global Grid Forum• Access Grid and Collaboration Technologies• The Emerging BioGrid• An Invitation• Conclusions

2
A Brief History of Grid Computing:I-WAY and the Value of Stunt Science
“Internet” circa 1969 Internet circa 1999
“I-WAY”
20021995
Evolution of the Grid Concept
• Metacomputing: late 80s• Focus on distributed computation
• Gigabit testbeds: early 90s• Research, primarily on networking
• I-WAY: 1995• Demonstration of application feasibility
• PACIs (National Technology Grid): 1997• NASA Information Power Grid: 1999• ASCI DISCOM: 1999 • DOE Science Grid: 2001• Commercial Startups
• Applied Metasystems, Entropia, Distributed Science, etc.
Applications
Apps Tools
Middleware
Networking
Resources

3
SIGGRAPH 89Science by Satellite
“Using satellite technology…demo ofWhat It might be like to have high-speed fiber-optic links between advanced computers in two different geographic locations.”―――― Al Gore, Senator
Chair, US Senate Subcommittee on Science, Technology and Space
“What we really have to do is eliminate distance between individuals who want to interact with other people and with other computers.”―――― Larry Smarr, Director
National Center for Supercomputing Applications, UIUC
SIGGRAPH 92 in Chicago Showcase: Science in the 21st Century
“From the atom to the Universe…it’s all here. Three dozen projects can now come through the network and appear to be in McCormick Place…Simulations on remote supercomputers or created from data gathered from far away instruments, these visualizations demonstrate the power of distributed computing, doing computing where the resources are and not necessarily on a single machine.”―――― Larry Smarr, Director, National Center for Supercomputing Applications, UIUC
“We have to develop the technology and techniques――――and the sociology――――to go along with group activities.”―――― Sid Karin, Director, San Diego Supercomputer Center, UCSD
UCSD NCMIRin San Diego
UCSD NCMIRin Chicago
UCSD National Center for Microscopy and Imaging Research (NCMIR) http://www-ncmir.ucsd.eduUIC
4
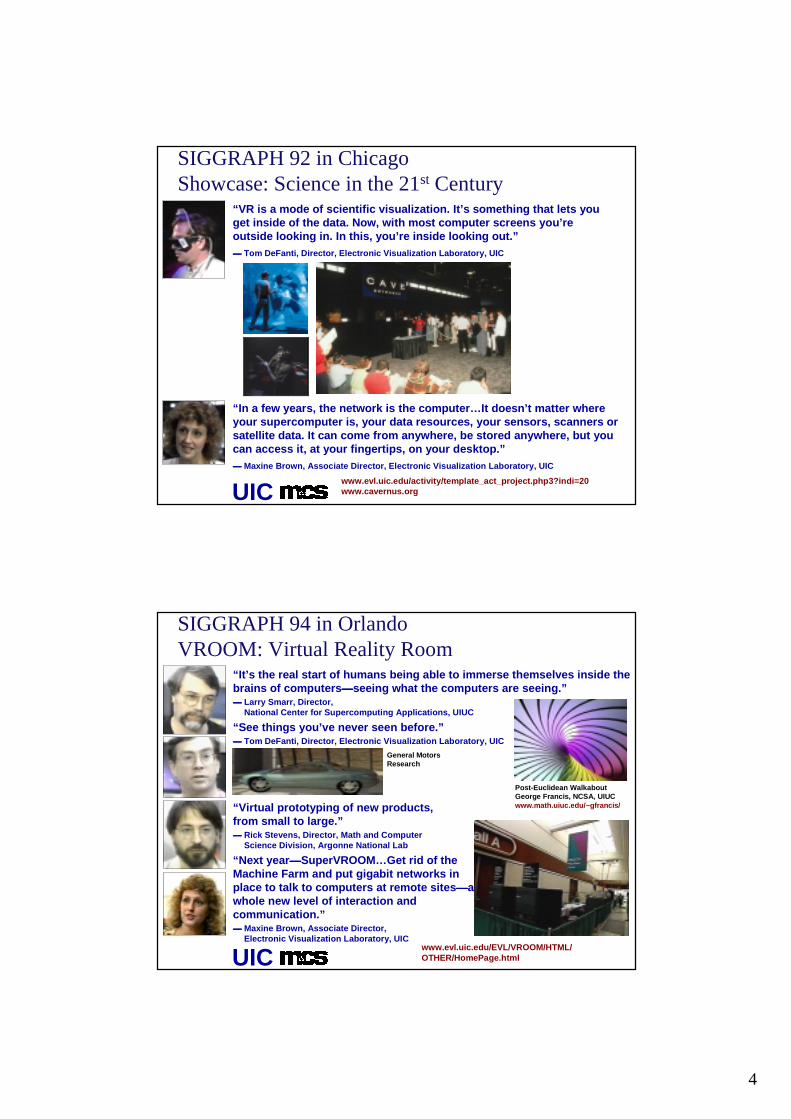
SIGGRAPH 92 in Chicago Showcase: Science in the 21st Century
“VR is a mode of scientific visualization. It’s something that lets you get inside of the data. Now, with most computer screens you’re outside looking in. In this, you’re inside looking out.”―――― Tom DeFanti, Director, Electronic Visualization Laboratory, UIC
UIC www.evl.uic.edu/activity/template_act_project.php3?indi=20www.cavernus.org
“In a few years, the network is the computer…It doesn’t matter where your supercomputer is, your data resources, your sensors, scanners or satellite data. It can come from anywhere, be stored anywhere, but you can access it, at your fingertips, on your desktop.”―――― Maxine Brown, Associate Director, Electronic Visualization Laboratory, UIC
“It’s the real start of humans being able to immerse themselves inside the brains of computers――――seeing what the computers are seeing.”―――― Larry Smarr, Director,
National Center for Supercomputing Applications, UIUC
“See things you’ve never seen before.”―――― Tom DeFanti, Director, Electronic Visualization Laboratory, UIC
“Virtual prototyping of new products, from small to large.”―――― Rick Stevens, Director, Math and Computer
Science Division, Argonne National Lab
“Next year――――SuperVROOM…Get rid of the Machine Farm and put gigabit networks in place to talk to computers at remote sites――――awhole new level of interaction and communication.”―――― Maxine Brown, Associate Director,
Electronic Visualization Laboratory, UIC
SIGGRAPH 94 in OrlandoVROOM: Virtual Reality Room
Post-Euclidean WalkaboutGeorge Francis, NCSA, UIUCwww.math.uiuc.edu/~gfrancis/
General MotorsResearch
UIC www.evl.uic.edu/EVL/VROOM/HTML/OTHER/HomePage.html

5
Supercomputing 95 in San DiegoI-WAY: Information Wide Area Year
UIC
The barriers: time and distanceThe barrier-shattering prototype: I-WAY
I-WAY featured:• Application demonstrations• OC-3 backbone• Large-scale immersive displays• I-Soft programming environment
http://archive.ncsa.uiuc.edu/General/Training/SC95/GII.HPCC.html
The Internet evolved from ARPAnet, a research network built in 1969 that primarily was a communications tool of the research community until the invention of the World Wide Web-and later Mosaic-that opened it up to the wider community.
I-WAY creators Larry Smarr, Rick Stevens and Tom DeFanti, believe the next great wave of evolution on the Internet will be unleashed by I-WAY.
Supercomputing 95I-WAY: Information Wide Area Year
UIC
“We definitely pushed the envelope. There’s a whole community of people now who have a different way of thinking about how to do science and how to do visualization, and have been a part of an experience that will guide or influence how they think about science over the next few years.”―――― Rick Stevens, Director, Math and Computer Science Division, Argonne National Lab
“I-PoP machines uniformly configure gateways to supercomputers. I-Soft software creates a necessary standard operating environment.”―――― Ian Foster, Associate Director, Math and Computer Science
Division, Argonne National Laboratory
“One of the reasons we’ve been working on virtual-reality technology is because it’s an excellent test for this sort of technology. We need the supercomputers to give us the realism and the simulations, and we need the high-speed networks to give us the feel of telepresence――――of being somewhere else.”―――― Tom DeFanti, Director, Electronic Visualization Lab, UIC
“VR is an intelligent user interface into the whole electronic superhighway. How are people going to talk to computers in the future?”―――― Maxine Brown, Associate Director, Electronic Visualization Lab, UIC

6
The Emerging Concept of a Computational Grid
Prototyping America’s 21st Century Information InfrastructureThe NSF PACI National Technology Grid Prototype, 1997

7
iGrid 1998 at SC’98November 7-13, 1998, Orlando, Florida, USA
• 10 countries: Australia, Canada, Germany, Japan, Netherlands, Russia, Singapore, Switzerland, Taiwan, USA
• 22 demonstrations featured technical innovations and application advancementsrequiring high-speed networks, with emphasis on remote instrumentation control, tele-immersion, real-time client server systems, multimedia, tele-teaching, digital video, distributed computing, and high-throughput, high-priority data transfers
www.startap.net/igrid98
UIC
iGrid 2000 at INET 2000July 18-21, 2000, Yokohama, Japan
• 14 regions: Canada, CERN, Germany, Greece, Japan, Korea, Mexico, Netherlands, Singapore, Spain, Sweden, Taiwan, United Kingdom, USA
• 24 demonstrations featuring technical innovations in tele-immersion, large datasets, distributed computing, remote instrumentation, collaboration, streaming media, human/computer interfaces, digital video and high-definition television, and grid architecture development, and application advancements in science, engineering, cultural heritage, distance education, media communications, and art and architecture
www.startap.net/igrid2000
UIC

8
Proposed iGrid 2002 Demonstrations • To date, 14 countries/locations proposing 28 demonstrations: Canada, CERN, France,
Germany, Greece, Italy, Japan, The Netherlands, Singapore, Spain, Sweden, Taiwan, United Kingdom, United States
• Applications to be demonstrated: art, bioinformatics, chemistry, cosmology, cultural heritage, education, high-definition media streaming, manufacturing medicine, neuroscience, physics, tele-science
• Grid technologies to be demonstrated: Major emphasis on grid middleware, data management grids, data replication grids, visualization grids, data/visualization grids, computational grids, access grids, grid portals
• Other technologies to be demonstrated: optical networks as a data storage medium, logistical networking
iGrid 2002September 24-26, 2002, Amsterdam, The Netherlands
www.startap.net/igrid2002UIC
Overview of Some US Based Grid ProjectsGriPhyn, NVO/BIMA, iVDGL, NEESgrid, etc.
Sloan DSS
LIGO
ATLAS and CMS
ALMA

9
BIMA Image Pipeline
• Data is transferred from the telescope to NCSA in real time• Data is ingested into the BIMA Data Archive automatically• Astronomers use Web front-end to search, browse, and retrieve data• Raw data is automatically processed by the pipeline using AIPS++
• Use Grid technologies to distribute the processing
Radio Astronomy Imaging
Web Interface
BIMAData Archive
BIMAImage Pipeline
AIPS++
The Grid
Pipeline ComponentsRadio Astronomy Imaging
Archive System
Event ServerIngestEngine
Script Generator
Queue Manager
DataManager
Signal the arrivalof new data
Determine what processing can take place.
Match data to processing recipes
Submit and monitorjobs on multiple platforms
Serial ParallelSM
ParallelCluster
4-processorLinux box Origin 2000 NCSA Linux
Clusters

10
NEES Grid
• Network For Earthquake Engineering Simulation (NEES)• Integrate Seamless Testing And Simulation• Enable New Earthquake Hazard Mitigation
• Structural, Geotechnical And Tsunami• Collaboratory Integration
• Physical Testing Sites• Simulation Codes And Data Stores• Research Engineers And Practitioners
• National IT Infrastructure• Computational Facilities And Networks Via “Middleware”• Telepresence (Remote Observation/Operation)• Data Sharing• Numerical Simulation And Modeling
• NCSA And Civil Engineering Leadership• ANL Collaboratory And Grid Leadership
India, 2001
NEESGrid: Users Are Central
User Services and Support
User Services and Support
Common Services (Security, Account management and
Information)
Common Services (Security, Account management and
Information)
Common Catalog(Data, software, and resources)
Common Catalog(Data, software, and resources)
Common Equipment Interfaces
Common Equipment Interfaces
Existing Experimental Equipment
Existing Experimental Equipment
NEES Experimental Equipment
NEES Experimental Equipment
Common Data Management Interfaces
Common Data Management Interfaces
NEES Data Repository
(NCSA)
NEES Data Repository
(NCSA)
Auxiliary Data Repository
Auxiliary Data Repository
Existing Data Repository (e.g.
IRIS)
Existing Data Repository (e.g.
IRIS)
Common Compute Resource Management Interfaces
Common Compute Resource Management Interfaces
NEES Compute Server (NCSA)
NEES Compute Server (NCSA)
Auxiliary Compute Servers
Auxiliary Compute Servers
Software Repositories Software
Repositories
UsersUsers

11
GriPhyN: Grid Physics Network
• Challenges• Petabyte-scale Computational Environments• Geographically Dispersed Data Extraction• Large-scale Distributed Collaborations
• Science Targets• CMS And ATLAS Experiments
• Large Hadron Collider (LHC) At CERN • LIGO (Laser Interferometer Gravitational-wave Observatory)• SDSS (Sloan Digital Sky Survey)
• Co-leader: Ian Foster, Argonne National Laboratory
Example Grid Communities: Grid Physics Network• Enable [thousands of] physicists to pool data & computing
resources for data-intensive analyses
Virtual Data Tools Request Planning and Scheduling Tools
Request Execution Management Tools
Transforms
Distributed resources(code, storage,computers, and network)
Resource Management
Services
Resource Management
Services
Security and Policy
Services
Security and Policy
Services
Other Grid Services
Other Grid Services
Interactive User Tools
Production Team
Individual Investigator Other Users
Raw data source

12
Sloan Digital Sky Survey
• Attributes• Most ambitious survey ever undertaken
• one quarter of the sky• positions and absolute brightness
– more than 100 million celestial objects• distances to a million of the nearest galaxies• distances to 100,000 quasars
• Digital detectors producing 15 TB of data• Participants
• University of Chicago, Fermilab, Institute for Advanced Study, Japan Participation Group, The Johns Hopkins University
• Max-Planck-Institute for Astronomy (MPIA), Max-Planck-Institute for Astrophysics (MPA), New Mexico State University,
• Princeton University, the United States Naval Observatory, and the University of Washington
Size distribution ofgalaxy clusters?
1
10
100
1000
10000
100000
1 10 100
Num
ber o
f Clu
ster
s
Number of Galaxies
Galaxy clustersize distribution
Chimera Virtual Data System+ GriPhyN Virtual Data Toolkit
+ iVDGL Data Grid (many CPUs)
Example:Sloan Digital Sky Survey Analysis

13
LIGO Gravity Wave Detector
• Laser Interferometer Gravitational-wave Observatory
• Experimental Validation Of Einstein’s Theory
• Two Widely Separated U.S. Detectors• Hanford, WA And Livingston, LA
• Challenges• Small Signal-to-noise Ratio
• Length Changes Less Than 1000th A Nucleus Diameter
• Extremely Rare Events• Less Than One Per Year
• Leaders• Caltech And MIT
Particle Physics Grid
• New CERN particle detectors• Over 1 petabyte (PB) of data per year• Rare events from decay of massive new particles
• CMS and ATLAS experiments at CERN• CMS (Compact Muon Solenoid)• ATLAS (Toroidal LHC ApparatuS)
CERN Simulated Higgs Decay

14
Grid Middleware [toolkits for building Grids]
• PKI Based Security Infrastructure• Distributed Directory Services• Reservations Services• Meta-Scheduling and Co-Scheduling• Quality of Service Interfaces• Grid Policy and Brokering Services• Common I/O and Data Transport Services• Meta-Accounting and Allocation Services
The NSF supported TeraGrid projectPrototyping cyberinfrastructure for the future• Computational Grid integrating computing
environments at• SDSC, NCSA, Caltech, Argonne and PSC (via ETF)
• Common operating environment based on Globus• Open Grid Services Architecture
• Security, data services, scheduling, directories, etc.• Applications oriented services
• Data access, Visualization, On Demand Access, Compute
• Dedicated 40 Gbps backplane network• High-performance network interfaces to clusters
• Funded at $88Million (DTF and ETF)

15
Site Coordination CommitteeSite Leads
Project DirectorRick Stevens (UC/ANL)
DTF/ETF TeraGrid Management Structure
Technical Coordination CommitteeProject-wide Technical Area Leads
ClustersPennington
(NCSA)
NetworkingWinkler(ANL)
Grid SoftwareKesselman (ISI)Butler (NCSA)
DataBaru
(SDSC)
ApplicationsWIlliams(Caltech)
VisualizationPapka(ANL)
Performance EvalBrunett
(Caltech)
Chief ArchitectDan Reed (NCSA)
Executive CommitteeFran Berman, SDSC (Chair)
Ian Foster, UC/ANLMichael Levine, PSC
Paul Messina, CITDan Reed, NCSA
Ralph Roskies, PSCRick Stevens, UC/ANL
Charlie Catlett, ANL
Technical Working Group• Are we creating an extensible cyberinfrastructure?
External Advisory Committee• Are we enabling new science?• Are we pioneering the future?
External Advisory Committee• Are we enabling new science?• Are we pioneering the future?
Institutional Oversight CommitteeTBD, UCSD
Richard Herman, UIUCMark Kamlet, CMU
Dan Meiron, CIT (Chair)Robert Zimmer, UC/ANL
Institutional Oversight CommitteeTBD, UCSD
Richard Herman, UIUCMark Kamlet, CMU
Dan Meiron, CIT (Chair)Robert Zimmer, UC/ANL
User Advisory Committee• Are we effectively supporting good science?
NSF MRE Projects
Internet-2McRobbie
Alliance UACSugar, Chair
NPACI UACKupperman, Chair
NSF ACIRNSF ACIRNSF Technical Advisory Committee
NSF Technical Advisory Committee
Policy OversightPolicy Oversight Objectives/Eval
Architecture
Currently being
formed Executive Director /Project Manager
Charlie Catlett (UC/ANL)
ANLEvard
CITBartelt
NCSAPennington
SDSCAndrews
PSCScottOperations
Sherwin(SDSC)
User ServicesWilkins-Diehr (SDSC)
Towns (NCSA)
Implementation
NSF Program Advisory Team
NSF Program Advisory Team
PSC UAG
NSF PACI 13.6 TF Linux TeraGrid32
32
5
32
32
5
Cisco 6509 Catalyst Switch/Router
32 quad-processor McKinley Servers(128p @ 4GF, 8GB memory/server)
Fibre Channel Switch
HPSS
HPSS
ESnetHSCCMREN/AbileneStarlight
10 GbE
16 quad-processor McKinley Servers(64p @ 4GF, 8GB memory/server)
NCSA500 Nodes
8 TF, 4 TB Memory240 TB disk
SDSC256 Nodes
4.1 TF, 2 TB Memory225 TB disk
Caltech32 Nodes
0.5 TF 0.4 TB Memory
86 TB disk
Argonne64 Nodes
1 TF0.25 TB Memory
25 TB disk
IA-32 nodes
4
Juniper M160
OC-12
OC-48
OC-12
574p IA-32 Chiba City
128p Origin
HR Display & VR Facilities
= 32x 1GbE
= 64x Myrinet
= 32x FibreChannel
Myrinet Clos SpineMyrinet Clos Spine Myrinet Clos SpineMyrinet Clos Spine
Chicago & LA DTF Core Switch/RoutersCisco 65xx Catalyst Switch (256 Gb/s Crossbar)
= 8x FibreChannel
OC-12
OC-12
OC-3
vBNSAbileneMREN
Juniper M40
1176p IBM SPBlue Horizon
OC-48
NTON
32
248
32
24
8
4
4
Sun E10K
41500p Origin
UniTree
1024p IA-32320p IA-64
2
14
8
Juniper M40vBNS
AbileneCalrenESnet
OC-12OC-12
OC-12
OC-3
8
SunStarcat
16
GbE
= 32x Myrinet
HPSS
256p HP X-Class
128p HP V2500
92p IA-32
24Extreme
Black Diamond
32 quad-processor McKinley Servers(128p @ 4GF, 12GB memory/server)
OC-12 ATM
Calren
2 2

16
TeraGrid [40 Gbit/s] DWDM Wide Area Network
NCSA/UIUC
ANL
UICMultiple Carrier Hubs
Starlight / NW Univ
Ill Inst of Tech
Univ of Chicago Indianapolis (Abilene NOC)
I-WIRE
StarLightInternational Optical Peering Point
(see www.startap.net)
Los Angeles
San Diego
DTF Backbone
Abilene
Chicago
IndianapolisUrbana
OC-48 (2.5 Gb/s, Abilene)Multiple 10 GbE (Qwest)Multiple 10 GbE (I-WIRE Dark Fiber)
• Solid lines in place and/or available by October 2001• Dashed I-WIRE lines planned for summer 2002
TeraGrid Strategic Partners
• IBM• cluster integration and RAS• GPFS parallel file system
• Intel• McKinley IA-64 software and compilers
• Oracle/IBM• data archive management and mining
• Qwest• 40 Gb/s DTF WAN backbone
• Myricom• cluster interconnect
• SUN (SDSC)• metadata service

17
SDSC TeraGrid Data Architecture
• Philosophy: enable SDSC config to serve the grid as data center
Blue Horizon HPSS
LAN (multiple GbE, TCP/IP)
SAN (2 Gb/s, SCSI)
Linux Cluster, 4TF
Sun F15K
WAN (30 Gb/s)
SCSI/IP or FC/IP
FC Disk Cache (400 TB)
FC GPFS Disk (100TB)
200 MB/s per controller
Silos and Tape, 6 PB,
1+ GB/sec disk to tape
52 tape drives
30 MB/s per drive
Database Engine
Data Miner
Vis Engine
Local Disk (50TB)
design leveraged at other TG sites
Power 4
Power 4 DB
• .5 PB disk• 6 PB archive• 1 GB/s disk-to-tape• Optimized support for DB2 /Oracle• Data working group lead
Switch Switch Switch Switch
Switch
256 x 2Gb FCS
4 x 10Gb Ethernet
256 x 1Gb Ethernet
128 x 2Gb FCS
FC Disk Arrays (500 TB total)
SDSC DTF Cluster: Every Node is a Server
3 x 10 Gbps lambdas
Los Angeles3 x 10 Gbps
Router
1.0 TFLOP 1.0 TFLOP 1.0 TFLOP 1.0 TFLOP2x 2Gb Myrinet Interconnect
Multi-port 2 Gb mesh
Brocade Silkworm
12000
Brocade Silkworm
12000
Brocade Silkworm
12000
Brocade Silkworm
12000
• GigE to everything• Fibrechannel to everything• Myrinet to everything

18
0.1 sec/file250+ MB/s
NVO and TeraGrid
1. FilterRawData
3. Retrieve,Analyze data
4. Outputimage
MCAT (update indexes)
� Significant reduction in time to ingest data; less than 5 days� Web-based query interface for on-line access to all data� Support for multiple surveys; distributed join of data across surveys� Storage and Network works together
With TeraGrid:
1. Filter
SRB Containers (store sorted, processed data
into HPSS)
RawData 3. Retrieve,
Analyze data4. Output
image9.5TB raw data5 million files
MCAT (update indexes)
16MB/s
1 sec/file
� 60 days to ingest (sort, index, store) data� Restricted web-based access to a maximum of 100 MB file (1 SRB container)
Today:
Store data via SRB
Store products
1. FilterRawData 1. FilterRawData 1. Filter
Data from other surveys
10’s of TB of data
Blue Horizon
DTF Cluster
RawData
2. Sort/Index Data
2. Sort/Index Data
Extensible TeraGrid Backplane
Extensible Backplane NetworkLA
HubChicago
Hub
30 Gb/s
30 Gb/s
30 Gb/s30 Gb/s
30 Gb/s
NCSA: Compute-IntensiveSDSC: Data-Intensive PSC: Compute-Intensive
IA64
IA64 Pwr4EV68
EV7Sun
Sun
40 Gb/s
IA32
IA32IA64 Sun
IA32
Storage Server
Disk Storage
Cluster
Shared Memory
VisualizationCluster
LEGEND
IA64
ANL: VisualizationCaltech: Data collection analysis
Backplane Router
Charlie Catlett ([email protected])

19
Global Grid ForumAn International Grid standards organization• Provides community based standards for Grid software
and applications environments• Founded in US 1999 • Expanded in 2001 to include European efforts and
expanded to include Asia Pacific efforts in 2003• Modeled after the Internet Engineering Task Force
(IETF) which developed internet standards• Develops both standards and requirements• Strong support from government agencies in US,
Europe
GGF Structure
Steering Group•GGF Management•Document Series Review
Advisory Committee
•Strategic Advice•Appoints GGF Chair
Area
Area
AreaArea
Area
Area
ADAD
ADAD
ADAD
ADAD
ADAD
ADAD
ChairEditor
Document and Standards WorkSecretariat: Support Functions
Board of Directors(Catlett, Messina, Spada)
Conference Mgmt
Sponsor Programs
Finance/Office
IS (Website, etc.)
Holds non-exclusive © for document series
•External Strategic Advice•Appoints GGF Chair
GGF, Inc. GGF
= working group
= research group
As of 9/2002:15 working groups16 research groups10 proposed groups

20
GGF7 is in Tokyo March 4-7th, 2003
0
100
200
300
400
500
600
700
800
900
1000
GF1 GF3 GF5 GGF2 GGF4
Participants Countries Organizations Authors
• Created following BOF at SC98• Exponential Growth
• Inflection points at 150-200 people and 8-900 people
• Created GGF, Inc (non-profit).• Manage finances, Legal coverage,
Hold copyright, Hire staff…• Intellectual Property policies
isomorphic with IETF• “standards” process modeled after
Internet Standards Process (improved with IETF help)
• GGF-6 in Chicago (October 2002)• No plenary or tutorials – group work
sessions only• Registration data as of 9/18 indicates
350-400 will participate.
1999 2000 2001 2002
APME RGs in “GridSpace”
Informationservices
Faultdetection
. . .Resourcemgmt
AppApp--SpecificSpecificFrameworks, Frameworks, Requirements,Requirements,
TestbedsTestbeds(APPS)(APPS)
. . .
net
ProgrammingProgrammingSystems&ToolsSystems&Tools
(APM)(APM)
Fabric Management
Lower-level GridOS (e.g. Globus) Services
Portals, Portals, PSEsPSEsFramewoksFramewoks
(GCE)(GCE)
User Services, User Services, ManagementManagement
(GUS)(GUS) Various Various other other WGsWGs
Grid AppsGrid Apps
CollaborationCollaborationToolsTools(ACE)(ACE)
Higher-Level language tools, middleware & components

21
Access Grid and Collaboration TechnologiesConnecting People and Applications via the Grid
Access Grid � Integrating Group to Group Collaboration and Visualization
AG Project Goals• Enable Group-to-Group Interaction and Collaboration
• Connecting People and Teams via the Grid• Improve the User Experience: Go Beyond Teleconferencing
• Provide a Sense of Presence• Support Natural Interaction Modalities
• Use Quality but Affordable Digital IP Based Audio/video• Leverage IP Open Source Tools
• Enable Complex Multisite Visual and Collaborative Experiences• Integrate With High-end Visualization Environments• ActiveMural, Powerwall, CAVE Family, Workbenches
• Build on Integrated Grid Services Architecture• Develop New Tools Specifically Support Group Collaboration
22
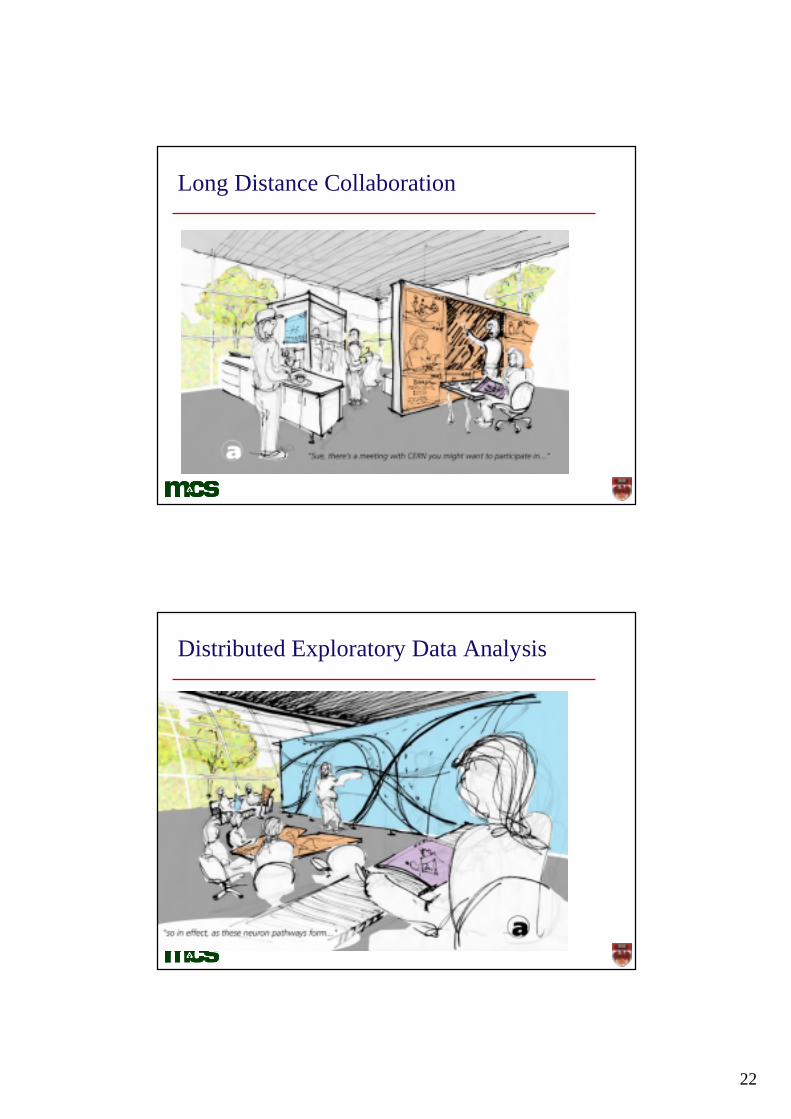
Long Distance Collaboration
Distributed Exploratory Data Analysis
23
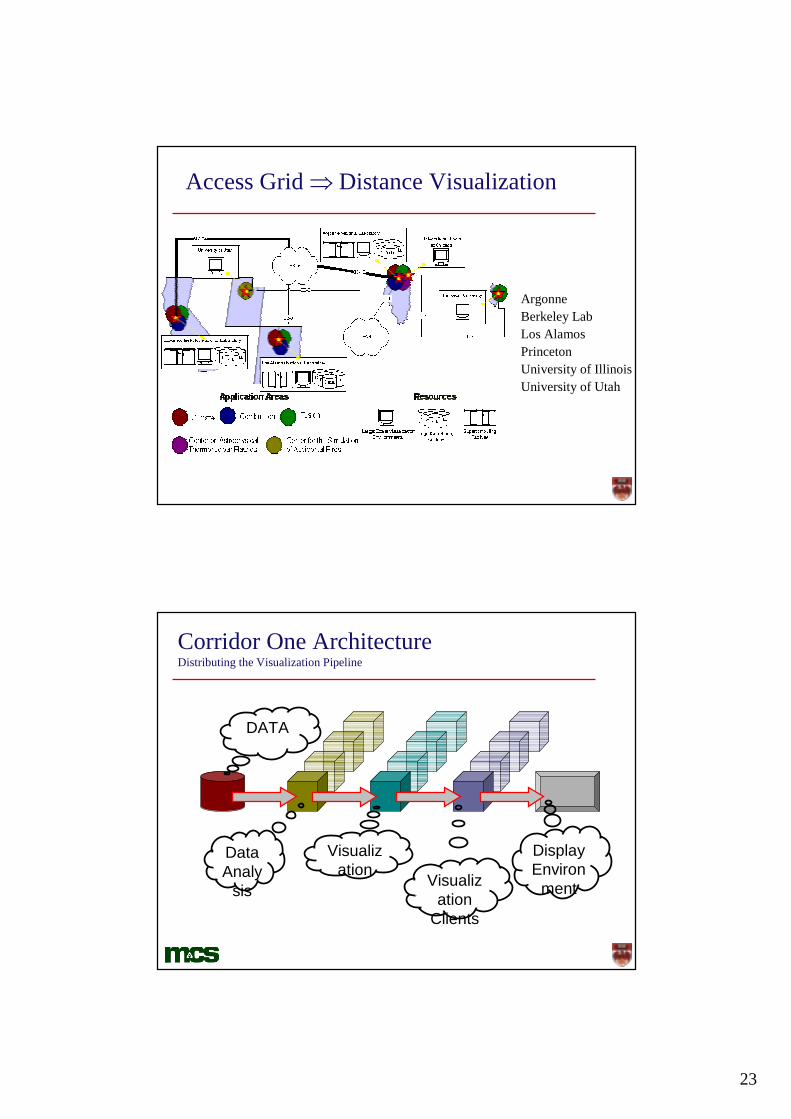
Access Grid � Distance Visualization
ArgonneBerkeley LabLos AlamosPrincetonUniversity of IllinoisUniversity of Utah
Corridor One ArchitectureDistributing the Visualization Pipeline
DATA
Data Analy
sis
Visualization Visualiz
ationClients
DisplayEnviron
ment

24
GeoWall
• Low cost passive stereo for Geosciences research and teaching
• Working with U of Michigan, U of Minnesota, US Geological Survey, UIC Earth and Environmental Science, and others
• Also in use at SciTech Museum in Aurora and Abraham Lincoln Elementary School in Oak Park
TeraVision• Specialized hardware for streaming graphics
over GigE.• Takes VGA or DVI plug as input, digitizes it
at 1024x768 @ 30fps and streams it to remote sites for viewing.
• Can be ganged and synched to stream an entire tiled display.
• Demo at IGrid streams from Greece to Amsterdam and EVL to Amsterdam.
www.evl.uic.edu/cavern/teranode

25
The Continuum at EVL and TRECCAmplified Work Environment
Passive stereo display AccessGrid Digital white board
Tiled display
The Emerging BioGridChallenges of Biology are well Suited for Grids• EUROGRID BioGRID• Asia Pacific BioGRID• NC BioGrid• Bioinformatics Research Network• Osaka University Biogrid• Indiana University BioArchive BioGrid• Many more under development…

26
The New Biology
• Genomics• Functional Genomics• Proteomics• Structural Biology• Gene Expression• Metabolomics • Advanced Imaging
• High-throughput methods• Low cost• Robotics
• Bioinformatics driven• Quantitative• Enables a systems view• Basis for integrative
understanding• Global state• Time dependent
Environment
Predicting Life Processes: Reverse Engineering Living SystemsPredicting Life Processes: Reverse Engineering Living Systems
Transcription
Translation
Proteins
Biochemical Circuitry
Phenotypes (Traits)
DNA (storage)
Gene Expression
Metabolomics
Proteomics
Adapted From Bruno Sobral VBI
27
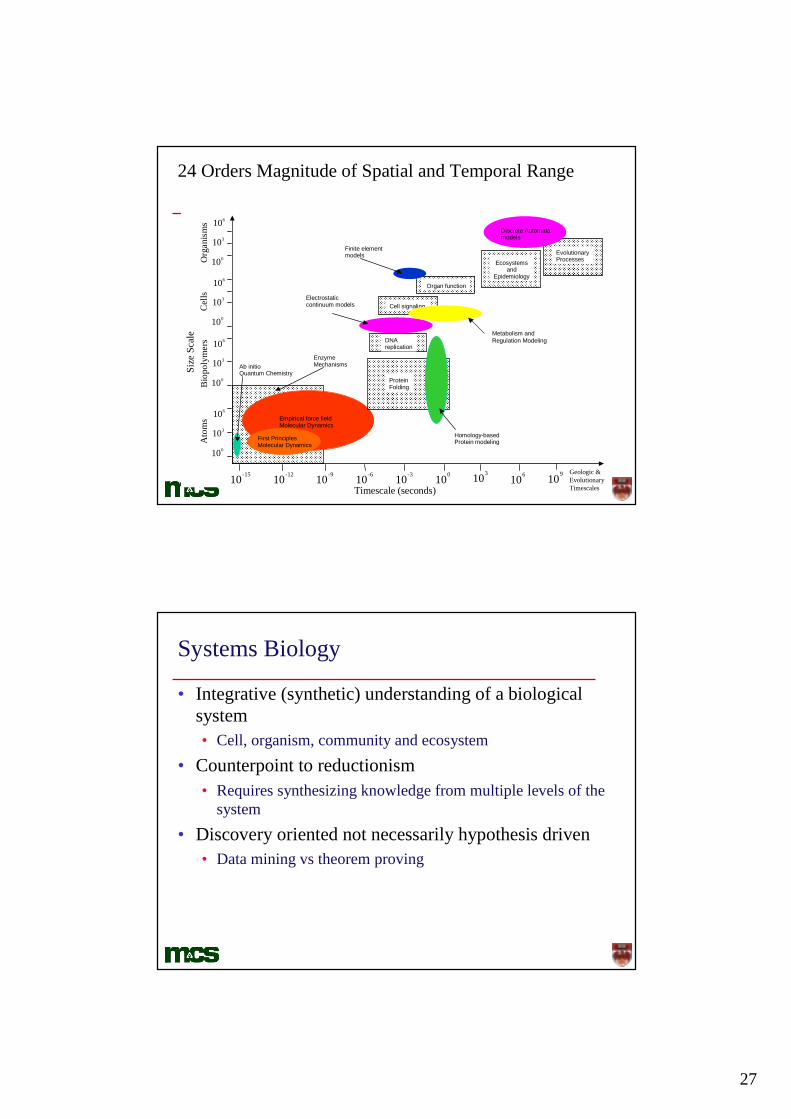
24 Orders Magnitude of Spatial and Temporal Range
Timescale (seconds)10-15 10-9 10-6 10-3 100 103
10-12 109
Size
Sca
leA
tom
s B
iopo
lym
ers
Geologic &EvolutionaryTimescales
106
Org
anis
ms
Ab initioQuantum Chemistry
First PrinciplesMolecular Dynamics
Empirical force fieldMolecular Dynamics
EnzymeMechanisms
ProteinFolding
Homology-basedProtein modeling
EvolutionaryProcessesEcosystems
andEpidemiology
Cell signalingCel
ls
100
103
106
100
103
106
100
103
106
100
103
106
Organ function
DNAreplication
Finite elementmodels
Electrostaticcontinuum models
Discrete Automatamodels
Metabolism andRegulation Modeling
Systems Biology
• Integrative (synthetic) understanding of a biological system• Cell, organism, community and ecosystem
• Counterpoint to reductionism• Requires synthesizing knowledge from multiple levels of the
system• Discovery oriented not necessarily hypothesis driven
• Data mining vs theorem proving

28

29
Sequence AnalysisSequence AnalysisSequence AnalysisSequence AnalysisModuleModuleModuleModule
Whole genome Whole genome Whole genome Whole genome AnalysisAnalysisAnalysisAnalysis
And ArchitectureAnd ArchitectureAnd ArchitectureAnd ArchitectureModuleModuleModuleModule
ExperimentationExperimentationExperimentationExperimentationProteomicsProteomicsProteomicsProteomics
Networks AnalysisNetworks AnalysisNetworks AnalysisNetworks AnalysisModuleModuleModuleModule
Metabolic Metabolic Metabolic Metabolic SimulationSimulationSimulationSimulationPhenotypesPhenotypesPhenotypesPhenotypes
ModuleModuleModuleModule
Metabolic Metabolic Metabolic Metabolic EngineeringEngineeringEngineeringEngineering
Gene Functions Assignments
ExperimentationExperimentationExperimentationExperimentation
Conjectures about Gene Functions
Gene AnnotationsAnnotated Data Sets
Visualization
Genome FeaturesAnnotated Genome MapsGenomes Comparisons
Visualization
Metabolic ReconstructionsMetabolic ReconstructionsMetabolic ReconstructionsMetabolic Reconstructions(Annotated stoichiometric (Annotated stoichiometric (Annotated stoichiometric (Annotated stoichiometric MatriciesMatriciesMatriciesMatricies))))
Operons, regulonsnetworks
Predictions of RegulationPredictions of New pathways
Functions of HypotheticalsNetworks Comparisons
Conserved Chromosomal Gene Clusters
An Integrated View of Simulation, Experiment, and Bioinformatics
DatabaseAnalysis
Tools
Experiment
SIMS
ProblemSpecification Simulation Browsing &
Visualization
LIMS
ExperimentalDesign
Browsing &Visualization

30
Metabolic Reconstruction
Function Assignment
Stoichiometric Representation& Flux Analysis
Dynamic Simulation
Network Visualization Tools
Genome Visualization Tools
Whole Cell VisualizationsImage/Spectra Augmentations
Interactive StoichiometricGraphical Tools
Laboratory Verification
VisualizationEnvironment
BioinformaticAnalysis Tools
Whole Genome Analysis
Microbiology &Biochemistry
Enzymatic ConstantsMetabolic ***
Proteomics
Visualization + Bioinformatics
Argonne Pathway Explorer on µMural Tiled Display
31
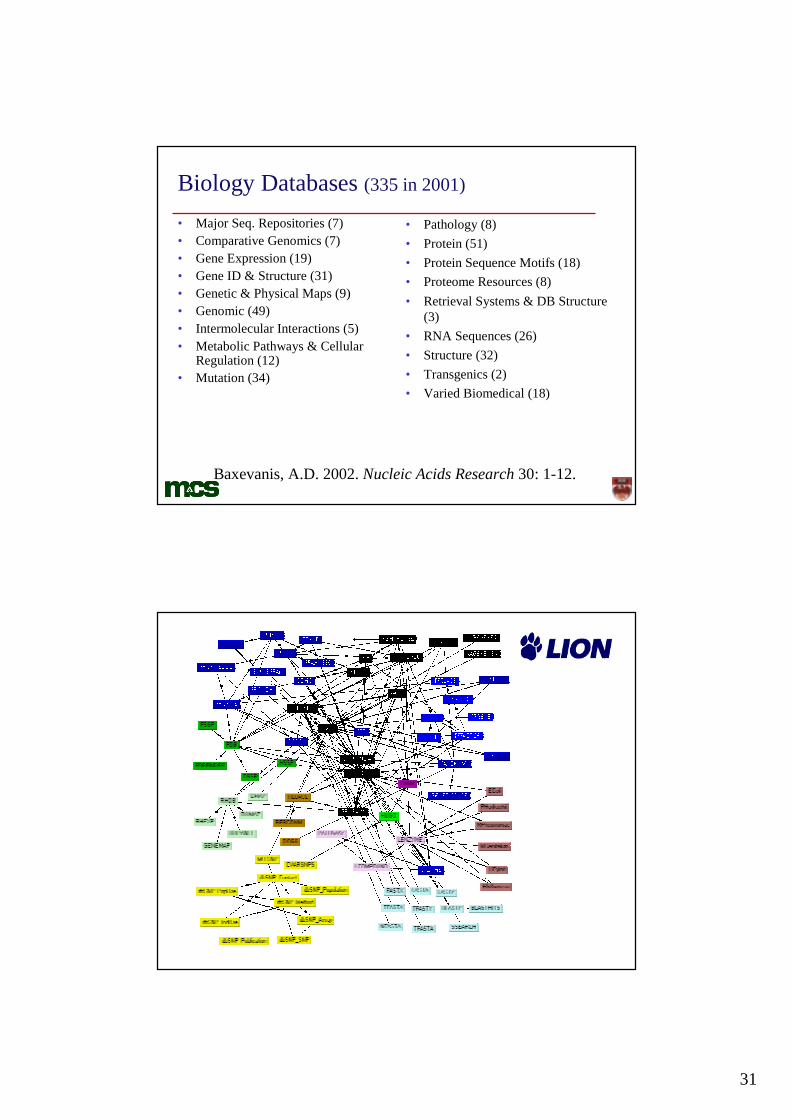
Biology Databases (335 in 2001)
• Major Seq. Repositories (7)• Comparative Genomics (7)• Gene Expression (19)• Gene ID & Structure (31)• Genetic & Physical Maps (9)• Genomic (49)• Intermolecular Interactions (5)• Metabolic Pathways & Cellular
Regulation (12)• Mutation (34)
• Pathology (8)• Protein (51)• Protein Sequence Motifs (18)• Proteome Resources (8)• Retrieval Systems & DB Structure
(3)• RNA Sequences (26)• Structure (32)• Transgenics (2)• Varied Biomedical (18)
Baxevanis, A.D. 2002. Nucleic Acids Research 30: 1-12.
32
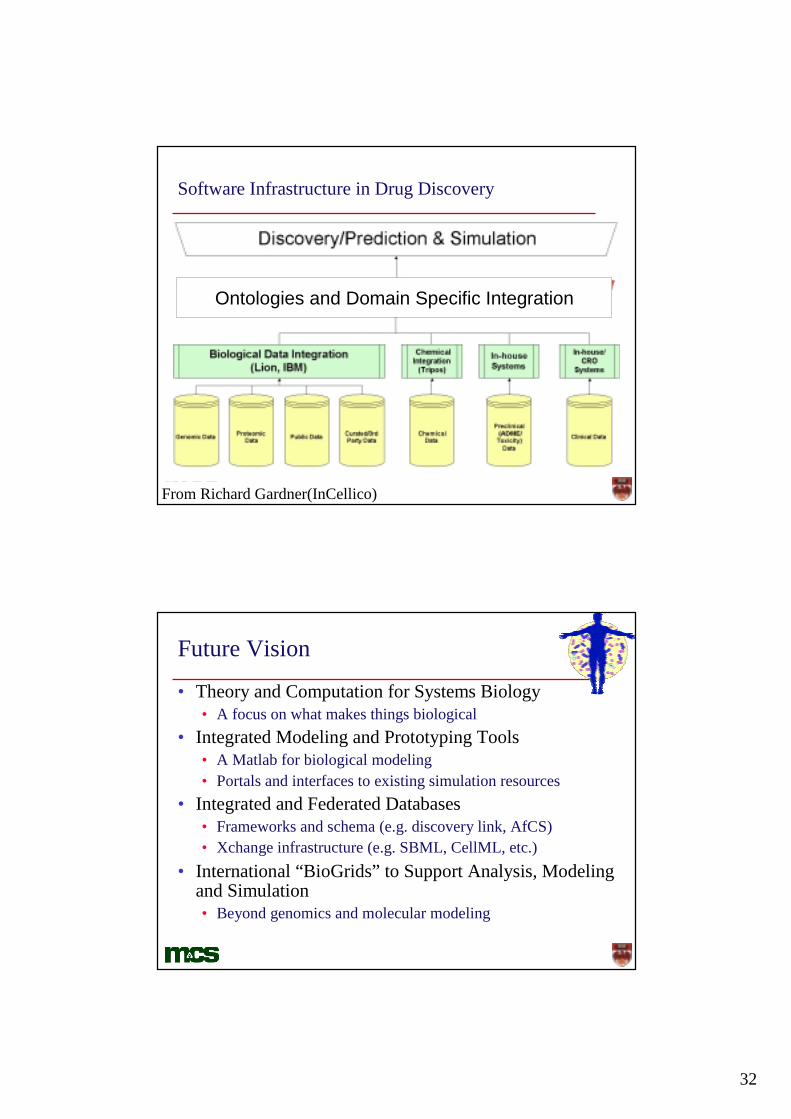
Software Infrastructure in Drug Discovery
TMOntologies and Domain Specific Integration
From Richard Gardner(InCellico)
Future Vision
• Theory and Computation for Systems Biology• A focus on what makes things biological
• Integrated Modeling and Prototyping Tools• A Matlab for biological modeling• Portals and interfaces to existing simulation resources
• Integrated and Federated Databases• Frameworks and schema (e.g. discovery link, AfCS)• Xchange infrastructure (e.g. SBML, CellML, etc.)
• International “BioGrids” to Support Analysis, Modeling and Simulation• Beyond genomics and molecular modeling

33
What the BioGrid Needs To Provide?• Scalable compute and data beyond that available locally
• One to two orders of magnitude improvement• Distributed infrastructure available 24x7 worldwide
• Biology is a worldwide 24 hour enterprize• Integration with local bioinformatics systems for seamless
computing and data management• Empower local biologists by dramatically extending their power
• Enables access to state of the art facilities at fraction of the cost (SPs just add more servers)• Purpose built systems and special purpose devices
• Centralized support of tools and data• Improve access to latest data
• Bottom line � enables biologists to focus on biology
What We Need to Create• Grid Bio applications enablement
software layer• Provide application’s access to
Grid services• Provides OS independent services
• Grid enabled version of bioinformatics data management tools (e.g. DL, SRS, etc.)• Need to support virtual databases
via Grid services• Grid support for commercial
databases • Bioinformatics applications “plug-
in” modules• End user tools for a variety of
domains• Support major existing Bio IT
platforms
Compute Data
BioGrid “Vocabulary”
BioGrid Applications
Grid Resources

34
BioGrid Services Model
Domain Oriented Services
Grid Resource Services
Basic BioGrid Services
• Drug Discovery• Microbial Engineering• Molecular Ecology• Oncology Research
• Integrated Databases• Sequence Analysis• Protein Interactions• Cell Simulation
• Compute Services• Pipeline Services• Data Archive Service• Database Hosting
Architecture Requirements for Biology
• Computational Biology is as Diverse as Biology itself
• Need for access to a variety of future systems
• Capacity Computing • Clusters for high-throughput support• Automation of experimental laboratories
• Capability Computing• Current: Protein science and
Bioengineering• Future: cell modeling and virtual
organisms• Data Intensive Computing
• Data mining (genomes, expression data, imaging, etc.)
• Annotation pipelines• Purpose built devices for well understood
problems• Sequence analysis, imaging and perhaps
protein folding

35
A Proposed International Systems Biology Grid
• A Data, Experiment and Simulation Grid Linking:• People [biologists, computer scientists, mathematicians, etc.]• Experimental systems [arrays, detectors, MS, MRI, EM, etc.]• Databases [data centers, curators, analysis servers]• Simulation Resources [supercomputers, visualization, desktops]• Discovery Resources [optimized search servers]• Education and Teaching Resources [classrooms, labs, etc.]
• Potentially finer grain than current Grid Projects• More laboratory integration [small laboratory interfaces]• Many participants will be experimentalists [workflow, visualization]• More diversity of data sources and databases [integration, federation]• More portals to simulation environments [ASP models]
• Global Grid Forum• Life Science Grid research group formed to investigate requirements• First meeting at GGF6 in Chicago last week
An InvitationWe wish to extend the TeraGrid to Japan!• The executive committee of the
TeraGrid project would like to propose to RIKEN to join the TeraGrid
• Interconnect high-performance computing resources in the US with those at leading Japanese research laboratories
• Deploy middleware to enable the rapid sharing of data resources and applications services
• We would also welcome discussions on the feasibility of connecting the Earth Systems Simulator to the Grid
• Sharing of climate modeling expertise• Access to large-scale climate databases
and repositories• Create new Japanese/US research
collaborations in HPC

36
STAR TAP: Enabling the International Grid
Australia
China
Japan
Korea
Singapore
Taiwan
Canada
US Networks: vBNS, Abilene, ESnet, DREN, NREN/NISN
Chile Russia
CERN
Denmark
Finland
France
Iceland
Israel
Netherlands
Norway
Sweden
www.startap.net
STAR TAP, the Interconnect for International High-Performance Networks
Distributed Terascale Facility Backplane
Vancouver
Seattle(U Wash; Microsoft Research)
Washington, DC(Multiple NASA, DOE,
other sites)
Berkeley(LBNL, UCB)
Los Angeles(Caltech, NASA JPL, ISI)
San Diego(UCSD, CalIT2, SDSC)
Chicago
CANARIE CA*Net4(Bell Canada fiber)
IndianapolisSt. LouisUrbana
NCSA/UIUC
ANL
Chicago crossconnect
UICNW Univ (Chicago) STARLIGHT Hub
Ill Inst of Tech
Univ of ChicagoIndianapolis (Abilene NOC)StL Gigapop
I-WIRE
Boston(Multiple University sites)
San Jose(NASA Ames)
STARLIGHTInternational Optical Peering Point(see www.startap.net)
NTON
Irvine(CalIT2)
DTF Backplane

37
Conclusions• Grids are undergoing rapid
growth and development• Grids will enable new classes
of applications, particularly data intensive applications
• Collaboration technology will give Grids a human face
• Global Grid Forum provides needed standards for international interoperability
• Biology maybe the new driver for long-term Grid developments
Acknowledgements
• DOE, NSF, ANL, UC, Microsoft and IBM for support• John Wooley (UCSD), Mike Colvin(LLNL/DOE), Richard Gardner
(InCellico), Chris Johnson (Utah), Dan Reed (NCSA), Dick Crutcher (NCSA), Fran Berman (SDSC), Ralph Roskies (PSC), Horst Simon (NERSC), Ian Foster (ANL/UC), Larry Smarr (UCSD), Tom DeFanti (EVL/UIC) and others contributed to this talk