computational parametric investigations on a … · computational parametric investigations on a...
TRANSCRIPT

105
Int. J. Mech. Eng. & Rob. Res. 2015 Summera Banday and M Marouf Wani, 2015
COMPUTATIONAL PARAMETRICINVESTIGATIONS ON A SINGLE CYLINDER
SPARK IGNITION ENGINE USING ETHANOL-GASOLINE BLENDS FOR POWER GENERATION
Summera Banday1* and M Marouf Wani1
*Corresponding Author: Summera Banday, [email protected]
This study investigates the effect of blending of ethanol and gasoline in a single cylinder fourstroke cycle spark ignition OHV engine fitted to a generator. The simulation is done in theprofessional engine simulation software from AVL Austria named as BOOST. AVL BOOST isused as a computational Thermodynamic simulation tool to analyze the performance andemission characteristics for different blends of ethanol and gasoline (10%, 20%, and 30% ofethanol by volume). The study is carried out for 40%, 50%, 60%, 70%, 80%, 90%, 100% loadconditions for constant engine speed. Results were compared with the pure gasoline. It showedthat as the ethanol content increases power and torque decreases. Fuel consumption increaseswith increase in ethanol percentage. CO emission decreases with increase in ethanol percentagewhereas HC emissions decrease at higher percentage loads. NOX emissions increase withincrease in ethanol percentage.
Keywords: Engine, Gasoline, Alternative fuel, Simulation, Performance, Emission
INTRODUCTIONEthanol is an attractive alternative fuel becauseof its low cost and they can be obtained fromboth natural and manufactured sources. Thetwo kinds of alcohols that seem mostpromising are Methanol (methyl alcohol) andethanol (ethyl alcohol) (Ganesan, 2013).Ethanol has higher antiknock characteristicscompare to gasoline. As such with an alcohol
ISSN 2278 – 0149 www.ijmerr.comVol. 4, No. 2, April 2015
© 2015 IJMERR. All Rights Reserved
Int. J. Mech. Eng. & Rob. Res. 2015
1 Mechanical Engineering Department, National Institute of Technology, Srinagar, India.
fuel, engine compression ratios between 11:1and 13:1 are usual. Today’s gasoline enginesuse a compression ratio of around 7:1 or 9:1,much too low for pure alcohol.
Alcohol reduces harmful exhaust emissionsin a properly designed engine and fuel system.Alcohol contains about half the heat energy ofgasoline per litre. The stoichiometric air fuelratio is lesser for alcohol than for gasoline. The
Research Paper

106
Int. J. Mech. Eng. & Rob. Res. 2015 Summera Banday and M Marouf Wani, 2015
Stoichiometric air fuel ratio for ethanol is 9. Toprovide a proper fuel air mixture, a carburetoror fuel injector fuel passage should be doubledin area to allow extra fuel flow.
Ethanol does not vapourize as easily asgasoline. Its latent heat of vapourization ismuch greater. This affects cold weatherstarting. If the alcohol liquefies in the enginethen it will not burn properly. Thus, the enginemay be difficult or even impossible to start inextremely cold climate. To overcome this,gasoline is introduced in the engine until theengine starts and warms up. Once the enginewarms, alcohol when introduced will vapourizequickly and completely and burn normally.Even during normal operation, additional heatmay be supplied to completely vapourizealcohol. Alcohol burns at about the speed ofgasoline. As such, ignition timing must bechanged, so that more spark advance isprovided. This will give the slow burning alcoholmore time to develop the pressure and powerin the cylinder. Moreover, corrosion resistantmaterials are required for fuel system sincealcohols are corrosive (Ganesan, 2013).Today, the reserves of petroleum based fuelsare being rapidly depleted. It is well known thatthe future availability of energy resources, aswell as the need for reducing CO2 emissionsfrom the fuels used has increased the needfor the utilization of regenerative fuels (Gaoet al., 2007).
LITERATURE SURVEYPiotr Bielaczyc et al. (2013) presented anexamination of the effect of ethanol–gasolineblends’ physicochemical properties onemissions from a light-duty spark ignitionengine. They have conducted a series of on
an unmodified European passenger car on achassis dynamometer over the New EuropeanDriving Cycle, using a constant volumesampler and analyzers for quantification of bothregulated and unregulated exhaust gascompounds, using range of ethanol-gasolineblends from E5 (5% ethanol with 90%gasoline) to E50 (50% ethanol with 50%gasoline). The result showed that certainparameters varied linearly with the addition ofethanol content and some parameters remainsunchanged. Venugopal and Ramesh (2014)presented the experimental studies on theeffect of injection timing in a SI engine usingdual injection of n-butanol and gasoline in theintake port. In this work, they have mountedtwo injectors in the intake port of SI engine inorder to inject gasoline and n-butanolseparately so that the fuels hit the back of theintake valve. They analyzed the performance,emissions and combustion parameters of anengine using gasoline and n-butanol. Initiallythe n- butanol and gasoline were injectedsimultaneously by using two injectors but withdifferent injection timings at 25% and 60%throttle position with 3000rpm. The results werethan compared with pure gasoline and purebutanol i.e. 100% by using a single injector.The result shows that there is nearly 26%reduction in hydrocarbons emission when n-butanol and gasoline were injectedsimultaneously at 25% and 60% throttleposition. The result also shows that at 60%throttle before the gasoline were injected; n-butanol is responsible for the reduction inhydrocarbons (HC) and carbon monoxide(CO) emissions. Ananda Srinivasan andSaravanan (2010) presented the emissionreduction in SI engine using ethanol-gasolineblends on thermal barrier coated piston. In this

107
Int. J. Mech. Eng. & Rob. Res. 2015 Summera Banday and M Marouf Wani, 2015
work, the ethanol-gasoline blends along withIsoheptanol were used in multi-cylinder SIengine in order to analyze the effect of blendson various parameters, i.e., performance,emission and combustion characteristics. Theblended fuel used for the test were preparedby mixing 99.9% pure ethanol and unleadedgasoline with Isoheptanol blend, in the ratio ofE60 + 2.0 Isoheptanol and E50 + 1.0Isoheptanol. The tests were conducted ongeneral multi-Cylinder SI engine and the nexttests were conducted on the same engine butthe piston is coated with Alumina Titania. Theresult shows that there is increase in brakethermal efficiency and CO, CO2 and NOx isslightly decreased whereas HC increased. Butwhen the same tests were conducted onengine with coated piston, the results showsan improvement. The result shows theincrease in brake thermal efficiency andreduction in CO, CO2, HC and NOx emissions.Schifter et al. (2011) presented thecombustion and emission behavior for ethanol-gasoline blends in a single cylinder engine. Inthis work, various performance and exhaustemissionson a single cylinder SI engine wereanalyzed at 2000 rpm. The tested fuel rangevaries from E0 to E20. The result shows thatE10 have marginal effect in combustion ratesthan pure gasoline but E20 slow downcombustion process and increases cyclicdispersion.
PRESENT WORKIn the current investigation AVL BOOST hasbeen used to analyze the effect of blending ofethanol with gasoline at differentconcentrations. A blend of ethanol to gasolinevaries from 0% to 30% by volume were usedin the simulation for various load conditions.
The Engine Specifications is given in Table 1.Properties of ethanol and gasoline fuels areshown in Table 2.
S. No. Type
1. Bore (mm) 65.09
2. Stroke (mm) 61.91
3. Connecting rod length(mm) 123.82
4. Compression ratio 9
5. Maximum power (KW) 4.8 (at 3600 rpm)
6. Maximum torque (N-m) 4.71 (at 3600 rpm)
7. Engine displacementvolume (cm3) 206
Table 1: Test Engine Specifications
Source: Whispower AG 25000E
Fuel Property Ethanol Gasoline
Formula C2H5OH C8H18
Composition weight % Carbon 52.2 85-88
Composition weight % Hydrogen 13.1 12-15
Composition weight % Oxygen 34.7 0-4
Molecular weight 46.07 100-105
Density kg/l 0.79 0.69-0.79
Specific gravity (relative density) 106-110 91
Freezing point –114 –40
Boiling point 78 27-225
Vapor pressure, KPa at 38 °C 15.9 48-103
Specific heat, KJ/KgK 2.4 2.0
Viscosity, mPa at 20 °C 1.19 0.37-0.44
Lower heating value, MJ/Kg 26.8 30-33
Flash point, °C 13 –43
Auto-ignition temperature, °C 423 256
Stochiometric air-fuel ratio, weight 9.0 14.7
Octane number Research 108.6 88-100
Octane number Motor 89.7 80-90
Latent heat of vaporization 923 346
Table 2: Properties of Ethanoland Gasoline
Source: Suat Saridemir (2012)

108
Int. J. Mech. Eng. & Rob. Res. 2015 Summera Banday and M Marouf Wani, 2015
SIMULATION MODELLINGThe BOOST program package consists of aninteractive pre-processor which assists withthe preparation of the input data for the maincalculation program. Results analysis issupported by an interactive post-processor.The model can be designed by placing theelements in the working area first and theconnecting them with the pipes. Alternativelyelements can be placed in the required order(AVL List Gmbh, AVL Boost – User Guide,2009). The Figure 1 displays the createdmodel:
The model consists of the followingelements:1 Cylinder (C), 1 Air Cleaner (CL), 1injector (I), 2 System Boundaries (SB), 3Plenums (PL), 3 Restrictions (R), 7 Measuringpoints and 11 Pipes (Numbers).
COMBUSTION MODELIn this work Vibe two zone model was selectedfor the combustion analysis. Vibe two zone
model divides the combustion chamber intounburned and burned gas region (Heywood,1988). For each zone, the first law ofthermodynamics is applied to predict the rateof fuel consumed with respect to crank angle.
The following Equations (1 and 2) governthe Vibe two zone model (AVL List Gmbh, AVLBoost – Theory, 2009)
d
dmh
ddmh
ddQ
ddVp
dudm uBB
uBBB
uWuu
cuu ,
,
...(2)
where
dudm bb = Denotes change of the internal
energy of burned gas in the cylinder
ddVp b
c = Denotes piston work
ddQF = Denotes fuel heat input
ddm
h bBBbBB
,, = Denotes enthalpy due to blow by
Figure 1: Model of the Engine Used for Parametric Investigations
109
Int. J. Mech. Eng. & Rob. Res. 2015 Summera Banday and M Marouf Wani, 2015
ddmh b
u = Denotes enthalpy flow from the
unburned to the burned zone
u and b in the subscripts denote unburned andburned gas
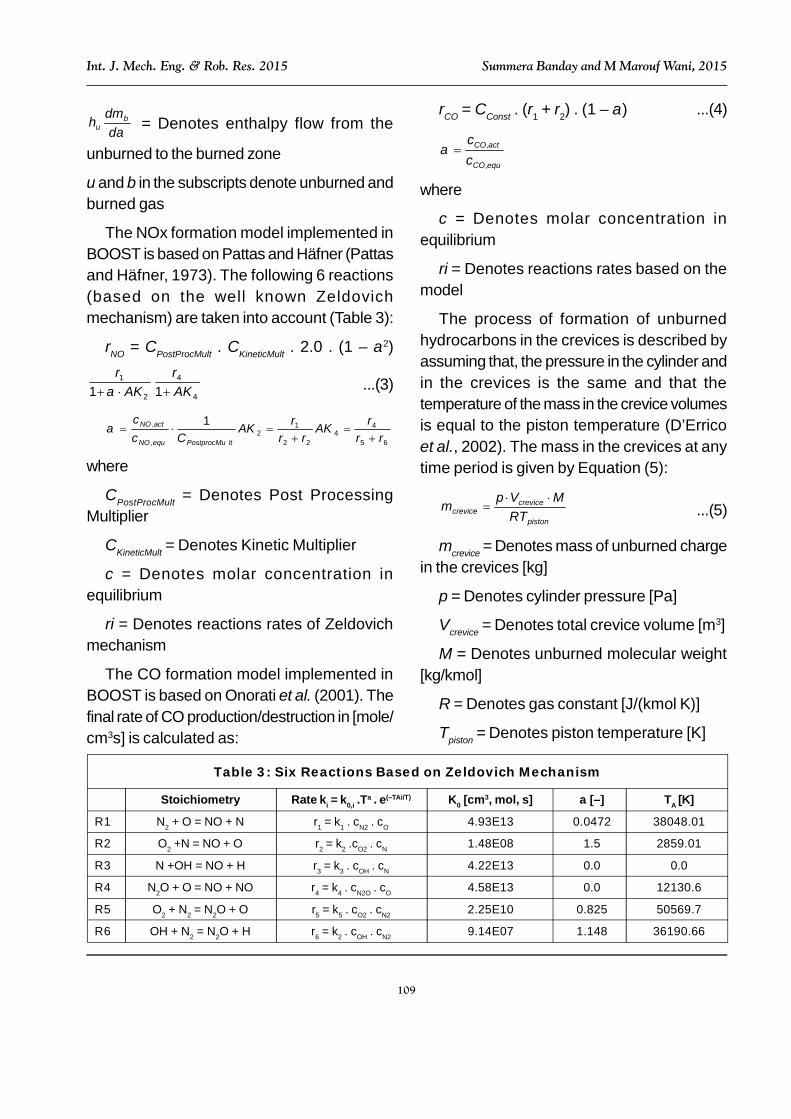
The NOx formation model implemented inBOOST is based on Pattas and Häfner (Pattasand Häfner, 1973). The following 6 reactions(based on the well known Zeldovichmechanism) are taken into account (Table 3):
rNO = CPostProcMult . CKineticMult . 2.0 . (1 – 2)
4
4
2
1
11 AKr
AKr
...(3)
65
44
22
12
,
, 1rr
rAKrr
rAKCc
c
ltPostprocMuequNO
actNO
where
CPostProcMult = Denotes Post ProcessingMultiplier
CKineticMult = Denotes Kinetic Multiplier
c = Denotes molar concentration inequilibrium
ri = Denotes reactions rates of Zeldovichmechanism
The CO formation model implemented inBOOST is based on Onorati et al. (2001). Thefinal rate of CO production/destruction in [mole/cm3s] is calculated as:
rCO = CConst . (r1 + r2) . (1 – ) ...(4)
equCO
actCO
cc
,
,
where
c = Denotes molar concentration inequilibrium
ri = Denotes reactions rates based on themodel
The process of formation of unburnedhydrocarbons in the crevices is described byassuming that, the pressure in the cylinder andin the crevices is the same and that thetemperature of the mass in the crevice volumesis equal to the piston temperature (D’Erricoet al., 2002). The mass in the crevices at anytime period is given by Equation (5):
piston
crevicecrevice RT
MVpm ...(5)
mcrevice = Denotes mass of unburned chargein the crevices [kg]
p = Denotes cylinder pressure [Pa]
Vcrevice = Denotes total crevice volume [m3]
M = Denotes unburned molecular weight[kg/kmol]
R = Denotes gas constant [J/(kmol K)]
Tpiston = Denotes piston temperature [K]
Stoichiometry Rate ki = k0,i .Ta . e(–TAi/T) K0 [cm3, mol, s] a [–] TA [K]
R1 N2 + O = NO + N r1 = k1 . cN2 . cO 4.93E13 0.0472 38048.01
R2 O2 +N = NO + O r2 = k2 .cO2 . cN 1.48E08 1.5 2859.01
R3 N +OH = NO + H r3 = k3 . cOH . cN 4.22E13 0.0 0.0
R4 N2O + O = NO + NO r4 = k4 . cN2O . cO 4.58E13 0.0 12130.6
R5 O2 + N2 = N2O + O r5 = k5 . cO2 . cN2 2.25E10 0.825 50569.7
R6 OH + N2 = N2O + H r6 = k2 . cOH . cN2 9.14E07 1.148 36190.66
Table 3: Six Reactions Based on Zeldovich Mechanism

110
Int. J. Mech. Eng. & Rob. Res. 2015 Summera Banday and M Marouf Wani, 2015
RESULTS AND DISCUSSIONThe present study concentrated on theemission and performance characteristics ofthe ethanol-gasoline blends. Differentconcentrations of the blends (E10 to E30 byvolume) were analyzed using AVL BOOST for40% to 100% load conditions under constantengine speed. The results are divided intodifferent subsections based on the parameteranalyzed.
Effect of Load on Power andTorqueThe Figures 2 and 3 shows the effect of loadon torque and power respectively. The
increase in torque and power with the increasein percentage load is due to presence of moreoxygen which results in complete combustionand increases power. Further it is seen thatpure gasoline shows higher power and torquethan ethanol-gasoline blends because ofhigher calorific value of pure gasoline.
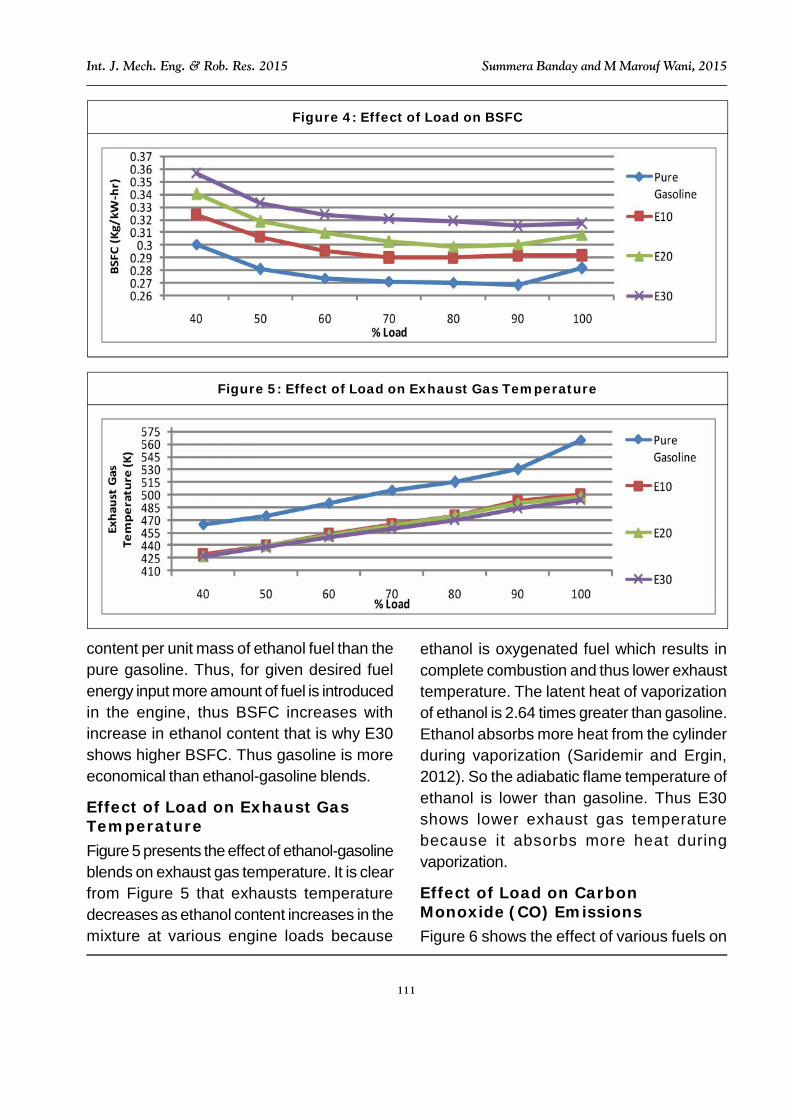
Effect of Load on Brake SpecificFuel Consumption (BSFC)The effect of using ethanol-gasoline blends onBrake Specific Fuel Consumption (BSFC) isshown in Figure 4. It is clear from Figure 4 thatwith the increase of the ethanol content theBSFC increases because of the low heat
Figure 2: Effect of Load on Torque
44.85.66.47.288.89.610.411.21212.8
40 50 60 70 80 90 100
Torq
ue (N
-m)
% Load
PureGasoline
E10
E20
E30
Figure 3: Effect of Load on Power
11.31.61.92.22.52.83.13.43.744.34.64.9
40 50 60 70 80 90 100
Pow
er (K
W)
% Load
PureGasoline
E10
E20
E30
111
Int. J. Mech. Eng. & Rob. Res. 2015 Summera Banday and M Marouf Wani, 2015
content per unit mass of ethanol fuel than thepure gasoline. Thus, for given desired fuelenergy input more amount of fuel is introducedin the engine, thus BSFC increases withincrease in ethanol content that is why E30shows higher BSFC. Thus gasoline is moreeconomical than ethanol-gasoline blends.
Effect of Load on Exhaust GasTemperatureFigure 5 presents the effect of ethanol-gasolineblends on exhaust gas temperature. It is clearfrom Figure 5 that exhausts temperaturedecreases as ethanol content increases in themixture at various engine loads because
ethanol is oxygenated fuel which results incomplete combustion and thus lower exhausttemperature. The latent heat of vaporizationof ethanol is 2.64 times greater than gasoline.Ethanol absorbs more heat from the cylinderduring vaporization (Saridemir and Ergin,2012). So the adiabatic flame temperature ofethanol is lower than gasoline. Thus E30shows lower exhaust gas temperaturebecause it absorbs more heat duringvaporization.
Effect of Load on CarbonMonoxide (CO) EmissionsFigure 6 shows the effect of various fuels on
Figure 4: Effect of Load on BSFC
0.260.270.280.290.30.310.320.330.340.350.360.37
40 50 60 70 80 90 100
BSFC
(Kg/
kW-h
r)
% Load
PureGasoline
E10
E20
E30
Figure 5: Effect of Load on Exhaust Gas Temperature
410425440455470485500515530545560575
40 50 60 70 80 90 100
Exha
ust
Gas
Tem
pera
ture
(K)
% Load
PureGasoline
E10
E20
E30

112
Int. J. Mech. Eng. & Rob. Res. 2015 Summera Banday and M Marouf Wani, 2015
the CO emissions at different loads. The COis formed due to incomplete combustion. Withthe increase of ethanol content, CO decreasesbecause ethanol is an oxygenated fuel whichresults in better combustion. Thus E30 showslower CO emission than the pure gasoline.
Effect of Load on Hydrocarbon(HC) EmissionsFigure 7 shows the effect of load on HCemissions. It is clear from Figure 7 that HCemission decreases with increase inpercentage load because fuel rich mixturescontains enough oxygen to react with all thecarbon, thus results in high HC emission in
Figure 6: Effect of Load on CO Emissions
00.00020.00040.00060.00080.0010.00120.00140.00160.00180.002
40 50 60 70 80 90 100
CO
(Kg/
KW
-hr)
% Load
PureGasoline
E10
E20
E30
exhaust products. Thus with the increase inpercentage load the fuel becomes leaner andresults in decrease in HC emissions. Further,more initially ethanol-gasoline blends showshigher HC emission than gasoline because ofrich mixture but at full percentage load HCemission is higher in pure gasoline thanethanol-gasoline blends. The decrease in HCemission at full load than gasoline is due tomore amount of oxygen and also ethanol is anoxygenated fuel which reacts with all carbonand hydrogen.
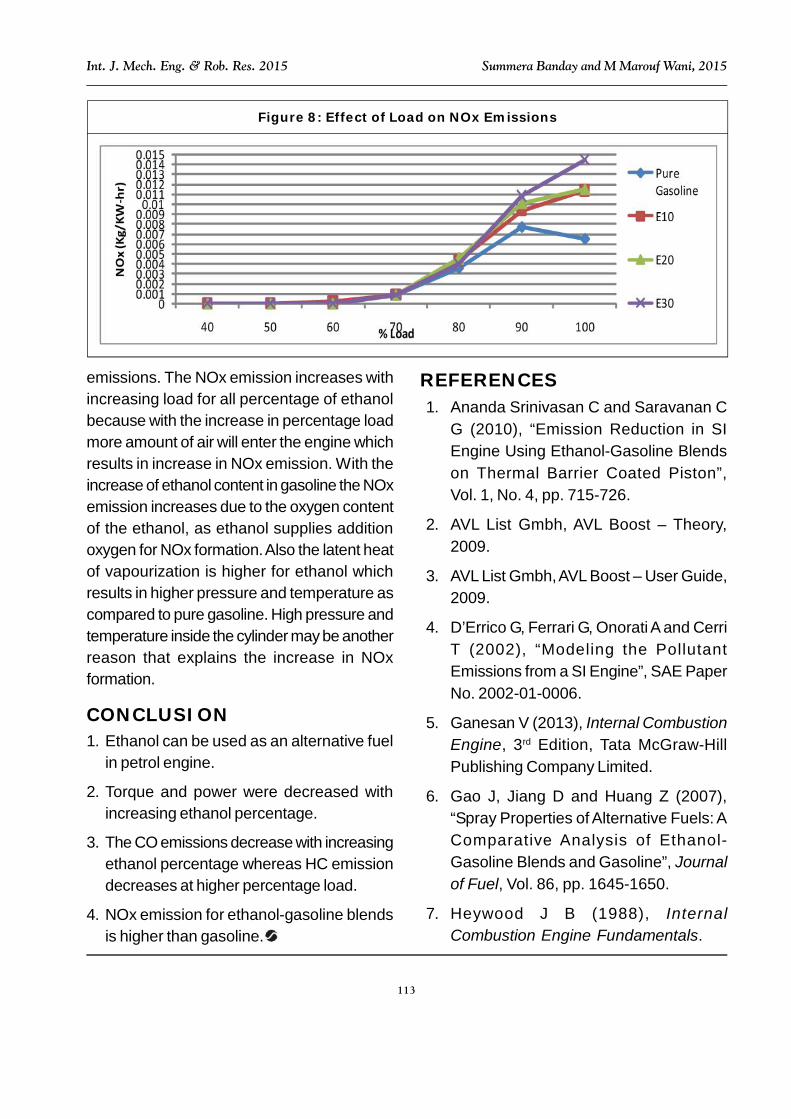
Effect of load on NOX EmissionsFigure 8 below shows the effect of load on NOx
Figure 7: Effect of Load on HC Emissions
0.00070.00090.00110.00130.00150.00170.00190.0021
40 50 60 70 80 90 100
HC
(Kg/
KW-h
r)
% Load
PureGasoline
E10
E20
E30
113
Int. J. Mech. Eng. & Rob. Res. 2015 Summera Banday and M Marouf Wani, 2015
emissions. The NOx emission increases withincreasing load for all percentage of ethanolbecause with the increase in percentage loadmore amount of air will enter the engine whichresults in increase in NOx emission. With theincrease of ethanol content in gasoline the NOxemission increases due to the oxygen contentof the ethanol, as ethanol supplies additionoxygen for NOx formation. Also the latent heatof vapourization is higher for ethanol whichresults in higher pressure and temperature ascompared to pure gasoline. High pressure andtemperature inside the cylinder may be anotherreason that explains the increase in NOxformation.
CONCLUSION1. Ethanol can be used as an alternative fuel
in petrol engine.
2. Torque and power were decreased withincreasing ethanol percentage.
3. The CO emissions decrease with increasingethanol percentage whereas HC emissiondecreases at higher percentage load.
4. NOx emission for ethanol-gasoline blendsis higher than gasoline.
REFERENCES1. Ananda Srinivasan C and Saravanan C
G (2010), “Emission Reduction in SIEngine Using Ethanol-Gasoline Blendson Thermal Barrier Coated Piston”,Vol. 1, No. 4, pp. 715-726.
2. AVL List Gmbh, AVL Boost – Theory,2009.
3. AVL List Gmbh, AVL Boost – User Guide,2009.
4. D’Errico G, Ferrari G, Onorati A and CerriT (2002), “Modeling the PollutantEmissions from a SI Engine”, SAE PaperNo. 2002-01-0006.
5. Ganesan V (2013), Internal CombustionEngine, 3rd Edition, Tata McGraw-HillPublishing Company Limited.
6. Gao J, Jiang D and Huang Z (2007),“Spray Properties of Alternative Fuels: AComparative Analysis of Ethanol-Gasoline Blends and Gasoline”, Journalof Fuel, Vol. 86, pp. 1645-1650.
7. Heywood J B (1988), InternalCombustion Engine Fundamentals.
Figure 8: Effect of Load on NOx Emissions
00.0010.0020.0030.0040.0050.0060.0070.0080.0090.010.0110.0120.0130.0140.015
40 50 60 70 80 90 100
NO
x (K
g/KW
-hr)
% Load
PureGasoline
E10
E20
E30

114
Int. J. Mech. Eng. & Rob. Res. 2015 Summera Banday and M Marouf Wani, 2015
8. Onorati A, Ferrari G and D’Errico G(2001), “1D Unsteady Flows withChemical Reactions in the Exhaust Duct-System of SI Engines: Predictions andExperiments”, SAE Paper No. 2001-01-0939.
9. Pattas K and Häfner G (1973),“Stickoxidbildung bei derottomotorischen Verbrennung”, MTZ Nr.,Vol. 12, pp. 397-404.
10. Piotr Bielaczyc, Joseph Woodburn,Dariusz Klimkiewicz, Piotr Pajdowski andAndrzej Szczotka (2013), “AnExamination of the Effect of Ethanol-Gasoline Blends PhysicochemicalProperties on Emissions from a Light-DutySpark Ignition Engine”, Fuel ProcessingTechnology, Vol. 107, pp. 50-63.
11. Saridemir S and Ergin T (2012),“Performance and Exhaust Emissions of
a Spark Ignition Engine with MethanolBlended Gasoline Fuels”, Energ. Educ.Sci. Tech.-A, Vol. 29, pp. 1343-1354.
12. Schifter I, Diaz L, Rodriguez R, Gómez JP and Gonzalez U (2011), “Combustionand Emission Behavior for Ethanol-Gasoline Blends in a Single CylinderEngine”, Fuel, Vol. 90, pp. 3586-3592.
13. Suat Saridemir (2012), “The Effects ofEthanol-Unleaded Gasoline Blends in aSingle Cylinder SI Engine Performanceand Exhaust Emissions”, Vol. 30, No. 1,pp. 727-736.
14. Venugopal T and Ramesh A (2014),“Experimental Studies on the Effect ofInjection Timing in a SI Engine Using DualInjection of n-Butanol and Gasoline in theIntake Port”, Fuel, Vol. 115, pp. 295-305.