computational photography - csee.umbc.educaban1/fall2010/cmsc691/schedule_file… · jesus j caban,...
TRANSCRIPT
!"#"$%&
$&
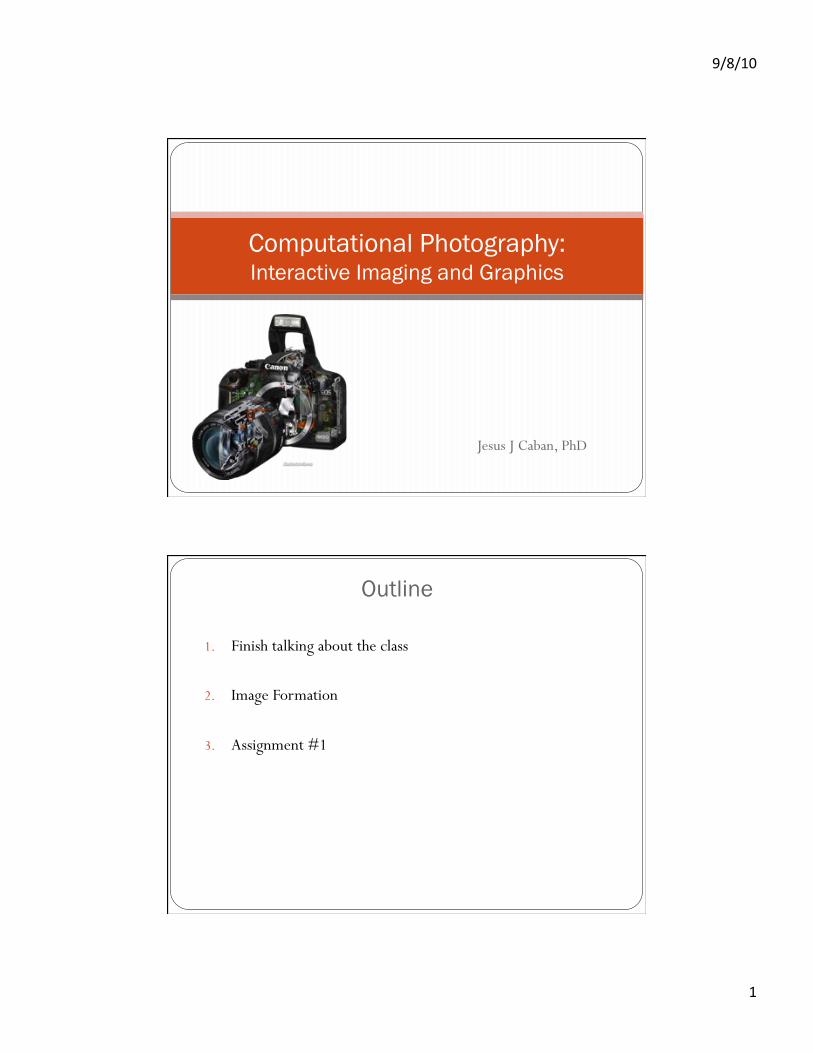
Jesus J Caban, PhD
Computational Photography: Interactive Imaging and Graphics
Outline
1. Finish talking about the class
2. Image Formation
3. Assignment #1
!"#"$%&
'&
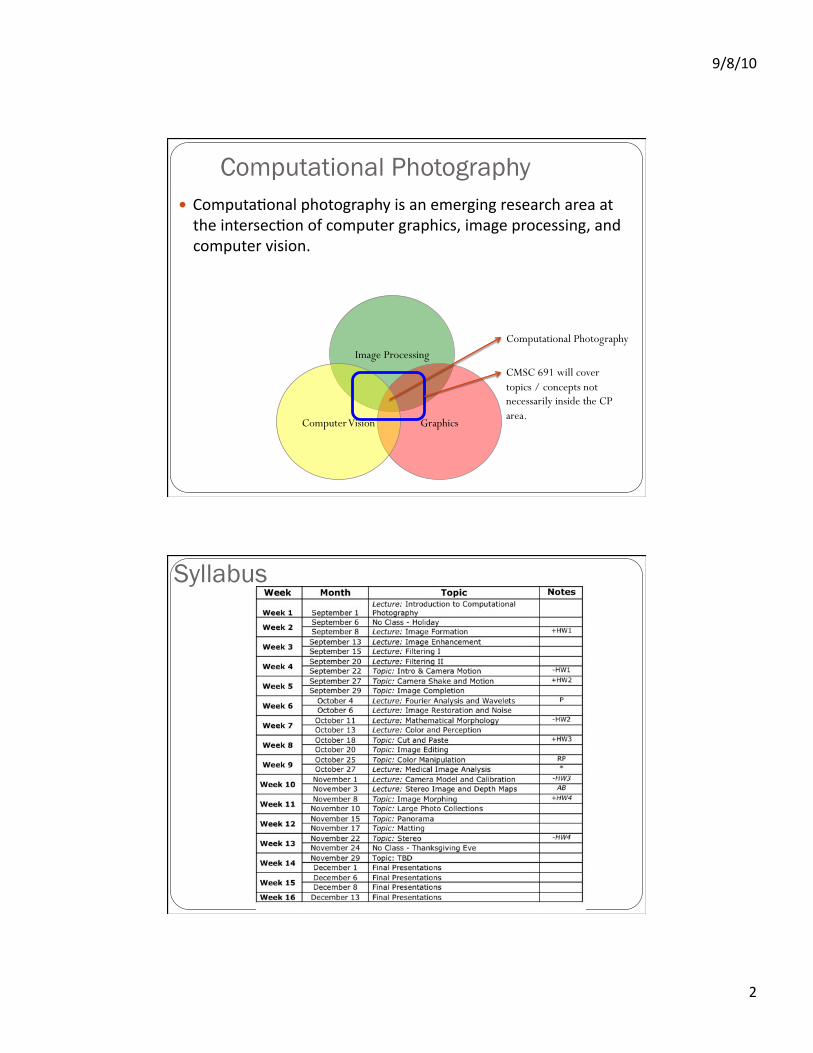
Computational Photography ! ()*+,-./)0.1&+2)-)34.+25&67&.0&8*843603&4878.492&.48.&.-&-28&60-84789/)0&):&9)*+,-84&34.+2697;&6*.38&+4)9877603;&.0<&9)*+,-84&=676)0>&!
Image Processing
Graphics Computer Vision
Computational Photography
CMSC 691 will cover topics / concepts not necessarily inside the CP area.
Syllabus
!"#"$%&
?&
Other Topics
! Image Warping ! Feature extraction ! Merge images ! Texture Analysis ! MRF ! Segmentation (Grabcut) ! Object recognition ! Video compression ! Image retrieval
! Animation ! Medical Image Processing ! Volume Rendering ! Image Features (SIFT) ! Edge detection ! Image Quality ! 3D reconstruction ! Gesture Recognition
Final Project ! Draft Proposal (10%)
! Revised Proposal (10%)
! Literature survey (20%)
! Final paper (40%)
! Final presentation (20%)

!"#"$%&
@&
How to select your project? ! Find something you like
! Try to make something related to your thesis / dissertation
! Read some of the papers / topics in advance
CMSC 491/691
Image Formation
!"#"$%&
A&
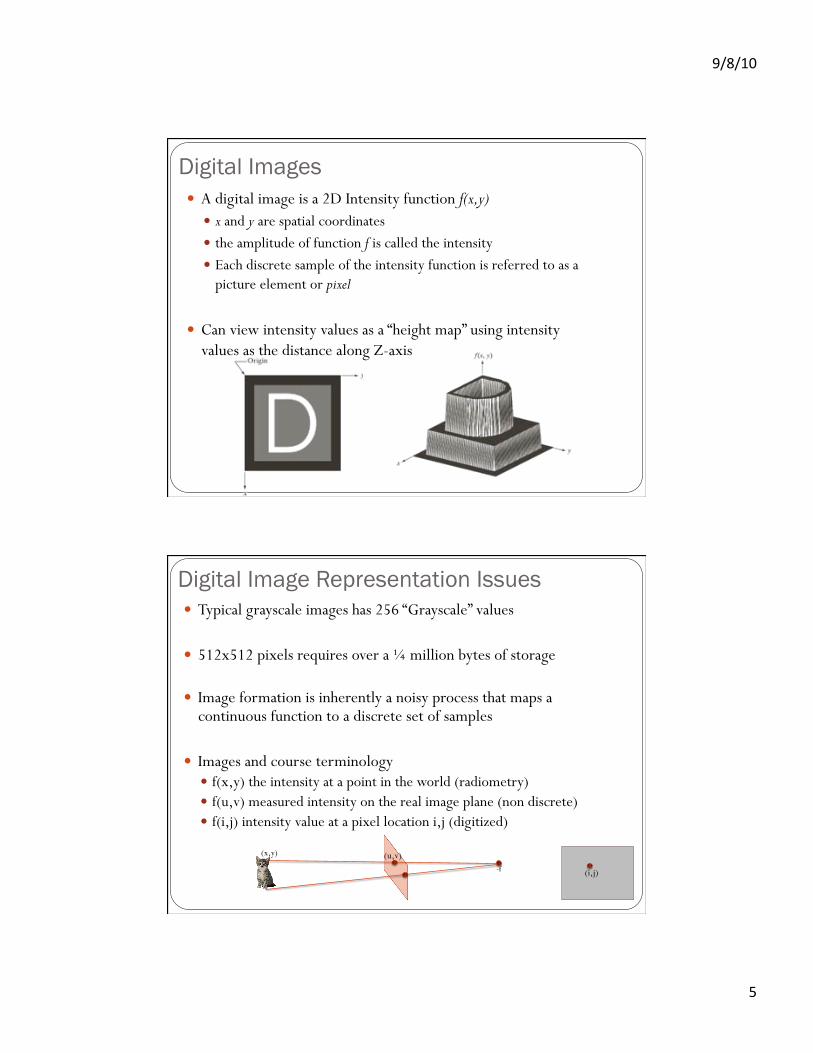
Digital Images ! A digital image is a 2D Intensity function f(x,y)
! x and y are spatial coordinates ! the amplitude of function f is called the intensity ! Each discrete sample of the intensity function is referred to as a
picture element or pixel
! Can view intensity values as a “height map” using intensity values as the distance along Z-axis
Digital Image Representation Issues ! Typical grayscale images has 256 “Grayscale” values
! 512x512 pixels requires over a ! million bytes of storage
! Image formation is inherently a noisy process that maps a continuous function to a discrete set of samples
! Images and course terminology ! f(x,y) the intensity at a point in the world (radiometry) ! f(u,v) measured intensity on the real image plane (non discrete) ! f(i,j) intensity value at a pixel location i,j (digitized)
-f
(u,v) (x,y)
(i,j)
!"#"$%&
B&
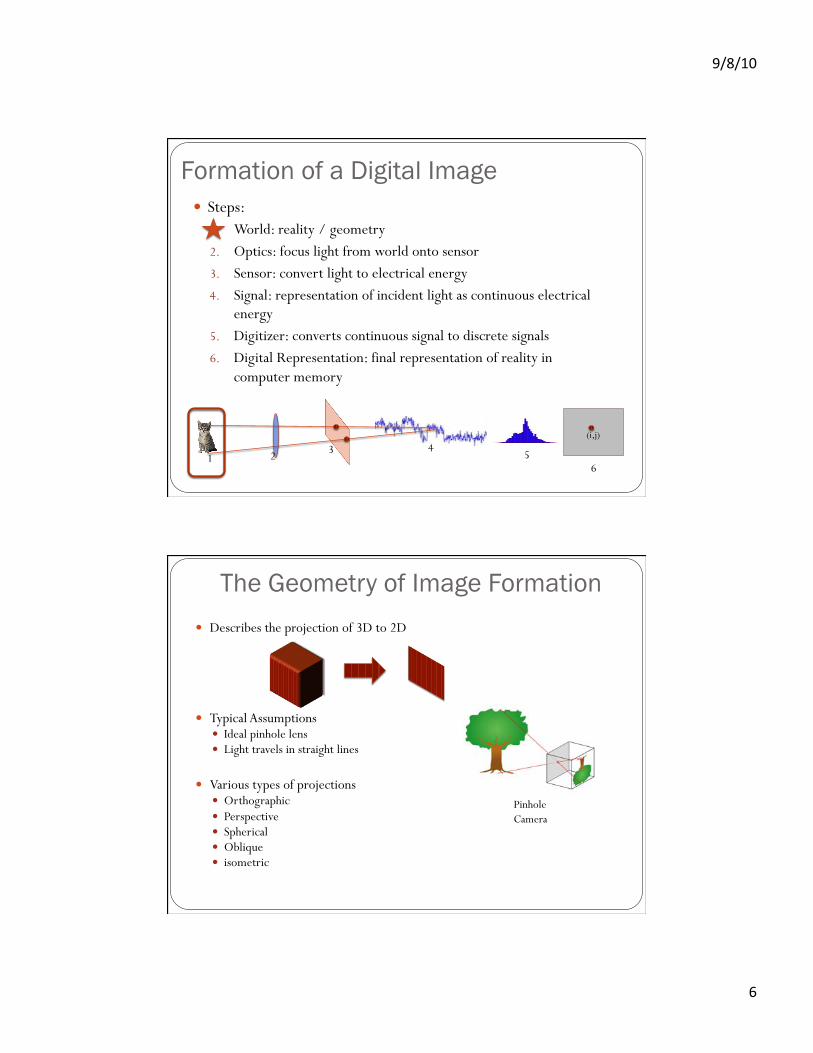
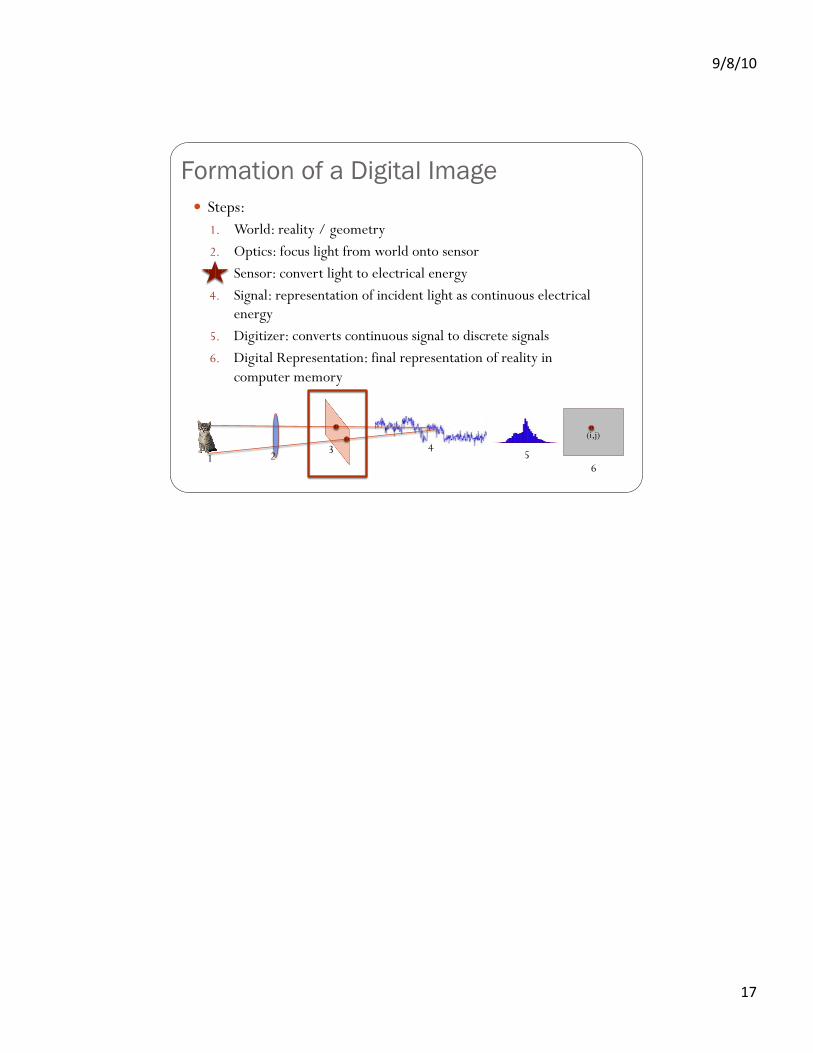
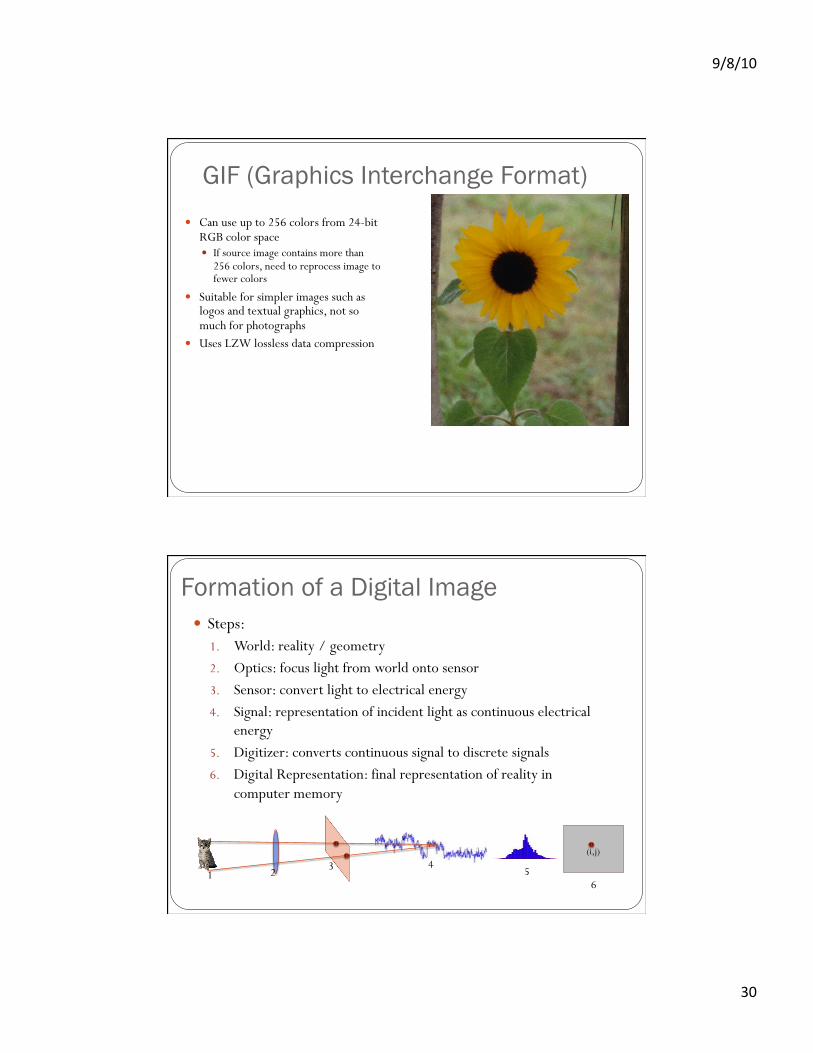
Formation of a Digital Image ! Steps:
1. World: reality / geometry 2. Optics: focus light from world onto sensor 3. Sensor: convert light to electrical energy 4. Signal: representation of incident light as continuous electrical
energy 5. Digitizer: converts continuous signal to discrete signals 6. Digital Representation: final representation of reality in
computer memory
(i,j)
1 2 3 4 5 6
The Geometry of Image Formation ! Describes the projection of 3D to 2D
! Typical Assumptions ! Ideal pinhole lens ! Light travels in straight lines
! Various types of projections ! Orthographic ! Perspective ! Spherical ! Oblique ! isometric
Pinhole Camera
!"#"$%&
C&
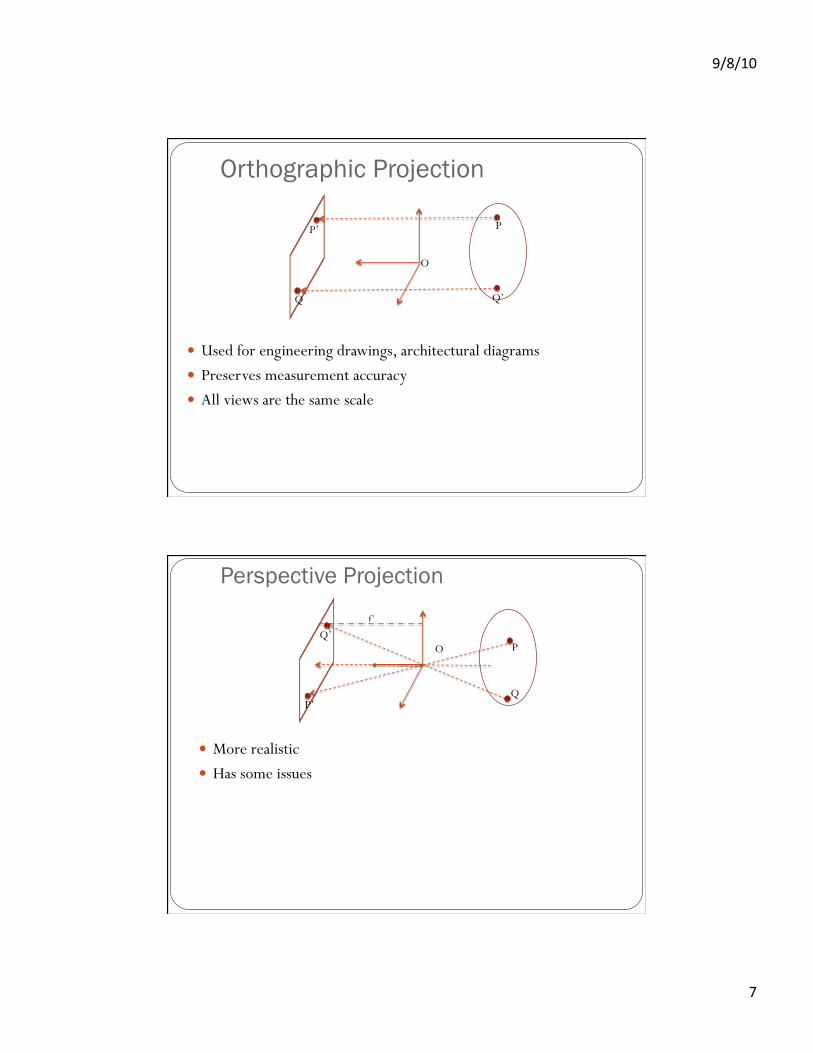
Orthographic Projection
P P’
Q Q’
O
! Used for engineering drawings, architectural diagrams ! Preserves measurement accuracy ! All views are the same scale
Perspective Projection
P Q’
P’ Q
O
f’
! More realistic ! Has some issues
!"#"$%&
#&
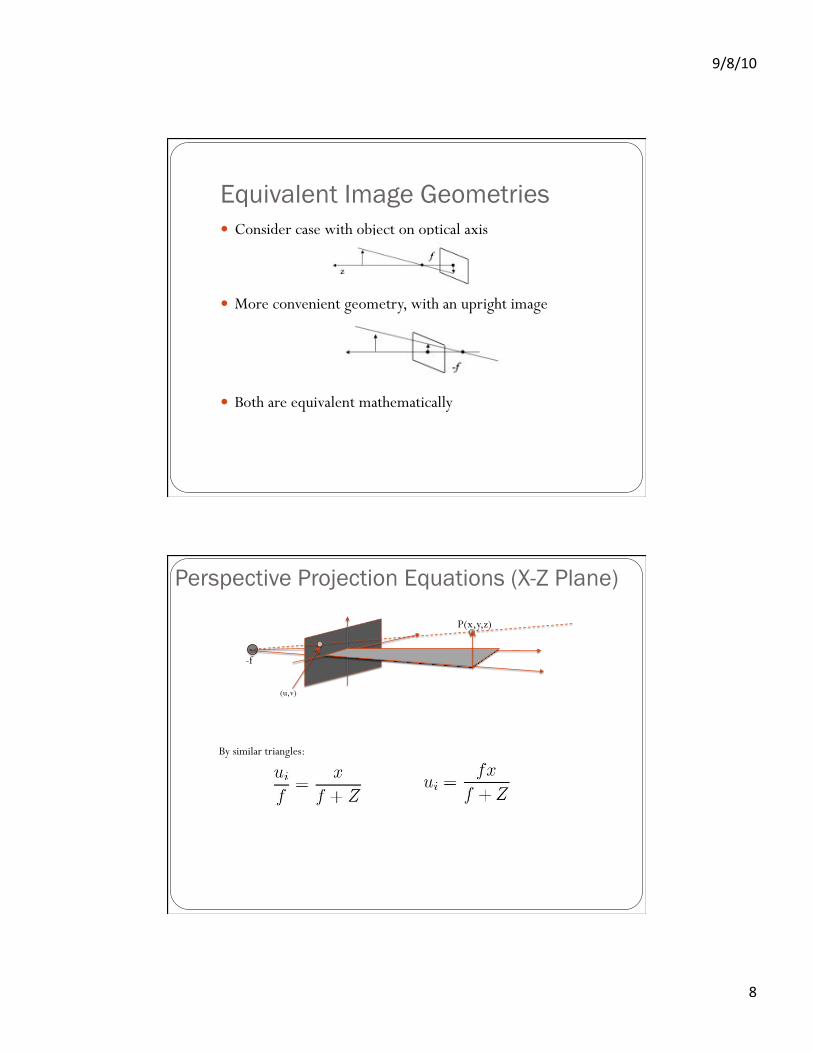
Equivalent Image Geometries ! Consider case with object on optical axis
! More convenient geometry, with an upright image
! Both are equivalent mathematically
Perspective Projection Equations (X-Z Plane)
By similar triangles:
(u,v)
P(x,y,z)
-f
!"#"$%&
!&
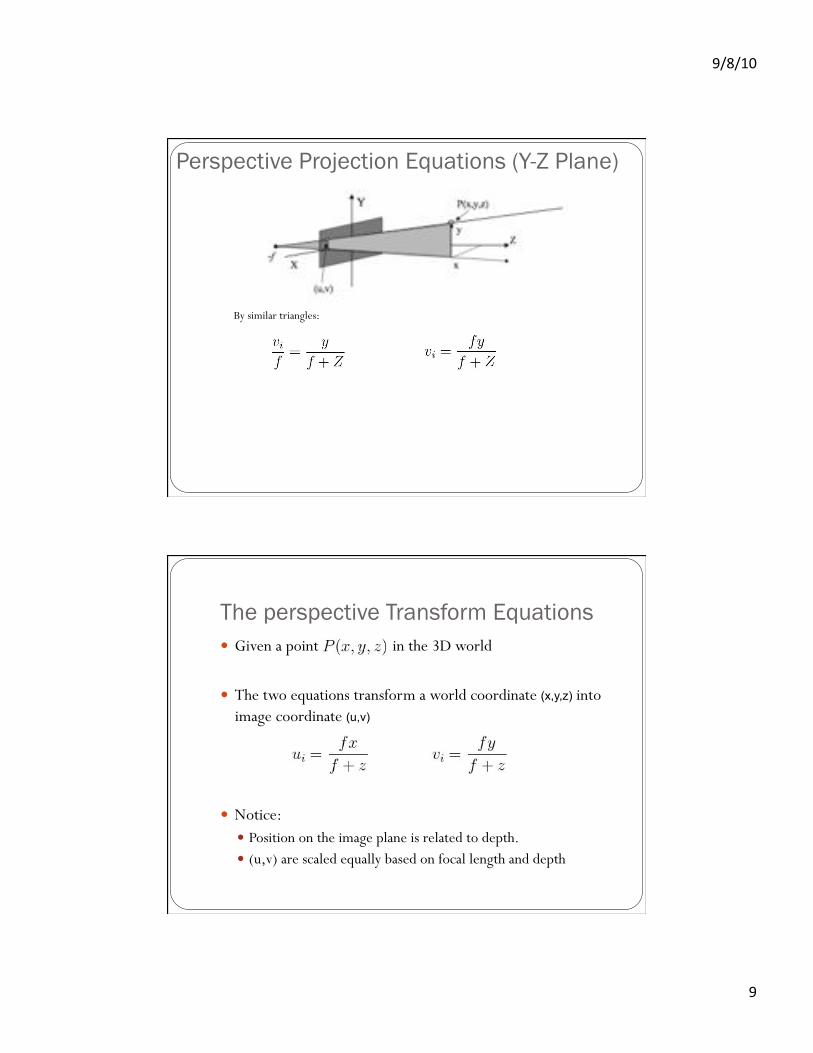
Perspective Projection Equations (Y-Z Plane)
By similar triangles:
The perspective Transform Equations ! Given a point in the 3D world
! The two equations transform a world coordinate (x,y,z) into image coordinate (u,v)
! Notice: ! Position on the image plane is related to depth. ! (u,v) are scaled equally based on focal length and depth
!"#"$%&
$%&
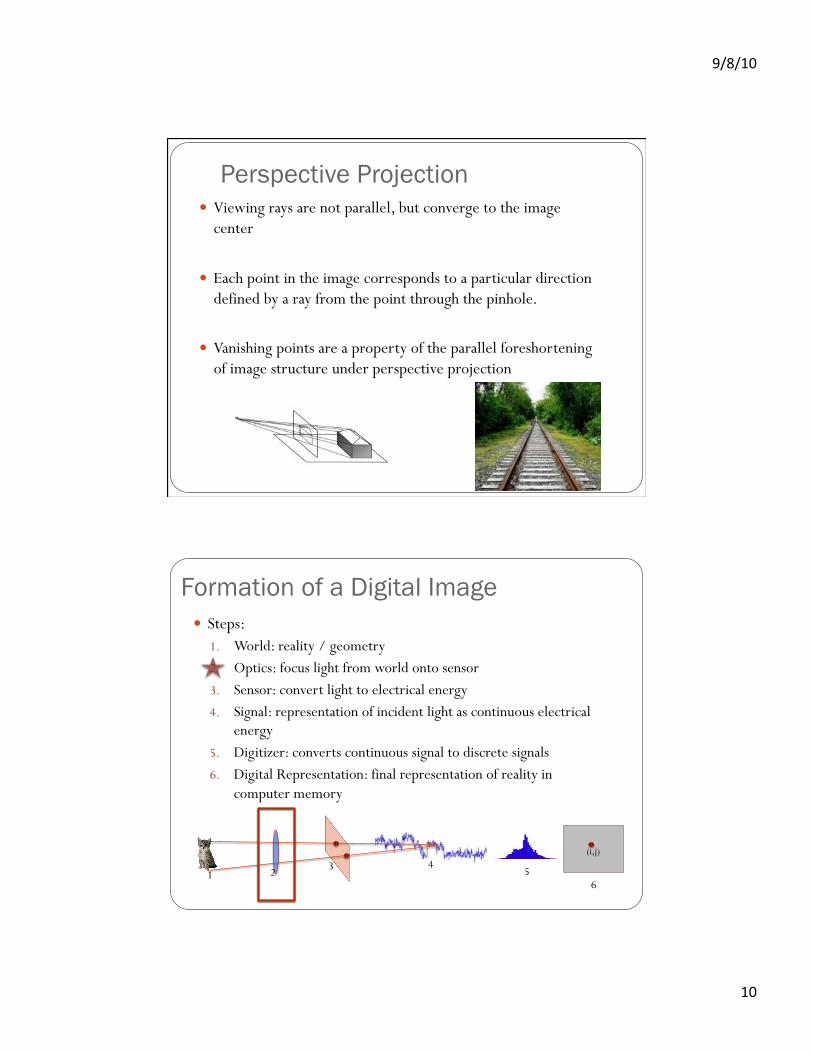
Perspective Projection ! Viewing rays are not parallel, but converge to the image
center
! Each point in the image corresponds to a particular direction defined by a ray from the point through the pinhole.
! Vanishing points are a property of the parallel foreshortening of image structure under perspective projection
Formation of a Digital Image ! Steps:
1. World: reality / geometry 2. Optics: focus light from world onto sensor 3. Sensor: convert light to electrical energy 4. Signal: representation of incident light as continuous electrical
energy 5. Digitizer: converts continuous signal to discrete signals 6. Digital Representation: final representation of reality in
computer memory
(i,j)
1 2 3 4 5 6
!"#"$%&
$$&
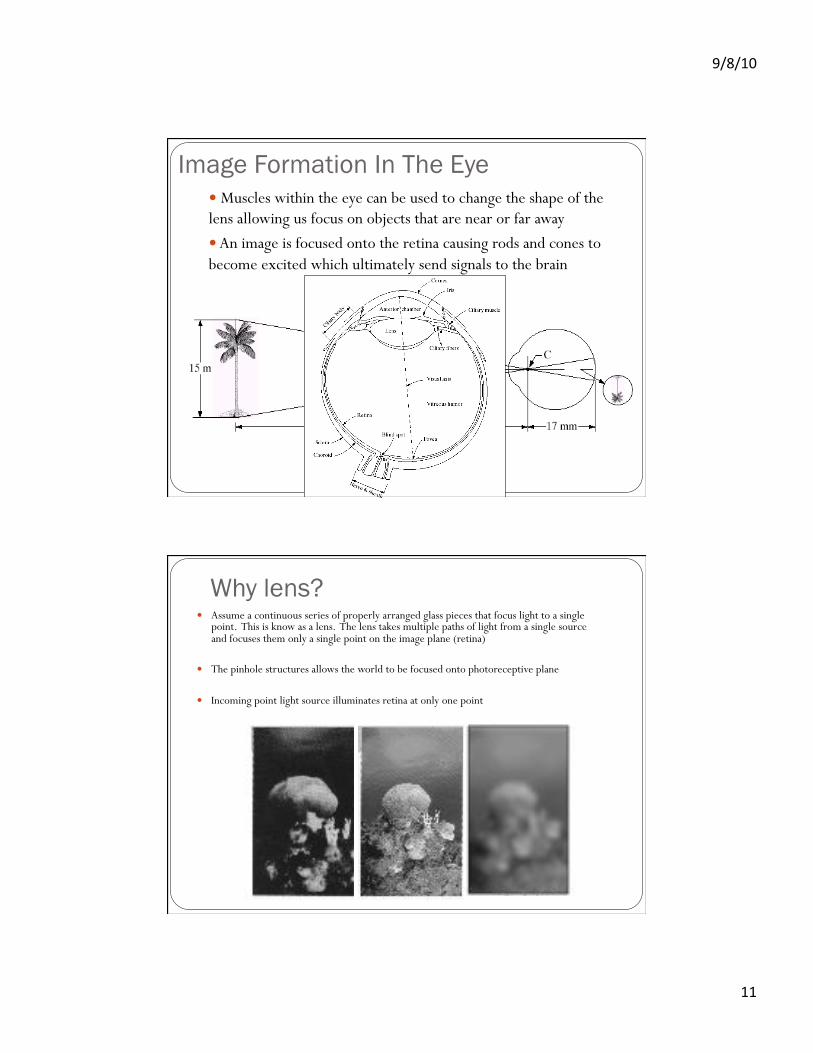
Image Formation In The Eye ! Muscles within the eye can be used to change the shape of the lens allowing us focus on objects that are near or far away ! An image is focused onto the retina causing rods and cones to become excited which ultimately send signals to the brain
Why lens? ! Assume a continuous series of properly arranged glass pieces that focus light to a single
point. This is know as a lens. The lens takes multiple paths of light from a single source and focuses them only a single point on the image plane (retina)
! The pinhole structures allows the world to be focused onto photoreceptive plane
! Incoming point light source illuminates retina at only one point
!"#"$%&
$'&
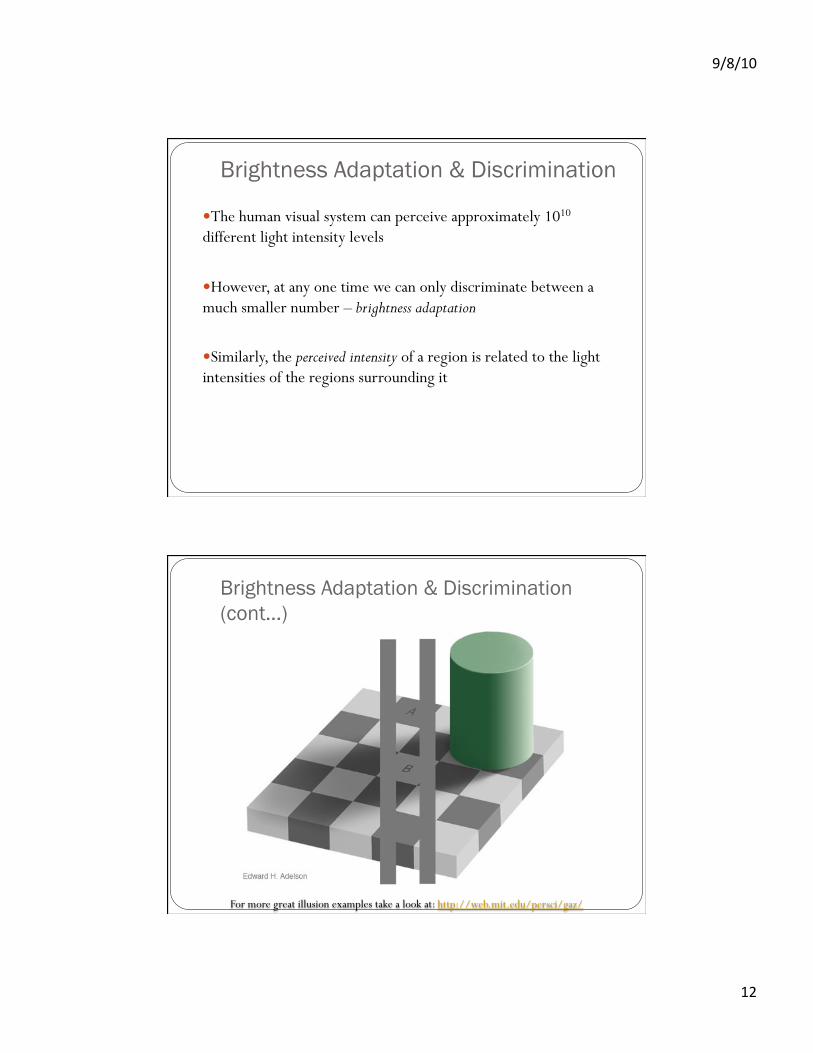
Brightness Adaptation & Discrimination
! The human visual system can perceive approximately 1010 different light intensity levels
! However, at any one time we can only discriminate between a much smaller number – brightness adaptation
! Similarly, the perceived intensity of a region is related to the light intensities of the regions surrounding it
Brightness Adaptation & Discrimination (cont…)
For more great illusion examples take a look at: http://web.mit.edu/persci/gaz/
!"#"$%&
$?&
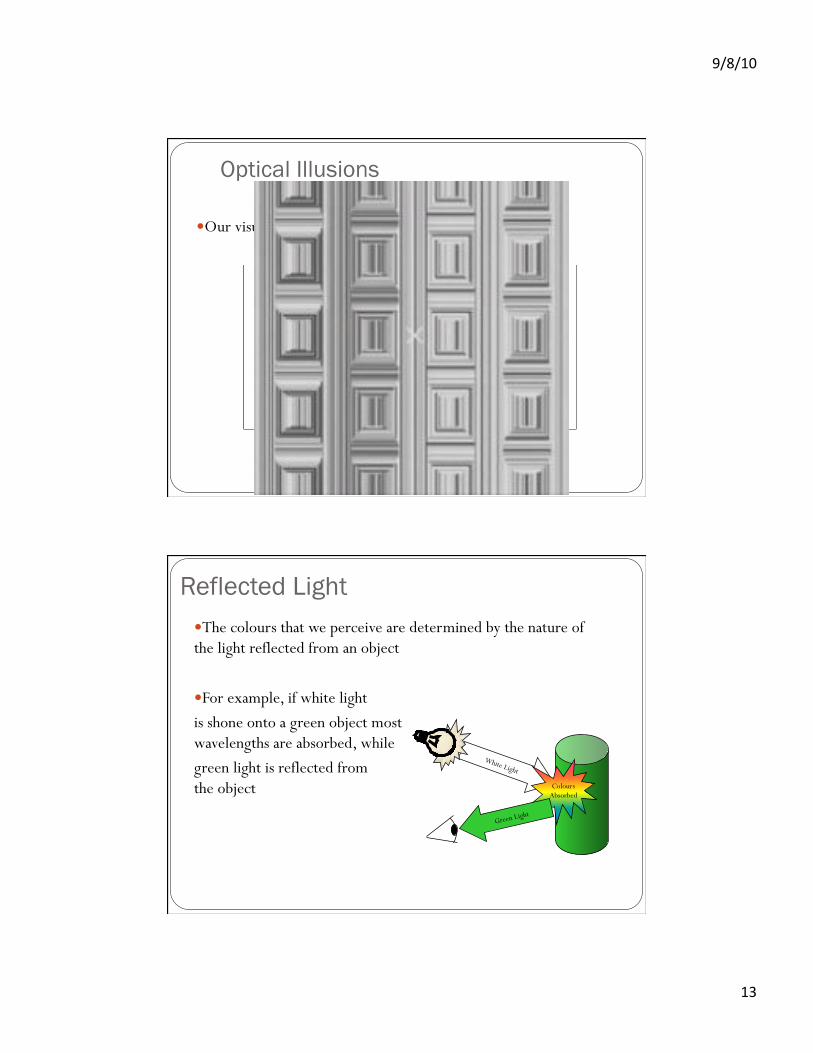
Optical Illusions
! Our visual systems play lots of interesting tricks on us
Reflected Light ! The colours that we perceive are determined by the nature of the light reflected from an object
! For example, if white light is shone onto a green object most wavelengths are absorbed, while green light is reflected from the object
White Light
Colours Absorbed
Green Light
!"#"$%&
$@&
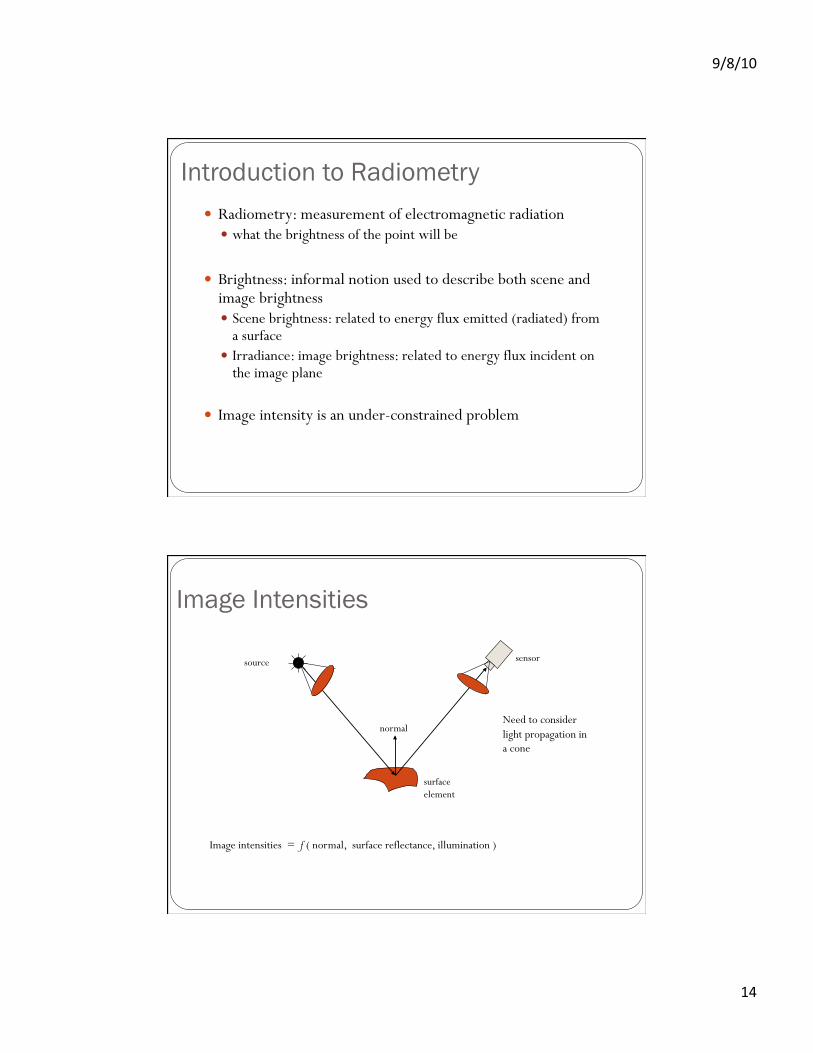
Introduction to Radiometry ! Radiometry: measurement of electromagnetic radiation
! what the brightness of the point will be
! Brightness: informal notion used to describe both scene and image brightness ! Scene brightness: related to energy flux emitted (radiated) from
a surface ! Irradiance: image brightness: related to energy flux incident on
the image plane
! Image intensity is an under-constrained problem
Image intensities = f ( normal, surface reflectance, illumination )
source sensor
surface element
normal Need to consider light propagation in a cone
Image Intensities
!"#"$%&
$A&
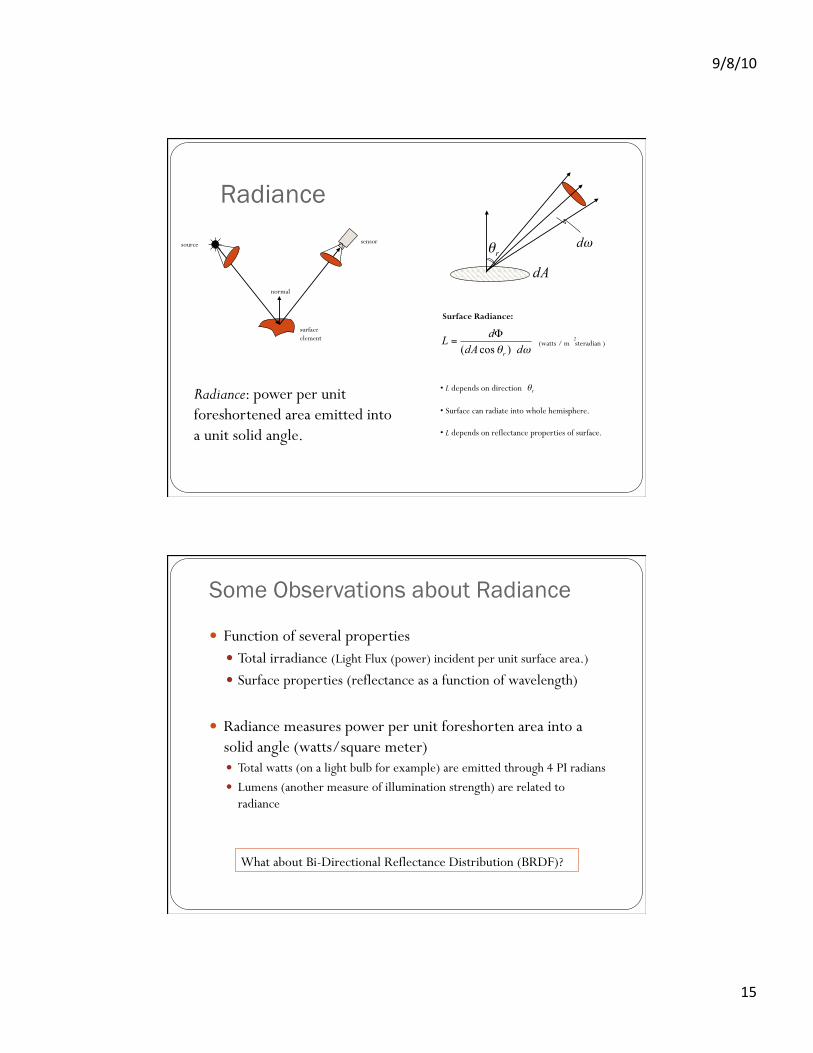
Radiance
2
Surface Radiance:
(watts / m steradian )
• L depends on direction
• Surface can radiate into whole hemisphere.
• L depends on reflectance properties of surface.
source sensor
surface element
normal
Radiance: power per unit foreshortened area emitted into a unit solid angle.
Some Observations about Radiance
! Function of several properties ! Total irradiance (Light Flux (power) incident per unit surface area.)
! Surface properties (reflectance as a function of wavelength)
! Radiance measures power per unit foreshorten area into a solid angle (watts/square meter) ! Total watts (on a light bulb for example) are emitted through 4 PI radians ! Lumens (another measure of illumination strength) are related to
radiance
What about Bi-Directional Reflectance Distribution (BRDF)?
!"#"$%&
$B&
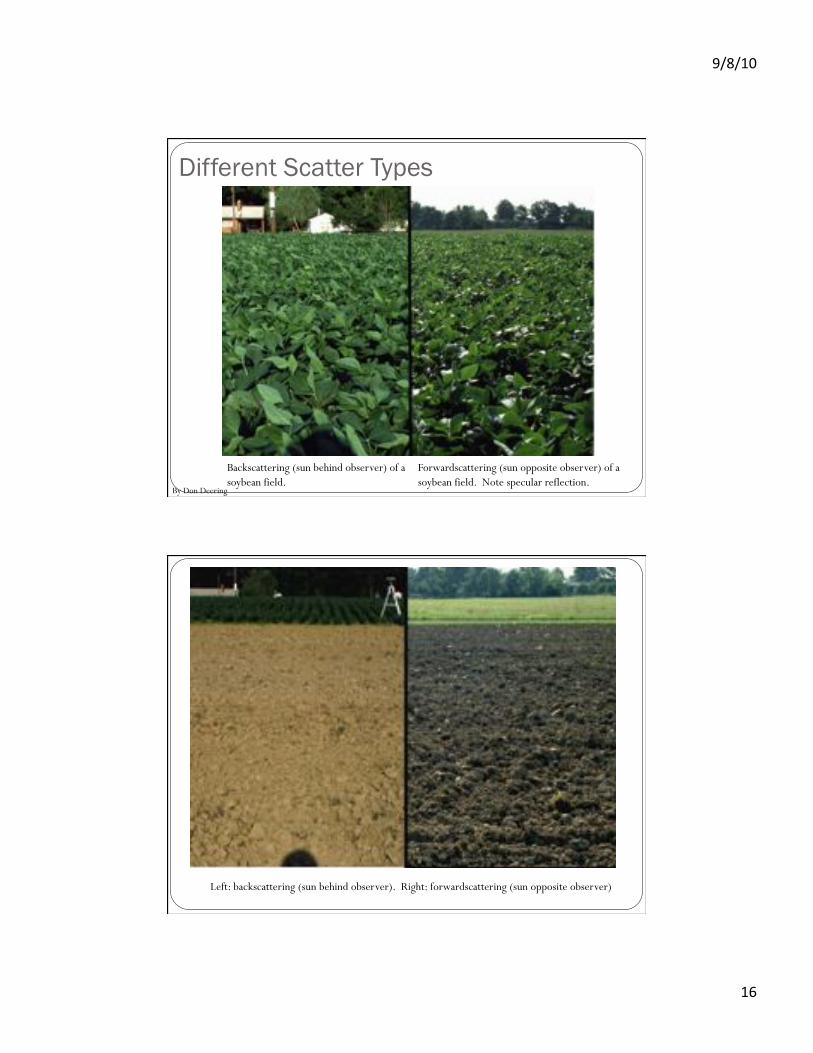
Different Scatter Types
Backscattering (sun behind observer) of a soybean field.
Forwardscattering (sun opposite observer) of a soybean field. Note specular reflection.
By Don Deering
Left: backscattering (sun behind observer). Right: forwardscattering (sun opposite observer)
!"#"$%&
$C&
Formation of a Digital Image ! Steps:
1. World: reality / geometry 2. Optics: focus light from world onto sensor 3. Sensor: convert light to electrical energy 4. Signal: representation of incident light as continuous electrical
energy 5. Digitizer: converts continuous signal to discrete signals 6. Digital Representation: final representation of reality in
computer memory
(i,j)
1 2 3 4 5 6
Image Sensing ! Incoming energy lands on a sensor material responsive to that type of energy and this generates a voltage ! Collections of sensors are arranged to capture images
Imaging Sensor
Line of Image Sensors Array of Image Sensors
!"#"$%&
$#&
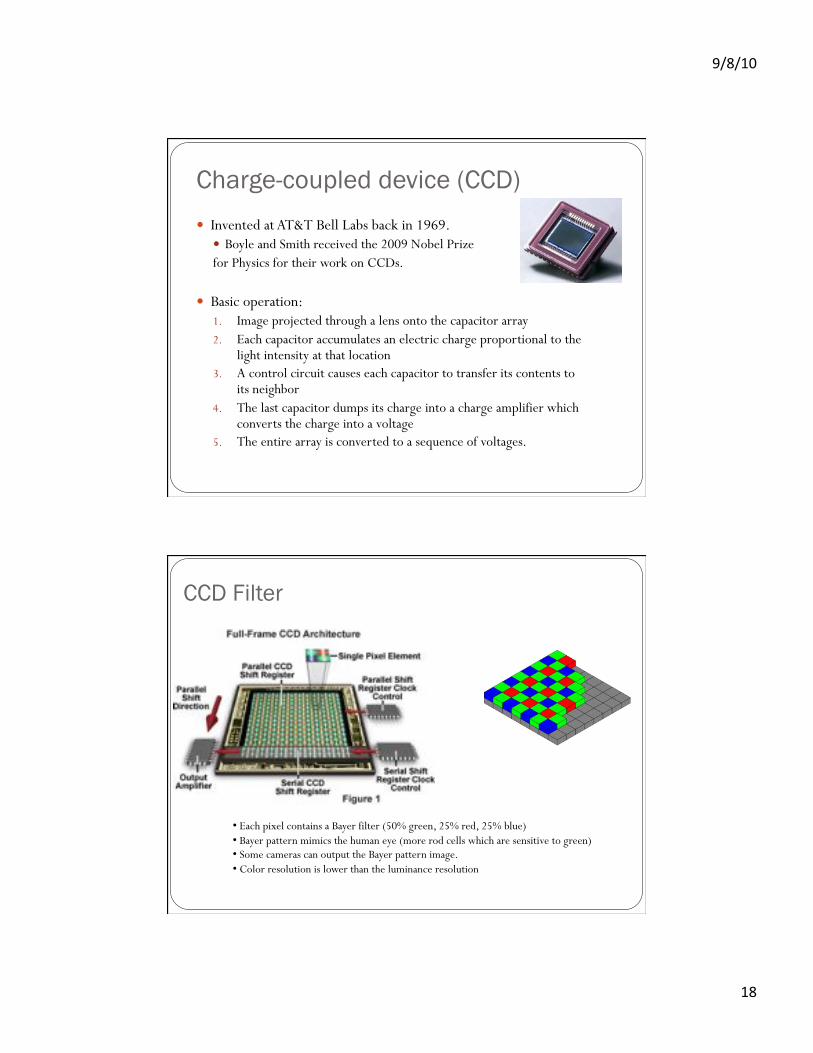
Charge-coupled device (CCD) ! Invented at AT&T Bell Labs back in 1969.
! Boyle and Smith received the 2009 Nobel Prize for Physics for their work on CCDs.
! Basic operation: 1. Image projected through a lens onto the capacitor array 2. Each capacitor accumulates an electric charge proportional to the
light intensity at that location 3. A control circuit causes each capacitor to transfer its contents to
its neighbor 4. The last capacitor dumps its charge into a charge amplifier which
converts the charge into a voltage 5. The entire array is converted to a sequence of voltages.
CCD Filter
• Each pixel contains a Bayer filter (50% green, 25% red, 25% blue) • Bayer pattern mimics the human eye (more rod cells which are sensitive to green) • Some cameras can output the Bayer pattern image. • Color resolution is lower than the luminance resolution
!"#"$%&
$!&
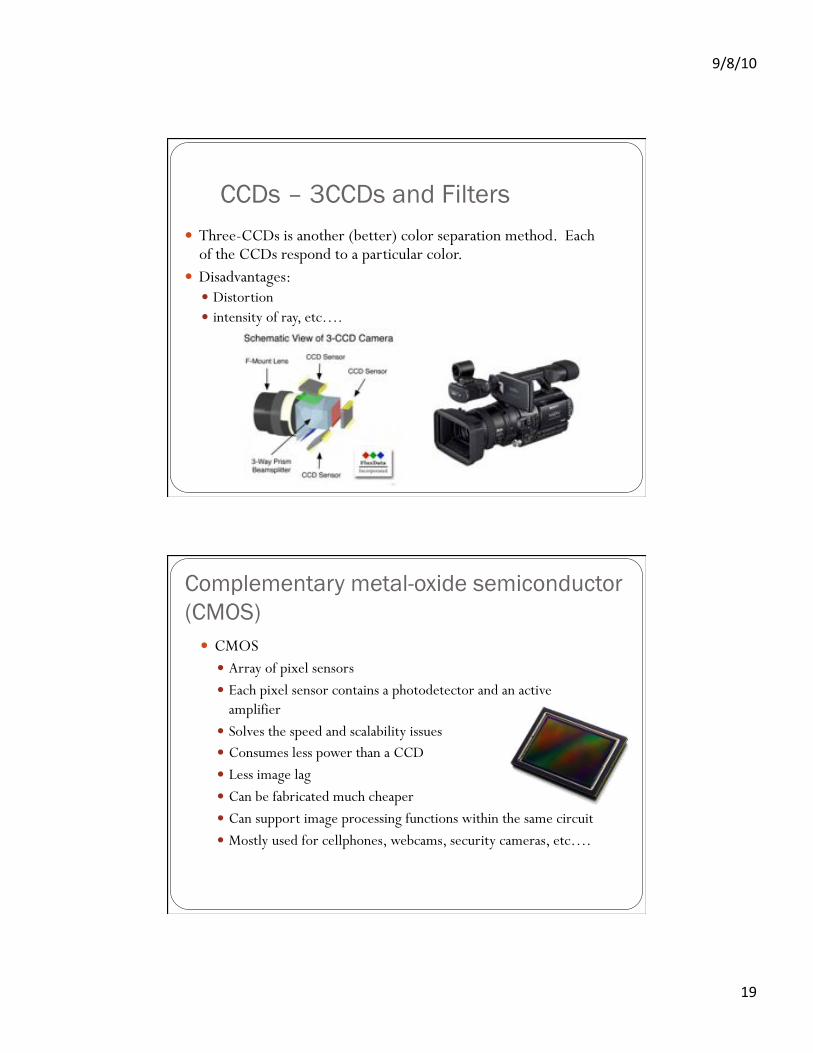
CCDs – 3CCDs and Filters ! Three-CCDs is another (better) color separation method. Each
of the CCDs respond to a particular color. ! Disadvantages:
! Distortion ! intensity of ray, etc….
Complementary metal-oxide semiconductor (CMOS)
! CMOS ! Array of pixel sensors ! Each pixel sensor contains a photodetector and an active
amplifier ! Solves the speed and scalability issues ! Consumes less power than a CCD ! Less image lag ! Can be fabricated much cheaper ! Can support image processing functions within the same circuit ! Mostly used for cellphones, webcams, security cameras, etc….

!"#"$%&
'%&
Formation of a Digital Image ! Steps:
1. World: reality / geometry 2. Optics: focus light from world onto sensor 3. Sensor: convert light to electrical energy 4. Signal: representation of incident light as continuous electrical
energy 5. Digitizer: converts continuous signal to discrete signals 6. Digital Representation: final representation of reality in
computer memory
(i,j)
1 2 3 4 5 6
Image Acquisition
! Images are typically generated by illuminating a scene and absorbing the energy reflected by the objects in that scene
Similar concept for CT, X-ray, ultrasound, etc…
!"#"$%&
'$&
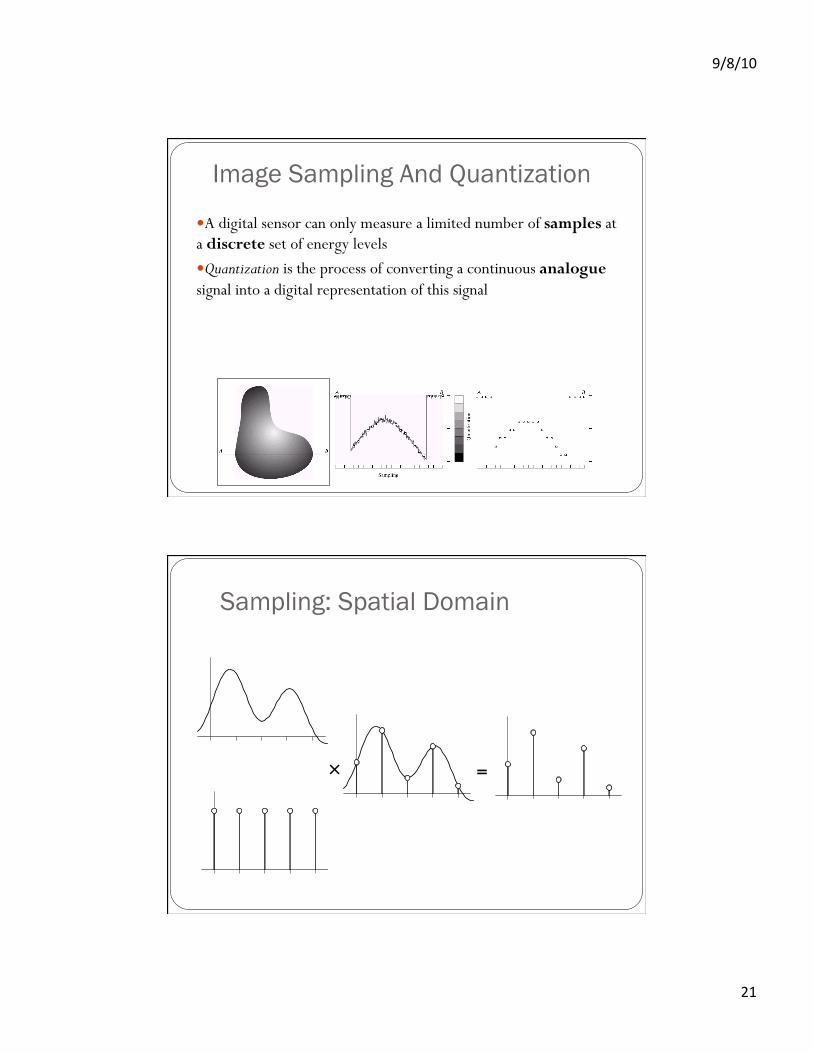
Image Sampling And Quantization
! A digital sensor can only measure a limited number of samples at a discrete set of energy levels ! Quantization is the process of converting a continuous analogue signal into a digital representation of this signal
Sampling: Spatial Domain
! =
!"#"$%&
''&
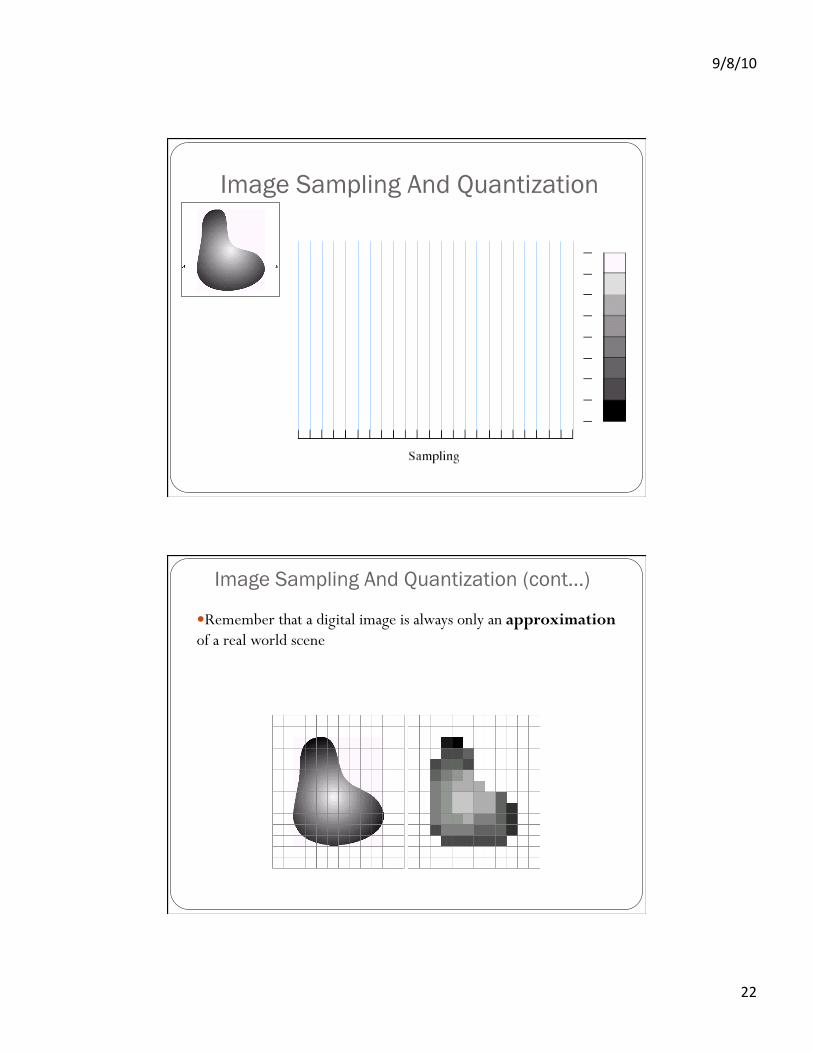
Image Sampling And Quantization
Image Sampling And Quantization (cont…)
! Remember that a digital image is always only an approximation of a real world scene
!"#"$%&
'?&
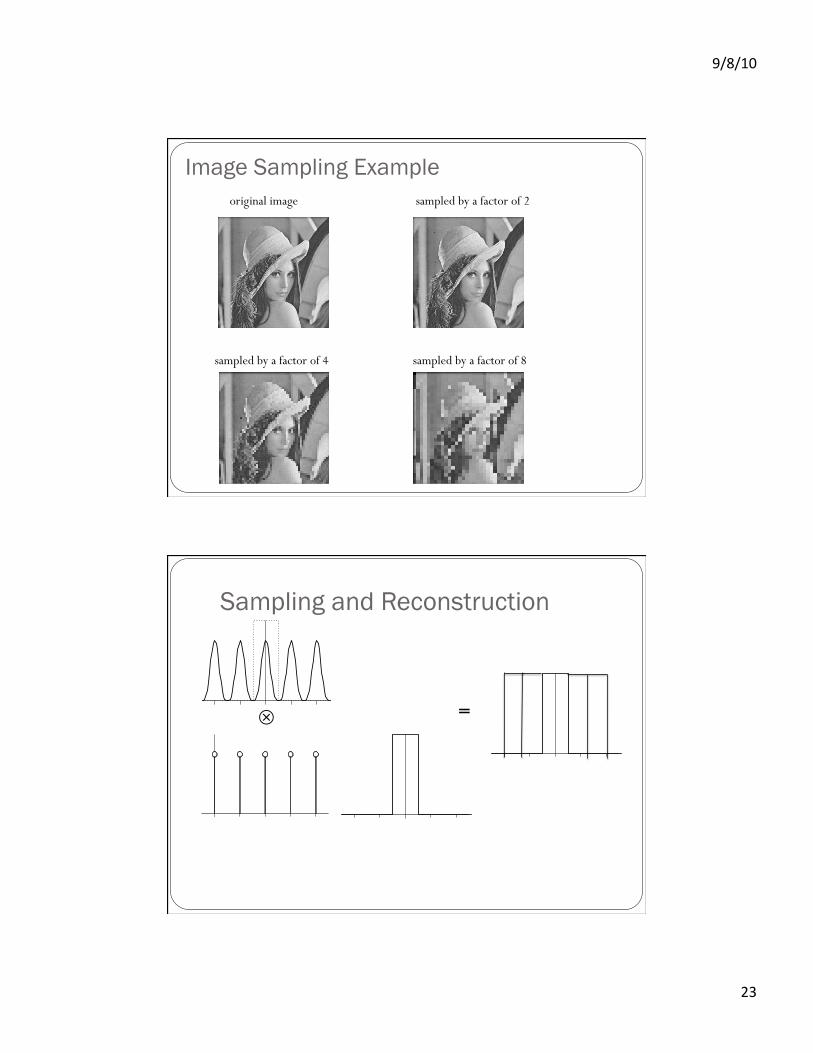
Image Sampling Example original image sampled by a factor of 2
sampled by a factor of 4 sampled by a factor of 8
Sampling and Reconstruction
! =
!"#"$%&
'@&
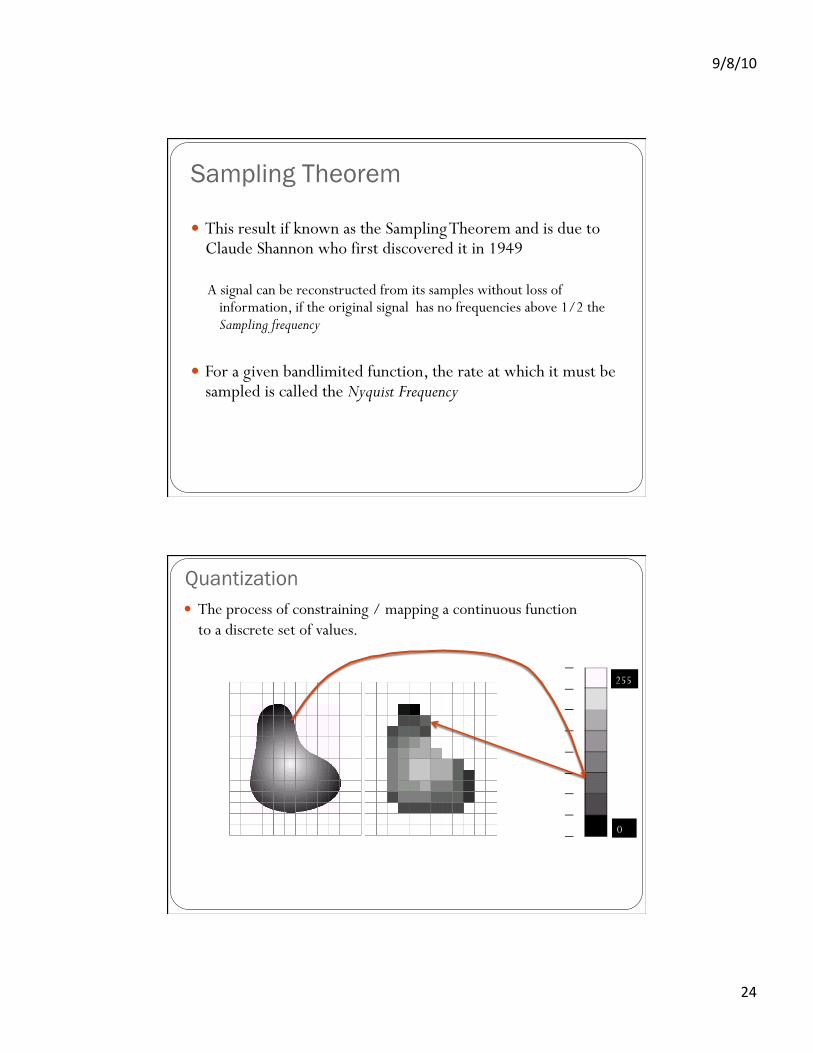
Sampling Theorem
! This result if known as the Sampling Theorem and is due to Claude Shannon who first discovered it in 1949
A signal can be reconstructed from its samples without loss of information, if the original signal has no frequencies above 1/2 the Sampling frequency
! For a given bandlimited function, the rate at which it must be sampled is called the Nyquist Frequency
Quantization ! The process of constraining / mapping a continuous function
to a discrete set of values.
0
255
!"#"$%&
'A&
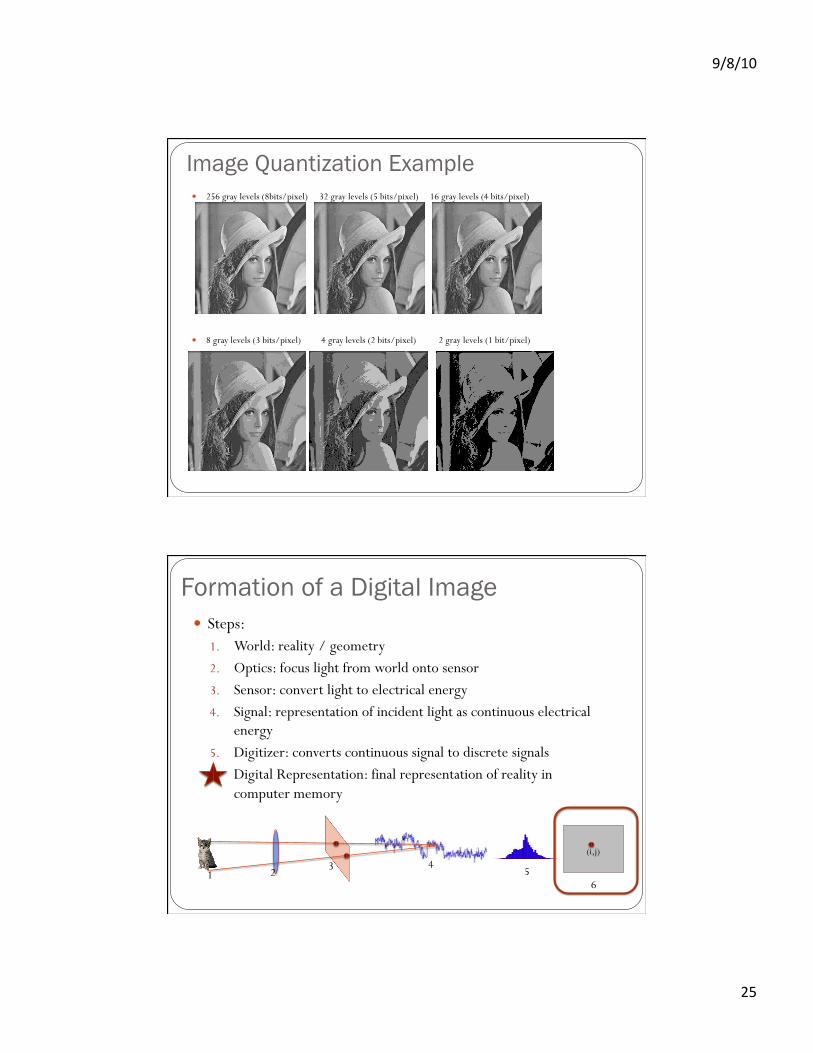
Image Quantization Example ! 256 gray levels (8bits/pixel) 32 gray levels (5 bits/pixel) 16 gray levels (4 bits/pixel)
! 8 gray levels (3 bits/pixel) 4 gray levels (2 bits/pixel) 2 gray levels (1 bit/pixel)
Formation of a Digital Image ! Steps:
1. World: reality / geometry 2. Optics: focus light from world onto sensor 3. Sensor: convert light to electrical energy 4. Signal: representation of incident light as continuous electrical
energy 5. Digitizer: converts continuous signal to discrete signals 6. Digital Representation: final representation of reality in
computer memory
(i,j)
1 2 3 4 5 6
!"#"$%&
'B&
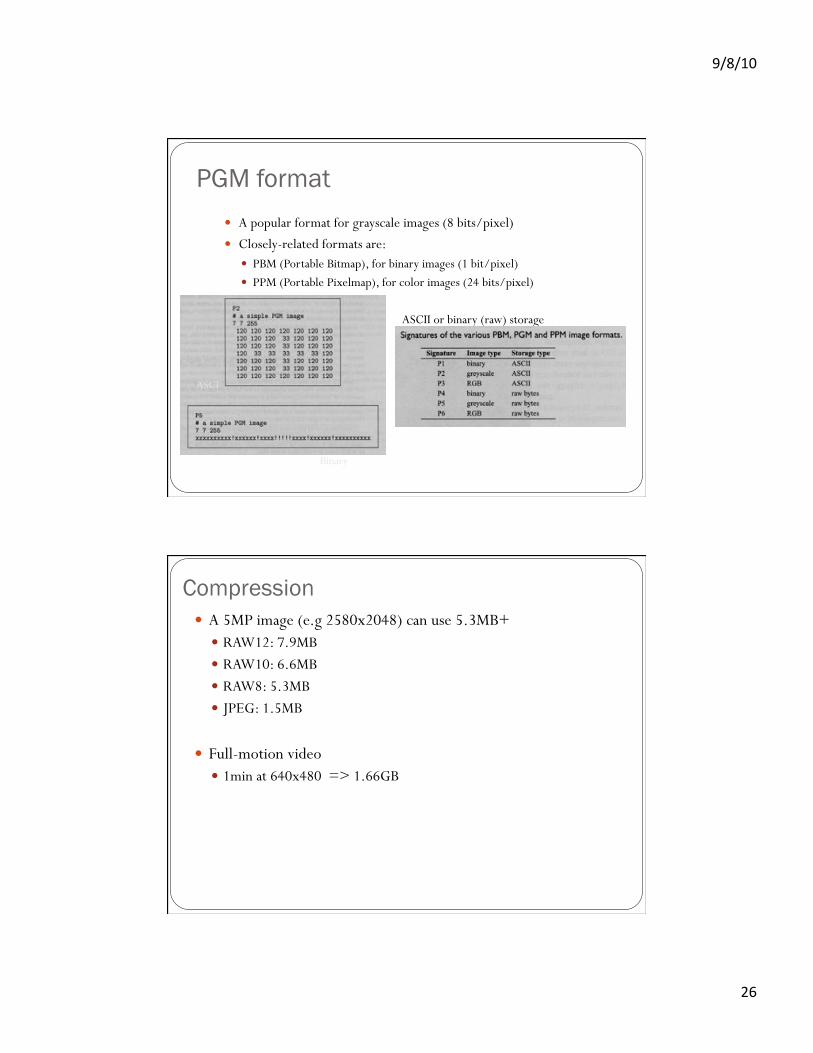
PGM format ! A popular format for grayscale images (8 bits/pixel) ! Closely-related formats are:
! PBM (Portable Bitmap), for binary images (1 bit/pixel) ! PPM (Portable Pixelmap), for color images (24 bits/pixel)
o ASCII or binary (raw) storage
ASCI
Binary
Compression ! A 5MP image (e.g 2580x2048) can use 5.3MB+
! RAW12: 7.9MB ! RAW10: 6.6MB ! RAW8: 5.3MB ! JPEG: 1.5MB
! Full-motion video ! 1min at 640x480 => 1.66GB
!"#"$%&
'C&
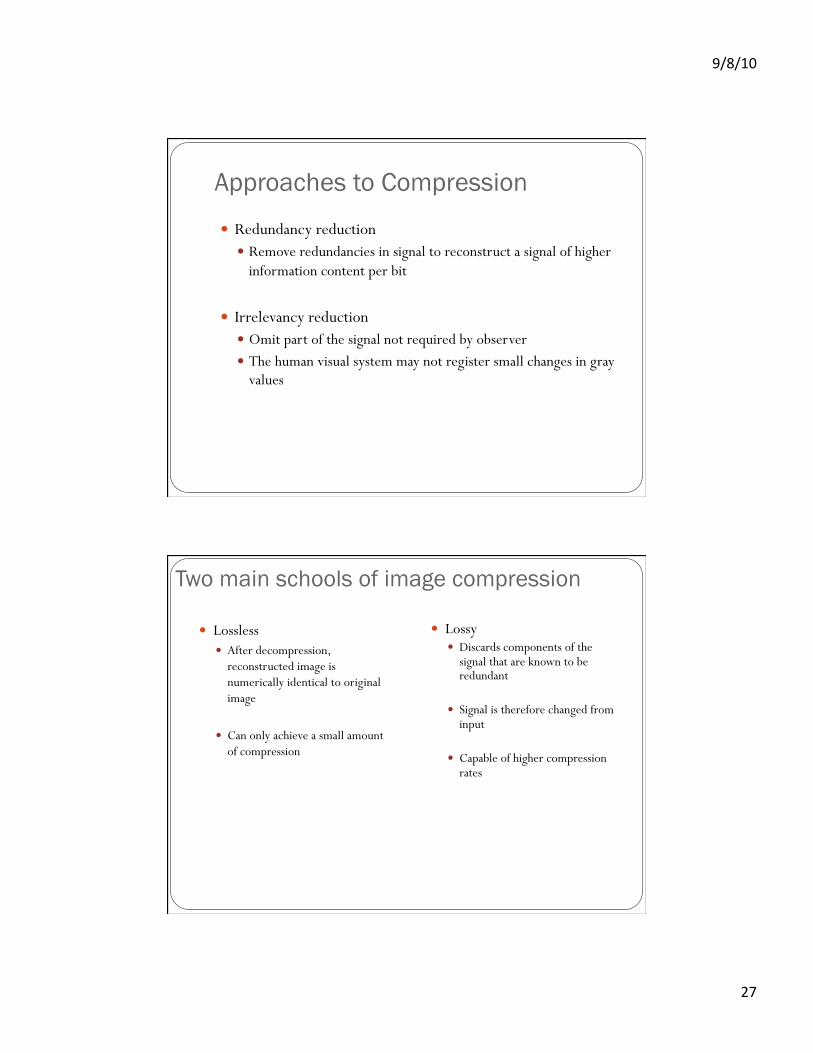
Approaches to Compression
! Redundancy reduction ! Remove redundancies in signal to reconstruct a signal of higher
information content per bit
! Irrelevancy reduction ! Omit part of the signal not required by observer ! The human visual system may not register small changes in gray
values
Two main schools of image compression
! Lossless ! After decompression,
reconstructed image is numerically identical to original image
! Can only achieve a small amount of compression
! Lossy ! Discards components of the
signal that are known to be redundant
! Signal is therefore changed from input
! Capable of higher compression rates
!"#"$%&
'#&
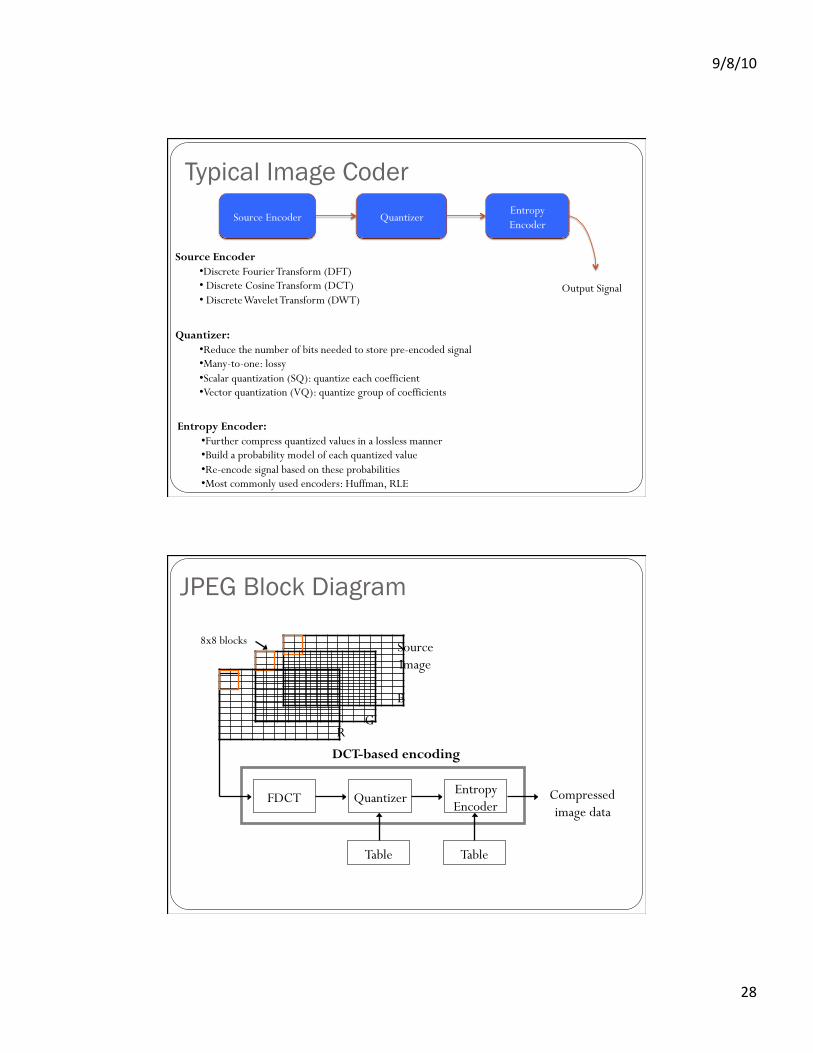
Typical Image Coder Source Encoder Quantizer
Entropy Encoder
Output Signal
Source Encoder • Discrete Fourier Transform (DFT) • Discrete Cosine Transform (DCT) • Discrete Wavelet Transform (DWT)
Quantizer: • Reduce the number of bits needed to store pre-encoded signal • Many-to-one: lossy • Scalar quantization (SQ): quantize each coefficient • Vector quantization (VQ): quantize group of coefficients
Entropy Encoder: • Further compress quantized values in a lossless manner • Build a probability model of each quantized value • Re-encode signal based on these probabilities • Most commonly used encoders: Huffman, RLE
JPEG Block Diagram
FDCT
Source Image
Quantizer Entropy Encoder
Table Table
Compressed image data
DCT-based encoding
8x8 blocks
R
B
G
!"#"$%&
'!&
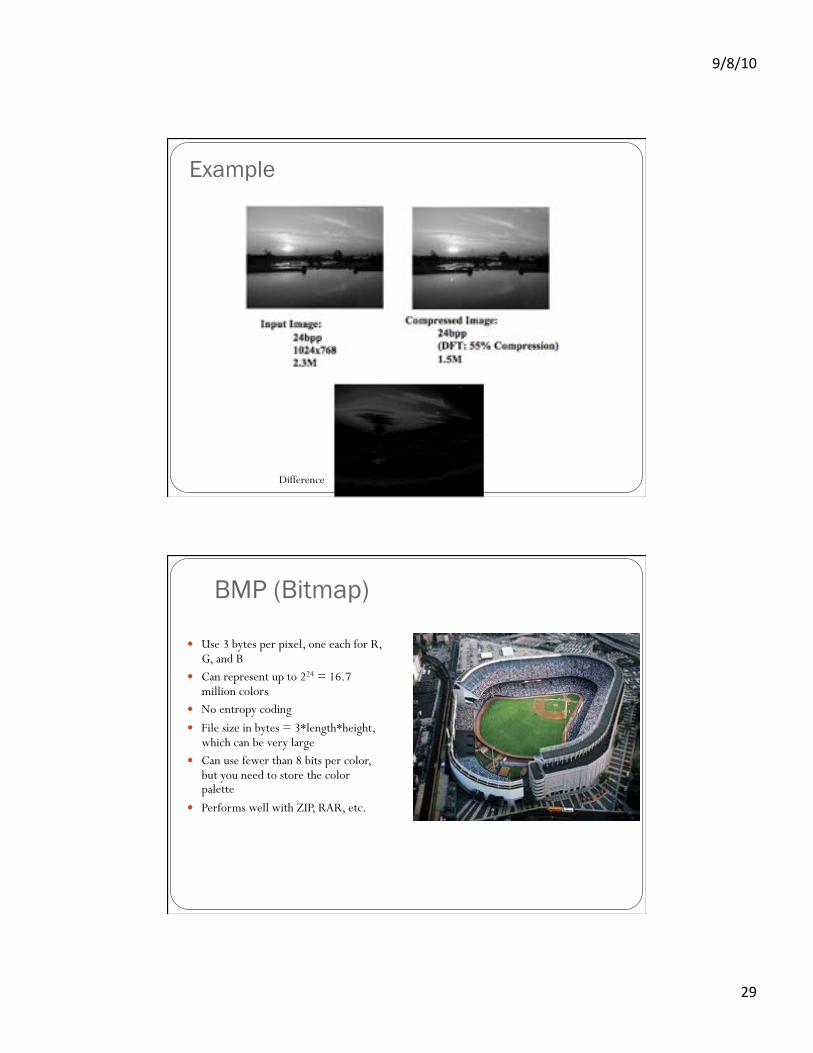
Example
Difference
BMP (Bitmap)
! Use 3 bytes per pixel, one each for R, G, and B
! Can represent up to 224 = 16.7 million colors
! No entropy coding ! File size in bytes = 3*length*height,
which can be very large ! Can use fewer than 8 bits per color,
but you need to store the color palette
! Performs well with ZIP, RAR, etc.
!"#"$%&
?%&
GIF (Graphics Interchange Format) ! Can use up to 256 colors from 24-bit
RGB color space ! If source image contains more than
256 colors, need to reprocess image to fewer colors
! Suitable for simpler images such as logos and textual graphics, not so much for photographs
! Uses LZW lossless data compression
Formation of a Digital Image ! Steps:
1. World: reality / geometry 2. Optics: focus light from world onto sensor 3. Sensor: convert light to electrical energy 4. Signal: representation of incident light as continuous electrical
energy 5. Digitizer: converts continuous signal to discrete signals 6. Digital Representation: final representation of reality in
computer memory
(i,j)
1 2 3 4 5 6
!"#"$%&
?$&
Summary: Image Formation
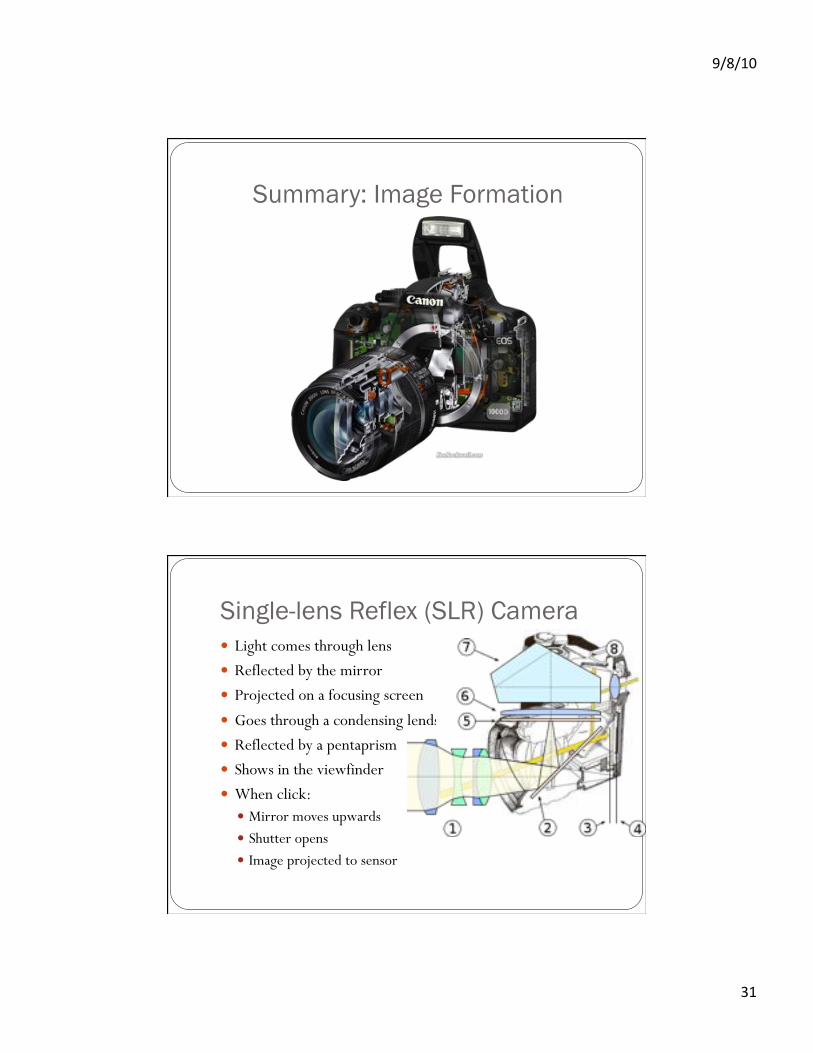
Single-lens Reflex (SLR) Camera ! Light comes through lens ! Reflected by the mirror ! Projected on a focusing screen ! Goes through a condensing lends ! Reflected by a pentaprism ! Shows in the viewfinder ! When click:
! Mirror moves upwards ! Shutter opens ! Image projected to sensor
!"#"$%&
?'&
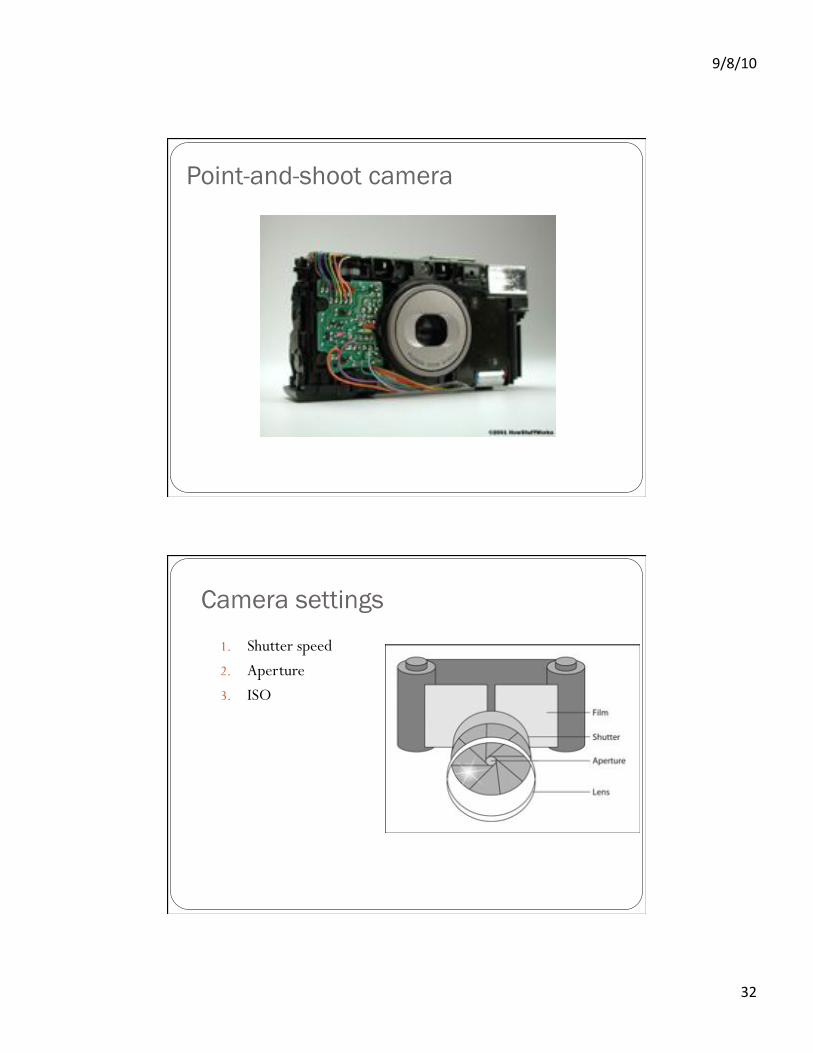
Point-and-shoot camera
Camera settings 1. Shutter speed 2. Aperture 3. ISO
!"#"$%&
??&
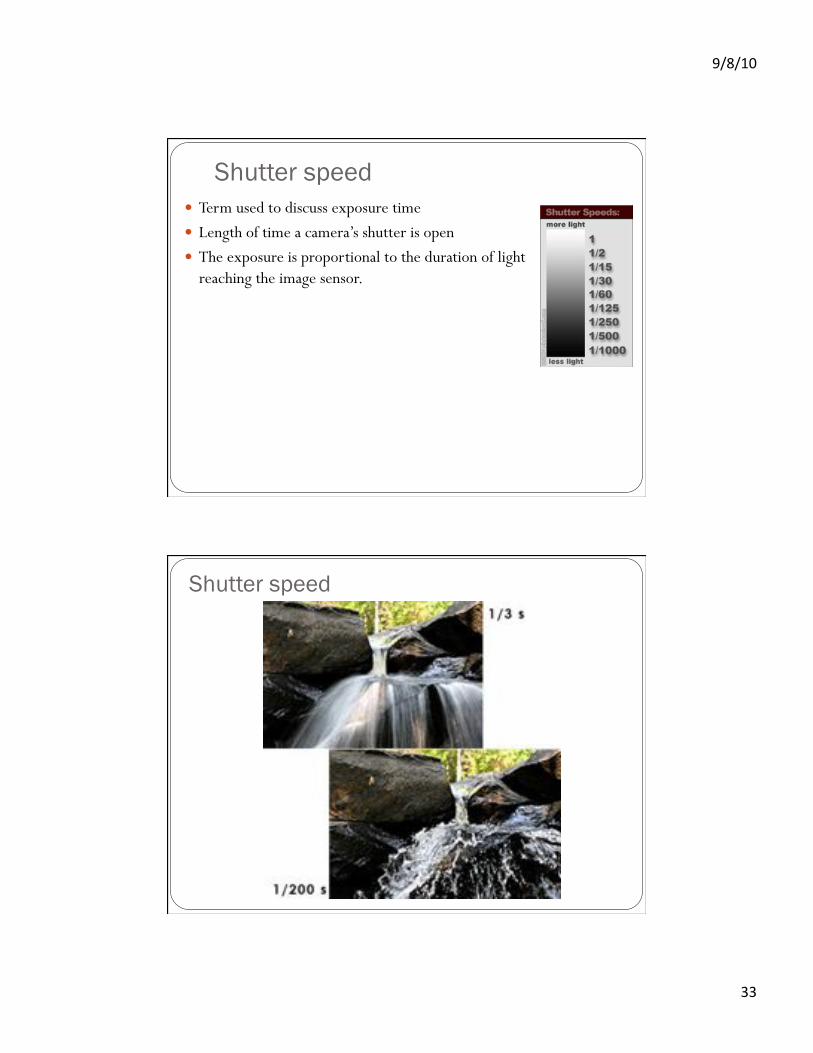
Shutter speed ! Term used to discuss exposure time ! Length of time a camera’s shutter is open ! The exposure is proportional to the duration of light
reaching the image sensor.
Shutter speed
!"#"$%&
?@&
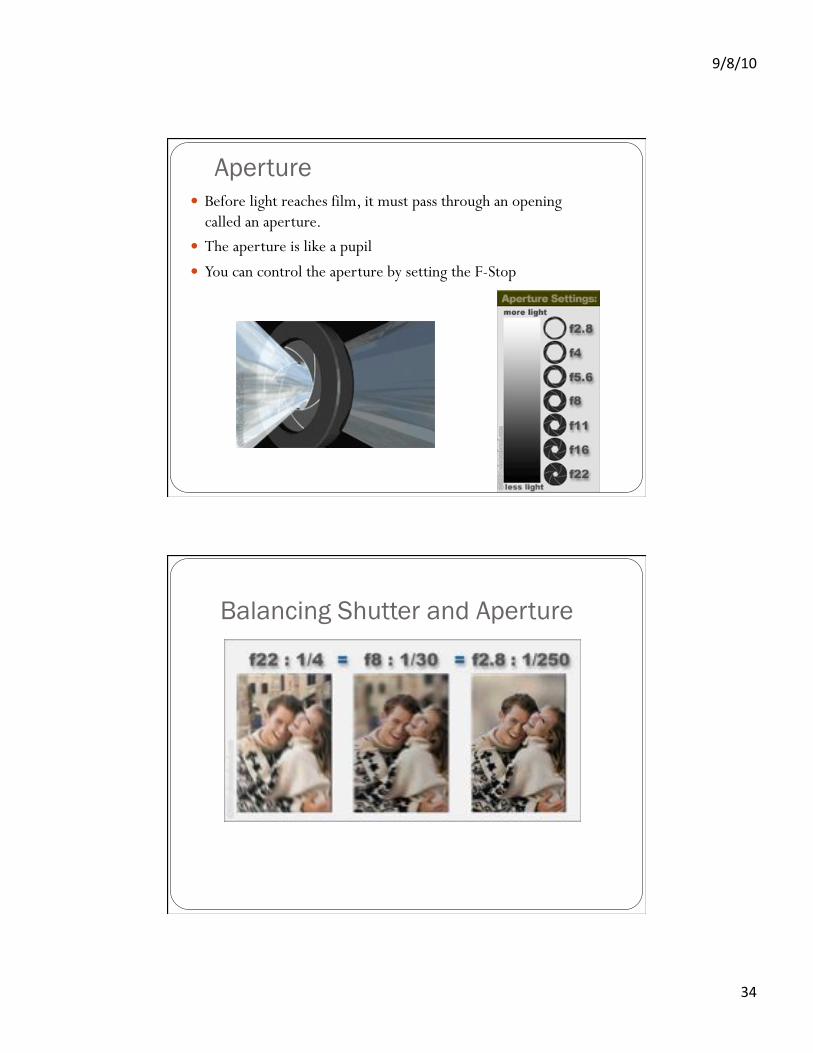
Aperture ! Before light reaches film, it must pass through an opening
called an aperture. ! The aperture is like a pupil ! You can control the aperture by setting the F-Stop
Balancing Shutter and Aperture
!"#"$%&
?A&
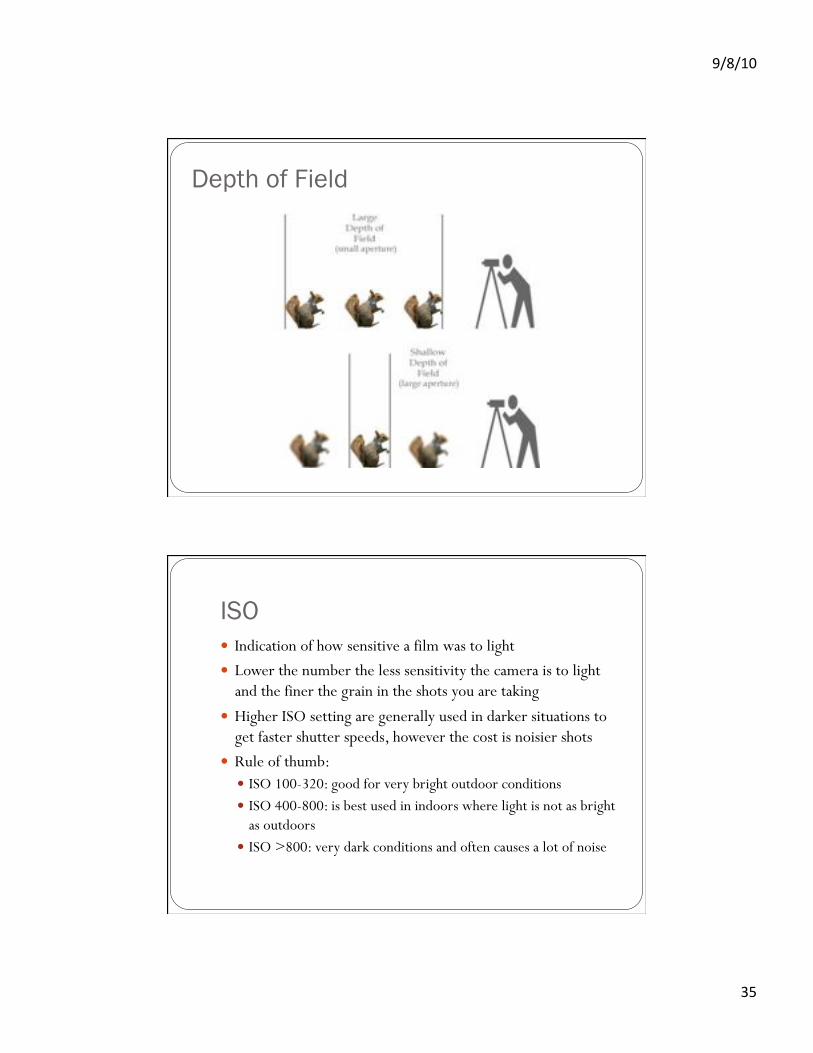
Depth of Field
ISO ! Indication of how sensitive a film was to light ! Lower the number the less sensitivity the camera is to light
and the finer the grain in the shots you are taking ! Higher ISO setting are generally used in darker situations to
get faster shutter speeds, however the cost is noisier shots ! Rule of thumb:
! ISO 100-320: good for very bright outdoor conditions ! ISO 400-800: is best used in indoors where light is not as bright
as outdoors ! ISO >800: very dark conditions and often causes a lot of noise
!"#"$%&
?B&
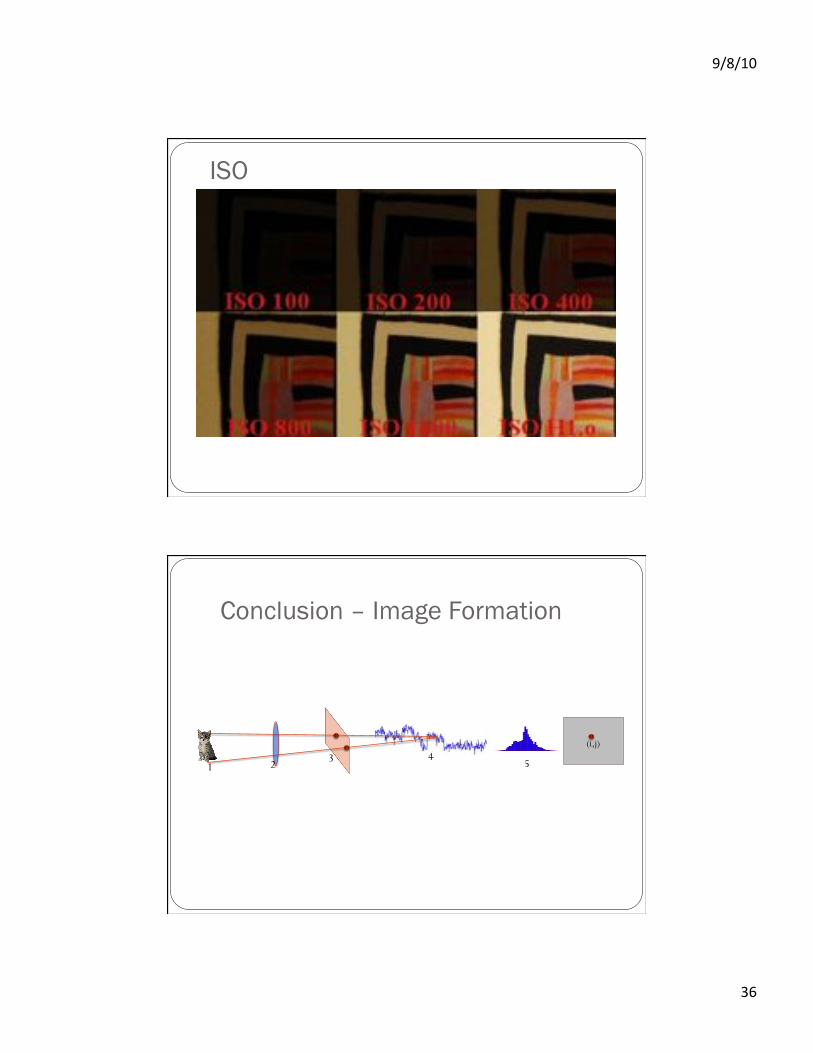
ISO
Conclusion – Image Formation
(i,j)
1 2 3 4 5

!"#"$%&
?C&
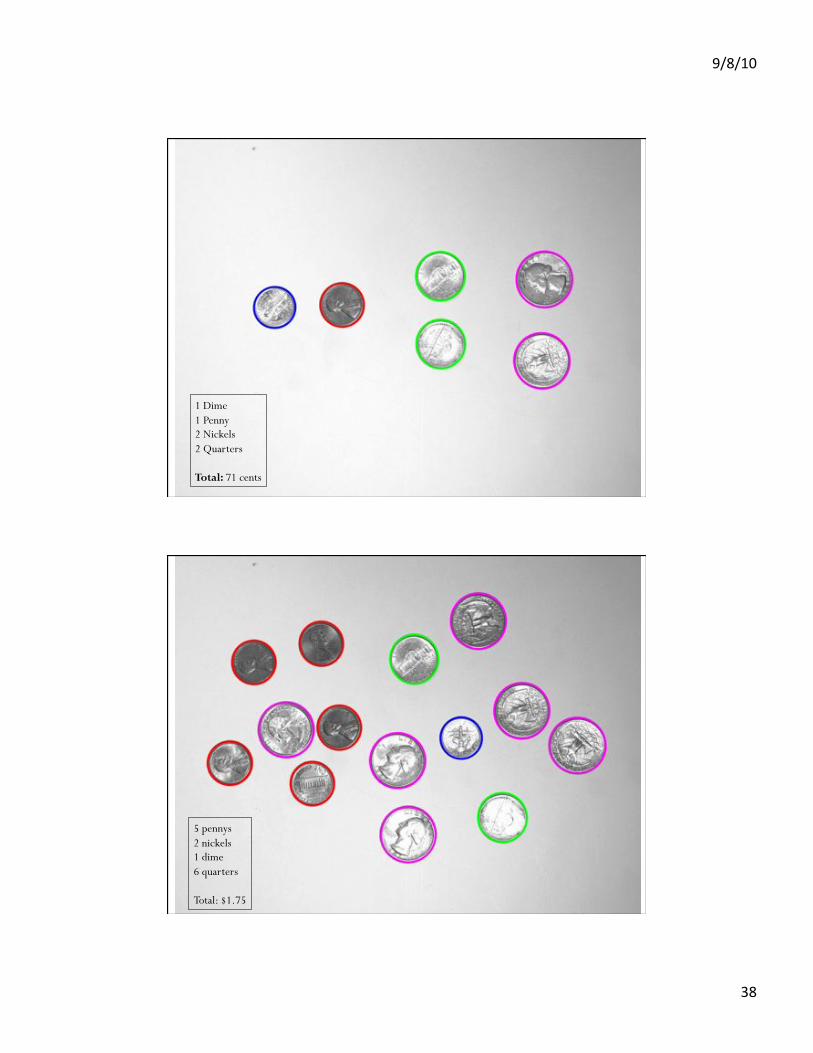
Homework #1
What about an image-base coin counter?
!"#"$%&
?#&
1 Dime 1 Penny 2 Nickels 2 Quarters
Total: 71 cents
5 pennys 2 nickels 1 dime 6 quarters
Total: $1.75
!"#"$%&
?!&
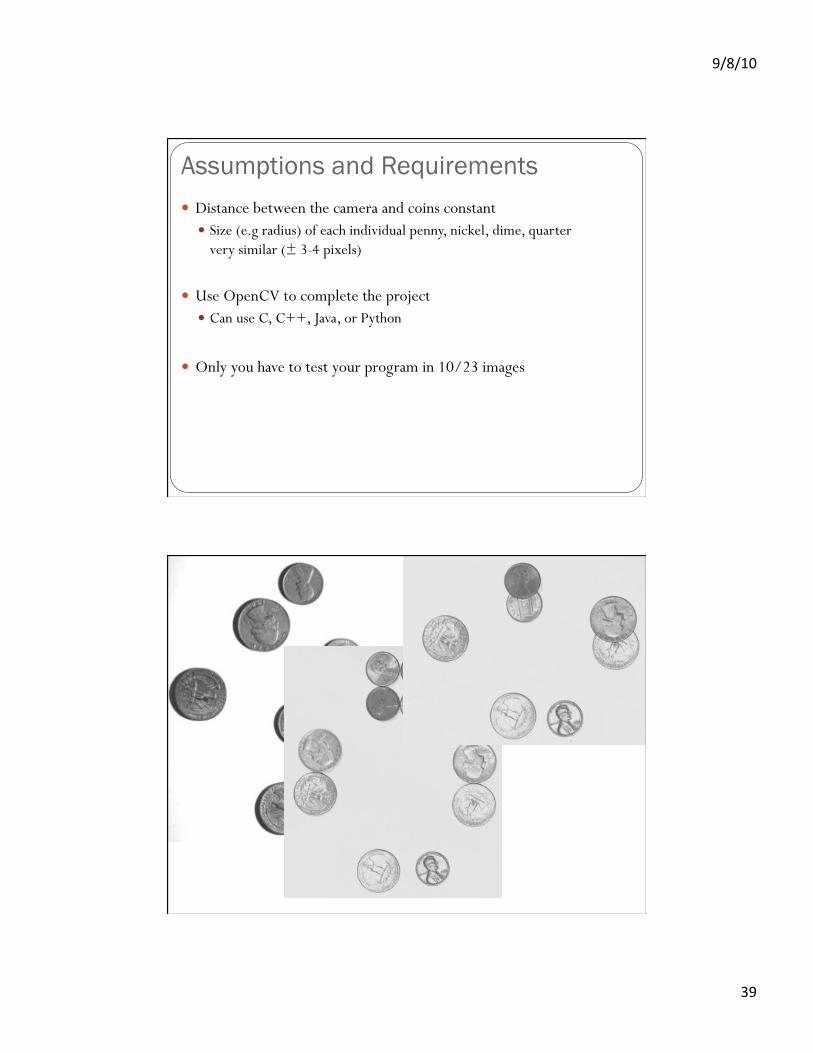
Assumptions and Requirements ! Distance between the camera and coins constant
! Size (e.g radius) of each individual penny, nickel, dime, quarter very similar (± 3-4 pixels)
! Use OpenCV to complete the project ! Can use C, C++, Java, or Python
! Only you have to test your program in 10/23 images

!"#"$%&
@%&
Acknowledgements ! Some of the images and diagrams have been taken from the
Gonzalez et al, “Digital Image Processing” book.