computational simulation of coupled material … · material degradation processes for...
TRANSCRIPT

.
NASA Contractor Report 187234
Computational Simulation of Coupled Material Degradation Processes for Probabilistic Lifetime Strength of Aerospace Materials
Lola Boyce and Callie C. Bast University of Texas at San Antonio San Antonio, Texas
( N A 7 A - C R - l t 3 7 2 3 4 ) C O M P J T A T I U & A L SIMULATION N 9 L - L O 5 1 3 3F C J t l P C E P M A T t R I A L D F G Q A D A T I O N P P O C E S S F S FrfR P 9 0 3 A ’ 3 I L I S T T C L I F f T I M E 5 J R E N G T t - I rJF A F R O S P A C t M A T F R I A L S F i n a l l iPQ0t - t ( T e x a s Uncl as i l n i v , ) 2 9 D C S C t 20K G3/39 0077725
March 1992 /
Prepared for Lewis Research Center Under Grant NAG3-867
National Aeronauticsand Space Administration
https://ntrs.nasa.gov/search.jsp?R=19920011271 2018-07-30T06:34:12+00:00Z

TABLE OF CONTENTS
SECTION PAGE PREFACE .......................................................................................... 11 ..
ABsmm *. - .. * - * * - * * * .. - - -. . .. . . ..... . . .. . . . . . .. . . . . . .. . .. . . .. . . . . . .. . .. . . .. . .. . . .. . . . . . . . . . . . 111 ...
LIST OF FIGURES .... .... . . .... ....... . .. .... . ... .. .... . .. .... .... . .. . ... ... .. ... . ... .. .... . .. . iv
LISTOFTABLES ................................................................................ v
1 .o 2.0
3.0
4.0
5.0
6.0
INTRODUCTION .......................................................................... 1
THEORETICAL BACKGROU ND.......'............................................... 2
STRENGTH DEGRADATION MODELS FOR HIGH TEMPERATURE, FATIGUE AND CREEP FOR INCONEL 718 ......................................... 7
EXPERIMENTALMATERIALDATA FORINCONEL718........................ 8
PROBABILISTICLIFETIME STRENGTH SENSITIVITY STUDY .............. 17
REFERENCES . . . . . . . . . . . . . . . . . .. . . . . . . . . . . . . . . . . . . . . . . . . . . . . . . . . . . . . . . . . . . . . . . . . . . . . . . . . . .22

PREFACE
The University of Texas at San Antonio (UTSA) is a relatively new university. It was established in 1969 and opened for classes in 1973. As the only comprehensive public university serving the nation's ninth largest city, it was and is vital to San Antonio and the entire South Texas Region. In 1982, nine years ago, an undergraduate engineering program was established at UTSA with the support of the community and its leaders. Today, all three undergraduate engineering programs are ABET accredited and serve about 10o0 students, a significant percentage of whom are Hispanic. A new engineering building, containing laboratory facilities and equipment, opened in January, 199 1. Furthermore, a graduate program has just been put in place at the M.S. level and one is planned at the Ph.D. level. The first Master's Degree students enrolled in Fall, 1989.
Naturally, the engineering research environment is just developing at UTSA. Now, thanks in great measure to the UT System support and this ongoing NASA grant, good progress is being made. Specifically, the purchase of a UT System Cray-Y-MP in November, 1990 has provided a world-class analytical and numerical research environment not ordinarily available to a new university. As a result the UTSA Supercomputer Network Research Facility (SNRF) was developed by the principal investigator, Dr. Lola Boyce. This has allowed the successful completion of this research project, an early one of its kind at UTSA.
This NASA research grant has allowed four undergraduate Mechanical Engineering students, Thomas Lovelace, Michael Futschik, Ray-u Shay, and Eddie Aponte plus the first UTSA Mechanical Engineering graduate student, Callie Bast, to work directly with the principal investigator, Dr. Boyce, providing them with a quality research experience they would otherwise probably not have had. All undergraduate students have expressed an interest in continuing their education at the graduate level.
In conclusion, and in view of the significant accomplishments in fundamental research, enhancement of the engineering research environment at UTSA, and direct support of Mechanical Engineering students, it is hoped that the proposed extension of this grant will receive favorable consideration at NASA. The principal investigator sincerely thanks NASA for funding this third year grant.

ABSTRACT
This report presents the results of a third year effort of a research program conducted for NASA-LeRC by The University of Texas at San Antonio (UTSA). The research included on-going development of methodology that provides probabilistic lifetime strength of aerospace materials via computational simulation. A probabilistic material strength degradation model, in the form of a randomized multifactor interaction equation, is postulated for strength degradation of structural components of aerospace propulsion systems subjected to a number of effects or primitive variables. These primitive variables may include high temperature, fatigue or creep. In most cases, strength is reduced as a result of the action of a variable. This multifactor interaction strength degradation equation has been randomized and is included in the computer program, PROMISS. Also included in the research is the development of methodology to calibrate the above-described constitutive equation using actual experimental materials data together with linear regression of that data, thereby predicting values for the empirical material constants for each effect or primitive variable. This regression methodology is included in the computer program, PROMISC. Actual experimental materials data were obtained from the open literature for materials typically of interest for aerospace propulsion system components. Material data for Inconel 7 18 has been analyzed using the developed methodology.
iii

LIST OF FIGURES
FIGURE
Fig. 1
Fig. 2
Fig. 3
Fig. 4
Fig. 5
Fig. 6
Fig. 7
Fig. 8
Fig. 9
Fig. 10
Fig. 11
Fig. 12
Fig. 13
Fig. 14
Fig. 15
PAGE
Schematic of Data Illustrating the Effect of One Primitive Variable on Strength ..... . .. . ... . . .. . .. . . ... . .. . . .. . . .. ... .. .. . . .. .. ... .. .. .. . . ... . 3
Model Parameters for Inconel 7 18 for Temperature, Mechanical Fatigue and Creep ............. .... ... ....... ... ... .... ... ... .... .. . .. 9
Effect of Temperature (OF) on Yield Strength for Inconel 7 18.
Effect of Temperature (OF) on Yield Strength for Inconel 718.
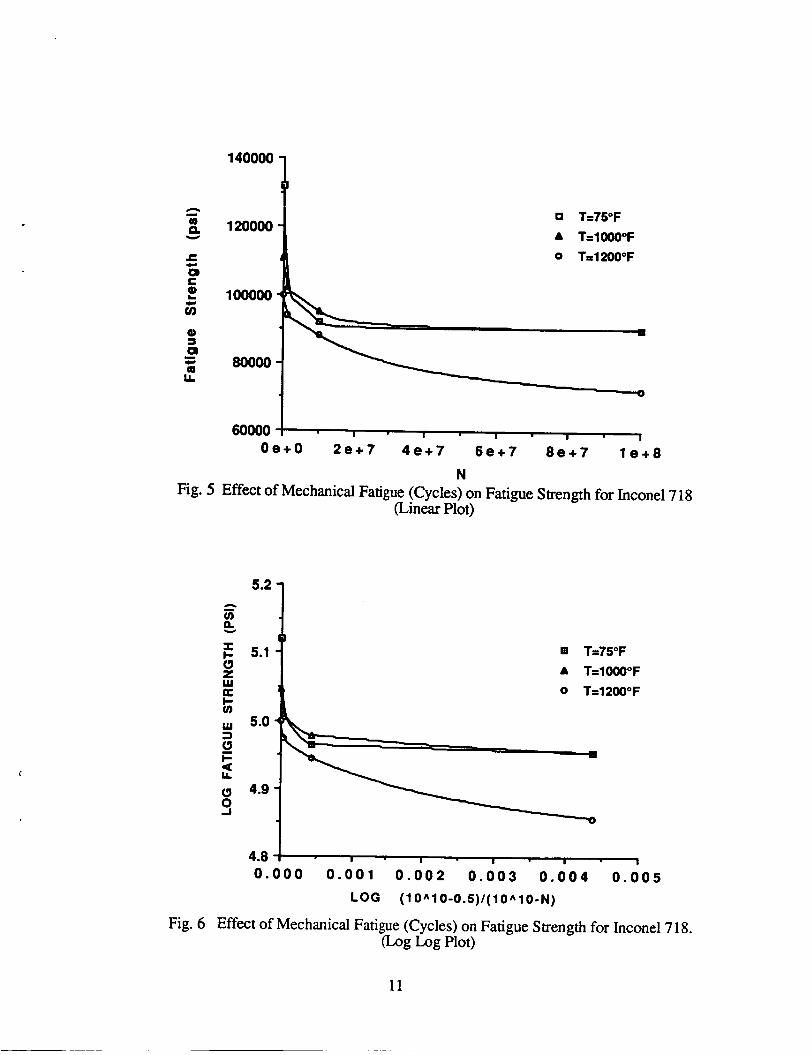
Effect of Mechanical Fatigue (Cycles) on Fatigue Strength for Inconel 7 18. (Linear Plot) . . . . . . . . . . . . . . . . . . . . . . . . . . . . . . . . . . . . . . . . . . . . . . . . . . . 1 1
Effect of Mechanical Fatigue (Cycles) on Fatigue Strength for Inconel 718. (Log Log Plot) ................................................. 11
Effect of Creep Time (Hours) on Rupture Strength for Inconel 7 1 8. (Linear Plot) . . . . . . . . . . . . . . . . . . . . . . . . . . . . . . . . . . . . . . . .; . . . . . . . . . .12
Effect of Creep Time (Hours) on Rupture Strength for Inconel 718. (Log Log Plot) ................................................. 12
Effect of Temperature (OF) on Yield Strength for Inconel 718. (Log Log Plot with Linear Regression) . . .. . . .. . . . . . . . . . . . . . . . . . . . . .. . . . . . . . .. . .13
Effect of Mechanical Fatigue (Cycles) on Fatigue Strength for Inconel 718. (Log Log Plot with Linear Regression) .. .. . . . . . . . . . . . . . . . .13
Effect of Creep Time (Hours) on Rupture Strength for Inconel 7 18. (Log Log Plot with Linear Regression) . . . . . . . , . . . . . . . . . . . .14
Effect of Temperature (OF) on Yield Strength for Inconel 718: Comparison of Linear and Beta Models with Actual Data. . .. . . . . . . . . .. . . . . . .15
Effect of Temperature (OF) on Yield Strength for Inconel 7 18: Comparison of Beta and Polynomial Models with Actual Data. . . . . . . . . . . . . .16
Comparison of Various Levels of Uncertainty of Temperature (OF) on Probable Strength for a Nickel-Based Superalloy .......................... 19
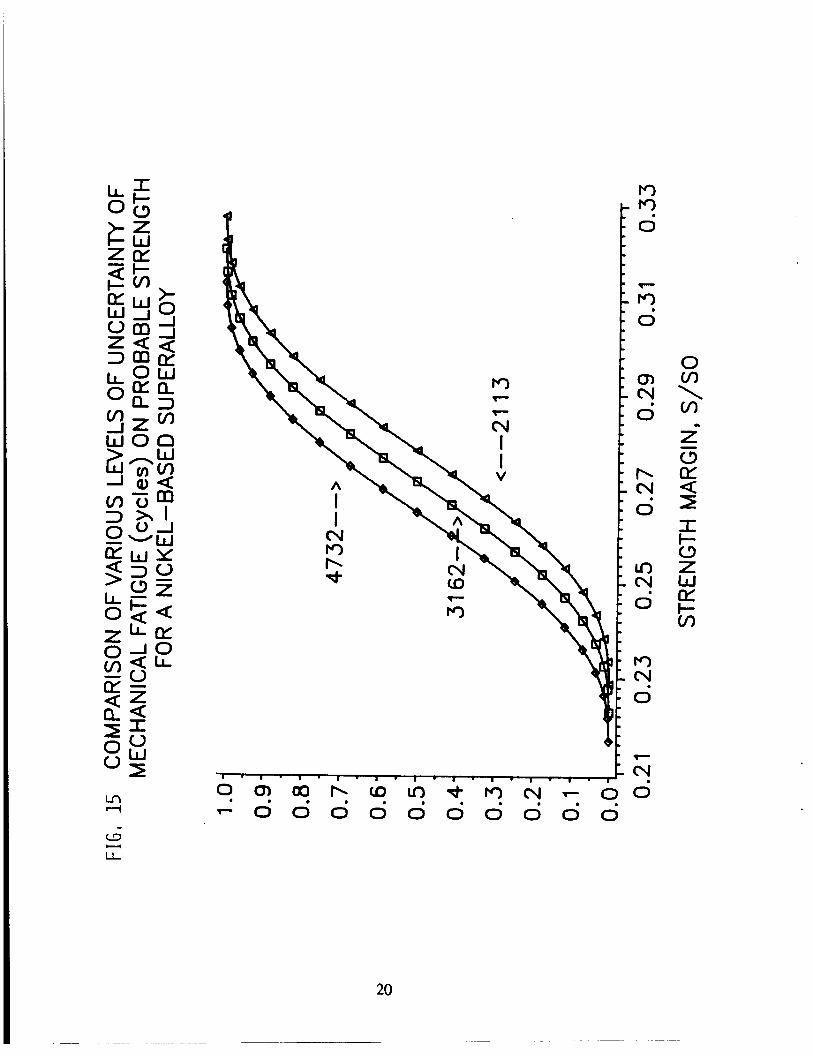
Comparison of Various Levels of Uncertainty of Mechanical Fatigue (Cycles) on Probable Strength for a Nickel-Based Superalloy . . . . .20
(Linear Plot). . . . . . . . . . . . . . . . . . . . . . . . . . . . . . . . . . . . . . . . . . . . . . . . . . . . . . . . . . . . . . . . . . . . . . . .10
(Log Log Plot) . . .... . . . . . . . . . . . . . . . . . . . .. . . . . . . . . . .. . .. . . . . . . .. . .. . . . . . . . . . . . . . . . . .10
Fig. 16 Comparison of Various Levels of Uncertainty of Creep (Hours) on Probable Strength for a Nickel-Based Superalloy .......................... 21
iv
~~

LIST OF TABLES
TABLE PAGE
Table 1 Primitive Variables Available in the Fixed Model .............................. 5
Table 2 Primitive Variables Available in the Flexible Model ........................... 4
Table 3 Sensitivity Study of Probabilistic Material Strength Degradation Model ................................................................. 17
Typical PROMIS S "Fixed" Model Input Values ............................... 18 Table 4
V

1 .O INTRODUCTION
This report presents the results of a third year effort of a research program entitled "Development of Advanced Methodologies for Probabilistic Constitutive Relationships of Material Strength Models, Phase 3." This research is sponsored by the National Aeronautics and Space Administration-Lewis Research Center (NASA-LeRC). The principal investigator is Dr. Lola Boyce, Associate Professor of Mechanical Engineering, The University of Texas at San Antonio (UTSA). The objective of the research program is the development of methodology that provides probabilistic lifetime strength of aerospace materials via computational simulation.
As part of this third year effort, a material strength degradation model, in the form of a randomized multifactor interaction equation, is postulated for strength degradation of structural components of aerospace propulsion systems subjected to a number of effects or primitive variables. These primitive variables often originate in the environment and may include high temperature, fatigue and creep. In most cases, strength is reduced as a result. Also included in the research is the development of methodology to calibrate the multifactor interaction constitutive equation using actual experimental materials data together with a multiple regression of that data, thereby predicting values for the empirical material constants for each effect or primitive variable. Material data for Inconel 7 18 has been analyzed using the developed methodology. Section 2.0 summarizes the theoretical background for the research.
The above-described randomized multifactor interaction constitutive equation is included in the computer program, PROMISS. Calibration of the equation by multiple linear regression of the data may be carried out using the statistical regression computer program, PROMISC. These programs were developed using the UTSA Supercomputer Network Research Facility (SNRF) Cray Y-MP. The latest versions (Ver. 2.0) of these programs are obtainable from the principal investigator at the address given on the cover page of this report.
Sections 3.0 through 5.0 address specific tasks described in the proposal for this research "Development of Advanced Methodologies for Probabilistic Constitutive Relationships for Material Strength Models, Phase 3", 1990. Specifically, Section 3.0 discusses the strength degradation models developed for the high temperature, fatigue and creep effects. Section 4.0 displays experimental material data for Inconel 718 and the various statistical models used to represent the data. This data is to be used in developing data for the PROMISS Resident Database. Section 5.0 presents and discusses cases for analysis that resulted from a sensitivity study, utilizing the PROMISS "flexible" capability. The cases show the effect on probabilistic lifetime strength for each of several effects or primitive variables (high temperature, mechanical fatigue and creep).
A paper was produced documenting much of the effort of this third year research program. It is entitled "Probabilistic Lifetime Strength of Aerospace Materials via Computational Simulation", by L. Boyce and C. C. Chamis. It was presented at the NASA Advanced Earth-to-Orbit Propulsion Technology Conference, Huntsville, AL, May, 1990 and is published in the Proceedings. It has also been submitted to the AIAA Journal and a copy is included with this report.
1

2.0 THEORETICAL BACKGROUND:
PROBABILISTIC MATERIAL STRENGTH DEGRADATION MODEL FOR LIFETIME STRENGTH OF AEROSPACE MATERIALS
Recently, a general material strength degradation model, for composite materials subjected to a number of diverse effects or primitive variables, has been postulated to predict mechanical and thermal material properties [l, 2,3,4]. The resulting multifactor interaction constitutive equations summarize composite micromechanics theory and have been used to predict material properties for a unidirectional fiber-reinforced lamina, based on the corresponding properties of the constituent materials.
These equations have been modified to predict the mechanical property of strength for one constituent material due to 'h" diverse effects or primitive variables [5,6]. These effects could include variables such as high temperature, creep, mechanical fatigue, thermal fatigue, hydrogen embrittlement or strain rate effects. For most of these primitive variables, strength has been observed to decrease with an increase in the variable.
The postulated multifactor interaction equation accounts for the degradation of strength due to these primitive variables. The general form of the equation is
where Ai. AiF and Ai0 are the current, ultimate and reference values of a particular effect, ai is the value of an empirical constant for the i* effect or primitive variable product term in the model, S and SO are the current and reference values of material strength and n is the number of product terms or primitive variables in the model. Each term has the property that if the current value equals the ultimate value, the current strength will be zero. Also, if the current value equals the reference value, the term equals one and strength is not affected by that variable.
This deterministic material strength degradation model may be calibrated by an appropriately curve-fitted least squares multiple linear regression of experimental data [7], perhaps supplemented by expert opinion. Ideally, experimental data giving the relationship between effects and strength is obtained. For example, data for just one effect could be plotted on log-log paper. A good fit for the data may then be obtained by a linear regression analysis. This is illustrated schematically in Figure 1. The equation, for a single effect, is then obtained by noting the linear relation between log S and log [(AF - Ao)/(AF - A)], as follows:
logs= - alog [g] +log so
logs - log so = - alog [ v] %-A0
2

- a P;[-] %-A, s, % - A
Note that the above equation (2) is for a primitive variable that lowers strength. If a variable raises strength, the exponent is negative.
Fig. 1 Schematic of Data Illustrating the Effect of One Primitive Variable on Strength.
This general material strength degradation model, given by equation (1) may be used to estimate the lifetime strength S/So, of an aerospace propulsion system component under the influence of a number of diverse effects or primitive variables. The probabilistic treatment of this equation includes randomizing the deterministic multifactor interaction equation, perfom-ing probabilistic analysis by simulation and generating probability density function (p.d.f.) estimates for strength using the non-parametric method, maximum penalized likelihood [8,9]. Integration yields the cumulative distribution function (c.d.f.) from which probability statements regarding strength may be made. This probabilistic material strength degradation model predicts the random strength of an aerospace propulsion component due to a number of diverse random effects.
The probabilistic constitutive model is embodied in two FORTRAN programs, PROMISS (EMbabilistic Matefial Strength Simulator) and PROMISC mbabilistic Matedal Strength Calibrator)[ 101. PROMISS calculates the random strength of an aerospace propulsion component due to as many as eighteen diverse random effects. Results are presented in the form of probability density functions and cumulative distribution functions of normalized strength, S/So. PROMISC calculates the values of the empirical material constants, a;.
3

PROMISS includes a relatively simple "fixed" model as well as a "flexible" model. The fixed model postulates a probabilistic constitutive equation that considers the primitive variables given in Table 1. The general form of this constitutive equation is given in equation (l), wherein there are now n = 7 product terms, one for each effect or primitive variable listed above. Note that since this model has seven primitive variables, each containing four values of the variable, it has a total of twenty-eight variables. The flexible model postulates the probabilistic constitutive equation that considers up to as many as n = 18 product terms for primitive variables. These variables may be selected to utilize the theory and experimental data currently available for the specific strength degradation mechanisms of interest. The specific effects included in the flexible model are listed in Table 2. Note that in order to provide for future expansion and customization of the flexible model, six "other" effects have been provided.
Table 2 Primitive Variables Available in the Flexible Model.
A. Environmental Effects
1. Mechanical a. Stress b. Impact c. Other Mechanical Effect
2. Thermal a. Temperature Variation b. Thermalshock c. Other Thexmal Effect
3 . Other Environmental Effects a. Chemical Reaction b. Radiation Attack c. Other Environmental Effect
B . Time-Dependent Effects
1. Mechanical a. Creep b. Mechanical Fatigue c. Other Mech. Time-Dep. Effect
2. Thermal a. ThermalAging b. Thermal Fatigue c. Other Thermal Time-Dep. Effect
3 . Other Time-Dependent Effects a. Corrosion b. Seasonal Attack c. Other Time-Dep. Effect
4

Table 1 Primitive Variables Available in the Fixed Model.
in Primitive Primitive Variable Variable Type d
1 2 Temperature 3 Chemical reaction 4 Stress due to impact 5 Mechanical fatigue 6 Thermalfatigue
Stress due to static load
7 creep
The considerable scatter of experimental data and the lack of an exact description of the underlying physical processes for the combined mechanisms of fatigue, creep, temperature variations, and so on, make it natural, if not necessary to consider probabilistic models far a strength degradation model. Therefore, the fixed and flexible models corresponding to equation (1) are "randomized", and yield the "random normalized material strength due to a number of diverse random effects or primitive variables." Note that for the fixed model, equation (1) has the following form:
where Ai, A s and Ai0 are the ultimate, current and reference values of the i* of seven effects or primitive variables as given in Table 1. In general, this expression can be written as,
S/So = f(Xi), i = 1, ..., 28, (4)
where the Xi are the twenty eight independent variables in equation (3). Thus, the fixed model is "randomized" by assuming all the independent variables, Xi, i = 1, ..., 28, to be random and stochastically independent. For the flexible model, equation (1) has a form analogous to equations (3) and (4), except that there are as many as seventy-two independent variables. Applying probabilistic analysis to either of these randomized equations yields the distribution of the dependent random variable, normalized material strength, S/So.
Although a number of methods of probabilistic analysis are available, [8] simulation was chosen for PROMISS. Simulation utilizes a theoretical sample generated by numerical techniques for each of the independent random variables. One value from each sample is substituted into the functional relationship, equation (3), and one realization of normalized strength, S/So, is calculated. This calculation is repeated for each value in the set of samples, yielding a distribution of different values for normalized strength.
normalized strength, using a non-parametric method, maximum penalized likelihood. Maximum penalized likelihood generates the p.d.f. estimate using the method of maximum likelihood together with a penalty function to smooth it [9]. Finally, integration of the
A probability density function is generated from these different values of
5
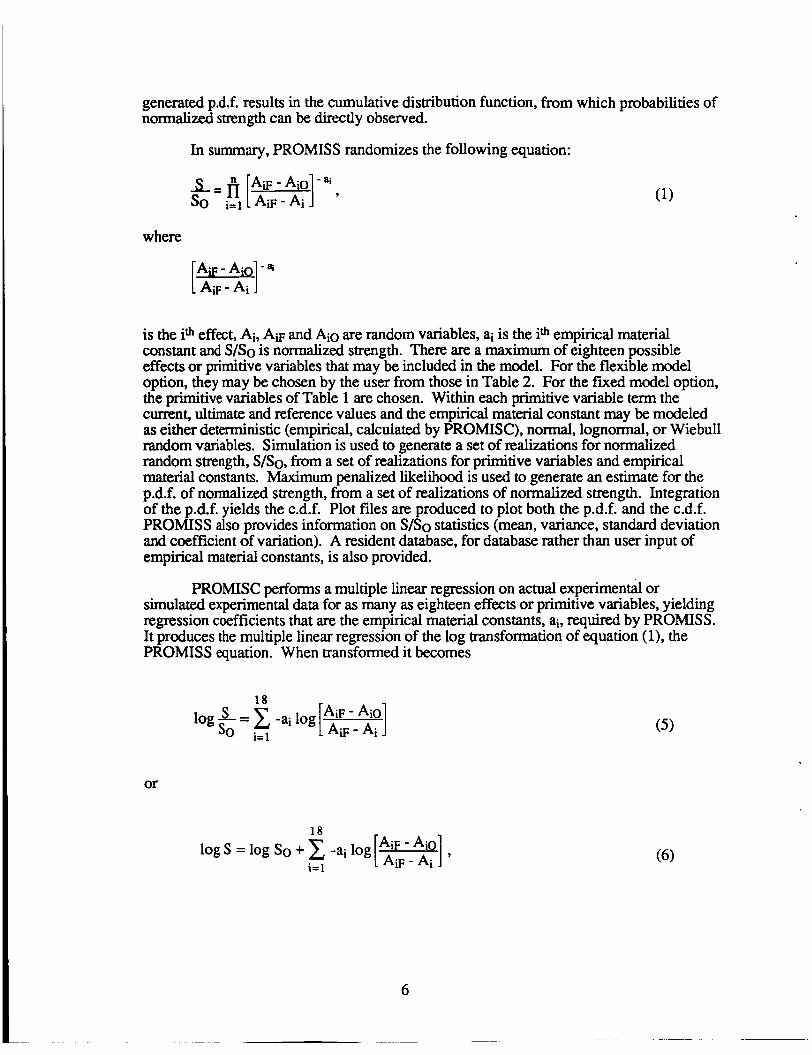
generated p.d.f. results in the cumulative distribution function, from which probabilities of normalized strength can be directly observed.
In summary, PROMISS randomizes the following equation:
where
is the i* effect, Ai,.Az and Ai0 are random variables, ai is the i* empirical material constant and S/So is normalized strength. There are a maximum of eighteen possible effects or primitive variables that may be included in the model. For the flexible model option, they may be chosen by the user from those in Table 2. For the fixed model option, the primitive variables of Table 1 are chosen. Within each primitive variable term the current, ultimate and reference values and the empirical material constant may be modeled as either deterministic (empirical, calculated by PROMISC), normal, lognormal, or Wiebull random variables. Simulation is used to generate a set of realizations for normalized random strength, S/So, from a set of realizations for primitive variables and empirical material constants. Maximum penalized likelihood is used to generate an estimate for the p.d.f. of normalized strength, from a set of realizations of normalized strength. Integration of the p.d.f. yields the c.d.f. Plot files are produced to plot both the p.d.f. and the c.d.f. PROMISS also provides information on S/So statistics (mean, variance, standard deviation and coefficient of variation). A resident database, for database rather than user input of empirical material constants, is also provided.
PROMISC performs a multiple linear regression on actual experimental or simulated experimental data for as many as eighteen effects or primitive variables, yielding regression coefficients that are the empirical material constants, ai, required by PROMISS. It produces the multiple linear regression of the log transformation of equation (l), the PROMISS equation. When transformed it becomes
or

where
is the i* effect, Ai, A s and Ai0 are primitive variable data and ai is the i* empirical material constant, or the i* regression coefficient to be predicted by PROMISC. Also, log SO is the log transformed reference value of strength, or the intercept regression coefficient to be predicted by PROMISC, and log S is the log transformed strength. Experimental data for up to eighteen possible effects, as given in Table 2, may be included. The primitive variable data may be either actual experimental data or expert opinion, directly read from input, or simulated data where expert opinion is specified as the mean and standard deviation of a normal or lognormal distribution. The simulated data option for input data was used in the early stages of code development to verify correct performance. The input data, whether actual or simulated, is read in and assembled into a data matrix. From this data matrix, a corrected sums of squares and cross products matrix is computed. From this sums of squares and cross products matrix, and a least squares methodology, a multiple linear regression is performed to calculate estimates for the empirical material constant, a;, and the reference strength, So. These are the regression coefficients.
screen data from "outliers" and collinearities, determine "how well" the data fit the regression, quantify the importance and relative importance of each factor in the multifactor interaction equation (l), as well as check assumptions inherent in the use of multiple linear regression. Further details are provided in Reference 10, Section 6.0.
PROMISC includes enhancements of the multiple linear regression analysis to
3.0 STRENGTH DEGRADATION MODELS FOR HIGH TEMPERATURE, FATIGUE AND CREEP FOR INCONEL 718
The multifactor interaction equation for material strength degradation, given by Equation (l), when modified for high temperature, fatigue and creep becomes,
where TM is the final or melting temperature of the material, TO is a reference or morn temperature, T is the current temperature, NF is the final number of cycles (for which fatigue strength is very small), N o is a reference number of cycles (for which fatigue strength is very large), N is the current number of cycles the material has undergone, tF is the final number of creep hours (for which rupture strength is very small), to is a reference number of cycles (for which fatigue strength is very large) and t is the current number of creep horn. Also q,t and v are empirical material parameters, one for each variable, that represent the slope of a straight line fit of the data on log log paper.
7

4.0 EXPERIMENTAL MATERIAL DATA FOR INCONEL 7 18
In order to calibrate the multifactor interaction equation for particular aerospace materials of interest, it is necessary to collect actual experimental data to determine the model's empirical material constants, ai. A computerized literature search of nickel-base superalloys and metal matrix composites was conducted to obtain existing experimental data on various material properties. Data on high temperature tensile strength, mechanical fatigue strength and creep rupture strength properties were obtained for nickel-base superalloys [lo]. Only creep properties were found for metal matrix composites. In addition, several sources provided substantial data on INCONEL 718, a nickel-base superalloy.
INCONEL 7 18 data for high-temperature tensile strength, mechanical fatigue strength and creep rupture strength resulted from tests done on various hot and cold worked specimens. Tests were conducted on sheets of INCONEL 7 18 and hot rolled bars of the superalloy. Some high-temperature tensile strength and creep rupture strength data resulted from tests performed on notched specimens with a stress concentration factor, Kt, ranging from 2.3 to greater than 20.
Data for nickel-base superalloys were far more abundant than that for metal matrix composite materials. Data for INCONEL 7 18 were also more abundant than for any other superalloy and were available for three primitive effects, namely, high temperature, mechanical fatigue cycles and creep time. Thus, certain INCONEL 7 18 data were selected and plotted in various forms, one of which was the same as that used by themultifactor interaction equation in PROMISS and PROMISC.
In order to calibrate the multifactor interaction equation for INCONEL 7 18, appropriate values for final and reference quantities are selected. For example, for INCONEL 718 the melting temperature is TM = 2369 "F. Hence Equation (8), for INCONEL 7 18, becomes
The final and reference quantities given in Equation (9) become model parameters or constraints for the multifactor interaction equation when modified for INCONEL 71 8. Figure 2 illustrates these model parameters graphically wherein each axis represents an effect or primitive variable. Note also an additional constraint in Figure 2, namely the creep threshold temperature, TC = 900 "F. Although this constraint is not explicitly built into the multifactor interaction equation, it may be taken into account indirectly. This is accomplished by not including the creep effect whenever current value of temperature, T, is below 900 O F . Note that the empirical material parameters, q, t and v must be determined from actual experimental data.
Figures 3 and 4 plot data that indicate the effect of temperature on yield strength for INCONEL 718. Figure 3 is the raw data and Figure 4 shows the data in the same form as that used in the multifactor interaction equation. As expected, the yield strength of the material decreases as the temperature increases. Figures 5 and 6 display data for the effect of mechanical fatigue cycles on fatigue strength for INCONEL 7 18 given a set testing temperature. As expected, the fatigue strength of the material decreases as the number of cycles increases. Figures 7 and 8 show data for the effect of creep time on rupture strength
8

for INCONEL 718 given a set testing temperature. As expected, the rupture strength of the material decreases as the time increases.
TEMPERATURE ("F)
T,,-75
NO I N F
0 5 13 I b MECHANICAL FATIGUE (CYCLES)
CREEP (HOURS)
Fig. 2 Model Parameters for Inconel 7 18 for Temperature, Mechanical Fatigue and Creep.
A linear regression of the data for temperature (Fig.4), mechanical fatigue (Fig.6) and creep (Fig. 8) produces a fmt estimate of the empirical material constants for these effects, namely, q, t and v. Figures 9,lO and 1 1 show the results of linear regression and indicate values for the three material constants. Other statistical models other than linear regression might provide a better fit to the data. For example, two other models have been proposed: a fourth-order polynomial and a beta distribution. These both proved to be a better fit for the temperature data (Fig. 4) than a linear model. These two models together with comparisons with data are shown in Figures 12 and 13. To date it has not been determined whether these proposed models would fit the mechanical fatigue data or the creep data better than the linear model. A difficulty with each model is that they both significantly complicate the form of the multifactor interaction equation, perhaps without much gain for the overall objective, the prediction of lifetime strength under a number of diverse effects.
9

180000 1 140000 4 1
1 120000
100000
160000 -
140000 -
120000 -
100000 - \ 80000 1 I I I I
500 1000 1500 2000 0
T Fig. 3 Effect of Temperature (OF) on Yield Strength for Inconel 718.
(Linear Plot)
5.3
5.2
5.1
5.0
4.9 0.0 0.1 0.2 0.3 0.4 0.5
LOG (23 6 9- 7 5 ) / (23 6 9-T)
Fig. 4 Effect of Temperature (OF) on Yield Strength for Inconel 718. (Log Log Plot)
10
t
140000
120000 0 T=75"F A T=lOOO"F 0 Tr1200"F
60000 ,I. Oe+O 2 e + 7 4 e + 7 6 e + 7 8 e + 7 l e + 8
N Fig. 5 Effect of Mechanical Fatigue (Cycles) on Fatigue Strength for Inconel 718
(Linear Plot)
5.2 7
A
5 P,
IJ T=75"F A T=l000"F 0 T=1200"F
4.8 I I I I i
0 . 0 0 0 0 . 0 0 1 0 . 0 0 2 0 . 0 0 3 0 . 0 0 4 0 . 0 0 5
LOG (1 OA1 0-0 .5 ) / ( 10A10-N)
Fig. 6 Effect of Mechanical Fatigue (Cycles) on Fatigue Strength for Inconel 718. (Log Log Plot)
1 1

160000
140000
120000
100000
80000
60000
- T=100O0F
A T=120O0F
I I I I i
0 5 0 0 0 1 0 0 0 0 1 5 0 0 0 2 0 0 0 0 2 5 0 0 0
t Fig. 7 Effect of Creep Time (Hours) on Rupture Strength for Inconel 718.
(Linear Plot)
5.2 A
si 9
5.1 I I- Q z w I- v)
Lu K
0
5.0
2 4.9
s a a
4.8
4.7 0 .
1 I I I I I I 1
0 0 0 0 . 0 0 2 0 . 0 0 4 0 . 0 0 6 0 . 0 0 8 0 . 0 1 0 LOG (10"6-1.0)/(10A6-t)
Fig. 8 Effect of Creep Time (Hours) on Rupture Strength for Inconel 7 18. (Log Log Plot)
12

r 5.2 G z W U F v) 5.1
4.9 ! I I I I I
0 . 0 0 . 1 0 . 2 0 . 3 0 . 4 0 . 5
Fig. 9 Effect of Temperature (OF) on Yield Strength for Inconel 718. (Log Log Plot with Linear Regression)
LOG (23 69-75)/( 2369-T)
5.2 n w P,
E 5.1 b 2 W U
8 4.9 2
I 1- y = 5.0349 - 19.954~ (75°F)
1
1 v = 5.0139 - 14.342~ I
\
A 0
y = 4.9778 - 28.072~ 4.8 ! I I I I I
0 . 0 0 0 0 . 0 0 1 0 . 0 0 2 0 . 0 0 3 0 . 0 0 4 0 . 0 0 5
T=75"F T=lOOO"F T=l20OoF
(1 000" F)
LOG (1 0 "1 0-0.5)/( 10 "1 0-N)
Fig. 10 Effect of Mechanical Fatigue (Cycles) on Fatigue Strength for Inconel 718. (Log Log Plot with Linear Regression)
(1 200°F)
13

u)
I t-
W K t- u) W K 3 c 0 3
8 0
3
P
a
A
Fig. 11
5.2
5.1
5.0
4.9
4.0
4.7 0 .
A T=lWO°F O T=1200°F
0 0 0 0 . 0 0 2 0 . 0 0 4 0 . 0 0 6 0 . 0 0 8 0 . 0 1 0 LOG (10A6-1 .0)/(10A6-t)
Effect of Creep Time (Hours) on Rupture Strength for Inconel 7 18. (Log Loa Plot with Linear Remession)
14

J
5.00 I I I ' I I I I
0 . 0 0 0 . 0 5 0 . 1 0 0 . 1 5 0 . 2 0 0 . 2 5 0.30 0 . 3 5 0 . 4 0 0 . 4 5
LO g ( 2 3 6 9-75) /( 2 3 69-T)
Hot-rolled Round Annealed at 1950°F
To = 75"F, TM = 2369°F
Fig. 12 Effect of Temperature (OF) on Yield Strength for Inconel 718: Comparison of Linear and Beta Models with Actual Data.

5.18 - Actual Data A BetaModel 0 Polynomial Model
5.14 -
5.10 -
5.06 -
5.02 - 0
4.98 I I I I I I I I 1
0 . 0 0 0 . 0 5 0 . 1 0 0 . 1 5 0 . 2 0 0 . 2 5 0 . 3 0 0 . 3 5 0 . 4 0 0 . 4 5
L O g ( 2 3 69-75)/( 2 3 69-T)
Fig. 13 Effect of Temperature (OF) on Yield Strength for Inconel 7 18: Comparison of Beta and Polynomial Models with Actual Data.
16
5.0 PROBABILISTIC LIFETIME STRENGTH SENSITIVITY STUDY
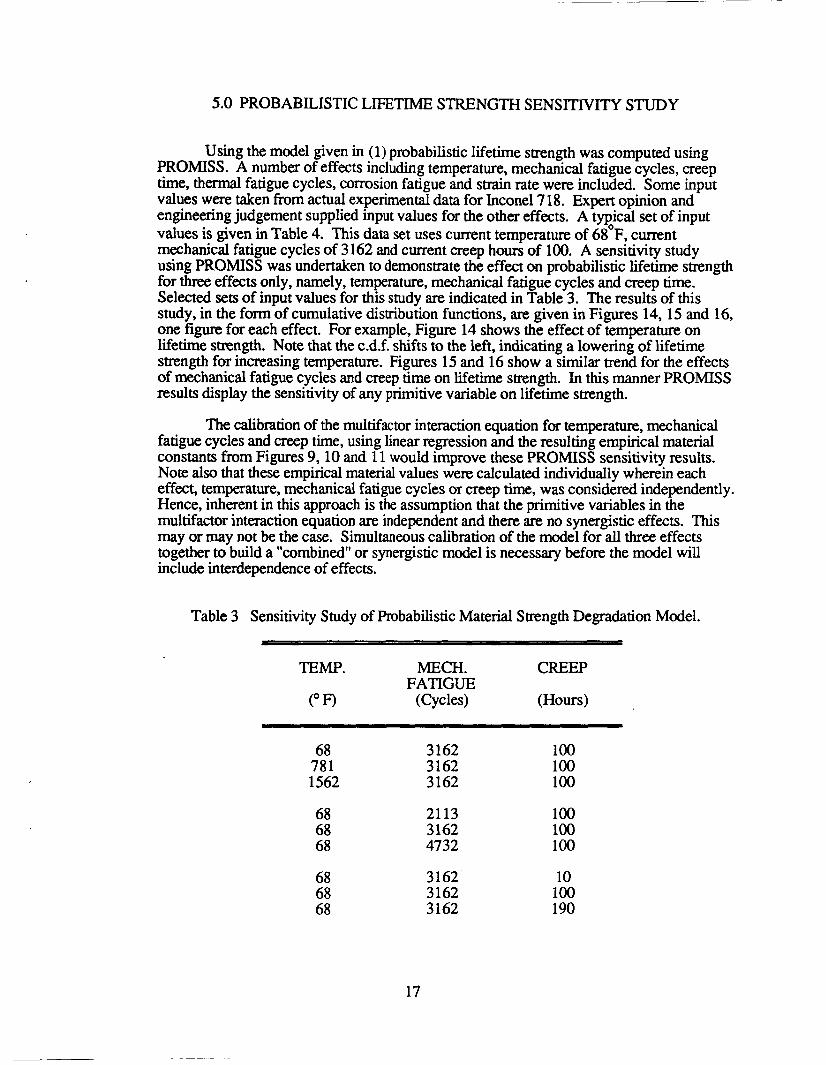
Using the model given in (1) probabilistic lifetime strength was computed using PROMISS. A number of effects including temperature, mechanical fatigue cycles, creep time, thermal fatigue cycles, corrosion fatigue and strain rate were included. Some input values were taken from actual experimental data for Inconel 718. Expert opinion and engineering judgement supplied input values for the other effects. A typical set of input values is given in Table 4. This data set uses current temperature of 68'F, current mechanical fatigue cycles of 3 162 and current creep hours of 100. A sensitivity study using PROMISS was undertaken to demonstrate the effect on probabilistic lifetime strength for three effects only, namely, temperature, mechanical fatigue cycles and creep time. Selected sets of input values for this study are indicated in Table 3. The results of this study, in the farm of cumulative distribution functions, are given in Figures 14,15 and 16, one figure for each effect. For example, Figure 14 shows the effect of temperature on lifetime strength. Note that the c.d.f. shifts to the left, indicating a lowering of lifetime strength for increasing temperature. Figures 15 and 16 show a similar trend for the effects of mechanical fatigue cycles and creep time on lifetime strength. In this manner PROMISS results display the sensitivity of any primitive variable on lifetime strength.
The calibration of the multifactor interaction equation for temperature, mechanical fatigue cycles and creep time, using linear regression and the resulting empirical material constants from Figures 9,10 and 11 would improve these PROMISS sensitivity results. Note also that these empirical material values were calculated individually wherein each effect, temperature, mechanical fatigue cycles or creep time, was considered independently. Hence, inherent in this approach is the assumption that the primitive variables in the multifactor interaction equation are independent and there are no synergistic effects. This may or may not be the case. Simultaneous calibration of the model for all three effects together to build a "combined" or synergistic model is necessary before the model will include interdependence of effects.
Table 3 Sensitivity Study of Probabilistic Material Strength Degradation Model.
TEMP. MECH. CREEP FATIGUE
(" F) (Cycles) (Hours)
68 78 1 1562
68 68 68
68 68 68
3162 3162 3162
21 13 3162 4732
3162 3162 3162
100 100 100
100 100 100
10 100 190
17

Table 4 Typical PROMISS "Fixed" Model Input Values.
Effect or Variable Units Distribution Mean Standard Deviation Primitive Variable Symbol Type (Value)(% of Mean)
Mean Stress
Temperature
Chemical Reaction
Stress due to Impact
Mechanical Fatigue
Thermal Fatigue
C E P
SSF OS os0 P
TF T TO 9
RF R Ro r
SDF OD mo
NMF NM
S
NMO t
NTF NT NTO U
tCF tc tc0 V
ksi ksi ksi NIA
OF OF OF
NIA
NIA NIA NIA NIA
N/A NIA N/A NIA
log of cycle log of cycle log of cycle
log of cycle log of cycle log of cycle
N/A
hours hours hours NIA
NIA
Lognormal 130.0 6.5 5.0 Lognormal 90.0 4.5 5.0 Lognormal -2.9 -0.145 5.0
Normal 0.5 0.015 3.0
Normal 2732.0 82.0 3.0 Normal 68.0 2.0 3.0 Normal 68.0 2.0 3.0 Normal 0.5 0.0 15 3.0
Normal 1 .o 0.003 0.3 Normal 0.02 0.0006 3.0 Normal 0.001 0.00003 3.0 Normal 0.5 0.015 3.0
Normal 1 .o 0.003 0.3 Normal 0.1 0.003 3.0 Normal 0.001 0.00003 3.0 Normal - 0.5 - 0.015 3.0
Lognormal 7.0 0.7 10.0 Lognormal 3.5 0.35 10.0 Logn0lllM.l 1 .o 0.1 10.0
Normal 0.5 0.015 3.0
LognOMlal 3.0 0.3 10.0 Lognormal 2.3 0.23 10.0 Lognormal 1 .o 0.1 10.0
Normal 0.5 0.0 15 3.0
Lognormal 10,000.0 500.0 5.0 Lognormal 100.0 3.0 3.0 Lognormal 0.083 0.0025 3.0
Normal 0.5 0.015 3 .O

d-
a- l l
W L L
- Y
cn cv 0
d- c\l 0
cn - 0
0 v, \ v,
i
r I- c3 Z w rr l- v,
19
0, N 0
r\ N 0
Lo N 0
r3 N 0
0 cn \ v>
c3 [1L Q I r I- c3 Z w
0
20

LL 0
d-
~
0-
21

6.0 REFERENCES
1. Chamis, C. C., "Simplified Composite Micromechanics Equations for Strength, Fracture Toughness, Impact Resistance and Environmental Effects," NASA TM 83696, Jan., 1984.
2. Hopkins, D. A., "Nonlinear Analysis for High-Temperature Multilayered Fiber Composite Structures," NASA TM 83754, Aug. 1984.
3. Chamis, C. C. and Hopkins, D., "Therrnoviscoplastic Nonlinear Constitutive Relationships for Structural Analysis of High Temperature Metal Matrix Composites," NASA TM 87291, Nov. 1985.
4. Hopkins, D. and Chamis, C. C., "A Unique Set of Micromechanics Equations for High Temperature Metal Matrix Composites," NASA TM 87154, Nov. 1985.
5 . Boyce, L. and Chamis, C. C., "Probabilistic Constitutive Relationships for Material Strength Degradation Models," Pocee-s of the 30th Structures. S-1 Dv n i am cs jmd Mat& Conference Mobile, AL, April, 1989, pp. 1832 - 1839.
6. Probabilistic Lifetime Strength of Aerospace Materials Via Computational Simulation by L. Boyce, J. Keating, T. Lovelace, and C. Bast, Final Technical Report, NASA Grant NAG 3-867, Phase 2, Division of Engineering Report UTSA 90-1DOE-90-1, The University of Texas at San Antonio, January, 1990.
. . 7. Wiley, New York, 1987, p. 278.
8.
238.
Ross, S. M., btroduction to Probability and -s for Engineers - and Sc ien ti sts,
Siddall, J. N., "A Comparison of Several Methods of Probabilistic Modeling," edinps of the Co-rs in EnPDeenne - Conference, ASME, Vol. 4,1982, pp. 231-
9. Theoretic Techniques," NASA CR- 147763, April, 1976.
Scott, D.W., "Nonparametric Probability Density Estimation by Optimization
10. Probabilistic Lifetime Strength of Aerospace Materials Via Computational Simulation by L. Boyce, J. Keating, T. Lovelace, and C. Bast, Final Technical Report, NASA Grant NAG 3-687, Phase 2, Division of Engineering Report UTSA 90-1DOE-90-1, The University of Texas at San Antonio, January, 1990.
22
REPORT DOCUMENTATION PAGE
National Aeronautics and Space Administration Lewis Research Center Cleveland, Ohio 44135- 3191
Form Approved OMB NO. 0704-0188
NASA CR - 187234
I. AGENCY USE ONLY (Leave blank) 2. REPORT DATE March 1992
I
11. SUPPLEMENTARY NOTES
Project Manager, C.C. Chamis, Structures Division, NASA Lewis Research Center, (216) 433 - 3252.
3. REPORT TYPE AND DATES COVERED Final Contractor Report
12b. DISTRIBUTION CODE I 12a. DlSTRIBUTION/AVAILABILITY STATEMENT
Unclassified -Unlimited Subject Category 39
I. TITLE AND SUBTITLE Computational Simulation of Coupled Material Degradation Processes for Probabilistic Lifetime Strength of Aerospace Materials
5. AUTHOR(S)
Lola Boyce and Callie C. Bast
7. PERFORMING ORGANIZATION NAME(S) AND ADDRESS(ES)
University of Texas at San Antonio The Division of Engineering San Antonio, Texas 78285
9. SPONSORING/MONITORING AGENCY NAMES(S) AND ADDRESS(ES)
I
13. ABSTRACT (Maximum 200 words)
This report presents the results of a third year effort of a research program conducted for NASA-LeRC by The University of Texas at San Antonio (UTSA). The research included on-going development of methodology that provides probabilistic lifetime strength of aerospace materials via computational simulation. A probabilistic material strength degradation model, in the form of a randomized multifactor interaction equation, is postulated for strength degradation of structural components of aerospace propulsion systems subjected to a number of effects or primitive variables. These primitive variables may include high temperature, fatigue or creep. In most cases, strength is reduced as a result of the action of a variable. This multifactor interaction strength degradation equation has been randomized and is included in the computer program, PROMISS. Also included in the research is the development of methodology to calibrate the above-described multifactor interaction equation using actual experimental materials data together with linear regression of that data, thereby predicting values for the empirical material constants for each effect or primitive variable. This regression methodology is included in the computer program, PROMISC. Actual experimental materials data were obtained from the open literature for materials typically of interest for aerospace propulsion system components. Material data for Inconel 7 18 has been analyzed using the development methodology.
5. FUNDING NUMBERS
WU- 505 - 63 - 5B G - NAG3 - 867
8. PERFORMING ORGANIZATION REPORT NUMBER
None
10. SPONSORING/MONITORING AGENCY REPORT NUMBER
14. SUBJECT TERMS Probabilistic material strength degradation; Lifetime strength; Combined high- temperature fatigue and creep; Nickel-base superalloy
17. SECURITY CLASSIFICATION 18. SECURITY CLASSIFICATION 19. SECURITY CLASSIFICATION OF REPORT OF THIS PAGE OF ABSTRACT
Unclassified Unclassified Unclassified
15. NUMBER OF PAGES 28
A03 16. PRICE CODE
20. LIMITATION OF ABSTRACT