computationally efficient and accurate enantioselectivity modeling by clusters of molecular dynamics...
TRANSCRIPT

Computationally Efficient and Accurate Enantioselectivity Modelingby Clusters of Molecular Dynamics SimulationsHein J. Wijma,† Siewert J. Marrink,†,‡ and Dick B. Janssen*,†
† Groningen Biomolecular Sciences and Biotechnology Institute, University of Groningen, Nijenborgh 4, 9747 AG Groningen, TheNetherlands‡ Zernike Institute for Advanced Materials, University of Groningen, 9747 AG Groningen, The Netherlands
*S Supporting Information
ABSTRACT: Computational approaches could decrease the need for the laborious high-throughput experimental screening thatis often required to improve enzymes by mutagenesis. Here, we report that using multiple short molecular dynamics (MD)simulations makes it possible to accurately model enantioselectivity for large numbers of enzyme−substrate combinations at lowcomputational costs. We chose four different haloalkane dehalogenases as model systems because of the availability of a large setof experimental data on the enantioselective conversion of 45 different substrates. To model the enantioselectivity, we quantifiedthe frequency of occurrence of catalytically productive conformations (near attack conformations) for pairs of enantiomersduring MD simulations. We found that the angle of nucleophilic attack that leads to carbon−halogen bond cleavage was a criticalvariable that limited the occurrence of productive conformations; enantiomers for which this angle reached values close to 180°were preferentially converted. A cluster of 20−40 very short (10 ps) MD simulations allowed adequate conformational samplingand resulted in much better agreement to experimental enantioselectivities than single long MD simulations (22 ns), while thecomputational costs were 50−100 fold lower. With single long MD simulations, the dynamics of enzyme−substrate complexesremained confined to a conformational subspace that rarely changed significantly, whereas with multiple short MD simulations alarger diversity of conformations of enzyme−substrate complexes was observed.
■ INTRODUCTION
Enzymes can provide excellent regioselective and stereo-selective catalysis and thereby produce enantiopure precursorsfor the synthesis of pharmaceuticals or other fine chemicals.1,2
For such enzyme-catalyzed processes to be economicallyfeasible, the enzyme should be sufficiently stable,1−6 catalyti-cally active, and stereoselective2,7−10 with the target substrate.In many cases, protein engineering can be used to improve thestereoselectivity or substrate scope of an existing enzyme.11−16
However, often tens of thousands of mutant variants need to beexperimentally screened to obtain sufficiently improvedvariants.9,17−19 Such high-throughput screening is costly andtime consuming. Therefore, a key challenge2 in proteinengineering is the development of computational methodsthat are able to accurately predict20−24 the substrate specificityand enantioselectivity of large numbers of enzyme variantswithout requiring such an amount of computational resources
that experiments remain faster or cheaper. The availability ofsuch in silico screening methods would decrease the need forexperimental screening and thereby decrease costs whilespeeding up the engineering of improved enzyme variants.A useful method to explain and predict the catalytic rates of
enzymes is to monitor a series of distances and angles betweenthe substrate and catalytically important atoms in the enzymeactive site during a molecular dynamics (MD) simulation.25−31
By such an analysis of both well and poorly converted enzymesubstrates, it typically turns out that the best convertedsubstrates are bound more often in a catalytically productiveorientation. The latter can be quantified, for example, bycomputing an average distance between two reacting atoms,which is observed to be larger for the unproductively bound
Received: February 27, 2014
Article
pubs.acs.org/jcim
© XXXX American Chemical Society A dx.doi.org/10.1021/ci500126x | J. Chem. Inf. Model. XXXX, XXX, XXX−XXX

nonconverted substrates than for the productively boundsubstrates that are well converted.25−30
A similar but theoretically more justified method is the nearattack conformation (NAC) approach.32−36 The NAC isnormally defined as a conformation having angles betweenthe reacting atoms within 20° of those in the quantummechanically modeled transition state and distances betweenthe reacting atoms of less than the sum of their van der Waalsradii.32,37 Because NACs are conformations that are close to thetransition state of the reaction, the enzyme−substrate complexnecessarily must go through these conformations for a reactionto occur.32,37 There is some disagreement about whether anenzyme stabilizes the transition state of a reaction by bindingthe substrate selectively in a NAC38 or whether the highfrequencies of NACs found during MD simulations ofenzyme−substrate complexes are a side effect of transitionstate stabilization through a different mechanism, for example,electrostatic preorganization.39,40 This difference in opinion isirrelevant for the modeling described below because in bothinterpretations a high frequency of NACs occurring among theconformations sampled by an MD simulation corresponds to ahigh reaction rate of the enzyme−substrate complex.An important challenge for in silico screening of catalytic
activity is the sampling and time scale problem in enzyme MDsimulations. With existing computer facilities, MD simulationsare mostly limited to the nanosecond and microsecond timescale,41 while enzyme catalytic cycles occur on a time scale ofmilliseconds to seconds. Because conformational changes inenzymes occur on similarly long time scales, longer MDsimulations give a more representative sampling of catalyticallyproductive and unproductive conformations of the enzyme−substrate complex. However, if it is necessary to analyze tens ofthousands of enzyme variants, long MD simulations would betoo computationally expensive to compete with experimentalscreening.A different approach that can lead to a more complete
sampling of protein conformational space is to carry outmultiple short MD simulations that start with the same three-dimensional protein structure but with different random initialatom velocities42−44 or with a different water spheresurrounding the protein.45 The resulting MD simulations areobserved to sample different regions of conformational spacewhile during a single MD simulation a jump from oneconformational subspace (around a local minimum in theconformational landscape) to another region in conformationalspace rarely occurs because the energy barrier for such atransition is high.42−44 Therefore, by using several shorter MDsimulations, a larger conformational space of a protein can besampled than during a single long MD simulation that takesequal computational resources.42−44 Such potentially moreeffective MD approaches are rarely explored for enzymes; singlelong MD simulations are commonly used.25−37,46 The use of upto five independent long MD simulations (5−10 ns) instead ofone long MD simulation was reported for P450 enzymes, whichhave high flexibility and thus may adopt quite diverseconformations.23,47 A quantitative analysis of the extent towhich the sampling of enzyme−substrate complexes can beimproved by independent MD simulations has not beenreported.In the work described here, we systematically investigated the
differences in conformational sampling of enzyme−substratecomplexes using single long simulations versus multiple shorterMD simulations. Enantioselectivity (E) was selected as the
catalytic property that had to be reproduced by the MDsimulations. With an achiral catalyst, the energy barrier forreaction of either enantiomer of the substrate is the same. Thus,in an enantioselective enzyme, the difference in reactivitybetween the substrate enantiomers is determined solely by theirinteractions with the chiral active site. This makes enantiose-lectivity prediction ideal for testing how completely the MDsimulations sample the possible conformations of the enzyme−substrate complexes.Haloalkane dehalogenases were selected as the model system
because a large set of experimental data on enantioselectiveconversion of structurally diverse substrates (Figures 1 and 2) is
available.48−50 Haloalkane dehalogenases also have potentialbiotechnological relevance because they may catalyze thekinetic resolution of racemic mixtures to produce enantiopurecompounds.51 The four haloalkane dehalogenases for whichboth an X-ray structure and experimental data on enantiose-lectivity have been reported are DhlA from Xanthobacterautotrophicus,52 DhaA from Rhodococcus rhodochrous,53 DbjAfrom Bradyrhizobium japonicum,54 and LinB from Sphingomonaspaucimobilis.55 Data on enantioselectivity and conversion ratesare available for 45 substrates of these enzymes. This includesover 80 different combinations of enzyme and racemic orprochiral substrate, with E varying from 1 to >200. For 32 ofthese enzyme−substrate combinations, it has experimentallybeen determined which enantiomer is preferentially converted.The other combinations, for which it is unknown whichenantiomer is preferentially converted, are still useful fordetecting undersampling of catalytically productive conforma-tions during the MD simulations (see the Materials andMethods section).Mechanistically, all these dehalogenases operate by nucleo-
philic attack of an aspartate carboxyl oxygen atom on thehalogenated carbon atom of the substrate, with the halogenacting as a leaving group (step 2 with rate k2 in Scheme 1).56,57
The resulting alkyl-enzyme intermediate is hydrolyzed by attackof a water molecule (with rate k3, Scheme 1) on the carbonylcarbon of the ester group. It has been proposed that the initialnucleophilic attack is most important for the enantioselectivity,with the substrate enantiomer that undergoes nucleophilicattack faster being preferentially converted.50 Therefore, thisstep was modeled to predict E for all substrates.We show here that the enantioselectivities calculated from
the ratio of NACs observed during MD simulations with the(R) and (S) substrates agree well with the experimental resultsfor all four dehalogenases, if at least 20 short MD simulationsare used. Such a cluster of short MD simulations providedmuch better sampling of conformations than a single longerMD simulation. The computational costs of 20−40 of suchshort MD simulations are low enough to enable high-throughput in silico screening of enzyme variants. We alsoinvestigated the source of enantioselectivity in dehalogenases,which is currently under debate.48,50
Figure 1. Example of an enantioselective conversion by adehalogenase.
Journal of Chemical Information and Modeling Article
dx.doi.org/10.1021/ci500126x | J. Chem. Inf. Model. XXXX, XXX, XXX−XXXB

■ MATERIALS AND METHODSEnzymes, Substrates, and Docking. The following PDB
files were selected for simulations: 1MJ558 (LinB, resolution0.95 Å), 1BN659 (DhaA, 1.50 Å), 3A2M50 (DbjA, 1.84 Å), and1B6G60 (DhlA, 1.15 Å). DbjA was simulated as its physicallyrelevant dimer.61 Protonation states of the Asp, Glu, His, Lys,Tyr, and Cys residues at pH 8, the typical buffer pH for activityassays, were initially predicted with Yasara (www.yasara.org).62
Subsequently, all these protonation states were visuallyinspected and if needed corrected. All water molecules presentin the X-ray structure were preserved with the exception ofwater molecules in the active site that could prevent the bindingof the substrate. Because the DhaA variant for whichenantioselectivity had been determined differs by threemutations from the DhaA of which the X-ray structure isavailable (V172A/I209L/G222A), the structure of DhaA wasmodeled based on 1BN6 as described elsewhere.15 A set ofvariants of LinB63 that differed in catalytic activity for substrate47 were modeled similarly64 based on 1MJ5.To prepare the structures of the 92 substrates [Figure 2, 45 ×
2 (pro)-chiral substrates and 2 achiral substrates] for dockingand subsequent MD simulations, a semiautomated procedurewas applied. With Chem3D (CambridgeSoft Corporation), athree-dimensional structure of the substrates was created. A
script under Yasara automatically carried out a geometryoptimization with semiempirical (AM1) quantum mechanics65
with implicit solvation. Partial charges for docking and MDsimulations were calculated with the AM1-BCC method,66
which results in an accuracy similar to the RESP procedure at afraction of the computational cost. If multiple halogens werepresent in the substrate, the correct leaving group halogen wasset manually. Docking was carried out with Autodock 467 with9990 separate docking runs of 25,000 energy evaluations each;these parameters made it possible to obtain a larger number ofthe substrates (Figure 2) in a NAC or close to a NAC thanparameters that we used earlier.48 For example, with thesedocking parameters, the known substrate 38 could be bound ina catalytically productive conformation, while with the earlierparameters, both enantiomers of substrate 38 were docked withtheir epoxide oxygen placed between Asn and Trp (Scheme 2),a position where the halogen atom of the substrate should belocated for catalysis to proceed. After docking, for everysubstrate enantiomer, a favorable orientation for catalysis wasautomatically selected for MD simulation based on a geometricranking of the 9,990 different docked orientations. If one ormore substrate orientations had been docked in a NAC(defined in the caption of Scheme 2), the one that had thelowest score D ≡ 2d1 + d2 + d3 (Scheme 2) was selected.Otherwise, simply, the conformation with the lowest D wasselected. This protocol does not force substrates to dock into acatalytically productive orientation but merely selects from alldocked orientations the pose that is most suitable for catalysis.
MD Simulations. The MD simulations were executed andanalyzed automatically. A home-scripted protocol carried outthe setup of the simulation box, pressure and temperaturecontrol, collection of geometric data during the MD simulation,and conversion of raw data to results (e.g., NAC percentages,average angles). The docked enzyme−substrate complexes
Figure 2. Dehalogenase substrates examined in this study. Substrates 1−26 and 31−45 are chiral. Substrates 7−10 and 13 occur as diastereomers.Substrates 27−30 are prochiral and product chirality depends on the orientation in which the substrate is bound during nucleophilic attack.Substrates 46−47 remain achiral upon conversion. If nonequivalent halogen atoms are present in the substrate, the leaving group halogen isunderlined.
Scheme 1. General Catalytic Scheme for a Dehalogenasea
aE is the enzyme. R-X is the halogenated substrate. E.R-X is theenzyme−substrate complex. E-R.X− is the covalent alkyl-enzymeintermediate with halide bound. R−OH is the produced alcohol.
Journal of Chemical Information and Modeling Article
dx.doi.org/10.1021/ci500126x | J. Chem. Inf. Model. XXXX, XXX, XXX−XXXC

were positioned in a rectangular simulation cell with distancesbetween the protein and the periodic boundaries of at least 7.5Å. Water (TIP3P) and salt ions to neutralize the cell andprovide ionic strength (NaCl 0.5%) were positioned by Yasara,with modifications made in an automated script to prevent saltions and newly added water molecules from being positionedinside the enzyme while water molecules from the X-raystructures were all preserved. Prior to the MD simulations, anenergy minimization was carried out as described elsewhere48
to remove steric clashes and conformational stress. The MDsimulations were run under Yasara with a leapfrog integrationscheme and a Berendsen thermostat68,69 under pressurecontrol. Hydrogen atoms were constrained with LINCS70 andSETTLE71 algorithms. The time step was 1.33 fs with thenonbonded interactions list updated every three time steps.Long range (>7.86 Å) electrostatic interactions were calculatedwith a particle mesh Ewald algorithm with fourth degree B-spline functions.72 The force field for the simulations wasAmber ff0373 or Yamber3.68 Unless specifically mentionedotherwise in the text, the results are those with Yamber3.To carry out multiple independent MD simulations per
enzyme−substrate complex, simulations were started withdifferent initial atom velocities according to a Maxwell−Boltzmann distribution.42 At the start of the longer MDsimulations, the temperature was gradually increased from 5 to298 K during 30 ps, after which the simulation was allowed toequilibrate for 1970 ps before the production phase simulationof 5000 or 20,000 ps. Thus, the total simulation time of thesingle trajectories was 7 or 22 ns. For the shorter MDsimulations, the system was gradually heated during 3 ps andallowed to equilibrate for 2 ps (the temperature equilibrated inthis time frame), while the production phase was 5 ps,amounting to a total of 10 ps simulation time. To analyzeRMSD, RMSF, and energy, snapshots were obtained every 25ps for the longer MD simulations. The three distances (d) andthree angles (θ) depicted in Scheme 2 were sampled on the flyevery 100 fs for the long MD simulations and every 20 fs forthe short MD simulations.
Enantioselectivity Modeling. On the basis of the generalcatalytic cycle of dehalogenases (Scheme 1), it can be derivedusing standard methods48,74 that eqs 1−5 apply. In theseequations, Kd is the dissociation constant of the substrate, kcat isthe catalytic rate at saturating substrate concentrations, KM isthe Michaelis constant, P and D superscripts denote thepreferred and disfavored enantiomers, and k1 to k3 are the ratesdepicted in Scheme 1. Equation 6 follows from eq 4 and 5 if Kdis equal for both enantiomers. Enantioselectivity for substrateswas predicted with eq 7, in which [NAC] is the percentage ofNACs observed during MD simulation of the enzyme−substrate complex. As further evaluated in the discussion, eq7 was derived assuming that Kd is approximately equal for thedifferent enantiomers (eq 6) and that the relative rate of step k2is modeled satisfactory by the NAC approach. The highestexperimental enantioselectivities were reported48−50 as >200,which reflects that conversion of the disfavored enantiomer wasnot detectable. Therefore, if the calculated [NAC]P/[NAC]D
exceeded 200, it was rounded down to 200 to enablecomparison to experimental results. Predictions of E wereconsidered to be correct within error if the predicted valuesreproduced the experimental results within a factor 10 (seeDiscussion for a justification of this error margin). To assesswhich fraction of the E predictions were correct, we used datafor substrates for which it is experimentally clear whichenantiomer is preferentially converted as well as data forsubstrates for which the E was close to one (i.e., ≤ 1.5).Substrates for which it is unclear which enantiomer ispreferentially converted were only used to test for falsenegatives (see below).
=+
kk k
k kcat2 3
2 3 (1)
= ×+
K Kk
k kM d3
2 3 (2)
= −Kkkd
1
1 (3)
=k KkK
/cat M2
d (4)
=Ek Kk K
//
catP
MP
catD
MD
(5)
=Ekk
2P
2D
(6)
=E[NAC][NAC]
predictedP
D (7)
It was also evaluated which fraction of the substrateenantiomers in the data set are known to be experimentallyconverted, whereas the MD simulations did not producecatalytically productive orientations. Such false negative resultscan be caused by insufficient sampling of the conformationalspace of the enzyme−substrate complex. Two criteria wereused to quantify such false negatives. If not a single NAC wasfound during MD simulations of an enzyme complexed with itsknown preferred substrate enantiomer, this combination was afalse negative. Furthermore, the absence of NACs during MD
Scheme 2. Geometric Criteria for Catalytically ProductiveConformationsa
aThe enzyme−substrate complex was defined to be in a NAC when allgeometric criteria were simultaneously met (d1 < 3.41 Å, d2 < 3.50 Å,d3 < 3.50 Å, θ1> 157°, θ2 > 120°, θ3 > 120°). The criteria weredescribed previously.34−36,48 Throughout this work, these geometrieswere never imposed as constraints; it was merely monitored whetherNAC conformations were present. Residue numbers correspond toDhaA. For LinB, the corresponding residues are, respectively, Asn38,Asp108, and Trp109; for DbjA, they are Asn38, Asp103, and Trp104;for DhlA, they are Trp175, Asp124, and Trp125.
Journal of Chemical Information and Modeling Article
dx.doi.org/10.1021/ci500126x | J. Chem. Inf. Model. XXXX, XXX, XXX−XXXD

simulation for either the (R) or the (S) enantiomer wasclassified as a false negative if that substrate was converted withan E ≤ 10. Such a low enantioselectivity implies that theenzyme converts both substrate enantiomers.
■ RESULTS
Long Single MD Simulations versus Shorter MultipleMD Simulations. Enantioselectivities were modeled by MDsimulations of enzyme−substrate complexes that were obtainedby docking substrates into the dehalogenase X-ray structures.Using geometric filters, the catalytically most productive posesfrom 9990 docking runs per substrate enantiomer wereselected. Due to this large number of dockings per substrate,it was possible to find also rare substrate orientations. In thismanner, we obtained potentially catalytically productive posesfor the large majority of the substrates, even for many substrateenantiomers that are poorly converted when tested exper-imentally (Tables S1−S4, Supporting Information). Of the 175enzyme−substrate complexes selected for subsequent MDsimulation, 156 were found to satisfy the narrow geometriclimits of a NAC (89%). It was concluded that hand-dockingwas not required to start the MD simulations with catalyticallyrelevant substrate orientations.Initially, single long MD simulations (22 ns) were carried out
for 38 complexes of LinB with different substrate enantiomers(Table 1) and 46 complexes of DhaA with differentenantiomers (DhlA and DbjA were addressed later because ofthe computational expense, see below). The resultingpredictions for E, calculated from the ratio of NACs for apair of enantiomers during the MD simulation (eq 7), agreedwith experimental data for the majority of the enzyme−substrate combinations (Table 2). However, 20% of the single
long MD simulations produced false negatives, i.e., trajectoriesin which no NACs were observed even though a substrateenantiomer is known to be converted from experimental data.Such cases gave a wrongly predicted very high (>200) or a verylow E (see Table 1 for examples), which negatively influencedthe correlation between predictions and experiments.It was investigated whether the false negatives were due to
undersampling of substrate conformations and if additionalsimulations would sample different regions of conformationalspace. Specifically, two additional 7 ns MD simulations werestarted with the same structure but with a different set of initialatom velocities, which were generated using different randomnumber seeds (seed B and seed C; seed A was the first 7 ns ofthe original 22 ns MD simulation). For individual enzyme−
Table 1. Results of a Single Long and 40 Short MD Simulations for Modeling Enantioselectivity of LinBa
aThe predicted E was calculated from [NAC-(R)]/[NAC-(S)]. NP: No prediction possible because no NACs were observed for both the (R) and(S) enantiomer of the substrate. If the preferred enantiomer was unknown, it was assumed to be the (R) enantiomer for calculation of the predictedE. Gray backgrounds reveal which modeling results are in disagreement with experimental results, either because Epredicted is incorrect or because offalse negative results (see Materials and Methods for criteria).
Table 2. Agreement between Experimentally Obtained andModeled Results for Different Sampling Regimesa
predictions that (dis)agreewith experimental data
time regimeb
correct Eprediction
(%)
falsenegatives(%)
Pearson’s R2 correlation betweenexperimental and modeled E
1 × 22 ns 72 20 0.513 × 7 ns 78 13 0.5140 × 10 ps 67 14 0.93
aResults are those for the experimental data of LinB and DhaA withconverted substrates for which either E was equal to one or for whichthe preferred enantiomer was experimentally determined. The totalnumber of substrates for which this applied was 18 (see Tables S1 andS2, Supporting Information). bNumber of MD simulations perenzyme−substrate complex followed by the length of the individualsimulations.
Journal of Chemical Information and Modeling Article
dx.doi.org/10.1021/ci500126x | J. Chem. Inf. Model. XXXX, XXX, XXX−XXXE

substrate combinations, shortening simulations from 22 to 7 nshardly changed the observed fraction of NACs. The only twoexceptions were LinB with (S)-5 (4-fold increase, Table 3) andDhaA with (R)-15 (10-fold increase, Table S1, SupportingInformation). More importantly, the results showed that theassignment of different initial velocities can produce signifi-cantly different NAC frequencies during parallel simulations
and reduced the occurrence of false negatives when the resultswere averaged (Table 3, Table S1, Supporting Information).For example, for (R)-43, which is a known substrate of LinB, noNACs were observed with seed A for up to 22 ns, while for theother two seeds, NAC percentages of 9.8 and 8.4 were found(Table 1). The use of three shorter simulations decreased thepercentage of false negatives (from 20 to 13%) and producedbetter agreement with experimental data than the 22 nssimulation (Table 2, Figure 3A,B).
Table 3. Differences in Frequency of Catalytically RelevantOrientations during Nanosecond Time Scale MDSimulations of LinB Resulting from Different Set of InitialAtom Velocities
NACs in MD simulation (%)
seed A seed B seed C
substrate 20 ns 5 ns 5 ns 5 ns
examples with greater than 4-fold difference between 5 and 20 ns MDsimulationsa
(R)-2 0.03 0.04 0.28 0.02(S)-5 0.43 0.10 0.07 0.04(R)-15 0.00 0.00 0.44 0.94(S)-19 0.06 0.21 0.20 0.94(S)-20 0.07 0.15 1.31 1.71(R)-21 0.87 1.40 0.00 0.00(R)-22 0.05 0.18 0.00 0.00(S)-22 0.37 0.62 0.08 0.06(R)-31 1.95 4.84 2.72 0.02(R)-32 0.26 0.51 2.18 2.33(R)-35 0.00 0.00 0.00 0.09(R)-36 1.10 0.82 0.15 0.53(S)-36 0.12 0.35 0.69 0.40(R)-43 0.00 0.00 9.81 8.36(R)-45 0.00 0.00 0.07 0.00(S)-45 0.00 0.00 0.00 0.91all examples with less than 4-fold difference between 5 and 20 ns MD
simulations(R)-1 3.76 4.51 3.33 3.23(S)-1 0.08 0.04 0.11 0.05(S)-2 0.16 0.12 0.24 0.08(R)-3 1.99 1.59 1.65 2.05(S)-3 0.35 0.44 0.27 0.10(R)-5 1.84 4.60 7.27 6.69(R)-6 3.87 6.57 10.68 8.42(S)-6 0.62 0.62 0.34 0.33(R)-11 2.67 3.24 0.91 1.63(S)-11 0.00 0.00 0.01 0.00(S)-15 0.00 0.00 0.00 0.00(R)-19 0.07 0.15 0.13 0.02(R)-20 2.33 3.32 1.63 4.87(S)-21 0.00 0.00 0.00 0.00(S)-31 1.77 7.07 3.87 5.38(S)-32 8.01 10.34 2.45 15.71(S)-35 0.00 0.00 0.00 0.00(R)-38 0.00 0.00 0.00 0.00(S)-38 0.00 0.00 0.00 0.00(S)-43 2.07 2.55 2.72 7.76(proRS)-44 0.00 0.00 0.00 0.00(proSR)-44 0.00 0.00 0.00 0.00
aNAC percentages for the 5 ns MD simulations that differ more than afactor 4 from the result of the 20 ns MD simulation are indicated inbold. The abbreviation proRS stands for prochiral substrate in abinding mode that results in a (1R,2S) product. The tested substratesare known to be (enantioselectively) converted by LinB.
Figure 3. Improved correlation between predicted and experimentallydetermined E by switching from a single long simulation to multipleshorter MD simulations. Predicted values are for LinB and DhaA andobtained from a single 22 ns trajectory (A) or by averaging NAC ratiosfrom three 7 ns (B) or 40 10 ps simulations (C). The numbers in thegraph indicate the number of overlapping data points. The dashed lineis the fit. For further information, see Table 2.
Journal of Chemical Information and Modeling Article
dx.doi.org/10.1021/ci500126x | J. Chem. Inf. Model. XXXX, XXX, XXX−XXXF

We next examined what causes the differences betweentrajectories that share the same starting structure but areattributed with different sets of initial atom velocities. Structuralinspection revealed that different substrate orientations are
present after equilibration of the MD simulations (0−2 ns),which are subsequently maintained and cause differences in theoccurrence of NACs. For example, in the three independentsimulations of LinB with (R)-43 described above, whichexhibited rather different NAC frequencies, different substrateorientations were observed (Figure 4A). Thus, the additionalMD simulations improved the sampling of the conformationalspace accessed by the enzyme−substrate complexes.Multiple Ultrashort MD Simulations for Sampling
Near Attack Conformations. We next investigated whetherit was possible to further improve conformational sampling byusing larger numbers of MD simulations of only 10 ps. With 40of these independently initialized simulations per enzyme−substrate complex, a significantly better correlation (Table 2) toexperimental data (Figure 3C) was obtained than with 3 ordersof magnitude longer single (Figure 3A) or triple MDsimulations (Figure 3B). The correlation coefficients arerelatively high (0.51−0.93) because the highest experimentallydetermined enantioselectivities were reported as >200, whichwere rounded down to 200 to enable analysis (Table 2). Theimproved correlation obtained with a large number of veryshort MD simulations is due to better predictions for enzyme−substrate combinations with low enantioselecitivity (compareFigure 3A,B to C). The fraction of false negatives (14%) and
the fraction of E that were correctly predicted (67%) are withinerror equal to those obtained from a triple 7 ns MD simulation,but at much lower computational costs.
The quality of the predictions obtained by averaging NACfrequencies from different trajectories increased for up to atleast 20 different MD runs (Figure 5). This is due to a betteraveraging because individual simulations produced ratherdifferent NAC percentages (Table 4, Figure S1, SupportingInformation). The NAC percentages obtained from 40 MDsimulations appear to follow a multinomial distribution ratherthan a normal distribution (Figure S1, Supporting Informa-tion), which is in agreement with distinct conformations of theenzyme−substrate complex being sampled by the different MDsimulations. Inspection of the snapshots of individual 10 ps MDsimulations showed that the different NAC percentagescorresponded to different substrate orientations in the activesite (Figure 4B), as was also observed for the much longer 7 nsMD simulations (Figure 4A).This 40 × 10 ps MD simulation protocol was also tested for
the other two dehalogenases, DhlA and DbjA (Tables S4 andS5, Supporting Information). DbjA and DhlA are only distantlyrelated to LinB and DhaA (31−51% sequence identity) anddiffer in shape and size of their active sites.52−55 Also for these
Figure 4. Different substrate orientations observed in three MDsimulations of LinB with (R)-43 with different initial atom velocities.(A) Structures after 7 ns of MD simulation. (B) Structures after 5 ps ofMD simulation. Only the substrate and the catalytic residues areshown (see Figure 6 for other surrounding residues). Carbon atoms ingreen correspond to the starting structure, gray spheres correspond toseed A, light blue spheres correspond to seed B, and yellow spherescorrespond to seed C. The magenta sphere represents the leavinggroup halide, red spheres represent oxygen atoms, dark blue spheresshow nitrogen, and hydrogen atoms are in light gray.
Figure 5. Improved correlation between predictions and experimen-tally observed E obtained by increasing the number of MDsimulations. The results are for LinB and DhaA. The MD simulationswere 10 ps long. (A) Correct predictions (i.e., within factor 10 fromexperimental result) and false negative results (i.e., no NAC observedfor a converted substrate enantiomer). (B) Pearson’s R2 coefficientsfor the correlation between experimental and predicted E.
Journal of Chemical Information and Modeling Article
dx.doi.org/10.1021/ci500126x | J. Chem. Inf. Model. XXXX, XXX, XXX−XXXG

two enzymes the predicted and experimental E agreed well(78% correct predictions for 14 different pairs of enzyme−substrate enantiomers), and the fraction of false negatives wasvery low (4% of 50 enzyme−substrate complexes). Thecombined results for the four dehalogenases showed thatenantioselectivity predictions were correct for 72% of theenzyme−substrate combinations and the fraction of falsenegatives was 10%.One might have expected that for nonconverted substrates
MD simulations longer than 10 ps are required for observing
substrate escaping from a NAC in which it was initially docked.However, for the majority of the poorly converted substrateenantiomers that are docked in a NAC conformation at thestart the simulation (Tables S1−S4, Supporting Information),the ligand rapidly reorients during the initial 5 ps equilibration,and no NACs are adopted during the production phase of theMD simulation. This behavior was observed, for example, withDbjA complexed with (S)-1, (S)-2, (S)-6, (S)-34, and (S)-35(see Tables S1−S4, Supporting Information for moreexamples). Also, the opposite occurred, i.e., a substrateenantiomer that is preferentially converted by the enzymeadopted NACs during MD simulation, while the initialenzyme−substrate complex did not obey NAC criteria becausethe preceding docking step gave no substrate orientation in aNAC (e.g., for DbjA in complex with the well convertedsubstrate (R)-2, Table S5, Supporting Information). Thus, aconverted substrate can reorient itself during MD simulation toa pose more favorable for nucleophilic attack within 5 ps orremain in such a pose (Figure 6A). On the same time scale,nonconverted substrate enantiomers were observed to adoptnonproductive orientations even when its docked startingstructure was in a NAC (Figure 6B).To further investigate the conformational dynamics of
enzyme−substrate complexes, it was monitored how often
Table 4. Differences in Frequency of Catalytically RelevantOrientations Resulting from Different Sets of Initial AtomVelocities during Ultrashort (10 ps) MD Simulations ofLinB
NACs in MD simulation (%)
examples individual trajectories
substrate seed A seed B seed C seed D average of 40 trajectories
all examples greater than 4-fold difference with seed Aa
(R)-2 0 0 11.2 0 0.29(R)-3 4.0 3.6 9.6 0.8 5.53(S)-5 0.4 0.8 0.4 0 0.85(S)-6 0.8 0 0.4 0 1.77(R)-11 0 6.8 2.4 13.2 3.28(R)-15 0 0 0.8 0 0.12(S)-15 0 1.2 0 0 1.01(R)-19 0.4 1.2 3.6 0 1.95(S)-19 1.2 1.2 0 0.4 1.15(R)-21 0.8 1.6 0 0 0.68(S)-21 0.4 0 3.2 0 0.55(S)-22 0.8 3.6 0 0.8 1.23(R)-31 6.8 0 3.2 2.8 6.61(R)-32 0 0 0.8 7.6 3.47(S)-32 1.2 0 2.0 2.8 1.87(R)-35 19.6 3.2 8.4 14.0 8.00(S)-35 0 0.8 3.2 0 0.63(R)-36 0 0 1.2 2.8 0.62(S)-36 0 0 0.4 0.4 0.42(R)-43 58.4 6.0 0 0 9.36(S)-45 0 0 0.8 0.8 0.46
all examples less than 4-fold difference with seed A(R)-1 5.6 8.8 10.4 7.2 8.98(S)-1 0 0 0 0 0.08(S)-2 0 0 0 0 0.28(S)-3 0 0 0 0 0.15(R)-5 10.8 9.6 13.2 12.4 11.91(R)-6 16.0 12.0 12.0 20.0 16.82(S)-11 0 0 0 0 0(R)-20 2.8 0.8 4.8 0.8 3.31(S)-20 4.4 2.8 5.2 5.2 2.54(R)-22 0 0 0 0 0(S)-31 2.4 2.8 4.4 3.6 6.36(R)-38 0 0 0 0 0(S)-38 0 0 0 0 0(S)-43 0 0 0 0 0.16(proRS)-44 0 0 0 0 0(proSR)-44 0 0 0 0 0.04(R)-45 0 0 0 0 0aNAC percentages that differ more than a factor 4 from the result withseed A are shown in bold. The length of the MD simulations was 10ps. The abbreviation proRS stands for a binding mode of a prochiralsubstrate that results in a (1R,2S) product.
Figure 6. Short MD simulations eliminating productive conformationsfor a nonconverted substrate enantiomer, but not for a convertedsubstrate enantiomer, within 5 ps. The leaving group halide ismagenta, nitrogen atoms are blue, oxygen atoms are red, and hydrogenatoms are gray. Carbon atoms are indicated with green for DbjA withdocked substrate (carbon atoms are dark green). Carbon atomsdepicted in orange represent the same DbjA after 5 ps of MDsimulation with carbon atoms of the substrate depicted in yellow.D103, W104, and N38 are the residues directly involved in the firstreaction step. (A) Well-converted substrate enantiomer of DbjA, (R)-34. (B) Poorly converted substrate (S)-34.
Journal of Chemical Information and Modeling Article
dx.doi.org/10.1021/ci500126x | J. Chem. Inf. Model. XXXX, XXX, XXX−XXXH

the bound substrates enter and leave a NAC. Analysis of the 10ps MD simulations showed that the substrate routinely slips inand out of a NAC on a 20 fs time scale (Figure 7A). This wasnot an artifact due to the shortness of the MD simulationbecause also after 22 ns of simulation the substrate still entersand leaves the NAC on the same time scale (Figure 7C). Theoccurrence of a NAC typically corresponds to the angle θ1reaching a value that satisfied the NAC criteria (Figure 7B,D)while the other geometric criteria are satisfied most of the time(see below). These rapid movements of the substrate on a fstime scale can explain why even ps time scale simulations canprovide sufficient sampling of the locally accessible conforma-tional space of the enzyme−substrate complex.Structural Basis of Dehalogenase (Enantio)selectivity.
Good agreement between experimentally observed andpredicted E was obtained by NAC analysis of the MDsimulations for a large data set with four differentdehalogenases and more than 80 enzyme−substrate combina-tions. Therefore, it is justified to use the geometries that werecollected for the NAC analysis to investigate what causes theenantioselectivity in dehalogenases. For all 175 differentenzyme−substrate combinations, it was found that thegeometric component that most frequently disagreed with theformation of a productive substrate conformation was the angleθ1, which needs to be close to 180° for nucleophilic attack tooccur but was predominantly much lower. This angle betweenthe nucleophilic aspartate oxygen, carbon atom, and halideleaving group (Scheme 2) was only 5% of the time within therequirements for a NAC while the other five criteria weresatisfied ≥80% of the time (on average 80% of the time for d1,93% for d2, 85% for d3, 97% for θ2, and 94% for θ3). A lownucleophilic attack angle θ1 will lower rate the k2 (Scheme 1). Ifθ1 differs enough between the enantiomers, this results inenantioselective catalysis (eq 6).Another proposed explanation for stereoselective conversion
by dehalogenases is that the preferred enantiomers are boundstronger than the disfavored enantiomers.50 However, bindingenergies predicted by Autodock475 showed no noteworthydifferences (<2 kJ mol−1) for (R) and (S) enantiomers, even incase of substrates that were converted with high stereo-
selectivity (Table S6, Supporting Information). To explain theenantioselectivities that exceed 200 would require differences inbinding energy of 13.1 kJ mol−1 (see Discussion).To investigate whether the fraction of NACs during an MD
simulation can be correlated to the catalytic rate of an enzymevariant for a target substrate, further tests were carried out withβ-hexachlorocyclohexane (substrate 47). Nucleophilic attack onthis particular Lindane isomer is sterically hindered, andconversion is poor with all known dehalogenases. There aretwo natural variants of LinB63 that have some catalytic activityfor this substrate. They differ 10-fold in catalytic rate, and alsosix intermediate variants have been experimentally character-ized.63 For these LinB variants, the fraction of NACs observedby MD simulation correlated positively (Figure 8, R2 = 0.46)
Figure 7. Highly dynamic exchange of productive and nonproductive conformations at a fs time scale. At 20 fs intervals, it was determined whether aNAC was present or not. Both examples are for LinB with (R)-1 as a substrate. For angle θ1, a gray background indicates that the angle satisfies theNAC criterion as described in the caption of Scheme 2. (A) Occurrence of NACs from 5 to 10 ps. (B) θ1 angle of the same MD simulation. (C)Occurrence of NACs on the same time scale after 22 ns. (D) θ1 angle of the same MD simulation after 22 ns.
Figure 8. Correlation between experimentally determined specificityconstants (kcat/KM) and the occurrence of catalytically productivesubstrate conformations in modeled LinB variants. The substrate is 47.LinB from Sphingomonas paucimobilis indicus, which differs by 7mutations (A81T/A112V/I134V/A135T/I138L/A247H/M253I)from the WT LinB, which is from Sphingomonas paucimobilis japonicus.These WT dehalogenases and experimentally characterized inter-mediate variants were used for MD simulations. Experimental data arefrom Ito et al.63 Only for the WT, an X-ray structure was available; allother variants were modeled based on the X-ray structure of LinB WT.
Journal of Chemical Information and Modeling Article
dx.doi.org/10.1021/ci500126x | J. Chem. Inf. Model. XXXX, XXX, XXX−XXXI
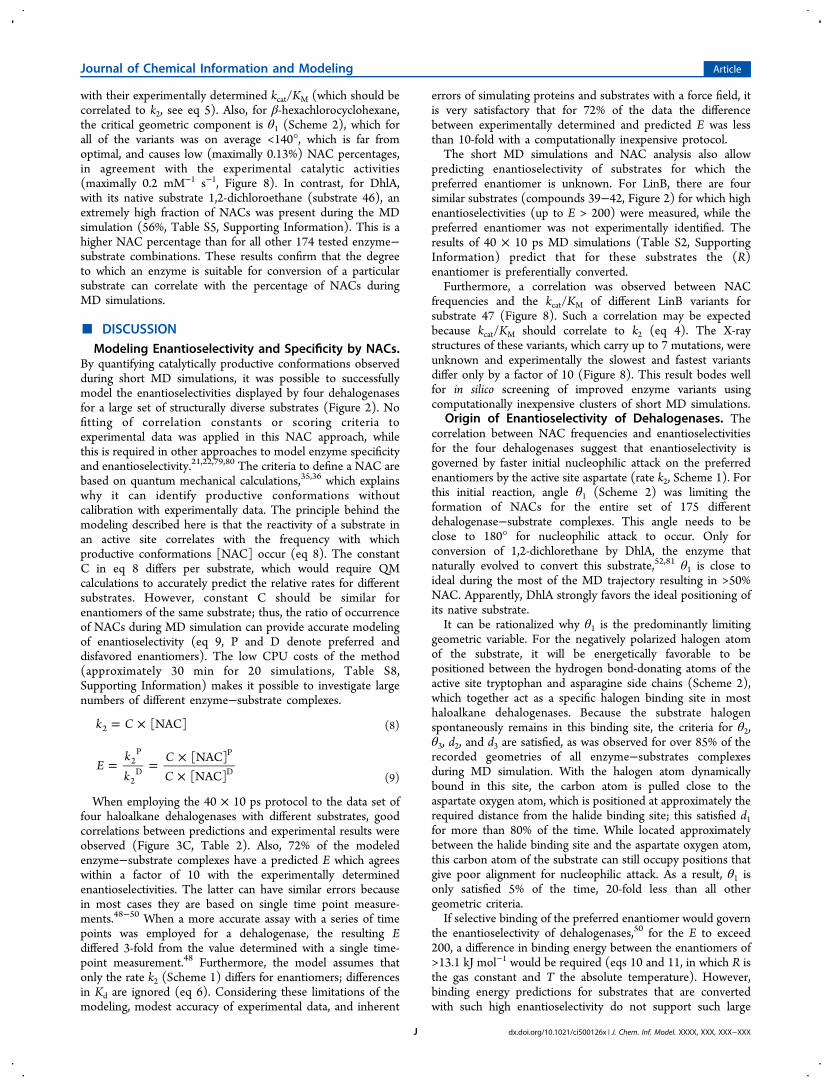
with their experimentally determined kcat/KM (which should becorrelated to k2, see eq 5). Also, for β-hexachlorocyclohexane,the critical geometric component is θ1 (Scheme 2), which forall of the variants was on average <140°, which is far fromoptimal, and causes low (maximally 0.13%) NAC percentages,in agreement with the experimental catalytic activities(maximally 0.2 mM−1 s−1, Figure 8). In contrast, for DhlA,with its native substrate 1,2-dichloroethane (substrate 46), anextremely high fraction of NACs was present during the MDsimulation (56%, Table S5, Supporting Information). This is ahigher NAC percentage than for all other 174 tested enzyme−substrate combinations. These results confirm that the degreeto which an enzyme is suitable for conversion of a particularsubstrate can correlate with the percentage of NACs duringMD simulations.
■ DISCUSSIONModeling Enantioselectivity and Specificity by NACs.
By quantifying catalytically productive conformations observedduring short MD simulations, it was possible to successfullymodel the enantioselectivities displayed by four dehalogenasesfor a large set of structurally diverse substrates (Figure 2). Nofitting of correlation constants or scoring criteria toexperimental data was applied in this NAC approach, whilethis is required in other approaches to model enzyme specificityand enantioselectivity.21,22,79,80 The criteria to define a NAC arebased on quantum mechanical calculations,35,36 which explainswhy it can identify productive conformations withoutcalibration with experimentally data. The principle behind themodeling described here is that the reactivity of a substrate inan active site correlates with the frequency with whichproductive conformations [NAC] occur (eq 8). The constantC in eq 8 differs per substrate, which would require QMcalculations to accurately predict the relative rates for differentsubstrates. However, constant C should be similar forenantiomers of the same substrate; thus, the ratio of occurrenceof NACs during MD simulation can provide accurate modelingof enantioselectivity (eq 9, P and D denote preferred anddisfavored enantiomers). The low CPU costs of the method(approximately 30 min for 20 simulations, Table S8,Supporting Information) makes it possible to investigate largenumbers of different enzyme−substrate complexes.
= ×k C [NAC]2 (8)
= = ××
Ekk
CC
[NAC][NAC]
2P
2D
P
D(9)
When employing the 40 × 10 ps protocol to the data set offour haloalkane dehalogenases with different substrates, goodcorrelations between predictions and experimental results wereobserved (Figure 3C, Table 2). Also, 72% of the modeledenzyme−substrate complexes have a predicted E which agreeswithin a factor of 10 with the experimentally determinedenantioselectivities. The latter can have similar errors becausein most cases they are based on single time point measure-ments.48−50 When a more accurate assay with a series of timepoints was employed for a dehalogenase, the resulting Ediffered 3-fold from the value determined with a single time-point measurement.48 Furthermore, the model assumes thatonly the rate k2 (Scheme 1) differs for enantiomers; differencesin Kd are ignored (eq 6). Considering these limitations of themodeling, modest accuracy of experimental data, and inherent
errors of simulating proteins and substrates with a force field, itis very satisfactory that for 72% of the data the differencebetween experimentally determined and predicted E was lessthan 10-fold with a computationally inexpensive protocol.The short MD simulations and NAC analysis also allow
predicting enantioselectivity of substrates for which thepreferred enantiomer is unknown. For LinB, there are foursimilar substrates (compounds 39−42, Figure 2) for which highenantioselectivities (up to E > 200) were measured, while thepreferred enantiomer was not experimentally identified. Theresults of 40 × 10 ps MD simulations (Table S2, SupportingInformation) predict that for these substrates the (R)enantiomer is preferentially converted.Furthermore, a correlation was observed between NAC
frequencies and the kcat/KM of different LinB variants forsubstrate 47 (Figure 8). Such a correlation may be expectedbecause kcat/KM should correlate to k2 (eq 4). The X-raystructures of these variants, which carry up to 7 mutations, wereunknown and experimentally the slowest and fastest variantsdiffer only by a factor of 10 (Figure 8). This result bodes wellfor in silico screening of improved enzyme variants usingcomputationally inexpensive clusters of short MD simulations.
Origin of Enantioselectivity of Dehalogenases. Thecorrelation between NAC frequencies and enantioselectivitiesfor the four dehalogenases suggest that enantioselectivity isgoverned by faster initial nucleophilic attack on the preferredenantiomers by the active site aspartate (rate k2, Scheme 1). Forthis initial reaction, angle θ1 (Scheme 2) was limiting theformation of NACs for the entire set of 175 differentdehalogenase−substrate complexes. This angle needs to beclose to 180° for nucleophilic attack to occur. Only forconversion of 1,2-dichlorethane by DhlA, the enzyme thatnaturally evolved to convert this substrate,52,81 θ1 is close toideal during the most of the MD trajectory resulting in >50%NAC. Apparently, DhlA strongly favors the ideal positioning ofits native substrate.It can be rationalized why θ1 is the predominantly limiting
geometric variable. For the negatively polarized halogen atomof the substrate, it will be energetically favorable to bepositioned between the hydrogen bond-donating atoms of theactive site tryptophan and asparagine side chains (Scheme 2),which together act as a specific halogen binding site in mosthaloalkane dehalogenases. Because the substrate halogenspontaneously remains in this binding site, the criteria for θ2,θ3, d2, and d3 are satisfied, as was observed for over 85% of therecorded geometries of all enzyme−substrates complexesduring MD simulation. With the halogen atom dynamicallybound in this site, the carbon atom is pulled close to theaspartate oxygen atom, which is positioned at approximately therequired distance from the halide binding site; this satisfied d1for more than 80% of the time. While located approximatelybetween the halide binding site and the aspartate oxygen atom,this carbon atom of the substrate can still occupy positions thatgive poor alignment for nucleophilic attack. As a result, θ1 isonly satisfied 5% of the time, 20-fold less than all othergeometric criteria.If selective binding of the preferred enantiomer would govern
the enantioselectivity of dehalogenases,50 for the E to exceed200, a difference in binding energy between the enantiomers of>13.1 kJ mol−1 would be required (eqs 10 and 11, in which R isthe gas constant and T the absolute temperature). However,binding energy predictions for substrates that are convertedwith such high enantioselectivity do not support such large
Journal of Chemical Information and Modeling Article
dx.doi.org/10.1021/ci500126x | J. Chem. Inf. Model. XXXX, XXX, XXX−XXXJ

differences (Table S6, Supporting Information). The exper-imental observation that the KM values are lower for thepreferred enantiomers than for the nonpreferred enan-tiomers48,50 can also be explained by faster initial nucleophilicattack because under the kinetics of Scheme 1 the KM becomessmaller with a larger k2 (eq 2). An influence of the rate ofhydrolysis and product release can also be excluded because theequations show that the corresponding rate k3 does not affectkcat/KM (eq 4) and thus also does not influence E (eq 5). Whilethese results strongly support a role for the angle θ1 indetermining enantioselectivity for the large majority ofcompounds, it cannot be excluded that for other dehalogenasesubstrates selective binding of one of the enantiomers doesdetermine enantioselectivity.82
=EKK
d
d
P
D(10)
Equations 10 and 11 only hold if k2 is equal for bothenantiomers, which is unlikely.
ΔΔ = ×G RT Elnbinding (11)
Multiple Independent MD Simulations for ModelingEnzyme−Substrate Complexes. Our results support theconclusion that a cluster of short (10 ps) independent MDsimulations sample the conformational space of the enzyme−substrate complex more thoroughly than a single long (up to 22ns) MD simulation. Apparently, the use of multiple shortsimulations with different initial velocities gave more completecoverage of conformational space adopted by enzyme−substrate complexes than single MD simulations that wererun over a much longer time scale (Figure 4, Table 2). Bettersampling by a cluster of MD simulations was found both withthe Yamber3 and Amber ff03 force fields (SupportingInformation). During equilibration, the substrate can reorient,and an enzyme−substrate complex will adopt a structurerepresenting one of the conformational subspaces, allowingcomplete sampling of NACs. The short trajectories can beadequately averaged because substrates move in and out of aNAC on a very short time scale (e.g., 20 fs, with simulationscovering 5 ps). Because the average speed of a carbon atom atroom temperature is approximately 250 m s−1 (2.5 Å ps−1), thesampling of movements of a substrate in an active site on thistime scale seems physically realistic. However, even duringprolonged simulations, there is little exchange between differentprotein conformations that are attained during equilibration,and these trajectories show a different behavior of substrate interms of NAC frequencies. This also explains that we observeda multinomial distribution of NAC frequencies over thedifferent MD simulations instead of a normal distribution(Figure S1, Supporting Information). Fitting standard errorsaccording to a normal distribution can be used to determine theconvergence of sampling protein−ligand complexes,86 but wasinapt for enzyme−substrate complexes because it would cover amore narrow range of NAC frequencies than the original data(Figure S1, Supporting Information) and thereby overestimatesthe obtained degree of convergence. For this reason, theconvergence of sampling was only appraised based on theagreement with experimental enantioselectivity (Figure 3).These observations can be explained by the existing idea that
that once an MD simulation has started the protein structurewill quickly relax to one of the many local energy minima in theconformational landscape, while jumps from one local
minimum to another are rare.42−44 This is relevant becauseenzyme catalysis typically occurs on the time scale of seconds(e.g., LinB48 with substrate (R)-6 kcat = 0.082 s−1; DhlA83 withsubstrate 46, kcat = 3.3 s−1). It is likely that only a fraction of theconformations that a single dehalogenase samples in solutionduring a second can be observed on the nanosecond time scaleof an MD simulation. It was recently shown that even anextremely long 1 ms MD simulations of bovine pancreatictrypsin inhibitor had far from completely sampled all of itsconformations,84,85 which further shows that even the longestsingle MD simulations can be inadequate for conformationalsampling and that the use of shorter parallel MD simulationsmay be preferred if long equilibrations are not necessary. Fordehalogenases, the protein structure observed by X-raycrystallography is catalytically active,56 which can explain why5 ps equilibrations were sufficient for the work reported here.This would not apply for enzymes that crystallize in acatalytically inactive conformation.Other recent methodological investigations that explored the
use of multiple independent MD simulations45,86−88 used 1 to 4orders of magnitude longer MD simulations (100 ps to 10 ns)than employed here (10 ps). These studies focused either onreproducing the flexibility of proteins in solution or onpredicting ligand-binding affinity. For the latter task, theanalysis of the entropy and electrostatic contributions tobinding based on MD snapshots were as computationallyexpensive as generating the 100 ps MD trajectory. Thus, forthese studies, it was not worthwhile to shorten the trajectoriesfurther. For the NAC analysis and enantioselectivitypredictions, merely a few distances and angles are recorded,and generating the MD trajectory requires by far most CPUtime, making it desirable to keep the MD trajectories short.The CPU expense of 20 × 10 ps MD simulations is a fraction
of that required for a 1 × 22 ns MD simulation and low enoughfor routine in silico screening of 103−104 enzyme variants. Withalternative techniques to predict enzyme activity, specificallyQM/MM, it is possible to obtain accurate predictions aswell89,90 but at a much higher CPU expense. Clusters of shortMD simulations could select in a high-throughput mannerenzyme variants in which catalytically favorable geometriesoccur before employing QM/MM or experimental screening.
■ CONCLUSIONSThe use of a cluster of short MD simulations allowed accuratemodeling of enantioselectivity for a set of four differentdehalogenases. The enantioselectivity for most of the 45dehalogenase substrates appears to be caused by differences inthe angle for nucleophilic attack (θ1, Scheme 2) for the separateenantiomers; this angle seemed suboptimal for almost allsubstrates and strongly influenced by the three-dimensionalstructure of the substrate, resulting in enantioselectiveconversions. More complete conformational sampling wasobtained by clusters of ≥20 very short MD simulations than bysingle long MD simulations. The combination of accuratemodeling and low computational cost of such MD simulationsenables high-throughput in silico screening. These insights areimportant for engineering the substrate scope and enantiose-lectivity of dehalogenases and other enzymes.
■ ASSOCIATED CONTENT*S Supporting InformationAvailable are descriptions of control experiments with analternative force field, and Figures S1−S6 and Tables S1−S8.
Journal of Chemical Information and Modeling Article
dx.doi.org/10.1021/ci500126x | J. Chem. Inf. Model. XXXX, XXX, XXX−XXXK

This material is available free of charge via the Internet athttp://pubs.acs.org.
■ AUTHOR INFORMATIONCorresponding Author*E-mail: [email protected]. Tel: +31 50 363 4008. Fax: +3150 363 4165.NotesThe authors declare no competing financial interest.
■ ACKNOWLEDGMENTSSupport for this work came from the European Union (seventhFramework) through the Kyrobio (289646, KBBE-2011-5) andMicro B3 (287589, OCEAN.2011-2) projects and from NWO(Netherlands Organization for Scientific Research) through anECHO grant.
■ REFERENCES(1) Schmid, A.; Dordick, J.; Hauer, B.; Kiener, A.; Wubbolts, M.;Witholt, B. Industrial biocatalysis today and tomorrow. Nature 2001,6817, 258−268.(2) Bornscheuer, U. T.; Huisman, G. W.; Kazlauskas, R. J.; Lutz, S.;Moore, J. C.; Robins, K. Engineering the third wave of biocatalysis.Nature 2012, 7397, 185−194.(3) Eijsink, V.; Gaseidnes, S.; Borchert, T.; Van den Burg, B. Directedevolution of enzyme stability. Biomol. Eng. 2005, 1−3, 21−30.(4) Polizzi, K. M.; Bommarius, A. S.; Broering, J. M.; Chaparro-Riggers, J. F. Stability of biocatalysts. Curr. Opin. Chem. Biol. 2007, 2,220−225.(5) Magliery, T. J.; Lavinder, J. J.; Sullivan, B. J. Protein stability bynumber: High-throughput and statistical approaches to one of proteinscience’s most difficult problems. Curr. Opin. Chem. Biol. 2011, 3,443−451.(6) Wijma, H. J.; Floor, R. J.; Janssen, D. B. Structure- and sequence-analysis inspired engineering of proteins for enhanced thermostability.Curr. Opin. Struct. Biol. 2013, 23, 588−594.(7) Munoz Solano, D.; Hoyos, P.; Hernaiz, M. J.; Alcantara, A. R.;Sanchez-Montero, J. M. Industrial biotransformations in the synthesisof building blocks leading to enantiopure drugs. Bioresour. Technol.2012, 151, 196−207.(8) Sukumaran, J.; Hanefeld, U. Enantioselective C−C bondsynthesis catalysed by enzymes. Chem. Soc. Rev. 2005, 6, 530−542.(9) Reetz, M. T. Laboratory evolution of stereoselective enzymes: Aprolific source of catalysts for asymmetric reactions. Angew. Chem., Int.Ed. 2011, 1, 138−174.(10) Koudelakova, T.; Bidmanova, S.; Dvorak, P.; Pavelka, A.;Chaloupkova, R.; Prokop, Z.; Damborsky, J. Haloalkane dehaloge-nases: Biotechnological applications. Biotechnol. J. 2013, 1, 32−45.(11) Pikkemaat, M. G.; Janssen, D. B. Generating segmentalmutations in haloalkane dehalogenase: A novel part in the directedevolution toolbox. Nucleic Acids Res. 2002, 8, E35−5.(12) Chang, C. H.; Schindler, J. F.; Unkefer, C. J.; Vanderberg, L. A.;Brainard, J. R.; Terwilliger, T. C. In vivo screening of haloalkanedehalogenase mutants. Bioorg. Med. Chem. 1999, 10, 2175−2181.(13) Bosma, T.; Damborsky, J.; Stucki, G.; Janssen, D. B.Biodegradation of 1,2,3-trichloropropane through directed evolutionand heterologous expression of a haloalkane dehalogenase gene. Appl.Environ. Microbiol. 2002, 7, 3582−3587.(14) Chaloupkova, R.; Sykorova, J.; Prokop, Z.; Jesenska, A.;Monincova, M.; Pavlova, M.; Tsuda, M.; Nagata, Y.; Damborsky, J.Modification of activity and specificity of haloalkane dehalogenasefrom Sphingomonas paucimobilis UT26 by engineering of its entrancetunnel. J. Biol. Chem. 2003, 52, 52622−52628.(15) Van Leeuwen, J. G. E.; Wijma, H. J.; Floor, R. J.; Van der Laan,J.; Janssen, D. B. Directed evolution strategies for enantiocomple-mentary haloalkane dehalogenases: From chemical waste toenantiopure building blocks. ChemBioChem. 2012, 1, 137−148.
(16) Koudelakova, T.; Chaloupkova, R.; Brezovsky, J.; Prokop, Z.;Sebestova, E.; Hesseler, M.; Khabiri, M.; Plevaka, M.; Kulik, D.; KutaSmatanova, I.; Rezacova, P.; Ettrich, R.; Bornscheuer, U. T.;Damborsky, J. Engineering enzyme stability and resistance to anorganic cosolvent by modification of residues in the access tunnel.Angew. Chem., Int. Ed. 2013, 7, 1959−1963.(17) Arnold, F. H. Combinatorial and computational challenges forbiocatalyst design. Nature 2001, 6817, 253−257.(18) Fox, R. J.; Davis, S. C.; Mundorff, E. C.; Newman, L. M.;Gavrilovic, V.; Ma, S. K.; Chung, L. M.; Ching, C.; Tam, S.; Muley, S.;Grate, J.; Gruber, J.; Whitman, J. C.; Sheldon, R. A.; Huisman, G. W.Improving catalytic function by ProSAR-driven enzyme evolution. Nat.Biotechnol. 2007, 3, 338−344.(19) Jackel, C.; Hilvert, D. Biocatalysts by evolution. Curr. Opin.Biotechnol. 2010, 6, 753−759.(20) Juhl, P. B.; Doderer, K.; Hollmann, F.; Thum, O.; Pleiss, J.Engineering of Candida antarctica lipase B for hydrolysis of bulkycarboxylic acid esters. J. Biotechnol. 2010, 4, 474−480.(21) Pace, V.; Cortes Cabrera, A.; Ferrario, V.; Sinisterra, J. V.; Ebert,C.; Gardossi, L.; Braiuca, P.; Alcantara, A. R. Structural bases forunderstanding the stereoselectivity in ketone reductions with ADHfrom Thermus thermophilus: A quantitative model. J. Mol. Catal. B2011, 1−2, 23−31.(22) Braiuca, P.; Lorena, K.; Ferrario, V.; Ebert, C.; Gardossi, L. Athree-dimensional quanititative structure-activity relationship (3D-QSAR) model for predicting the enantioselectivity of Candidaantarctica lipase B. Adv. Synth. Catal. 2009, 9, 1293−1302.(23) Seifert, A.; Antonovici, M.; Hauer, B.; Pleiss, J. An efficient routeto selective bio-oxidation catalysts: an iterative approach comprisingmodeling, diversification, and screening, based on CYP102A1.ChemBioChem. 2011, 9, 1346−1351.(24) Hediger, M. R.; De Vico, L.; Svendsen, A.; Besenmatter, W.;Jensen, J. H. A computational methodology to screen activities ofenzyme variants. PloS one 2012, 12, e49849−e49849.(25) Zheng, H.; Reetz, M. T. Manipulating the stereoselectivity oflimonene epoxide hydrolase by directed evolution based on iterativesaturation mutagenesis. J. Am. Chem. Soc. 2010, 44, 15744−15751.(26) Stjernschantz, E.; van Vugt-Lussenburg, B. M.; Bonifacio, A.; deBeer, S. B.; van der Zwan, G.; Gooijer, C.; Commandeur, J. N.;Vermeulen, N. P.; Oostenbrink, C. Structural rationalization of noveldrug metabolizing mutants of cytochrome P450 BM3. Proteins 2008, 1,336−352.(27) Kiss, G.; Rothlisberger, D.; Baker, D.; Houk, K. N. Evaluationand ranking of enzyme designs. Protein Sci. 2010, 9, 1760−1773.(28) Syren, P. O.; Hendil-Forssell, P.; Aumailley, L.; Besenmatter,W.; Gounine, F.; Svendsen, A.; Martinelle, M.; Hult, K. Esterases withan introduced amidase-like hydrogen bond in the transition state haveincreased amidase specificity. ChemBioChem. 2012, 5, 645−648.(29) Zheng, F.; Yang, W.; Ko, M. C.; Liu, J.; Cho, H.; Gao, D.; Tong,M.; Tai, H. H.; Woods, J. H.; Zhan, C. G. Most efficient cocainehydrolase designed by virtual screening of transition states. J. Am.Chem. Soc. 2008, 36, 12148−12155.(30) Pan, Y.; Gao, D.; Yang, W.; Cho, H.; Yang, G.; Tai, H. H.; Zhan,C. G. Computational redesign of human butyrylcholinesterase foranticocaine medication. Proc. Natl. Acad. Sci. U. S. A. 2005, 46, 16656−16661.(31) Privett, H. K.; Kiss, G.; Lee, T. M.; Blomberg, R.; Chica, R. A.;Thomas, L. M.; Hilvert, D.; Houk, K. N.; Mayo, S. L. Iterativeapproach to computational enzyme design. Proc. Natl. Acad. Sci. U.S.A.2012, 10, 3790−3795.(32) Bruice, T. C. Computational approaches: Reaction trajectories,structures, and atomic motions. Enzyme reactions and proficiency.Chem. Rev. 2006, 8, 3119−3139.(33) Negri, A.; Marco, E.; Damborsky, J.; Gago, F. Stepwisedissection and visualization of the catalytic mechanism of haloalkanedehalogenase LinB using molecular dynamics simulations andcomputer graphics. J. Mol. Graph. Model 2007, 3, 643−651.(34) Hur, S.; Kahn, K.; Bruice, T. C. Comparison of formation ofreactive conformers for the SN2 displacements by CH3CO2− in water
Journal of Chemical Information and Modeling Article
dx.doi.org/10.1021/ci500126x | J. Chem. Inf. Model. XXXX, XXX, XXX−XXXL

and by Asp124−CO2− in a haloalkane dehalogenase. Proc. Natl. Acad.Sci. U.S.A. 2003, 5, 2215−2219.(35) Lau, E. Y.; Kahn, K.; Bash, P. A.; Bruice, T. C. The importanceof reactant positioning in enzyme catalysis: A hybrid quantummechanics/molecular mechanics study of a haloalkane dehalogenase.Proc. Natl. Acad. Sci. U.S.A. 2000, 18, 9937−9942.(36) Lightstone, F. C.; Zheng, Y. J.; Maulitz, A. H.; Bruice, T. C.Non-enzymatic and enzymatic hydrolysis of alkyl halides: a haloalkanedehalogenation enzyme evolved to stabilize the gas-phase transitionstate of an SN2 displacement reaction. Proc. Natl. Acad. Sci. U.S.A.1997, 16, 8417−8420.(37) Bruice, T. C. A view at the millennium: the efficiency ofenzymatic catalysis. Acc. Chem. Res. 2002, 3, 139−148.(38) Bruice, T.; Benkovic, S. Chemical basis for enzyme catalysis.Biochemistry 2000, 21, 6267−6274.(39) Warshel, A.; Sharma, P. K.; Kato, M.; Xiang, Y.; Liu, H.; Olsson,M. H. M. Electrostatic basis for enzyme catalysis. Chem. Rev. 2006, 8,3210−3235.(40) Ranaghan, K. E.; Mulholland, A. J. Conformational effects inenzyme catalysis: QM/MM free energy calculation of the ‘NAC’contribution in chorismate mutase. Chem. Commun. (Camb) 2004, 10,1238−1239.(41) Klepeis, J. L.; Lindorff-Larsen, K.; Dror, R. O.; Shaw, D. E.Long-timescale molecular dynamics simulations of protein structureand function. Curr. Opin. Struct. Biol. 2009, 2, 120−127.(42) Caves, L. S. D.; Evanseck, J. D.; Karplus, M. Locally accessibleconformations of proteins: Multiple molecular dynamics simulations ofcrambin. Protein Sci. 1998, 3, 649−666.(43) Daggett, V. Long timescale simulations. Curr. Opin. Struct. Biol.2000, 2, 160−164.(44) Monticelli, L.; Sorin, E. J.; Tieleman, D. P.; Pande, V. S.;Colombo, G. Molecular simulation of multistate peptide dynamics: Acomparison between microsecond timescale sampling and multipleshorter trajectories. J. Comput. Chem. 2008, 11, 1740−1752.(45) Genheden, S.; Ryde, U. A comparison of different initializationprotocols to obtain statistically independent molecular dynamicssimulations. J. Comput. Chem. 2011, 2, 187−195.(46) Kiss, G.; Pande, V. S.; Houk, K. N. Molecular dynamicssimulations for the ranking, evaluation, and refinement of computa-tionally designed proteins. Methods in Protein Design 2013, 523, 145−170.(47) Keizers, P. H.; de Graaf, C.; de Kanter, F. J.; Oostenbrink, C.;Feenstra, K. A.; Commandeur, J. N.; Vermeulen, N. P. Metabolicregio- and stereoselectivity of cytochrome P450 2D6 towards 3,4-methylenedioxy-N-alkylamphetamines: In silico predictions andexperimental validation. J. Med. Chem. 2005, 19, 6117−6127.(48) Westerbeek, A.; Szymanski, W.; Wijma, H. J.; Marrink, S. J.;Feringa, B. L.; Janssen, D. B. Kinetic resolution of alpha-bromoamides:Experimental and theoretical investigation of highly enantioselectivereactions catalyzed by haloalkane dehalogenases. Adv. Synth. Catalys.2011, 6, 931−944.(49) Pieters, R.; Spelberg, J.; Kellogg, R.; Janssen, D. Theenantioselectivity of haloalkane dehalogenases. Tetrahedron Lett.2001, 3, 469−471.(50) Prokop, Z.; Sato, Y.; Brezovsky, J.; Mozga, T.; Chaloupkova, R.;Koudelakova, T.; Jerabek, P.; Stepankova, V.; Natsume, R.; vanLeeuwen, J. G.; Janssen, D. B.; Florian, J.; Nagata, Y.; Senda, T.;Damborsky, J. Enantioselectivity of haloalkane dehalogenases and itsmodulation by surface loop engineering. Angew. Chem., Int. Ed. 2010,35, 6111−6115.(51) Szymanski, W.; Westerbeek, A.; Janssen, D. B.; Feringa, B. L. Asimple enantioconvergent and chemoenzymatic synthesis of opticallyactive alpha-substituted amides. Angew. Chem., Int. Ed. 2011, 45,10712−10715.(52) Keuning, S.; Janssen, D. B.; Witholt, B. Purification andcharacterization of hydrolytic haloalkane dehalogenase from Xantho-bacter autotrophicus GJ10. J. Bacteriol. 1985, 2, 635−639.
(53) Kulakova, A. N.; Larkin, M. J.; Kulakov, L. A. The plasmid-located haloalkane dehalogenase gene from Rhodococcus rhodochrousNCIMB 13064. Microbiology 1997, Pt 1, 109−115.(54) Sato, Y.; Monincova, M.; Chaloupkova, R.; Prokop, Z.;Ohtsubo, Y.; Minamisawa, K.; Tsuda, M.; Damborsky, J.; Nagata, Y.Two rhizobial strains, Mesorhizobium loti MAFF303099 andBradyrhizobium japonicum USDA110, encode haloalkane dehaloge-nases with novel structures and substrate specificities. Appl. Environ.Microbiol. 2005, 8, 4372−4379.(55) Nagata, Y.; Miyauchi, K.; Damborsky, J.; Manova, K.;Ansorgova, A.; Takagi, M. Purification and characterization of ahaloalkane dehalogenase of a new substrate class from a gamma-hexachlorocyclohexane-degrading bacterium, Sphingomonas paucimobi-lis UT26. Appl. Environ. Microbiol. 1997, 9, 3707−3710.(56) Verschueren, K. H.; Seljee, F.; Rozeboom, H. J.; Kalk, K. H.;Dijkstra, B. W. Crystallographic analysis of the catalytic mechanism ofhaloalkane dehalogenase. Nature 1993, 6431, 693−698.(57) Prokop, Z.; Monincova, M.; Chaloupkova, R.; Klvana, M.;Nagata, Y.; Janssen, D. B.; Damborsky, J. Catalytic mechanism of thehaloalkane dehalogenase LinB from Sphingomonas paucimobilis UT26.J. Biol. Chem. 2003, 46, 45094−45100.(58) Oakley, A. J.; Klvana, M.; Otyepka, M.; Nagata, Y.; Wilce, M. C.;Damborsky, J. Crystal structure of haloalkane dehalogenase LinB fromSphingomonas paucimobilis UT26 at 0.95 A resolution: dynamics ofcatalytic residues. Biochemistry 2004, 4, 870−878.(59) Newman, J.; Peat, T.; Richard, R.; Kan, L.; Swanson, P.;Affholter, J.; Holmes, I.; Schindler, J.; Unkefer, C.; Terwilliger, T.Haloalkane dehalogenases: Structure of a Rhodococcus enzyme.Biochemistry 1999, 49, 16105−16114.(60) Ridder, I. S.; Rozeboom, H. J.; Dijkstra, B. W. Haloalkanedehalogenase from Xanthobacter autotrophicus GJ10 refined at 1.15 Aresolution. Acta Crystallogr., Sect. D: Biol. Crystallogr. 1999, Pt 7,1273−1290.(61) Chaloupkova, R.; Prokop, Z.; Sato, Y.; Nagata, Y.; Damborsky, J.Stereoselectivity and conformational stability of haloalkane dehaloge-nase DbjA from Bradyrhizobium japonicum USDA110: The effect ofpH and temperature. FEBS J. 2011, 15, 2728−2738.(62) Krieger, E.; Nielsen, J. E.; Spronk, C. A.; Vriend, G. Fastempirical pKa prediction by Ewald summation. J. Mol. Graph. Model2006, 4, 481−486.(63) Ito, M.; Prokop, Z.; Klvana, M.; Otsubo, Y.; Tsuda, M.;Damborsky, J.; Nagata, Y. Degradation of beta-hexachlorocyclohexaneby haloalkane dehalogenase LinB from gamma-hexachlorocyclohex-ane-utilizing bacterium Sphingobium sp. MI1205. Arch. Microbiol. 2007,4, 313−325.(64) Richter, F.; Leaver-Fay, A.; Khare, S. D.; Bjelic, S.; Baker, D. Denovo enzyme design using Rosetta3. PLoS One 2011, 5, e19230.(65) Stewart, J. Special issue − MOPAC: A semiempirical molecular-orbital program. J. Comput. Aided Mol. Des. 1990, 1, 1−45.(66) Jakalian, A.; Jack, D. B.; Bayly, C. I. Fast, efficient generation ofhigh-quality atomic charges. AM1-BCC model: II. Parameterizationand validation. J. Comput. Chem. 2002, 16, 1623−1641.(67) Morris, G. M.; Huey, R.; Lindstrom, W.; Sanner, M. F.; Belew,R. K.; Goodsell, D. S.; Olson, A. J. AutoDock4 and AutoDockTools4:Automated docking with selective receptor flexibility. J. Comput. Chem.2009, 16, 2785−2791.(68) Krieger, E.; Darden, T.; Nabuurs, S.; Finkelstein, A.; Vriend, G.Making optimal use of empirical energy functions: Force-fieldparameterization in crystal space. Prot. Struct. Funct. Bioinform. 2004,4, 678−683.(69) Berendsen, H. J. C.; Postma, J. P. M.; Van Gunsteren, W. F.;Dinola, A.; Haak, J. R. Molecular-dynamics with coupling to anexternal bath. J. Chem. Phys. 1984, 8, 3684−3690.(70) Hess, B.; Bekker, H.; Berendsen, H.; Fraaije, J. LINCS: A linearconstraint solver for molecular simulations. J. Comput. Chem. 1997, 12,1463−1472.(71) Miyamoto, S.; Kollman, P. A. SETTLE − An analytical versionof the Shake and Rattle algorithm for rigid water models. J. Comput.Chem. 1992, 8, 952−962.
Journal of Chemical Information and Modeling Article
dx.doi.org/10.1021/ci500126x | J. Chem. Inf. Model. XXXX, XXX, XXX−XXXM

(72) Essmann, U.; Perera, L.; Berkowitz, M. L.; Darden, T.; Lee, H.;Pedersen, L. G. A smooth particle Mesh Ewald method. J. Chem. Phys.1995, 19, 8577−8593.(73) Duan, Y.; Wu, C.; Chowdhury, S.; Lee, M. C.; Xiong, G.; Zhang,W.; Yang, R.; Cieplak, P.; Luo, R.; Lee, T.; Caldwell, J.; Wang, J.;Kollman, P. A point-charge force field for molecular mechanicssimulations of proteins based on condensed-phase quantummechanical calculations. J. Comput. Chem. 2003, 16, 1999−2012.(74) Cook, P.; Cleland, W. W. Enzyme kinetics and mechanism;Garland Science: London, 2007.(75) Huey, R.; Morris, G. M.; Olson, A. J.; Goodsell, D. S. Asemiempirical free energy force field with charge-based desolvation. J.Comput. Chem. 2007, 6, 1145−1152.(76) Wang, J.; Cieplak, P.; Kollman, P. How well does a restrainedelectrostatic potential (RESP) model perform in calculating conforma-tional energies of organic and biological molecules? J. Comput. Chem.2000, 12, 1049−1074.(77) Lange, O. F.; van der Spoel, D.; de Groot, B. L. Scrutinizingmolecular mechanics force fields on the submicrosecond timescalewith NMR data. Biophys. J. 2010, 2, 647−655.(78) Lindorff-Larsen, K.; Piana, S.; Palmo, K.; Maragakis, P.; Klepeis,J. L.; Dror, R. O.; Shaw, D. E. Improved side-chain torsion potentialsfor the Amber ff99SB protein force field. Proteins 2010, 8, 1950−1958.(79) Kmunicek, J.; Bohac, M.; Luengo, S.; Gago, F.; Wade, R. C.;Damborsky, J. Comparative binding energy analysis of haloalkanedehalogenase substrates: modelling of enzyme-substrate complexes bymolecular docking and quantum mechanical calculations. J. Comput.-Aided Mol. Des. 2003, 5−6, 299−311.(80) Stjernschantz, E.; Vermeulen, N. P.; Oostenbrink, C. Computa-tional prediction of drug binding and rationalisation of selectivitytowards cytochromes P450. Expert Opin. Drug Metab. Toxicol. 2008, 5,513−527.(81) Pries, F.; van den Wijngaard, A. J.; Bos, R.; Pentenga, M.;Janssen, D. B. The role of spontaneous cap domain mutations inhaloalkane dehalogenase specificity and evolution. J. Biol. Chem. 1994,26, 17490−17494.(82) Banas, P.; Otyepka, M.; Jerabek, P.; Petrek, M.; Damborsky, J.Mechanism of enhanced conversion of 1,2,3-trichloropropane bymutant haloalkane dehalogenase revealed by molecular modeling. J.Comput.-Aided Mol. Des. 2006, 6, 375−383.(83) Schanstra, J. P.; Kingma, J.; Janssen, D. B. Specificity andkinetics of haloalkane dehalogenase. J. Biol. Chem. 1996, 25, 14747−14753.(84) Shaw, D. E.; Maragakis, P.; Lindorff-Larsen, K.; Piana, S.; Dror,R. O.; Eastwood, M. P.; Bank, J. A.; Jumper, J. M.; Salmon, J. K.; Shan,Y.; Wriggers, W. Atomic-level characterization of the structuraldynamics of proteins. Science 2010, 6002, 341−346.(85) Genheden, S.; Ryde, U. Will molecular dynamics simulations ofproteins ever reach equilibrium? Phys. Chem. Chem. Phys. 2012, 24,8662−8677.(86) Genheden, S.; Ryde, U. How to obtain statistically convergedMM/GBSA results. J. Comput. Chem. 2010, 4, 837−846.(87) Genheden, S.; Diehl, C.; Akke, M.; Ryde, U. Starting-conditiondependence of order parameters derived from molecular dynamicssimulations. J. Chem. Theory Comput. 2010, 7, 2176−2190.(88) Zagrovic, B.; van Gunsteren, W. F. Computational analysis ofthe mechanism and thermodynamics of inhibition of phosphodiester-ase 5A by synthetic ligands. J. Chem. Theory Comput. 2007, 1, 301−311.(89) Lind, M. E. S.; Himo, F. Quantum chemistry as a tool inasymmetric biocatalysis: Limonene epoxide hydrolase test case. Angew.Chem., Int. Ed. 2013, 17, 4563−4567.(90) Lonsdale, R.; Harvey, J. N.; Mulholland, A. J. A practical guideto modelling enzyme-catalysed reactions. Chem. Soc. Rev. 2012, 8,3025−3038.
Journal of Chemical Information and Modeling Article
dx.doi.org/10.1021/ci500126x | J. Chem. Inf. Model. XXXX, XXX, XXX−XXXN