computationally guided materials discovery csra - gorai... · computationally guided materials...
TRANSCRIPT


Prashun Gorai National Renewable Energy Laboratory
Colorado School of Mines
Computationally Guided Materials Discovery
International Materials Research Congress 2017: Tutorial
High-throughput Computations, Softwares and Databases, Experimental Feedback
www.prashungorai.org/imrc2017

High-throughput Computations: General Down-selection Approach
experimental realization
materials search space
candidates
detailedcalculations
descriptor (metric)of target property
• Define search space (known materials, hypothetical structures, alloy compositions)
• Develop a descriptor/metric to quantify the target property (e.g. a figure of merit)
• Approximate but reliable
• Computationally tractable
• Perform higher accuracy or detailed calculations
• Phase stability, defect calculations etc.
• Eureka! (hopefully)
/423
Seemingly straightforward, practical implementation non-trivial

Developing a Robust, Quantitative Descriptor is Challenging
experimental realization
materials search space
candidates
detailedcalculations
descriptor (metric)of target property
Calculation of the descriptor should also be computationally tractable
• A descriptor is a quantitative metric for the desirable material properties
1. Can be a set of material properties
example: transparent conducting oxides
large band gap (transparent), high carrier mobility
2. Can be a figure of merit
example: thermoelectric material
thermoelectric figure of merit zT
/424
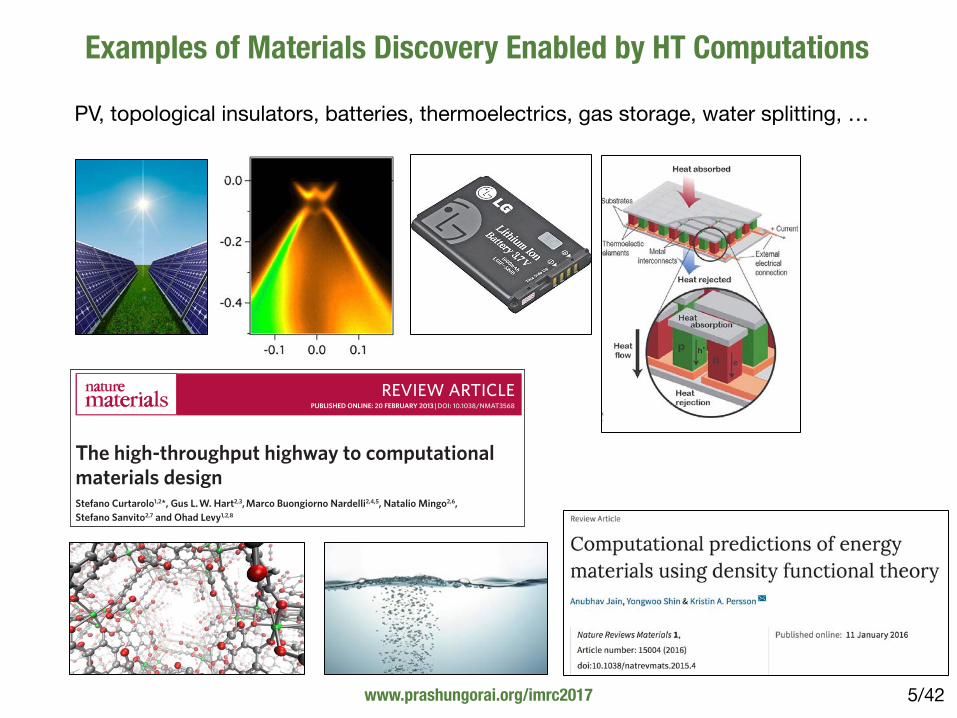
Examples of Materials Discovery Enabled by HT Computations
NATURE MATERIALS | VOL 12 | MARCH 2013 | www.nature.com/naturematerials 191
Every technology is intimately related to a particular materials set. The steam engines that powered the industrial revolution in the eighteenth century were made of steel and, information
and communication technologies are underpinned by silicon. Once a material is chosen for a given technology, it gets locked with it because of the investments associated with establishing large-scale production lines. This means that changing the materials set in an established technology is a rare event and must be considered as a revolution. Moreover, the initial choice of a material is abso-lutely crucial for the long-lasting success of a technological sector. Importantly, recent times have seen a surge of new technological niches, each one of them potentially looking for a different mate-rials set. Thus, the pressure on the development of new materials is becoming formidable. These should score on many counts. They should be tailored on the specific property that the technology is based on, they often should be compatible with other technologies, should not contain toxic elements, and, if needed in large quanti-ties, should be made of cheap raw materials. As such, searching for materials is a multi-dimensional problem where many boxes should be ticked at the same time.
Although the demand for materials is endlessly growing, experi-mental discovery is bound by high costs and time-consuming procedures of synthesis. Is there another way? Indeed, this is the burgeoning area of computational materials science called ‘high-throughput’ (HT) computational materials design. It is based on the marriage between computational quantum-mechanical–ther-modynamic approaches1,2 and a multitude of techniques rooted in database construction and intelligent data mining3. The concept is simple yet powerful: create a large database containing the cal-culated thermodynamic and electronic properties of existing and hypothetical materials, and then intelligently interrogate the data-base in the search of materials with the desired properties. Clearly, the entire construct should be validated by reality, namely the exist-ing materials must be predicted correctly and the hypothetical ones should eventually be made. Such a reality check feeds back to the theory to construct better databases and increase predictive power.
The high-throughput highway to computational materials designStefano Curtarolo1,2*, Gus L. W. Hart2,3, Marco Buongiorno Nardelli2,4,5, Natalio Mingo2,6, Stefano Sanvito2,7 and Ohad Levy1,2,8
High-throughput computational materials design is an emerging area of materials science. By combining advanced thermo-dynamic and electronic-structure methods with intelligent data mining and database construction, and exploiting the power of current supercomputer architectures, scientists generate, manage and analyse enormous data repositories for the discovery of novel materials. In this Review we provide a current snapshot of this rapidly evolving field, and highlight the challenges and opportunities that lie ahead.
The HT experimental approach was pioneered over a hundred years ago by Edison4 and Ciamician5, but with the advent of effi-cient and accurate theoretical tools and inexpensive computers, its computational counterpart has become a viable path for tackling materials design. Thus, in the past decade computational HT materi-als research has emerged3,6–16 following the impetus of experimental HT approaches17–19. In the literature, HT materials research is often confused with the combinatorial evaluation of materials properties. Although a few attempts have been made to clearly define the two concepts20–22, the distinction is not yet rigorous. Here we define HT as the throughput of data that is way too high to be produced or ana-lysed by the researcher’s direct intervention, and must therefore be performed automatically: HT implies an automatic flow from ideas to results. The confusion of HT with combinatorial approaches is thus resolved. The latter, in fact, specifies how the degrees of free-dom are investigated, whereas HT strictly defines the overwhelming and automatic flow of the investigations.
The practical implementation of computational HT is highly non-trivial. The method is employed in three strictly connected steps: (i) virtual materials growth: thermodynamic and electronic structure calculations of materials3,23; (ii) rational materials storage: systematic storage of the information in database repositories24,25; (iii) materials characterization and selection: data analysis aimed at selecting novel materials or gaining new physical insights15,19,26.
High-throughput is often known for the large databases it gen-erates (for example, the AFLOWLIB.org consortium24 and the Materials Project25). Here we posit that all three HT stages are highly necessary, but that the last one is the most challenging and impor-tant. In fact, it is the step that allows one to extract the information and, as such, it requires a deep understanding of the physical prob-lem at hand. The intelligent search of a database is performed by means of ‘descriptors’. These are empirical quantities, not necessarily observables, connecting the calculated microscopic parameters (for example, formation and defect energies, atomic environments, band structure, density of states or magnetic moments) to macroscopic properties of the materials (for example, mobility, susceptibility or
1Department of Mechanical Engineering and Materials Science, and Department of Physics, Duke University, Durham, North Carolina 27708, USA, 2Center for Materials Genomics, Duke University, Durham, North Carolina 27708, USA, 3Department of Physics and Astronomy, Brigham Young University, Provo, Utah 84602, USA, 4Department of Physics and Department of Chemistry, University of North Texas, Denton, Texas 76203, 5Computer Science and Mathematics Division, Oak Ridge National Laboratory, Oak Ridge, Tennessee 37831, USA, 6LITEN, CEA-Grenoble, 17 rue des Martyrs, 38054 Grenoble Cedex 9, France, 7School of Physics and CRANN, Trinity College, Dublin 2, Ireland, 8Department of Physics, NRCN, PO Box 9001, Beer-Sheva 84190, Israel. *e-mail: [email protected]
REVIEW ARTICLEPUBLISHED ONLINE: 20 FEBRUARY 2013"|"DOI: 10.1038/NMAT3568
© 2013 Macmillan Publishers Limited. All rights reserved
PV, topological insulators, batteries, thermoelectrics, gas storage, water splitting, …
www.prashungorai.org/imrc2017 /425

High-throughput Computations: Good, Bad and Ugly
• Large number of materials can be rapidly screened to down select candidates
• Can accelerate materials discovery and learning of new structure-property relationships
• Computational advances (softwares, infrastructure) have been rapid to enable HT computations
The Good
• Developing a robust descriptor is quite challenging
• Results may depend on the computational method of choice - lack of prediction consistency
• Experimental validation may not be able keep pace with the rate at which predictions are generated
The Bad
• Without experimental validation, the literature is inundated with nonsensical results
• HT computations can lead to HT errors!
The Ugly
Seemingly straightforward, practical implementation non-trivial/426

Example: Computationally Guided Discovery of Thermoelectric Materials
Monday August 21, 10:00 (Tulum F)
1. Urgent need to discover high-performing thermoelectric materials
computations can accelerate the discovery
2. Edisonian trial-and-error approaches have resulted in limited success
computationally guided discovery may be successful
3. Descriptor of TE performance is complicated due to contraindicated properties
computationally guided discovery may be successful
Gorai, Stevanovic, Toberer, Nature Reviews Materials, 2, 17053 (2017)
Computationally guided discovery of thermoelectric materialsPrashun Gorai, Vladan Stevanovic and Eric S. Toberer
REVIEWS
/427

Outline
/428
• Break (2.5 min), Primer on thermoelectrics (1)
• Why is computational search of thermoelectric materials challenging? (2)
• Boltzmann transport theory (1)
• Descriptors of thermoelectric performance (8+break+ 6)
• Theory, examples, limitations, improvements
• Challenges: dopability (4)
• Break (2.5 min), Softwares for HT computations (2)
• Open-access databases (3)
• Role of data informatics (1)
• Role of experimental validation (1)
• Outlook (1), Q&A (10 min)

Questions?
/429
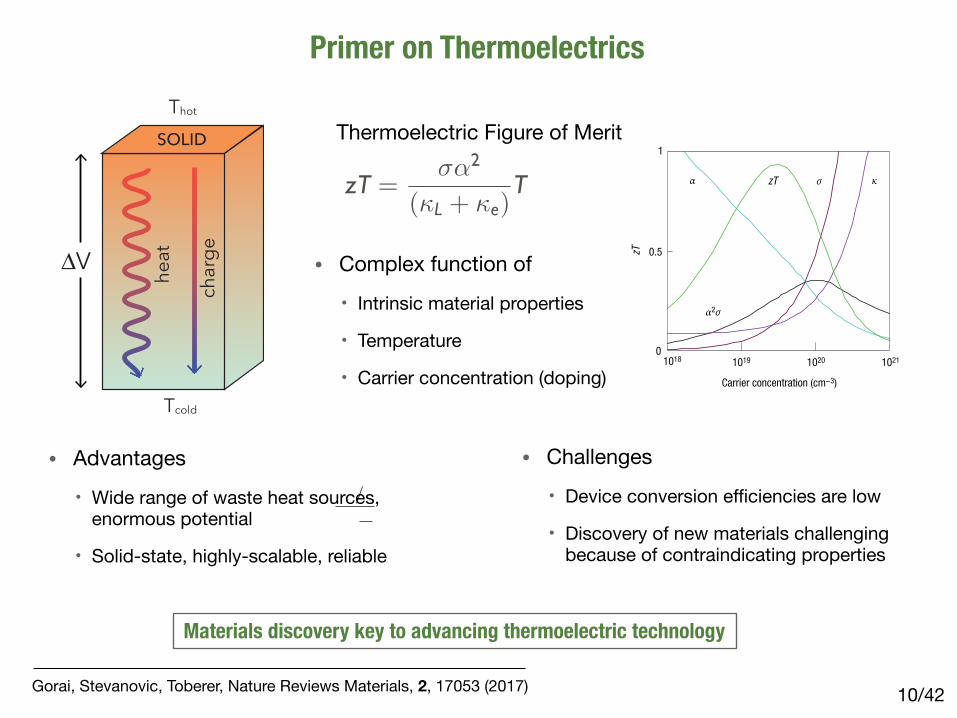
Primer on Thermoelectrics
/4210
Tcold
Thot
charge
heat
SOLID
∆V
Gorai, Stevanovic, Toberer, Nature Reviews Materials, 2, 17053 (2017)
zT =��2
(�L + �e)T
Thermoelectric Figure of Merit
• Complex function of
• Intrinsic material properties
• Temperature
• Carrier concentration (doping)
REVIEW ARTICLE
nature materials | VOL 7 | FEBRUARY 2008 | www.nature.com/naturematerials 107
The Lorenz factor can vary particularly with carrier concentration. Accurate assessment of κe is important, as κl is often computed as the difference between κ and κe (equation (3)) using the experimental electrical conductivity. A common source of uncertainty in κe occurs in low-carrier-concentration materials where the Lorenz factor can be reduced by as much as 20% from the free-electron value. Additional uncertainty in κe arises from mixed conduction, which introduces a bipolar term into the thermal conductivity10. As this term is not included in the Wiedemann–Franz law, the standard computation of κl erroneously includes bipolar thermal conduction. This results in a perceived increase in κl at high temperatures for Bi2Te3, PbTe and others, as shown in Fig. 2a. The onset of bipolar thermal conduction occurs at nearly the same temperature as the peak in Seebeck and electrical resistivity, which are likewise due to bipolar effects.
As high zT requires high electrical conductivity but low thermal conductivity, the Wiedemann–Franz law reveals an inherent materials conflict for achieving high thermoelectric efficiency. For materials with very high electrical conductivity (metals) or very low κl, the Seebeck coefficient alone primarily determines zT, as can be seen in equation (4), where (κl/κe) << 1:
2
1 + =
lе
.
(4)
LATTICE THERMAL CONDUCTIVITYGlasses exhibit some of the lowest lattice thermal conductivities. In a glass, thermal conductivity is viewed as a random walk of energy through a lattice rather than rapid transport via phonons, and leads to the concept of a minimum thermal conductivity22, κmin. Actual glasses, however, make poor thermoelectrics because they lack the needed ‘electron-crystal’ properties — compared with crystalline semiconductors they have lower mobility due to increased electron scattering and lower effective masses because of broader bands. Good thermoelectrics are therefore crystalline materials that manage to scatter phonons without significantly disrupting the electrical conductivity. The heat flow is carried by a spectrum of phonons with widely varying wavelengths and mean free paths23 (from less than 1 nm to greater than 10 µm), creating a need for phonon scattering agents at a variety of length scales.
Thermoelectrics therefore require a rather unusual material: a ‘phonon-glass electron-crystal’24. The electron-crystal requirement stems from the fact that crystalline semiconductors have been the best at meeting the compromises required from the electronic properties (Seebeck coefficient and electrical conductivity). The phonon-glass requirement stems from the need for as low a lattice thermal conductivity as possible. Traditional thermoelectric materials have used site substitution (alloying) with isoelectronic elements to preserve a crystalline electronic structure while creating large mass contrast to disrupt the phonon path. Much of the recent excitement in the field of thermoelectrics is a result of the successful demonstration of other methods to achieve phonon-glass electron-crystal materials.
ADVANCES IN THERMOELECTRIC MATERIALS
Renewed interest in thermoelectrics is motivated by the realization that complexity at multiple length scales can lead to new mechanisms for high zT in materials. In the mid 1990s, theoretical predictions suggested that the thermoelectric efficiency could be greatly enhanced by quantum confinement of the electron charge carriers5,25. The electron energy bands in a quantum-confined structure are progressively narrower as the confinement increases and the dimensionality decreases. These narrow bands should produce high effective masses and therefore large Seebeck coefficients. In addition, similar sized, engineered heterostructures
may decouple the Seebeck coefficient and electrical conductivity due to electron filtering26 that could result in high zT. Even though a high-ZT device based on these principles has yet to be demonstrated, these predictions have stimulated a new wave of interest in complex thermoelectric materials. Vital to this rebirth has been interdisciplinary collaborations: research in thermoelectrics
0
0
1
2
zT
2
1
(2)
(1)
(3)
Carrier concentration (cm−3)
0
0.5
1
zT
zT
2
1018 1019 1020 1021
Carrier concentration (cm−3)
1018 1019 1020 1021
(Wm
−1 K
−1 )
l = 0.8
l = 0.2
l = 0.8
l = 0.2
e
Figure 1 Optimizing zT through carrier concentration tuning. a, Maximizing the efficiency (zT) of a thermoelectric involves a compromise of thermal conductivity (κ; plotted on the y axis from 0 to a top value of 10 W m–1 K–1) and Seebeck coefficient (α; 0 to 500 µV K–1) with electrical conductivity (σ; 0 to 5,000 Ω–1cm–1). Good thermoelectric materials are typically heavily doped semiconductors with a carrier concentration between 1019 and 1021 carriers per cm3. The thermoelectric power factor α2σ maximizes at higher carrier concentration than zT. The difference between the peak in α2σ and zT is greater for the newer lower-κl materials. Trends shown were modelled from Bi2Te3, based on empirical data in ref. 78. b, Reducing the lattice thermal conductivity leads to a two-fold benefit for the thermoelectric figure of merit. An optimized zT of 0.8 is shown at point (1) for a model system (Bi2Te3) with a κl of 0.8 Wm–1 K–1 and κe that is a function of the carrier concentration (purple). Reducing κl to 0.2 Wm–1 K–1 directly increases the zT to point (2). Additionally, lowering the thermal conductivity allows the carrier concentration to be reoptimized (reduced), leading to both a decrease in κe and a larger Seebeck coefficient. The reoptimized zT is shown at point (3).
• Advantages
• Wide range of waste heat sources, enormous potential
• Solid-state, highly-scalable, reliable
• Challenges
• Device conversion efficiencies are low
• Discovery of new materials challenging because of contraindicating properties
Materials discovery key to advancing thermoelectric technology

TE Materials Discovery is Complex: Well Suited for Computations
/4211
Contraindicated transport properties
charge
phonon
HOT
COLD
SOLID
q
qq1
q2
q3
k
k
k’
Search space is chemically, structurally diverse
Computations can guide discovery of new TE materials, identify new structure-property relations
PbTePbSe
PbS
Mg2Si
Mg2Sn
Hf0.5Zr0.5NiSn
SnSe
Bi2Te3
Sb2Te3YbZn2Sb2
ZnO
TiO2
NaCoO2CaMnO3
FeSi2
SnS
BiCuSeOCoSb3
Mo3Sb7
CsBi4Te6 Yb14MnSb11
Sr3GaSb3
Ba8Ga16Ge30Ca5Al2Sb6
> 1.51-1.50.5-1< 0.5
zT
structural complexity
heavier atoms
Si0.8Ge0.2
Mg3Sb2
La3Te4
Zn4Sb3
MnSi0.75
Cu2Se
Tl9BiTe6
TlSbTe2
Aver
age
Atom
ic M
ass
10
20
50
100
200
Number of Atoms in Primitive Cell10 100
~40,000 metal-non metal compounds from ICSD
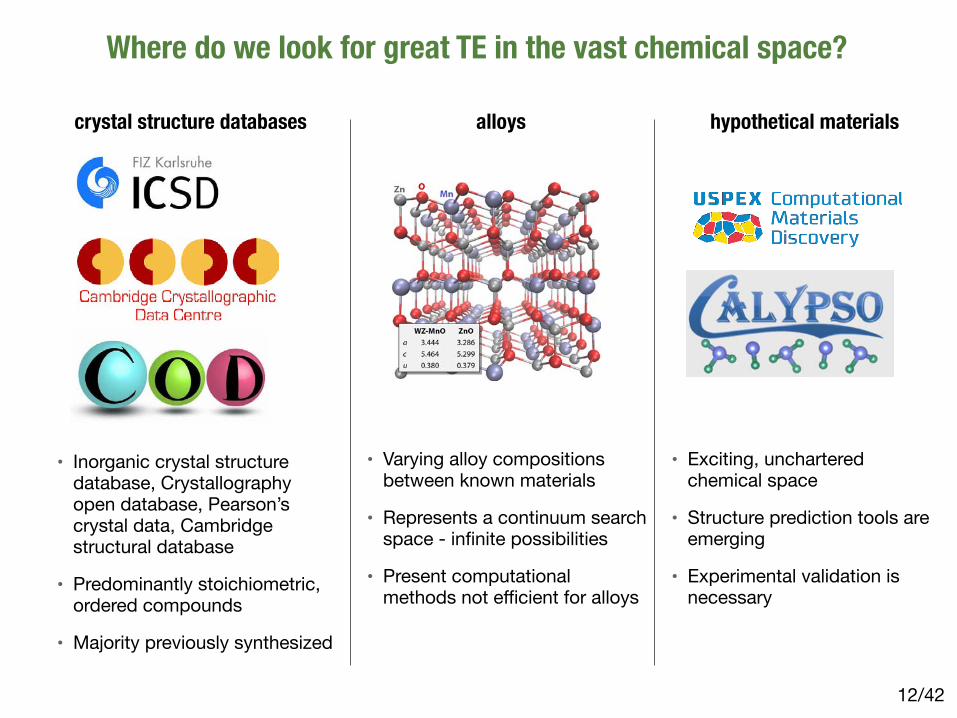
Where do we look for great TE in the vast chemical space?
/4212
crystal structure databases
• Inorganic crystal structure database, Crystallography open database, Pearson’s crystal data, Cambridge structural database
• Predominantly stoichiometric, ordered compounds
• Majority previously synthesized
alloys
• Varying alloy compositions between known materials
• Represents a continuum search space - infinite possibilities
• Present computational methods not efficient for alloys
dielectric constant obtained from the preceding GW cal-culation. The k derivatives of the electron orbitals weredetermined using the finite difference approximation ofRef. [60] in the “perturbation expansion after discretiza-tion” formulation. For the calculation of optical properties,the k-point density was increased to 7000=nat within thefull Brillouin zone, where nat is the number of atoms in theunit cell. In order to keep these calculations feasible, wereduced the energy cutoff for the response functions andreduced the number of bands to 32 × nat, as compared to64 × nat for the band-gap calculations using a coarser gridwith about 1000=natk points. The resulting band-gapchanges of less than 0.1 eV were corrected for in thespectra shown in Fig. 2(a). The absorption spectrum issubject to a finite Lorentzian broadening in these calcu-lations, and despite the increased k-point density, thesubgap absorption due to the bound exciton was notaccurately resolved. The low-energy part of the spectrum,where the absorption coefficient is significantly affected bythe broadening, is omitted [Fig. 2(a)]. From the calculatedeffective masses, and dielectric constants (ε ¼ 8.1 and 7.8for WZ-MnO and ZnO, respectively, including the ioniccontribution), we expect a Wannier-type exciton with abinding energy similar to that in ZnO, i.e., about 60 meV.The electron effective masses were obtained directly fromthe band energies close to the conduction band minimum(CBM) at the Γ point of the Brillouin zone. Because of alarger nonparabolicity and anisotropy in the valence band,for hole carriers, we determined instead the density-of-states effective masses (cf. Ref. [61]) by integrating thedensity of states weighted with a Boltzmann distributionat 1000 K.
2. Models for alloys and the magnetic structure
In order to model the alloy systems, we used specialquasirandom structures (SQS) [62]. The SQS in this workwere generated with the mcsqs utility in the AlloyTheoretic Automated Toolkit (ATAT) [63]. To calculatethe mixing energy, we employed SQS with 64 atoms,without any constraints other than the composition beingx ¼ 0=16; 1=16;…16=16, while keeping the underlyingmagnetic sublattices of the low-energy antiferromagneticconfiguration “AF1” of wurtzite structure MnO [57]. Astructural model of the atomic configuration for x ¼ 0.5 isshown in Fig. 6 (created with the VMD software [64]),showing also the calculated lattice parameters for the endcompounds WZ MnO and ZnO. For the polaron calcu-lations, we used 64-atom SQS supercells with the shapeclose to a cube, as well as a 72-atom ZnO supercell for theMnZn impurity. At room temperature, MnO is paramagnetic(PM). It is important, however, to consider that in the PMphase the moments are not completely random, but thelocal (short-range) antiferromagnetic (AFM) order persistsfar above the Neel temperature [65], even in the absenceof long-range AFM order. More recently, Hughes and
co-workers calculated the electronic structure for rocksaltMnO in the PM phase with the “disordered local moment”method [66]. Their results show that the insulating gapin the PM state is practically identical to that in the AFMphase. Thus, we conclude that our assumption of an AFMorder is an appropriate model of the magnetic structure forcomputing the electronic structure in this system. For theGW calculations, we generated smaller 32-atom SQS forthe alloy compositions x ¼ 0.25, 0.5, and 0.75, constructedto maintain the symmetry between the spin-up and spin-down density of states.Figure 7 shows the calculated local density of states
(LDOS) for the valence band of the Mn1−xZnxO alloys, asobtained from the GW quasiparticle energy calculations,where the contributions from all sites of the same atom type(Mn, Zn, or O) have been averaged. The energy scale isaligned with respect to the vacuum level, as in Fig. 4. Wesee that at high Zn compositions, Mn forms an impurityband in ZnO, but at x ¼ 0.75 and lower Zn compositions,the alloys exhibit a continuous valence band with domi-nating contributions from Mn-d and O-p.
3. Calculation of the small-polaronself-trapping energies
The hole self-trapping energies are calculated using theab initio theory for the small-polaron binding energies ofRefs. [34,35]. This approach employs a potential term Vhs,i.e., the “hole-state potential,” which is added to the DFTHamiltonian. A potential strength parameter λhs is thenadjusted to recover the quasiparticle energy condition(“Koopmans condition”) and linearity of the total energyEðNÞ, thereby overcoming the well-known delocalizationerror of standard DFT functionals [41] and enabling a
FIG. 6. Structural model of the SQS used to represent theMn0.5Zn0.5O alloy. The inserted table shows the similarity of thecalculated lattice parameters for WZ MnO and ZnO.
DESIGN OF SEMICONDUCTING TETRAHEDRAL MN … PHYS. REV. X 5, 021016 (2015)
021016-9
hypothetical materials
• Exciting, unchartered chemical space
• Structure prediction tools are emerging
• Experimental validation is necessary
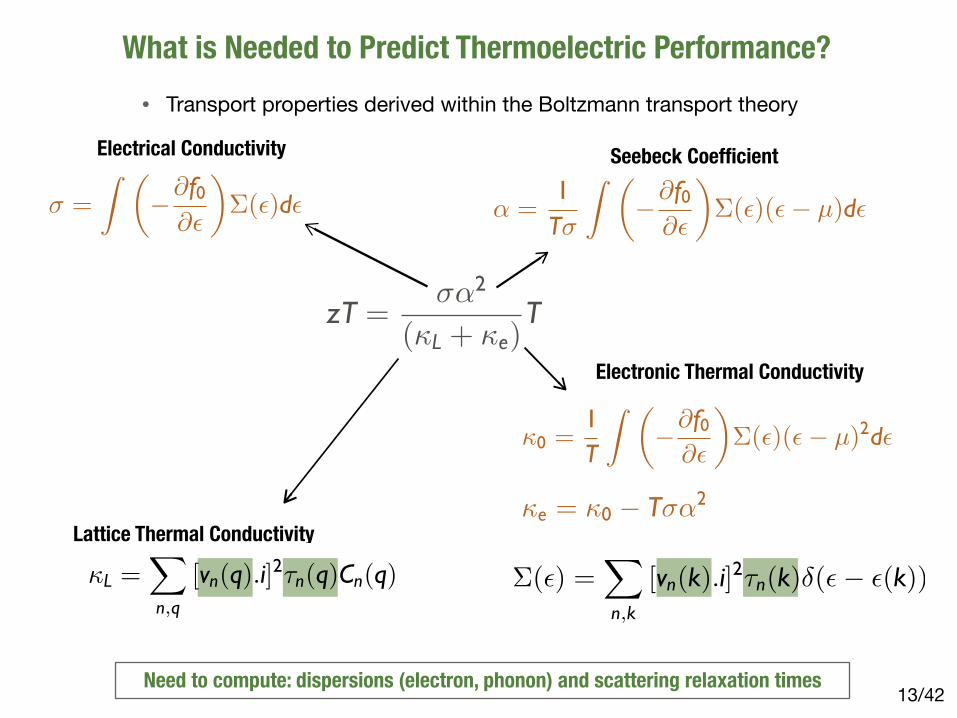
What is Needed to Predict Thermoelectric Performance?
/4213Need to compute: dispersions (electron, phonon) and scattering relaxation times
�(�) =�
n,k
[vn(k).i]2�n(k)�(� � �(k))
zT =��2
(�L + �e)T
� =
� ���f0
��
��(�)d�
Electrical Conductivity
� =1T�
� ���f0
��
��(�)(� � µ)d�
Seebeck Coefficient
�0 =1T
� ���f0
��
��(�)(� � µ)2d�
�e = �0 � T��2
Electronic Thermal Conductivity
Lattice Thermal Conductivity
�L =�
n,q
[vn(q).i]2�n(q)Cn(q)
• Transport properties derived within the Boltzmann transport theory

HT Search Strategies and Descriptors of Thermoelectric Performance
/4214
• Constant relaxation time approximation (CRTA)
• Descriptor focuses only on electronic transport2006
• Constant mean free path approximation (CMFP)
• Descriptor focuses only on electronic transport2011
• Semi-empirical descriptor
• Descriptors accounts for both electron and phonon transport2015
theory examples limitations improvements

1. Constant Relaxation Time Approximation (CRTA)
/4215
• In this approach, the relaxation time (𝜏) is assumed to be constant
• Electrical conductivity scales linearly with 𝜏, Seebeck is 𝜏-independent
• Reduced power factor (𝛼𝜎2/𝜏) is the descriptor for thermoelectric performance
• Large power factors are desirable for good thermoelectric performance
• Effect of thermal conductivity is often overlooked
� =
� ���f0
��
��(�)d�
Electrical Conductivity
� =1T�
� ���f0
��
��(�)(� � µ)d�
Seebeck Coefficient �(�) =�
n,k
[vn(k).i]2�n(k)�(� � �(k))
Transport Distribution Function
Electronic part of zT is evaluated within CRTA

1. Softwares for Solving Boltzmann Transport Equations
/4216
Computer Physics Communications 175 (2006) 67–71www.elsevier.com/locate/cpc
BoltzTraP. A code for calculating band-structure dependent quantities ✩
Georg K.H. Madsen a,∗, David J. Singh b
a Department of Chemistry, University of Aarhus, DK-8000 Århus C, Denmarkb Condensed Matter Sciences Division, Oak Ridge National Laboratory, Oak Ridge, TN 37831-6032, USA
Received 25 September 2005; accepted 3 March 2006
Available online 2 May 2006
Abstract
A program for calculating the semi-classic transport coefficients is described. It is based on a smoothed Fourier interpolation of the bands. Fromthis analytical representation we calculate the derivatives necessary for the transport distributions. The method is compared to earlier calculations,which in principle should be exact within Boltzmann theory, and a very convincing agreement is found.
Program summary
Title of program: BoltzTraPCatalogue identifier: ADXU_v1_0Program summary URL: http://cpc.cs.qub.ac.uk/summaries/ADXU_v1_0Program obtainable from: CPC Program Library, Queen’s University of Belfast, N. IrelandLicensing provisions: noneProgramming language used: Fortran 90Computer: The program should work on any system with a F90 compiler. The code has been tested with the Intel Fortran compilerOperating system: Unix/LinuxRAM: bytes up to 2 GB for low symmetry, small unit cell structuresNo. of lines in distributed program, including test data, etc.: 1 534 213No. of bytes in distributed program, including test data, etc.: 27 473 227Distribution format: tar.gzExternal routines: The LaPack and Blas libraries are neededNature of problem: Analytic expansion of energy-bands. Calculation of semi-classic integrals.Solution method: Smoothed Fourier expansion of bands.Running time: Up to 3 hours for low symmetry, small unit cell structures.© 2006 Elsevier B.V. All rights reserved.
PACS: 71.20.-b; 72.10.-d
Keywords: Boltzmann theory; Conductivity; Hall effect; Thermopower; Fourier expansion
✩ This paper and its associated computer program are available via theComputer Physics Communications homepage on ScienceDirect (http://www.sciencedirect.com/science/journal/00104655).
* Corresponding author.E-mail address: [email protected] (G.K.H. Madsen).
1. Introduction
Method developments, the existence of user friendly distrib-uted codes and the ever increasing computer power are makingthe calculation of band-structures, for even relatively complexmaterials, more and more straight forward. As several proper-ties can be calculated from the energy bands and their deriva-tives, the usefulness off a generally applicable, easily portableand documented code for analysis of the bands should be clear.
0010-4655/$ – see front matter © 2006 Elsevier B.V. All rights reserved.doi:10.1016/j.cpc.2006.03.007
• One of the most widely used softwares for calculation of transport coefficients from first-principles DFT calculations
• Other similar softwares:
• BoltzWann (use localized Wannier functions)1
• LanTrap (within Landauer formalism)2
• ShengBTE (solves phonon Boltzmann transport equations)3
1 Pizzi et al., Comp. Phys. Comm. 185, 422 (2014) 2 Lundstorm et al. https://nanohub.org/resources/lantrap (2014) 3 Li et al., Comp. Phys. Comm., 185, 147 (2014)

1. Example: Search for Antimonide Thermoelectrics
/4217
Automated Search for New Thermoelectric Materials:The Case of LiZnSb
Georg K. H. MadsenContribution from the Department of Chemistry, UniVersity of Aarhus,
DK-8000 Århus C, Denmark
Received April 12, 2006; E-mail: [email protected]
Abstract: An automated band structure calculation based on the inorganic crystal structure database andthe augmented plane wave method for electronic structure calculations is presented. Using a rigid bandapproach and semiclassic Boltzmann theory the band structures are analyzed and a large number ofcompounds are screened for potential interesting thermoelectric properties. We thereby propose LiZnSbas a potential new thermoelectric material. The k-space structure of the lowest conduction band of LiZnSbis analyzed in detail, and excellent thermoelectric properties are expected for this material. Furthermorethe lattice dynamics are calculated, and anisotropic lattice thermal conduction is predicted.
I. Introduction
The search for new thermoelectric materials is a quest tomaximize the dimensionless figure of merit zT ) (σT/κ)S2,where S is the Seebeck coefficient and σ and κ are the electronicand thermal conductivities, respectively. zT quantifies theperformance of a thermoelectric, and one must thereforemaximize the power factor S2σ and minimize κ. As S, σ, and κ
are coupled and all depend strongly on the detailed electronicstructure, carrier concentration, and crystal structure, the taskof finding new compounds with large values of zT is extremelydifficult.
One idea that seems to run as a red thread through muchrecent research on thermoelectrics, including the work onclathrates1-9 and skutterudites,10-12 is the concept of a “PhononGlass Electron Crystal” (PGEC).13 This concept is based on theassumption that low-frequency optical modes, due to looselybound guest atoms inside a framework structure, will reduce
the lattice thermal conductivity thereby enhancing the figureof merit. The PGEC concept was introduced by Slack,13 whoalso established a correlation among the weighted mobility, theband gap, and the average electronegativity difference. Herebya number of semiconductors were suggested as potentiallyinteresting for thermoelectric applications.13 While the idea ofa PGEC has been highly influential, the use of the electro-negativity difference for predicting suitable electronic propertieshas been less used.
A different approach to rationally improving the electronicproperties of thermoelectrics is the analysis of band structurecalculations using Boltzmann theory. This ab initio approachhas been successful in rationalizing and predicting the optimaldoping level of known compounds5,11,14-17 but has seldomlybeen used to discover new interesting materials for thermoelec-tric applications. However, we do not see any reason why bandstructure calculations cannot be used to screen a large numberof potential candidates. As the underlying basis of Boltzmanntheory is well understood,18 one usually understands when itshould work. Briefly put, the crystal momentum should be welldefined so that k is a good quantum number. In a crystal, thismeans that the mean distances between scatterers, and therebythe mean free path of the electron, should be large compared tothe wavelength of the electron. Furthermore, the advance ofcomputational power, methodology, and standardized softwarehas made the calculation of band structures, even for a largesystem containing heavy atoms, quite straightforward. Finally,the calculation of a large number of structures is trivially parallel
(1) Nolas, G. S.; Cohn, J. L.; Slack, G. A.; Schujman, S. B. Appl. Phys. Lett.1998, 73, 178-180.
(2) Cohn, J. L.; Nolas, G. S.; Fessatidis, V.; Metcalf, T. H.; Slack, G. A. Phys.ReV. Lett. 1999, 82, 779-782.
(3) Paschen, S.; Carrillo-Cabrera, W.; Bentien, A.; Tran, V. H.; Baenitz, M.;Grin, Y.; Steglich, F. Phys. ReV. B 2001, 64, 214404.
(4) Sales, B. C.; Chakoumakos, B. C.; Jin, R.; Thompson, J. R.; Mandrus, D.Phys. ReV. B 2001, 63, 245113.
(5) Madsen, G. K. H.; Schwarz, K.; Blaha, P.; Singh, D. J. Phys. ReV. B 2003,68, 125212.
(6) Bentien, A.; Christensen, M.; Bryan, J. D.; Sanchez, A.; Paschen, S.;Steglich, F.; Stucky, G. D.; Iversen, B. B. Phys. ReV. B 2004, 69, 45107.
(7) Bentien, A.; Pacheco, V.; Paschen, S.; Grin, Y.; Steglich, F. Phys. ReV. B2005, 71, 165206.
(8) Pacheco, V.; Bentien, A.; Carrillo-Cabrera, W.; Paschen, S.; Steglich, F.;Grin, Y. Phys. ReV. B 2005, 71, 165205.
(9) Madsen, G. K. H.; Santi, G. Phys. ReV. B 2005, 72, 220301.(10) Sales, B. C.; Mandrus, D.; Williams, R. K. Science 1996, 272, 1325-
1327.(11) Singh, D. J.; Mazin, I. I. Phys. ReV. B 1997, 56, R1650-R1653.(12) Keppens, V.; Mandrus, D.; Sales, B. C.; Chakoumakos, B. C.; Dai, P.;
Coldea, R.; Maple, M. P.; Gajewski, D. A.; Freeman, E. J.; Bennington, S.Nature 1998, 395, 876-878.
(13) Slack, G. New materials and performance limits for thermoelectric cooling.In CRC Handbook of Thermoelectrics; Rowe, D. M., Ed.; CRC: BocaRaton, FL, 1995; pp 407-440.
(14) Møllnitz, L.; Blake, N. P.; Metiu, H. J. Chem. Phys. 2002, 117, 1302-1312.
(15) Scheidemantel, T. J.; Ambrosch-Draxl, C.; Thonhauser, T.; Badding, J.V.; Sofo, J. O. Phys. ReV. B 2003, 68, 125210.
(16) Thonhauser, T.; Scheidemantel, T. J.; Sofo, J. O. Appl. Phys. Lett. 2004,85, 588-590.
(17) Bertini, L.; Gatti, C. J. Chem. Phys. 2004, 121, 8983-8989.(18) Allen, P. B. Boltzmann theory and resistivity of metals. In Quantum Theory
of Real Materials; Chelikowsky, J. R., Louie, S. G., Eds.; Kluwer: Boston,MA, 1996; pp 219-250.
Published on Web 08/25/2006
12140 9 J. AM. CHEM. SOC. 2006, 128, 12140-12146 10.1021/ja062526a CCC: $33.50 © 2006 American Chemical Society
• One of the earliest applications of the CRTA approach to search for new TE materials
• Screened 570 Sb-containing compounds from the ICSD
• Assumed fixed values of 𝜏 and 𝜅L for all compounds
• LiZnSb identified as promising candidate - experiments could not confirm
• Interesting candidates (Zr5ZnSb3, NaZnSb) remain unverified
Madsen, J. Amer. Chem. Soc., 128, 12140 (2006)

1. Example: XYZ2 Thermoelectrics
/4218
• Search identified XYZ2 chemistry as a promising family of thermoelectric materials
• Assumed constant 𝜏 for all compounds
• Calculated minimum 𝜅L in the amorphous limit
• zT of ~0.35 achieved for TmAgTe2, carrier concentration tuning was challenging
10556 | J. Mater. Chem. C, 2015, 3, 10554--10565 This journal is©The Royal Society of Chemistry 2015
with the pure octahedra of TmTe6 and AgTe6 found in the trigonalphase. Our experimental lattice parameters of the tetragonal phaseare found to be a = c = 7.0831(5) Å and b = 4.5298(7) Å, where thetheoretical values are 7.0655 Å and 4.6903 Å, respectively.
The tetragonal (trigonal) phase is considered to be the low(high) temperature phase.27–29 This is consistent with our 0 Kcalculations in which the tetragonal TmohAgthTe2 is B15 meV peratom lower in energy than the trigonal phase. Recent experimentalwork, in which the XAgTe2 samples were annealed at 870 K andquenched in air, suggest that X = Tm prefers the formation ofthe trigonal phase whereas compounds with X = Y, Tb, Dy, Hoand Er preferentially form the tetragonal phase.27,28
2.3 Thermal conductivity of TmAgTe2
Unlike tetragonal chalcopyrite with pure tetrahedrally coordi-nated cations, at least one cation in trigonal TmohAgohTe2 andtetragonal TmohAgthTe2 exhibit octahedral coordination (seeFig. 1), which is expected to lead to lower lattice thermalconductivity, klat, as higher coordination has been correlatedwith low thermal conductivity.30 Following the Cahill–Watson–Pohl model31 (see Computational and experimental methodol-ogies section), we calculated the average klat in the amorphouslimit (kmin) to be 0.36 and 0.37 W m!1 K!1 for trigonal andtetragonal TmAgTe2, respectively.
Using the Vaschenko–Zubarev formulation (g = K0/2 ! 5/6, inwhich K0 is the pressure derivative of the bulk modulus, K)32
and fitting the total energy of the relaxed structure at differentvolumes to the Murnaghan equation of state (EðVÞ ¼ E V0ð ÞþKV
K 0V0=Vð ÞK
0
K 0 ! 1þ 1
" #
! KV0
K 0 ! 1, in which V0 is the equilibrium
volume),33 we determine that the trigonal TmohAgohTe2 hashigh anharmonicity with a Gruneisen parameter (g) computedto be 1.37. A large g is usually favorable as it leads to lowerthermal conductivities,34 although we emphasize that thisparameter represents only an indicator amongst several factorsdetermining the thermal conductivity. We note that by comparison,
PbTe (known to exhibit low thermal conductivity) is predictedto have a similar Gruneisen parameter (computed value of 1.4compared to the experimental value of 1.45).35
Considering that low thermal conductivities, close to theamorphous limit, have been reported for some silver chalco-genides (i.e., Ag2Te, AgCrSe, AgSbTe2)25,36,37 and copper chalco-genides (i.e., CuGaTe2, Cu2Se, Cu2S, CuInTe2, BaCu5.9SeTe6),24,38–41
a low thermal conductivity is expected for TmAgTe2 and relatedcompounds, as validated from our experiments discussedin Section 2.7.
2.4 The electronic structure and transport property ofTmAgTe2
As shown in Fig. 2, both the trigonal and tetragonal phasesdisplay band structures interesting for thermoelectrics—havingmultiple bands close to the valence band maximum (VBM) andthe conduction band minimum (CBM). We note that theseband structures are calculated with no spin–orbit coupling(NSOC); SOC corrections are discussed later in this section. In theNSOC band structure, the valence band of trigonal TmohAgohTe2
contains pockets at the A point and along S and L directionsthat are close in energy, and which have multiplicity of 1, 6 and6 in the full Brillouin zone, respectively. The p-type tetragonal
Fig. 1 The structure of TmAgTe2 in the (a) P %3m1 trigonal and (b) P %421mtetragonal crystal structure. The top and bottom figures are the projectionsalong the b and c directions, respectively. The blue, white, and yellowspheres represent Tm, Ag and Te atoms, respectively.
Fig. 2 The computed band structure and power factor at 600 K of (a)trigonal TmohAgohTe2 and (b) tetragonal TmohAgthTe2. The color in theband structures represents the projections of the wave function ontodifferent elements, where red, blue and green are associated with Te, Agand Tm, respectively. In the right panels, the power factors along the threecrystallographic directions a, b, and c are indicated by different colors. Themaximum power factor occurs at carrier concentration of 4.8 & 1020
(3.5 & 1021) and 5.8 & 1020 (3.8 & 1020) cm!3 for holes and electrons intrigonal (tetragonal) TmAgTe2, respectively. The horizontal dashed linesstand for the Fermi level at which the carrier concentration is 1020 cm!3.The transport values have been obtained in the constant scattering timeapproximation (10!14 s).
Journal of Materials Chemistry C Paper
Publ
ished
on
13 A
ugus
t 201
5. D
ownl
oade
d by
Law
renc
e Be
rkel
ey N
atio
nal L
abor
ator
y on
24/
11/2
015
21:1
0:28
.
View Article Online
TmAgTe2
10560 | J. Mater. Chem. C, 2015, 3, 10554--10565 This journal is©The Royal Society of Chemistry 2015
and transverse velocities of trigonal TmohAgohTe2 (vL,s = 3520and vT,s = 1390 m s!1) and tetragonal TmohAgthTe2 (vL,s =2810 and vT,s = 1625 m s!1), we determined kmin to be 0.38and 0.36 W m!1 K!1, comparable to the theoretical predica-tions (0.36 and 0.37 W m!1 K!1). This feature is very promisingfor thermoelectric materials and implies that if a reasonablepower factor is obtained, thermoelectric materials with high zTvalues can be produced. Further doping studies are in progressto tune the carrier concentration in TmAgTe2 related com-pounds in order to optimize the power factor.
3. DiscussionUsing high-throughput computations, we have identified aseries of XYZ2 compounds with trigonal and tetragonal crystalstructures that show promising properties for thermoelectricapplications. Within a small Edecomp window, we uncovered a widerange of octahedrally coordinated, rare-earth silver chalcogenidesin the trigonal phase and rare-earth copper chalcogenides inthe tetragonal phase, both of which have favorable calculatedzT values that can exceed 1.5 at 600 K for holes (as well as forelectrons as shown in Fig. S8 in the ESI†).
We have also shown that the high zT value strongly corre-lates to the high band degeneracy found in these materials for agiven klat. It is thus of interest to understand which chemical orstructural features lead to such a high band degeneracy. Forboth structures, the character of the electron states at the bandedges is similar, with valence bands being mainly composed
of Z-p, Y-d orbitals (see Fig. 2). If X contains d orbitals, itcontributes to the p-d hybridization at the top of valence bandand influences the relative positions of several valence bandextrema. Chemistry is one simple approach to vary the hybri-dization. We found that reducing the orbital hybridizationbetween X and Z atoms in the trigonal phase, or between Yand Z atoms in the tetragonal phase, leads to a higher banddegeneracy at the valence band maxima. For example, as we cansee from Fig. 9, the trigonal LuohAgohZ2 and LuohCuohZ2 withZ = S gives rise to the highest predicted zT, which is correlatedto the large energy difference between Lu-d and S-p atomicorbitals and hence smaller X-d and Z-p orbital hybridization,compared to the case for Z = Se or Te. Unlike the trigonal phase,the top of the valence band for the tetragonal structure is moredominated by Y-d and Z-p orbitals because this hybridization isstronger in YZ4 tetrahedron than in XZ6 octahedron. For thetetragonal phase, the largest energy difference between Y-d andZ-p for LuohAgthZ2 and LuohCuthZ2 is found in LuohAgthTe2 andLuohCuthS2 (Fig. 9), and these compounds also exhibit hightheoretical zT values.
Another approach to tune the band alignment is through thelattice parameter. For example, for the trigonal TmohAgohTe2 atits equilibrium lattice parameter, the energy difference betweenthe two highest valence bands (DE) is determined to be 0.17 eVfrom NSOC calculations. With a volume expansion (2% increasefor each lattice direction), DE is reduced to 0.08 eV. Thermo-electric materials, especially those found in high temperatureenergy generators, usually undergo volume changes due tothermal expansion. If we assume that the thermal expansion
Fig. 8 The measured temperature dependence of (a) electrical resistivity, (b) thermal conductivity, (c) Seebeck coefficient and (d) zT of trigonalTmohAgohTe2 (black) and tetragonal TmohAgthTe2 (red).
Journal of Materials Chemistry C Paper
Publ
ished
on
13 A
ugus
t 201
5. D
ownl
oade
d by
Law
renc
e Be
rkel
ey N
atio
nal L
abor
ator
y on
24/
11/2
015
21:1
0:28
.
View Article Online
trigonal tetragonal
Zhu et al., J. Mater. Chem. C, 3, 10554 (2015)
1. Limitations of Constant Relaxation Time Approximation
/4219
LIU, ZHOU, LIAO, SINGH, AND CHEN PHYSICAL REVIEW B 95, 075206 (2017)
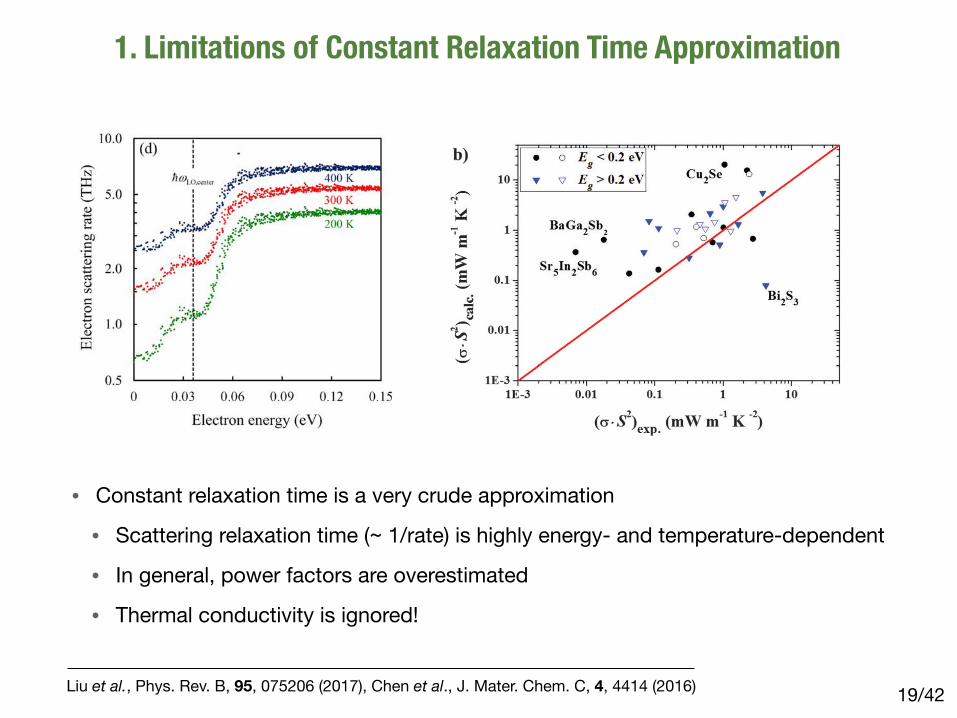
FIG. 2. (a) Electron scattering rate with respect to different electron energies at 300 K. The red dots are computed by present first-principlescalculations. The black (total) and gray-dash (each valley) lines are predicted by the semiempirical models including acoustic-deformation-potential, piezoelectric, and polar-optical-phonon scatterings, which are listed in Table I. The parameters in these formulae are provided inRef. [8]. (b) Electron scattering rate with respect to different electron energies due to each phonon mode at 300 K. (c) LO-phonon-limitedelectron scattering rate near the ! point at 300 K. The black and gray dots are the scattering rates due to LO-phonon emission and absorptionprocesses, respectively. The dark-red dots represent the total scattering. (d) Electron scattering rate near the ! point at 200, 300, and 400 K,represented by green, red, and blue dots, respectively.
versus energy at the ! valley that is in contrast with the model’sprediction, which can be attributed to the nonparabolicity ofthe conduction band of GaAs as was discussed before [8].In the higher-energy valleys, the models reveal surprisinglysignificant inconsistencies compared to first-principles cal-culations, particularly at the X valley. These discrepanciesmainly come from the lack of consideration of the intervalleyscattering in the semiempirical model [8]. Overall, the mobilityevaluated through semiempirical modeling is 4930 cm2/Vsat 300 K, while the first-principles calculation presents a
more reasonable value of 7050 cm2/Vs under RTA. Thesetwo effects—non-parabolicity of the conduction band andintervalley scattering—are automatically included in the first-principles calculation, but they are difficult to incorporateotherwise, especially when modeling complex band structures.
With the first-principles approach, as displayed in Fig. 2(b),we can now look at the contribution by EPI from each phononmode with respect to different energies and valleys. For polarmaterials, the majority of momentum change of electronsresults from the scattering by LO phonons, which has been
075206-6
Liu et al., Phys. Rev. B, 95, 075206 (2017), Chen et al., J. Mater. Chem. C, 4, 4414 (2016)
• Constant relaxation time is a very crude approximation
• Scattering relaxation time (~ 1/rate) is highly energy- and temperature-dependent
• In general, power factors are overestimated
• Thermal conductivity is ignored!
This journal is©The Royal Society of Chemistry 2016 J. Mater. Chem. C, 2016, 4, 4414--4426 | 4419
First, we discuss results for the Seebeck coefficients (seeTable S1, ESI† for the full data set). As depicted in Fig. 5(a),the calculated Seebeck coefficient correlates strongly with theexperimental data for most materials, but tends to be under-estimated. The smaller computed Seebeck coefficient can betraced to the underestimation of the experimental band gapenergy, which is on average approximately 0.15 eV (38%) lowerthan the experimental band gap energy over our data set for thecomparison. In particular, thermoelectric compounds with lowGGA band gap energies (o0.2 eV; black dots in Fig. 5(a)) appearto have greater discrepancies with experiment. It is importantto note that compounds computed to have zero band gap canexhibit an incorrect sign of the Seebeck coefficient (negative Sfor p-type and positive S for n-type; see red circles in Fig. 5(a) andTable S1, ESI†). The Pearson correlation coefficient for this data setis 0.79 and the Spearman rank correlation coefficient is 0.62.
To see whether correcting the band gap problem would leadto better agreement, we recalculated the data set after applyinga ‘scissor operation’51,52 to compounds for which the discrepancyin band gap was larger than 50%. The scissor operation matchesthe computational band gap to the experimental value but retainsthe other features of the original band structure. With thescissored band gap energies, the agreement between experi-mental and computed Seebeck coefficients significantly improvesas indicated in Fig. S3(a) and Table S2 (ESI†). With the applicationof scissoring, the Pearson correlation coefficient increases to 0.90and the Spearman’s rank correlation coefficient increases to 0.91.We note that the band gap energies of Ag2Se (mp-568889) andCu2Te (mp-1861), for which the sign of Seebeck coefficient isincorrect, could not be scissored due to zero GGA band gap.
We note that Mg2Sn (mp-2343) exhibits a higher calculatedSeebeck coefficient (!213 mV K!1) than the experimental value(!71.5 mV K!1) after the ‘scissor’ operation.53 It is possible thatthis stems from the difficulty in determining an accurate bandgap energy (the range of reported experimental band gapenergies is Eg = 0.16–0.33 eV54,55). An additional source of error
in this analysis is that carrier concentrations are taken fromexperimental Hall measurements, which tend to underestimatethe carrier concentration.56 Despite these issues, we find thatcomputational assessments of the Seebeck coefficients underthe approximations employed generally match well with experi-mental data and are appropriate for high-throughput screening.
In addition to analyzing the Seebeck coefficient, we alsocompare the computed power factor under a constant and universalrelaxation time approximation to experiment (Fig. 5(b), andTable S3, ESI†). Although Fig. 5(b) shows qualitative agreementbetween computation and experiment, we observe a largerdiscrepancy than for the Seebeck coefficient. This is alsoreflected in the lower Pearson (0.33) and Spearman rank (0.48)coefficients. In contrast to the Seebeck coefficient, scissoring theband gap does not appear to improve the result (ESI,† Fig. S3(b)and Table S4). For the scissored data, the Pearson coefficient is0.30 and the Spearman rank correlation coefficient is 0.33. It issurprising that the scissored power factors exhibit a weakercorrelation than the un-scissored values, especially because theSeebeck coefficient improved with scissoring.
One major reason for the difficulty in computing powerfactors is likely the constant, universal relaxation time approxi-mation (t = 10!14 s) used in our high-throughput calculations.The relaxation time should instead depend on several factors,including the selection of material, temperature, and level ofimpurities in the microstructure. Further, it will be energy-dependent;57,58 in most thermoelectric materials, the relaxationtime decreases with temperature due to acoustic phonon–electron interactions.59,60 Our results indicate that ignoringthese factors leads to only very rough qualitative agreement.
As a potential example of how non-uniform relaxation timemight have affected our results, in Bi2S3 (mp-22856) thin films,the experimentally measured power factor is higher than thecalculated value. This could be because the relaxation time inthe highly crystalline and oriented crystals61 used in experi-ments is likely larger than the value assumed in the calculation.
Fig. 5 Comparison of the calculated and experimental (a) Seebeck coefficients and (b) power factors for different thermoelectric materials (filledsymbols) and the extrinsic doped compounds (hollow symbols). The red circles indicate that the sign of the Seebeck coefficient was incorrect (see Table S1,ESI†), and the red lines indicate equality of computation and experiment. The calculations are based on the Boltzmann transport equation applied to MPband structures under a constant relaxation time approximation, with temperature and carrier concentration set to conditions where experiments reach themaximum value of the quantity being investigated (Seebeck coefficient in panel (a), power factor in panel (b)). A major source of error appears to beunderestimation of band gaps in DFT, as indicated by the poorer agreement for materials with small DFT band gaps (black circles) versus intermediate/largegaps (blue triangles).
Paper Journal of Materials Chemistry C
Publ
ished
on
31 M
arch
201
6. D
ownl
oade
d by
Nat
iona
l Ren
ewab
le E
nerg
y La
bora
tory
on
17/0
8/20
17 2
2:22
:03.
View Article Online
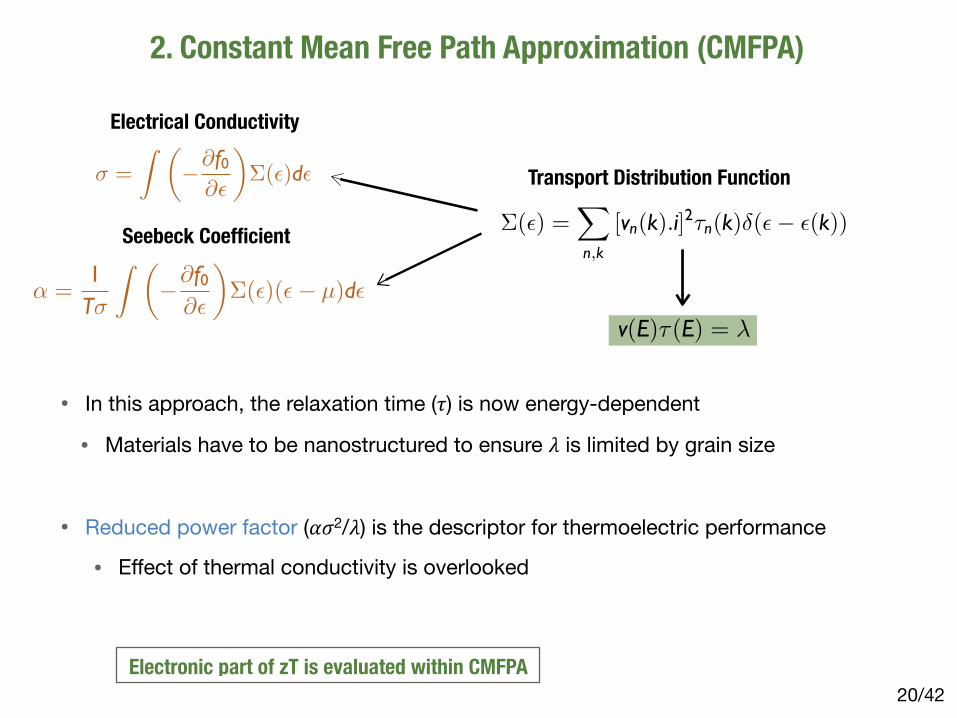
2. Constant Mean Free Path Approximation (CMFPA)
/4220
� =
� ���f0
��
��(�)d�
Electrical Conductivity
� =1T�
� ���f0
��
��(�)(� � µ)d�
Seebeck Coefficient �(�) =�
n,k
[vn(k).i]2�n(k)�(� � �(k))
Transport Distribution Function
v(E)�(E) = �
• In this approach, the relaxation time (𝜏) is now energy-dependent
• Materials have to be nanostructured to ensure 𝜆 is limited by grain size
• Reduced power factor (𝛼𝜎2/𝜆) is the descriptor for thermoelectric performance
• Effect of thermal conductivity is overlooked
Electronic part of zT is evaluated within CMFPA

2. Example and Limitations
/4221
196 NATURE MATERIALS | VOL 12 | MARCH 2013 | www.nature.com/naturematerials
However, because the catalysis problem is very complex, these descriptors are reaction specific and their identification requires preliminary analysis of the reaction steps. This is in contrast to the previous examples where a general descriptor of the sought-for functionality is heuristically deduced from the underlying physics and directly employed to screen for candidate materials.
Computational design studies of catalysts carried out in recent years reflect this complexity and include a few principal steps. First, the elementary steps of the reaction, including all the intermediate chemical species, are identified. The energetics of each step, includ-ing dissociation and adsorption energies and reaction barriers are evaluated for a number of transition metal surfaces by density functional theory (DFT) calculations, and the active sites, usually a kink or step on the surface at which the activation energies are lowest, are also determined for the specific reaction. Next, correla-tions are identified between the adsorption energies of the differ-ent adsorbates and intermediate species (scaling relations100), and between these adsorption energies and their associated transition-state activation energies (Brønsted–Evans–Polanyi relations87,88,101). The determination of these relations is of central importance for computational catalyst design, as it allows one to model the catalytic reaction in terms of the minimal number of independent chemi-cal parameters, the descriptors of the process. These descriptors
are usually the adsorption energies of the main components of the reactants, which are much easier to evaluate by DFT calculations than activation energies. They can therefore be implemented as practical descriptors of catalytic processes involving dissociation of simple molecules on a metal surface102. It is important to note that each active surface site defines a different set of these relations and therefore it is crucial to identify those that lead to the highest reac-tion rate and the best catalyst.
Once the appropriate descriptor or descriptors have been identi-fied, they are related to measured or calculated total reaction rates for the various metals87,96, leading to volcano-shaped plots where the optimal catalyst can be identified as the one lying closest to the top of the volcano. These volcano plots emerge due to a fundamental con-cept in catalysis, the Sabatier principle, stating that for an efficient catalysis the interaction between the surface and reactant should not be too strong nor too weak103. When interactions are too weak, reac-tants will not bind to the catalyst and reaction will not take place. In contrast, if the binding is too strong the catalyst will get blocked, poisoned by reactants or intermediates, or the products will fail to dissociate. Using the volcano plot, the optimal catalyst may be found from a much larger set of candidates than the transition metals used to construct it, because for these candidates the evaluation requires the calculation of only a small number of descriptors. Additional considerations, such as the estimated structural stability and selec-tivity at the appropriate chemical environment, and cost of the can-didates, can be included in the search87,88,96.
Several descriptor-based searches for new heterogeneous cata-lysts have been reported in recent years, each screening a few dozen metal surfaces and surface alloys for various chemical reac-tions12,87,96,97,99,104–108. Figure 5 shows the results of one of these stud-ies (Greeley et al.96): the volcano plot (Fig. 5a) and the optimum active surface alloys for a hydrogen evolution reaction (Fig. 5b). Furthermore, among the predictions made by Studt et al.107, NiZn has been experimentally verified to have better selectivity than the traditional Ag–Pt catalyst at a fraction of the cost, because it con-tains no precious metals.
Battery materials for energy storage. Efficient energy storage, with high capacity and long cycling lifetime, is one of the main issues in the development of sustainable clean-energy technolo-gies. Lithium-ion batteries are the state of the art in this field. They operate by the transfer of lithium ions from a high chemical poten-tial anode to a low chemical potential cathode through an ion-conducting electron-insulating electrolyte while the electrons flow through an external circuit. Recharging is performed by applying an external potential, forcing the Li ions to migrate back from the cathode to the anode. Almost all anodes currently in use are based on graphite, due to its Li storage capacity, and cycling and safety characteristics109. The electrolytes are solutions of Li salts in organic solvents110. Several recent attempts have been made to enhance the anode capacity without degrading cycling and safety, using MoSi2-based compounds111,112. However, the main route taken by current research to improve Li-ion batteries is to seek new cathode materi-als with superior properties27,113. Finding new battery components experimentally might be impractical due to the very large chemi-cal space and the difficulty of the experiments. High-throughput computational research can make a difference, but as pointed out by Ceder et al.27, a few physical parameters have to be taken into account in addition to structure stability. The search for better mate-rials is a complicated multistep process, with constraints in terms of safety, toxicity, weight, capacity, charge and discharge rates, recycla-bility and cost28,114.
The search consists of three steps. First, it starts with a set of candidate chemistries, namely, chemical compositions containing high concentrations of Li ions, a redox active metal, and oxygen or oxide ions (carbonate, borate, phosphate, silicate or arsenate)
p-doped
10
Power factorSeebeck
Power factorSeebeck
O7 P
2 W1 (#904390)
Ce1 O
3 Sr1 (#71352)
Br1 F4 N
1 O2 (#412427)
Ba1 N
2 O6 (#34902)
N2 O
6 Sr1 (#35494)
N2 O
6 Pb1 (#52350)
Ce1 I4 O
12 (#16665)
B2 Na
1 O5 Sc
1 (#409522)
O6 W
1 Y2 (#20955)
Ba1 N
2 O6 (#35495)
B2 Ce
3 Cl3 O6 (#413237)
O5 Ti1 Y
2 (#34692)
Nb2 O
6 Zn1 (#36290)
Ce1 O
6 Se2 (#60778)
Cl12 Ta2 Te
4 (#401907)
Mo
1 O7 P
2 (#202810)
Ca1 Nb
2 O6 (#15208)
Ce1 O
7 P2 (#160452)
B2 Cs
3 Li2 Na1 O
6 (#36531)
O18 Ti10 (#31399)
102
103
10
102
104
103
10
102
103
n-dopeda
b
P/L (
µW c
m–1
K–2 n
m–1
)P/
L (µW
cm
–1 K–2
nm
–1)
10
102
103
|S| (µV K
–1)|S| (µV
K–1)
O3 Y
2 (#16394)
F6 Te
1 (#67609)
Cl12 Ta2 Te
4 (#401907)
C3 N
4 (#83263)
O3 Sr1 Zr1 (#41083)
La2 O
3 (#96201)
Cl6 Cs2 Sn
1 (#9023)
F1 Na
3 O4 W
1 (#417289)
O7 P
2 Sn1 (#30583)
Al6 Ca4 O
16 S1 (#28480)
F6 Na
1 Sb1 (#25538)
Cd3 Na
2 O10 Si3 (#28416)
O5 Si1 Sr3 (#18151)
Lu2 O
3 (#33659)
F6 O
2 Sb1 (#78849)
Gd2 O
3 (#27996)
Ce2 O
3 (#96202)
Br2 Hg2 O
6 (#31925)
B2 Cs
3 Li2 Na1 O
6 (#36531)
O18 Ti10 (#31399)
Figure 4 | Example of an HT search for nanosintered thermoelectric materials. a,b, In the limit of very small grains, the direction averaged power factor ⟨P⟩ is roughly proportional to the grain size, L. Using the theoretically calculated ⟨P⟩/L at the optimized Fermi level position for n- and p- conduction, 3,000 compounds were analysed. The 20 best compounds in the two lists are shown in a (n-doped) and b (p-doped), along with the calculated Seebeck coefficient at optimal doping. Figure adapted with permission from ref. 15, © 2011 APS.
REVIEW ARTICLE NATURE MATERIALS DOI: 10.1038/NMAT3568
© 2013 Macmillan Publishers Limited. All rights reserved
• HT screening of ~2500 materials from the ICSD
• TiO2 Magneli phases and Cs3Li2NaB2O6 identified as promising candidates
• Candidates remain experimentally unverified
• Well-known thermoelectrics not identified
• Limitations: mean free path assumed constant for all materials
• Some materials have to be nanostructured below 5 nm
• Thermal stability of nanostructured materials is an issue

Questions?
/4222
PERSPECTIVE | FOCUS
Fishing the Fermi seaPAUL C. CANFIELDis at Ames Laboratory, and Department of Physics and Astronomy, Iowa State University, Ames, Iowa 50011, USA.e-mail: [email protected]
Within the field of solid-state physics, the discovery of remarkable phases and transitions is often tightly coupled to the design,
discovery and growth of novel materials. The past several decades of work in the field of correlated electron physics — that is, the study of materials in which the interactions are sufficiently strong that conventional single-electron theories don’t apply — can be described by a list of materials that have defined new extremes, be it extremes of temperature, field, pressure, complexity or, even better, simplicity. In retrospect, it is often clear why, or how, a compound is an excellent example of this or that effect, but one of the nagging questions that is asked at the end of a day, over a beaker of diluted ethanol and/or caffeine, is “where will the next key material be found?” or “what will be the next ________ [fill in your current obsession]?” Often this question seems to be akin to “where will the next bolt of lightning strike?”
In truth, the answer to all of these questions is statistical in nature. Although discovery and ‘lightning strikes’ cannot be fully controlled, their probability can be enhanced through a series of choices. The design of new materials, at least in bulk crystalline form, is an exercise in trying to improve the odds of finding something interesting. This requires some ideas of how to improve the odds, and some methods of checking whether you have succeeded or not.
To try to design and/or discover a material that will exhibit a specific property, there often needs to be some model or idea of which parameters are important and how to influence or control them. (This guiding principle is often an admixture between theory and practical concerns, such as
which elements or compounds can be readily — and safely — used.) For an intermetallic material with magnetic properties, the tendency is to look at compounds with 3d transition metals and/or rare-earth (4f) elements. To minimize anisotropy, use Gd or divalent Eu (spin S = 7/2, angular momentum L = 0 moments will have no anisotropy induced by crystalline electric field (CEF) splitting). To study hybridization physics and heavy-fermion compounds
(in which entropy is transferred from f-orbitals to conduction electrons, and the interacting electrons can be treated as non-interacting ‘heavy’ electrons), choose a rare-earth or actinide that is known to be predisposed to interactions between the f and p or d orbitals, which means ambivalent ions such as Ce, Eu, Yb, U or to a lesser extent, Pr, Sm and Tm. For higher-transition-temperature intermetallic superconductivity, try to use light elements and aim for stiff
Sophocles had it right, the Rolling Stones made a friendly amendment and Linus Pauling detailed the conceptual mechanism for finding novel materials that will define and revolutionize the future.
Figure 1 Humanity realized long ago that skilled fishermen could feed villages and cities. Those skilled in the art of finding the ‘right place’ to fish were deeply respected and even depicted in art, such as this mosaic at the Archaeological Museum at Sousse, Tunisia.
AKG-
IMAG
ES/G
ILLES
MER
MET
nature physics | VOL 4 | MARCH 2008 | www.nature.com/naturephysics 167
P. C. Canfield, Nature Physics 4, 167 (2008)
The scientist who is skilled in the art of new materials design and discovery will develop a variety of strategies for identifying promising spots to fish for new materials and ground states.

3. Semi-empirical Thermoelectric Quality Factor
/4223
constant core T-dep
zT =u�
(v� + 1)zT =
�2�T(�L + �e)
Yan, Gorai, Stevanovic, Toberer et al, Energy Environ. Sci. 8, 983 (2015)
Charge carrier mobilityLattice thermal conductivity
GaAs
InI
Cu3TaTe4
SrTiO3
GaP
SiC
d-C
PbTe
Mg2SiCa5In2Sb6
Bi2O3
MoTe2
SrIn2O4
ZnGeP2
Ga2O3BP
AlN
AlPSi
Mod
eled
κ L (W
m-1
K-1)
0.1
1
10
100
1000
Experimental κL (Wm-1K-1)0.1 1 10 100 1000
Miller, Gorai, Stevanovic, Toberer et al, Chem. Mat. 29, 2494 (2017)
�L = A1Mvys
T�2Vznx+3kB2
��
6
�1/3 vsVz
�1� 1
n2/3
�

3. Example: Search for New Binary A1B1 Thermoelectric Materials
/4224
SnSe(Cmcm)
PbTe
ZnSb
GeTe
PbSe
InSeSnTePbS
MnTeSnS
zTm
ax
0.5
1.0
1.5
2.0
2.5
Space Group Number0 50 100 150 200 250
rocksalt
Cou
nt
02468
10
Stoichiometry
1,11,2 1,3 2,3 3,4 1,1
,21,2
,2 1,3,3
1,2,3
1,3,4
1,3,7 1,4
,62,5
,6 1,1,1,
11,1
,11,14
4,9,9
Gorai, Toberer, Stevanovic et al., Chem. Mater. 18, 6213 (2015), Cho et al. Nature Comm. 7, 13713 (2016)
SnTe
GeTep-typen-type
SnTe
PbSePbTe
LaN
PbSeSnSeCdSb
InIAgBrPbSAgI
PbSGeSe
GeTe
PbSPbTe
space group 3-15 16-74 75-142 143-167 168-194 195-230
ZnSbPbSe
AlSb
CdSb
PbSInSe
MnSePbO
GaTe
SnSe
bubble radius scales with β
• Nearly 30% of known thermoelectric materials are A1B1 compounds
• Known thermoelectric materials are correctly identified with β
• Identified new candidate materials; independent re-discovery (n-type SnSe, zT = 2.2)
orthorhombic

3. Example: Computational Identification of Quasi-2D TE Materials
/4225
CsBi4Te6
BiCuSeO
InSe
Sr3GaSb3
Bi2Te3
SnSe
Sb2Te3
CaZn2Sb2Ca3AlSb3
Quasi Low-dimensional Materials
zTm
ax
0
1
2
3
Lattice Therm. Conduc (Wm-1K-1)1 10
valence band conduction band
Sb2Te3 (12)
ZrTe5
SnSe (63)
PbSe
PbS (36)
SnS (63)
TlI
SnI2
Sb2Te3 (166)
In2Te5
HgI2
(cm
2V
-1s
-1)
10 1
1
101
102
103
104
L (Wm-1
K-1
)
1 10
Sb2Te3 (12)
GeAs2 PbSe (62)
PbS (39)
SnSe (62)
SbTe
BiI3
GaTe(194)
ZrTe5
InSeIn2Se3
L (Wm-1
K-1
)
1 10
Bulk modulus
1-10 10-20 20-30 30-40 40-50 >50(GPa)
Bi2Te3Bi2Te3
Screening of 427 binary quasi-2D layered materials
Gorai, Toberer and Stevanovic, J. Mater. Chem. A 4, 11110 (2016)
• Quasi low-dimensional structures are abundant among TE materials

3. Semi-empirical Descriptor: Limitations
/4226
• By design, semi-empirical models will not capture phenomena not represented in the learning dataset
• Can be improved by including more experimental data in learning dataset
• Assumption: transport is isotropic
• Assumption: phonon-phonon interactions are harmonic (lattice thermal conductivity)
Pei et al., Nature Lett. 473, 66 (2011)
LETTERdoi:10.1038/nature09996
Convergence of electronic bands for highperformance bulk thermoelectricsYanzhong Pei1, Xiaoya Shi2, Aaron LaLonde1, Heng Wang1, Lidong Chen2 & G. Jeffrey Snyder1
Thermoelectric generators, which directly convert heat into elec-tricity, have long been relegated to use in space-based or otherniche applications, but are now being actively considered for avariety of practical waste heat recovery systems—such as the con-version of car exhaust heat into electricity. Although these devicescan be very reliable and compact, the thermoelectric materialsthemselves are relatively inefficient: to facilitate widespreadapplication, it will be desirable to identify or develop materials thathave an intensive thermoelectric materials figure of merit, zT,above 1.5 (ref. 1). Many different concepts have been used in thesearch for new materials with high thermoelectric efficiency,such as the use of nanostructuring to reduce phonon thermal con-ductivity2–4, which has led to the investigation of a variety of com-plex material systems5. In this vein, it is well known6,7 that a highvalley degeneracy (typically #6 for known thermoelectrics) in theelectronic bands is conducive to high zT, and this in turn hasstimulated attempts to engineer such degeneracy by adoptinglow-dimensional nanostructures8–10. Here we demonstrate that itis possible to direct the convergence of many valleys in a bulk materialby tuning the doping and composition. By this route, we achieve aconvergence of at least 12 valleys in doped PbTe1 2 xSex alloys, lead-ing to an extraordinary zT value of 1.8 at about 850 kelvin. Bandengineering to converge the valence (or conduction) bands toachieve high valley degeneracy should be a general strategy in thesearch for and improvement of bulk thermoelectric materials,because it simultaneously leads to a high Seebeck coefficient andhigh electrical conductivity.
A high thermoelectric figure of merit, ZT, for a high-efficiencythermoelectric generator requires the constituent n-type and p-typematerials each to have a high average thermoelectric materials figure ofmerit, zT 5 S2sT/(kE1kL), where T, S, s, kE and kL are the temper-ature, Seebeck coefficient, electrical conductivity, and the electronicand lattice components of the thermal conductivity, respectively. Todate, commercial products for thermoelectric power generation utilizeonly PbTe- or Bi2Te3-based materials with peak zT of less than unity5.
Recent efforts to raise the zT value of PbTe have focused on nanos-tructured composites, such as Na12xPbmSbyTem12 (ref. 3), where theaim is to reduce kL and thus to enhance zT; indeed zT . 1 has beenobtained in many instances2. Such materials have kL close to theamorphous limit2,4, lending greater potential to the increasing of zTby the enhancement of the electronic component (S2s). Seebeck coef-ficient enhancement through density of states modification8,11 is apromising route, but this approach risks the reduction of carriermobility.
The optimal electronic performance of a thermoelectric semi-conductor depends primarily on the weighted mobility6,7,12, m(m*/me)
3/2; here m* is the density-of-states effective mass, m is the mobilityof carriers, and me is the electron mass. However, m is low for bandswith heavy mass mb* (the band-mass of a single valley, or mass of asingle pocket of Fermi surface related to 1/(d2E/dk2) of the pocket). Infact, for charge carriers predominantly scattered by acoustic phonons
(as has been found to occur in most good thermoelectric materials),it is expected that m / 1/mb*
5/2 (ref. 7). Therefore, increasing theband-mass should be detrimental to the thermoelectric performance7.
In contrast, the convergence of many charge carrying valleys hasvirtually no detrimental effects. Multiple degenerate valleys (separatepockets of Fermi surface with the same energy) have the effect ofproducing large m* without explicitly reducing m. A valley degeneracyNv has the effect of increasing m* by a factor of Nv
2/3. Specifically, thedensity-of-states effective mass used to analyse most thermoelectricdata is given by m*5 Nv
2/3mb* (refs 6, 7, 12, 13), where Nv includesorbital degeneracy, and mb* is, more specifically, the average (singlevalley) density-of-states effective mass of the degenerate valleys(including the effect of spin degeneracy but not orbital degeneracyor degeneracy imposed by the symmetry of the Brillouin zone)6. Themobility is nominally unaffected by Nv, but there may be some reduc-tion due to intervalley scattering.
It is thus clear that a large valley degeneracy is good for thermoelec-tric materials6,7,12,13. More generally, bands may be regarded as effec-tively converged when their energy separation is small (compared withkBT, where kB is the Boltzmann constant); this leads to an effectiveincrease in Nv, even when the bands are not exactly degenerate. Theconcept of carrier pocket engineering to produce convergence (highNv) of symmetrically inequivalent bands has been suggested in thecontext of manipulating low-dimensional thermoelectric nano-structures8–10. Extending this concept to bulk materials would be mostuseful for rapid integration into commercial devices.
Convergence of many valleys can occur in high symmetry crystalstructures (such as PbTe and (Bi, Sb)2Te3) if the Fermi surface formsisolated pockets at low symmetry points. The widely used thermoelec-tric material (Bi,Sb)2Te3 has significant valley degeneracy, with Nv 5 6in both the conduction and valence bands7. The valence bandextremum in PbTe occurs at the L point in the Brillouin zone, where
1Materials Science, California Institute of Technology, Pasadena, California 91125, USA. 2CAS Key Laboratory of Materials for Energy Conversion, Shanghai Institute of Ceramics, Chinese Academy ofSciences, Shanghai 200050, China.
–0.4
–0.2
0.0
kz
0.2~900~500
CC
∆EC-L
b
Ener
gy (e
V)
T (K)
L
L
C
L
∆EC-Σ
0
a
ky
L
Σ
ΣΣ Σ
kx
Figure 1 | Valence band structure of PbTe1 2 xSex. a, Brillouin zone showingthe low degeneracy hole pockets (orange) centred at the L point, and the highdegeneracy hole pockets (blue) along theS line. The figure shows 8 half-pocketsat the L point so that the full number of valleys, Nv, is 4, while the valleydegeneracy of the S band is Nv 5 12. b, Relative energy of the valence bands inPbTe0.85Se0.15. At ,500 K the two valence bands converge, resulting intransport contributions from both the L and S bands. C, conduction band; L,low degeneracy hole band; S, high degeneracy hole band.
6 6 | N A T U R E | V O L 4 7 3 | 5 M A Y 2 0 1 1
Macmillan Publishers Limited. All rights reserved©2011
Fermi surface: PbTe
valence band (orange),conduction band (blue)

3. Descriptor Improvements: Incorporating Anharmonicity in 𝜅L
/4227
GaAs
InI
Cu3TaTe4
SrTiO3
GaPGaN
SiC
d-CPbTe
factor of 5
Mod
eled
κ L (W
m-1
K-1)
0.1
1
10
100
1000
Experimental κL (Wm-1K-1)0.1 1 10 100 1000
Incorporating coordination as a measure of anharmonicity, improves prediction
Original Model
Miller, Gorai, Stevanovic, Toberer et al., Chem. Mater., 29, 2494 (2017)
GaAsInI
Cu3TaTe4
SrTiO3
GaP
GaNSiC
d-C
PbTe
factor of 2
Mg2Si
Mod
eled
κ L (W
m-1
K-1)
0.1
1
10
100
1000
Experimental κL (Wm-1K-1)0.1 1 10 100 1000
Improved Model
�L = A1Mvys
T�2Vznx+3kB2
��
6
�1/3 vsVz
�1� 1
n2/3
�

Something Missing in Descriptors: Dopability
/4228
zT =��2
(�L + �e)T
Thermoelectric Figure of Merit
• Complex function of
• Intrinsic material properties
• Temperature
• Carrier concentration (doping)
REVIEW ARTICLE
nature materials | VOL 7 | FEBRUARY 2008 | www.nature.com/naturematerials 107
The Lorenz factor can vary particularly with carrier concentration. Accurate assessment of κe is important, as κl is often computed as the difference between κ and κe (equation (3)) using the experimental electrical conductivity. A common source of uncertainty in κe occurs in low-carrier-concentration materials where the Lorenz factor can be reduced by as much as 20% from the free-electron value. Additional uncertainty in κe arises from mixed conduction, which introduces a bipolar term into the thermal conductivity10. As this term is not included in the Wiedemann–Franz law, the standard computation of κl erroneously includes bipolar thermal conduction. This results in a perceived increase in κl at high temperatures for Bi2Te3, PbTe and others, as shown in Fig. 2a. The onset of bipolar thermal conduction occurs at nearly the same temperature as the peak in Seebeck and electrical resistivity, which are likewise due to bipolar effects.
As high zT requires high electrical conductivity but low thermal conductivity, the Wiedemann–Franz law reveals an inherent materials conflict for achieving high thermoelectric efficiency. For materials with very high electrical conductivity (metals) or very low κl, the Seebeck coefficient alone primarily determines zT, as can be seen in equation (4), where (κl/κe) << 1:
2
1 + =
lе
.
(4)
LATTICE THERMAL CONDUCTIVITYGlasses exhibit some of the lowest lattice thermal conductivities. In a glass, thermal conductivity is viewed as a random walk of energy through a lattice rather than rapid transport via phonons, and leads to the concept of a minimum thermal conductivity22, κmin. Actual glasses, however, make poor thermoelectrics because they lack the needed ‘electron-crystal’ properties — compared with crystalline semiconductors they have lower mobility due to increased electron scattering and lower effective masses because of broader bands. Good thermoelectrics are therefore crystalline materials that manage to scatter phonons without significantly disrupting the electrical conductivity. The heat flow is carried by a spectrum of phonons with widely varying wavelengths and mean free paths23 (from less than 1 nm to greater than 10 µm), creating a need for phonon scattering agents at a variety of length scales.
Thermoelectrics therefore require a rather unusual material: a ‘phonon-glass electron-crystal’24. The electron-crystal requirement stems from the fact that crystalline semiconductors have been the best at meeting the compromises required from the electronic properties (Seebeck coefficient and electrical conductivity). The phonon-glass requirement stems from the need for as low a lattice thermal conductivity as possible. Traditional thermoelectric materials have used site substitution (alloying) with isoelectronic elements to preserve a crystalline electronic structure while creating large mass contrast to disrupt the phonon path. Much of the recent excitement in the field of thermoelectrics is a result of the successful demonstration of other methods to achieve phonon-glass electron-crystal materials.
ADVANCES IN THERMOELECTRIC MATERIALS
Renewed interest in thermoelectrics is motivated by the realization that complexity at multiple length scales can lead to new mechanisms for high zT in materials. In the mid 1990s, theoretical predictions suggested that the thermoelectric efficiency could be greatly enhanced by quantum confinement of the electron charge carriers5,25. The electron energy bands in a quantum-confined structure are progressively narrower as the confinement increases and the dimensionality decreases. These narrow bands should produce high effective masses and therefore large Seebeck coefficients. In addition, similar sized, engineered heterostructures
may decouple the Seebeck coefficient and electrical conductivity due to electron filtering26 that could result in high zT. Even though a high-ZT device based on these principles has yet to be demonstrated, these predictions have stimulated a new wave of interest in complex thermoelectric materials. Vital to this rebirth has been interdisciplinary collaborations: research in thermoelectrics
0
0
1
2
zT
2
1
(2)
(1)
(3)
Carrier concentration (cm−3)
0
0.5
1
zT
zT
2
1018 1019 1020 1021
Carrier concentration (cm−3)
1018 1019 1020 1021
(Wm
−1 K
−1)
l = 0.8
l = 0.2
l = 0.8
l = 0.2
e
Figure 1 Optimizing zT through carrier concentration tuning. a, Maximizing the efficiency (zT) of a thermoelectric involves a compromise of thermal conductivity (κ; plotted on the y axis from 0 to a top value of 10 W m–1 K–1) and Seebeck coefficient (α; 0 to 500 µV K–1) with electrical conductivity (σ; 0 to 5,000 Ω–1cm–1). Good thermoelectric materials are typically heavily doped semiconductors with a carrier concentration between 1019 and 1021 carriers per cm3. The thermoelectric power factor α2σ maximizes at higher carrier concentration than zT. The difference between the peak in α2σ and zT is greater for the newer lower-κl materials. Trends shown were modelled from Bi2Te3, based on empirical data in ref. 78. b, Reducing the lattice thermal conductivity leads to a two-fold benefit for the thermoelectric figure of merit. An optimized zT of 0.8 is shown at point (1) for a model system (Bi2Te3) with a κl of 0.8 Wm–1 K–1 and κe that is a function of the carrier concentration (purple). Reducing κl to 0.2 Wm–1 K–1 directly increases the zT to point (2). Additionally, lowering the thermal conductivity allows the carrier concentration to be reoptimized (reduced), leading to both a decrease in κe and a larger Seebeck coefficient. The reoptimized zT is shown at point (3).
Rapid a priori prediction of material dopability is difficult
✓
✘
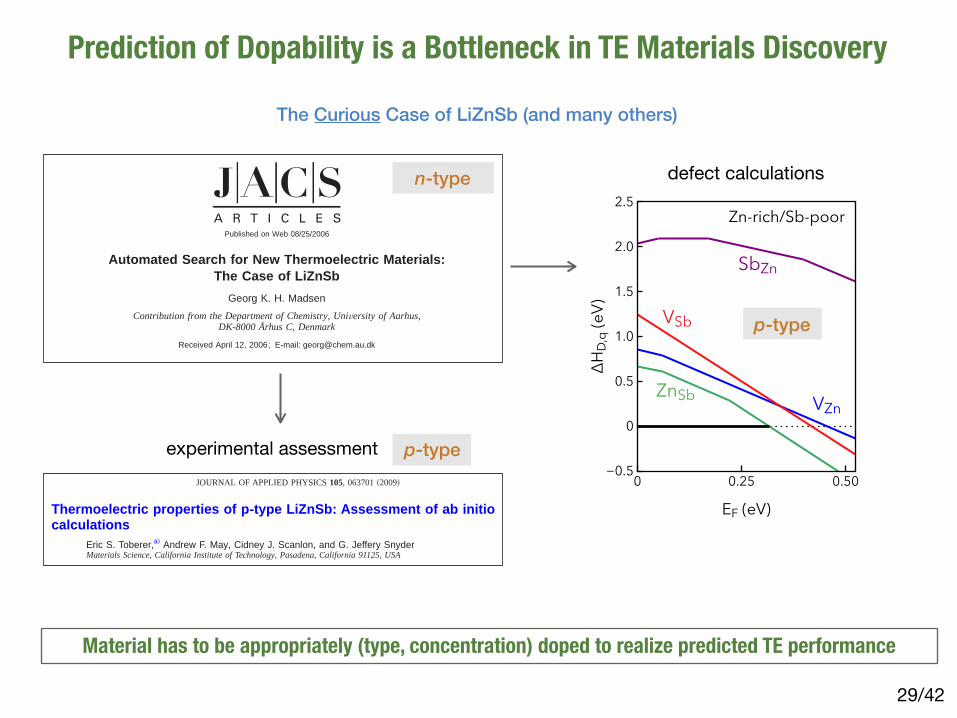
Prediction of Dopability is a Bottleneck in TE Materials Discovery
/4229
The Curious Case of LiZnSb (and many others)
Automated Search for New Thermoelectric Materials:The Case of LiZnSb
Georg K. H. MadsenContribution from the Department of Chemistry, UniVersity of Aarhus,
DK-8000 Århus C, Denmark
Received April 12, 2006; E-mail: [email protected]
Abstract: An automated band structure calculation based on the inorganic crystal structure database andthe augmented plane wave method for electronic structure calculations is presented. Using a rigid bandapproach and semiclassic Boltzmann theory the band structures are analyzed and a large number ofcompounds are screened for potential interesting thermoelectric properties. We thereby propose LiZnSbas a potential new thermoelectric material. The k-space structure of the lowest conduction band of LiZnSbis analyzed in detail, and excellent thermoelectric properties are expected for this material. Furthermorethe lattice dynamics are calculated, and anisotropic lattice thermal conduction is predicted.
I. Introduction
The search for new thermoelectric materials is a quest tomaximize the dimensionless figure of merit zT ) (σT/κ)S2,where S is the Seebeck coefficient and σ and κ are the electronicand thermal conductivities, respectively. zT quantifies theperformance of a thermoelectric, and one must thereforemaximize the power factor S2σ and minimize κ. As S, σ, and κ
are coupled and all depend strongly on the detailed electronicstructure, carrier concentration, and crystal structure, the taskof finding new compounds with large values of zT is extremelydifficult.
One idea that seems to run as a red thread through muchrecent research on thermoelectrics, including the work onclathrates1-9 and skutterudites,10-12 is the concept of a “PhononGlass Electron Crystal” (PGEC).13 This concept is based on theassumption that low-frequency optical modes, due to looselybound guest atoms inside a framework structure, will reduce
the lattice thermal conductivity thereby enhancing the figureof merit. The PGEC concept was introduced by Slack,13 whoalso established a correlation among the weighted mobility, theband gap, and the average electronegativity difference. Herebya number of semiconductors were suggested as potentiallyinteresting for thermoelectric applications.13 While the idea ofa PGEC has been highly influential, the use of the electro-negativity difference for predicting suitable electronic propertieshas been less used.
A different approach to rationally improving the electronicproperties of thermoelectrics is the analysis of band structurecalculations using Boltzmann theory. This ab initio approachhas been successful in rationalizing and predicting the optimaldoping level of known compounds5,11,14-17 but has seldomlybeen used to discover new interesting materials for thermoelec-tric applications. However, we do not see any reason why bandstructure calculations cannot be used to screen a large numberof potential candidates. As the underlying basis of Boltzmanntheory is well understood,18 one usually understands when itshould work. Briefly put, the crystal momentum should be welldefined so that k is a good quantum number. In a crystal, thismeans that the mean distances between scatterers, and therebythe mean free path of the electron, should be large compared tothe wavelength of the electron. Furthermore, the advance ofcomputational power, methodology, and standardized softwarehas made the calculation of band structures, even for a largesystem containing heavy atoms, quite straightforward. Finally,the calculation of a large number of structures is trivially parallel
(1) Nolas, G. S.; Cohn, J. L.; Slack, G. A.; Schujman, S. B. Appl. Phys. Lett.1998, 73, 178-180.
(2) Cohn, J. L.; Nolas, G. S.; Fessatidis, V.; Metcalf, T. H.; Slack, G. A. Phys.ReV. Lett. 1999, 82, 779-782.
(3) Paschen, S.; Carrillo-Cabrera, W.; Bentien, A.; Tran, V. H.; Baenitz, M.;Grin, Y.; Steglich, F. Phys. ReV. B 2001, 64, 214404.
(4) Sales, B. C.; Chakoumakos, B. C.; Jin, R.; Thompson, J. R.; Mandrus, D.Phys. ReV. B 2001, 63, 245113.
(5) Madsen, G. K. H.; Schwarz, K.; Blaha, P.; Singh, D. J. Phys. ReV. B 2003,68, 125212.
(6) Bentien, A.; Christensen, M.; Bryan, J. D.; Sanchez, A.; Paschen, S.;Steglich, F.; Stucky, G. D.; Iversen, B. B. Phys. ReV. B 2004, 69, 45107.
(7) Bentien, A.; Pacheco, V.; Paschen, S.; Grin, Y.; Steglich, F. Phys. ReV. B2005, 71, 165206.
(8) Pacheco, V.; Bentien, A.; Carrillo-Cabrera, W.; Paschen, S.; Steglich, F.;Grin, Y. Phys. ReV. B 2005, 71, 165205.
(9) Madsen, G. K. H.; Santi, G. Phys. ReV. B 2005, 72, 220301.(10) Sales, B. C.; Mandrus, D.; Williams, R. K. Science 1996, 272, 1325-
1327.(11) Singh, D. J.; Mazin, I. I. Phys. ReV. B 1997, 56, R1650-R1653.(12) Keppens, V.; Mandrus, D.; Sales, B. C.; Chakoumakos, B. C.; Dai, P.;
Coldea, R.; Maple, M. P.; Gajewski, D. A.; Freeman, E. J.; Bennington, S.Nature 1998, 395, 876-878.
(13) Slack, G. New materials and performance limits for thermoelectric cooling.In CRC Handbook of Thermoelectrics; Rowe, D. M., Ed.; CRC: BocaRaton, FL, 1995; pp 407-440.
(14) Møllnitz, L.; Blake, N. P.; Metiu, H. J. Chem. Phys. 2002, 117, 1302-1312.
(15) Scheidemantel, T. J.; Ambrosch-Draxl, C.; Thonhauser, T.; Badding, J.V.; Sofo, J. O. Phys. ReV. B 2003, 68, 125210.
(16) Thonhauser, T.; Scheidemantel, T. J.; Sofo, J. O. Appl. Phys. Lett. 2004,85, 588-590.
(17) Bertini, L.; Gatti, C. J. Chem. Phys. 2004, 121, 8983-8989.(18) Allen, P. B. Boltzmann theory and resistivity of metals. In Quantum Theory
of Real Materials; Chelikowsky, J. R., Louie, S. G., Eds.; Kluwer: Boston,MA, 1996; pp 219-250.
Published on Web 08/25/2006
12140 9 J. AM. CHEM. SOC. 2006, 128, 12140-12146 10.1021/ja062526a CCC: $33.50 © 2006 American Chemical Society
n-type
Thermoelectric properties of p-type LiZnSb: Assessment of ab initiocalculations
Eric S. Toberer,a! Andrew F. May, Cidney J. Scanlon, and G. Jeffery SnyderMaterials Science, California Institute of Technology, Pasadena, California 91125, USA
!Received 25 November 2008; accepted 27 January 2009; published online 17 March 2009"
In response to theoretical calculations on the thermoelectric performance of LiZnSb, we report thepertinent transport properties between room temperature and 523 K. Nominal LiZnSb samples arefound to be p-type, with a carrier concentration in the range !4–7"!1020 cm−3. The thermoelectricfigure of merit !zT" is found to be 0.02–0.08 at 523 K. Analysis of material transport parameters andpreviously reported ab initio calculations demonstrates that even with optimal doping, p-typeLiZnSb is unlikely to achieve zT"0.2 at 523 K. The accuracy of the high zT estimate !zT"2" forn-type compositions from ab initio calculations is discussed within the current synthetic limits.© 2009 American Institute of Physics. #DOI: 10.1063/1.3091267$
I. INTRODUCTION
The development of a high efficiency thermoelectric ma-terial remains an outstanding challenge.1 Such an unprec-edented material would lead to the widespread use of ther-moelectric materials for efficient, solid state refrigeration,and electricity production. The scalability and simplicity ofthermoelectric generators makes them particularly attractivefor electricity generation from waste heat and cogenerationsources. As a heat engine, the conversion efficiency of athermoelectric generator is determined by the product of theCarnot efficiency and a material-dependent term which is anincreasing function of the material figure of merit !zT". Thethermoelectric figure of merit is determined by the Seebeckcoefficient !#" and the electrical !$" and thermal !%" conduc-tivity,
zT =#2$
%T .
One of the great opportunities for research in thermoelectricmaterials is the use of robust computational methods to pre-dict transport properties. Computational studies complementexperimental work in several ways: !a" a large number ofcompounds can be screened for thermoelectric performance,!b" predictions of optimum carrier concentrations can guidedoping studies, and !c" aid in the explanation of transportproperties in current state-of-the-art thermoelectric materialsto facilitate the discovery of similar compounds.2 Much ofthe prior work involving band structures of thermoelectricshas focused on explaining experimentally observed transportbehavior and predicting chemical modifications for improvedperformance.3 Purely computational approaches to predictthermoelectric transport behavior are nontrivial becausecomputational zT values require !at a minimum" values forthe carrier relaxation time, &, and lattice thermal conductiv-ity, %L. In 2006, Madsen4 developed an algorithm to screenantimony containing compounds !%500 examined" for ther-
moelectric performance using band structure calculationsand semiclassical Boltzmann theory. Constant values of &=2!10−14 s and %L=2 W /m /K were utilized by Madsen.
The most promising material in Madsen’s investigationwas LiZnSb, with an estimated zT%2 at 600 K !for transportin the ab plane" when doped n-type to %8!1019 cm−3
!0.01e− /u.c.". High thermoelectric efficiency in a compoundcontaining Zn and Sb is not unprecedented; alloys of Zn–Sbwere investigated for thermoelectric effects as early as1823.5 The stoichiometric compound ZnSb has a peak zT of0.6 at %600 K and more recently Zn4Sb3 has shown a peakzT of 1.3 at 943 K.6 Ternary compounds based on Zn and Sbhave also shown promise for thermoelectrics:Ca1−xYbxZn2Sb2 exhibits a peak zT of %0.6 and the structur-ally distinct BaZn2Sb2 has a peak zT of 0.3.7,8 The goodthermoelectric properties of Zn–Sb based materials arelargely attributed to the similar electronegativity of Zn andSb and high Sb atomic number, which lead to good carriermobility and low lattice thermal conductivity, respectively.In the case of Zn4Sb3, atomic disorder further reduces thelattice thermal conductivity.9
Here, we describe the thermoelectric properties of p-typeLiZnSb between room temperature and 523 K. Analysis ofthe Seebeck coefficient, Hall effect, and electrical and ther-mal conductivities allows the examination of the assump-tions utilized in Madsen’s automated search for thermoelec-trics. The p-type conduction reported here limits the abilityof the authors to discuss the potential performance of n-typeLiZnSb.
II. EXPERIMENTAL
The LiZnSb samples were prepared by direct reactionsof Li !99.9%", Zn !99.99%", and Sb !99.99%" in boron ni-tride crucibles encased in evacuated fused silica ampoules.The samples were heated at 923 K for 4 h, and then ballmilled with stainless steel vials and balls in a SPEX Cer-tiPrep 8000 Series MixerMill. Dense ingots were formed byhot pressing at 680 K, with %1.4 metric tons over a 12 mmdiameter graphite die. Samples were then sliced into 1 mmthick disks.
a"Author to whom correspondence should be addressed. Electronic mail:[email protected].
JOURNAL OF APPLIED PHYSICS 105, 063701 !2009"
0021-8979/2009/105"6!/063701/5/$25.00 © 2009 American Institute of Physics105, 063701-1
experimental assessment p-type
VZn
VSb
ZnSb
Zn-rich/Sb-poor
SbZn
ΔHD,
q (e
V)
−0.5
0
0.5
1.0
1.5
2.0
2.5
EF (eV)
0 0.25 0.50
defect calculations
p-type
Material has to be appropriately (type, concentration) doped to realize predicted TE performance

Defect Calculations Can Guide Doping
/4230
experimental realization
materials search space
candidates
detailedcalculations
descriptor (metric)of target property
• First-principles defect calculations performed on down selected materials
1. Computationally demanding
• Cannot be performed on large number of materials
• Analysis requires significant human intervention
2. Softwares to automate defect calculations are emerging
• Significantly reduces the need for human intervention

Example of Detailed Defect Calculations Guiding Doping
/4231
HT search for n-type Zintls
Ortiz, Gorai, Stevanovic, Toberer, J. Mater. Chem. A 5, 5036 (2017), Chem. Mater. 29, 4523 (2017)
KGaSb4, KAlSb4
Ba doping: n-type
BaK
ΔHD,q (
eV)
0
0.5
1.0
1.5
2.0
EF (eV)0 0.10 0.20 0.30 0.38
Ba is an effective donor
vLong ∼ 3090m/s and vShear ∼ 1840m/s, which yields an averagespeed of sound of vs ∼ 2250m/s. The speed of sound inKGaSb4 is consistent with chemically similar Zintl compoundsKAlSb4, Ca5Al2Sb6, Sr3GaSb3, Sr3AlSb3, and Ca3AlSb3.
23,38−41
For KGaSb4, we find the glassy contribution specifically fromoptical modes to be ∼0.33Wm−1K−1.We attempted to model the temperature dependence of
KGaSb4 with the Debye−Callaway model,45 but found that themodel could not reproduce the functional form of theexperimental data without changing the temperature depend-ence of the Umklapp scattering term. The addition of boundaryscattering and point defect scattering does not improve themodel. Growth of single crystal KGaSb4 is ongoing to bettercharacterize anisotropy and anharmonicity in this system.Figure of Merit. The themoelectric figure of merit, zT, for
samples of K1−xBaxGaSb4 is shown in Figure 11. We find that a
maximum zT value of 0.92 is obtained at 400 °C for nominalcomposition K0.895Ba0.015GaSb4. We note that the effect ofdoping is relatively weak in samples of KGaSb4, as all samples,regardless of doping, have zT > 0.8 at 400 °C. Driven by theincreasing Seebeck coefficient at high temperatures, we do notsee a peak in zT by 400 °C. While Seebeck effect and thermalconductivity measurements can be made above 400 °C, wenote significant stability issues during Hall effect measurementsat higher temperatures. Above 450 °C, samples of KGaSb4begin to exhibit signs of sublimation. Our collaborators alsonote deleterous reactions with their alumina sample holder at500 °C. We have been conservative with our maximumtemperature for this work, but if high-temperature stability canbe improved in KGaSb4, zT > 1 should be easily achievable.Properties of KGaSb4−KAlSb4 Alloys. Within thermo-
electrics, optimization of a new material system is critical to itssuccess. Doping is the primary concern, which we havethoroughly investigated within KAlSb4 and KGaSb4. However,the introduction of point defect scattering via alloying isanother technique commonly used to improve the thermo-
electric performance of new materials. In our prior work onKAlSb4, we identified that the n-type band edge is composedprimarily of Sb p-states and Sb s-states. We hypothesized thatalloying on either the K or Al sites could result in reducedthermal conductivity while leaving the electronic mobilitylargely unchanged. With KGaSb4 also proving a strongthermoelectric material, and spurred by our prior work, weinvestigated the solid solution series KGa1−xAlxSb4.Barium has proven an effective dopant in both systems; to
ensure reliable Hall effect measurements, all samples weredoped with 1% Ba. In prior work, we identified that KAlSb4 isbest grown with a deficiency of Sb to suppress Sb impurities. Assuch, we adopted a set growth condition corresponding toK0.99Ba0.01Al1−xGaxSb3.80 (hereby referred to as KGAS), where x= (0, 0.1, 0.3, 0.5, 0.7, 0.9, 1.0).To confirm solubility of Ga on the Al site, we performed X-
ray diffraction and Rietveld refinement on sintered samples ofKGAS to generate Figure 12. We observe the full solid solution
of KAlSb4 and KGaSb4, consistent with the identical structuretypes and similar lattice constants. Contrary to intuition, weobserve that KGaSb4 is actually smaller than KAlSb4. Thesmaller cell volume of KGaSb4 is consistent with the originalstructural refinements of KAlSb4 and KGaSb4, but is not wellunderstood.26,46 We note that samples with Ga > 50% begin toexhibit a small percentage of KGaSb2 as a secondary phase. Thisis expected, as the synthesis of KGaSb4 does not require the Sb-deficient conditions that KAlSb4 necessitates. No othersecondary phases are observed. All XRD results can be foundin Figure S8.Figure 13 demonstrates the lattice thermal conductivity and
intrinsic mobility (obtained via the single parabolic bandmodel) for the KGAS alloys. Results for the lattice thermalconductivity are given at both 50 and 400 °C. The intrinsicmobility is only calculated at 400 °C as samples rich in Al
Figure 11. High temperature zT exceeds 0.9 at 400 °C for samplesdoped with 1.5 mol % Ba. It is worth noting that all samples, regardlessof dopant concentration, exceed zT ∼ 0.8. We do not observe a peakin zT up to 400 °C, driven by a continually increasing Seebeckcoefficient. High temperature measurements are limited by the stabilityof KGaSb4 during Hall effect measurements. If stability can beimproved, zT > 1 should be readily obtainable in this system.
Figure 12. Cell volume as a function of Ga concentration in alloys ofKAlSb4 and KGaSb4. As expected by Vegard’s Law, cell volume trendslinearly with alloying concentration. Unintuitively, KGaSb4 actuallypossesses a smaller cell volume when compared to KAlSb4. No phaseseparation into the constituent ternary phases is observed over thecomposition range, consistent with the Rietveld refinement. Minorimpurities of KGaSb2 are present for Ga > 50%, although theimpurities are directly related to the Sb-poor growth conditions, anddo not indicate limited solubility of KAlSb4 in KGaSb4.
Chemistry of Materials Article
DOI: 10.1021/acs.chemmater.7b01217Chem. Mater. XXXX, XXX, XXX−XXX
I
KGaSb4 (n-type)
zT~1 realized
Discovery of new n-type Zintl pnictides
Questions?
/4232

Softwares for High-throughput Computations
/4233
• A number of softwares designed for HT computations are now available for free
1. Open source softwares
• Typically written in Python
• Highly customizable
• Thriving community
2. Manage jobs and analyze outputs
• Interacts with supercomputer job schedulers
• Error handling
• Powerful tools for post-calculation analyses
www.pymatgen.org
PyLadagithub.com/pylada
aflowlib.org
www.aiida.net

Automated Softwares for Defect Calculations
/4234
• Softwares to automate defect calculations have been developed only recently
1. Set up defect calculations
• Create defect structures
• Create input files for running defect calculations
2. Perform post-calculation analyses
• Finite-size corrections
• Create phase stability maps
• Self-consistently calculate carrier concentrations
PyLada Defectsgithub.com/pylada/pylada-defects
PyCDTpypi.python.org/pypi/pycdt
www.pythonhosted.org/MAST

Role of Open-Access Databases in Accelerating Materials Discovery
/4235
• Several open-access databases provide computational data on:
1. Phase stability
2. Electronic properties
3. Thermal properties
4. Elastic and piezoelectric properties etc.
• Data visualization is an important component several databases
1. Analyze high-dimensional data
2. Identify new structure-property relations

Example: Thermoelectrics Design Lab
/4236
Materials Visualization Resources
4 1 2
x = 103 4 12 3 41 2 3
www.tedesignlab.org
Gorai, Stevanovic, Toberer et al., Comp. Mat. Sci. 112A, 368 (2016)
Materials Visualization Resources
4 1 2
x = 103 4 12 3 41 2 3
www.tedesignlab.org
Gorai, Stevanovic, Toberer et al., Comp. Mat. Sci. 112A, 368 (2016)
Contribute

Live Demonstration of TEDesignLab
/4237
If the internet cooperates …

Role of Data Informatics in Accelerating Materials Discovery
/4238
• Large amounts of real and reciprocal space data generated through HT computations
• Some parameters are experimentally unaccessible
• Data mining can unravel new structure-property relations
• To be robust, even larger amounts of data are needed
• Chemical and structure phase high dimensional, number of materials small
Gaultois et al., Chem. Mater., 25, 2911 (2013), Gaultois et al., APL Mater., 4, 053213 (2016)
UCSB Experimental Thermoelectrics DatabaseChemistries identified by recommendation engine

The Need for Experimental Validation, Feedback, and Integration
/4239
Leve
l of T
heor
y
high-throughput searches data
informatics
search inmaterialclasses
empir
ical s
earc
hes
candidatescandidates
candidates
new TE Current Approach to TE Materials Search
deta
il
high-throughput searches
search inmaterialclasses
Computationally-Guided TE Materials Search
Number of Materials Considered
structure-property relations
feedback
cand.
new TE
datainformaticsem
pirica
l sea
rche
s
Leve
l of T
heor
yde
tail

Outlook
FundingNSF-DMREF Grant 1334713, 1334351
NREL High Performance Computing (HPC)
Email: [email protected] or [email protected]
• High-throughput (HT) computations can accelerate materials discovery
• However, HT computations also means there is a chance for HT errors!
• Developing computationally tractable descriptors is the most challenging task
• Present infrastructure is quite sophisticated to enable HT computations
• Experimental validation is critical to the success of computational materials discovery
Please download slides: www.prashungorai.org/imrc2017