computer assisted telephone interviewing on the cattle multiple
TRANSCRIPT

;::~;;;,~ United States-'•.i Department of~ Agriculture
StatisticalReportingService
StatisticalResearchDivision
SRS Staff ReportNumber 82
Computer AssistedTelephone Interviewingon the Cattle MultipleFrame SurveyCarol C. House
COMPUTER ASSISTED TELEPHONE INTERVIEWING ON THE CATTLE MULTIPLE FRAME SURVEY.By Carol C. House; Statistical Research Division; Statistical Reporting Ser-vice; U.S. Department of Agriculture; Washington, D.C. 20250j October, 198ijjSFSRB Starf Report No. 82.
ABSTRACT
CONTENTS
This report summarizes the results of a two phase studycomparing CAT! versus nonCAT! telephone interviewing onthe Cattle Multiple Frame Survey in California. Thestudy shows 75 percent fewer errors on the CAT! data, asmeasured by the SRS Generalized Edit program. Mul-tivariate tests on eight selected variables indicates anoverall difference in the level of the estimates betweenthe two groups. Differences are significant for twoindividual variables -- total cattle deaths and responserate. Differences below 18 percent are not found to bestatistically significant due to the lack of power inthe tests. The observed effect of CAT! on-line edits isto increase the estimates for some variables, anddecrease them for others. This is in contrast to theeffect of the SRS operational edit procedures whichincrease the level of all estimates. This study wasconducted in cooperation with the Program for ComputerAssisted Survey Methods at the University of California- Berkeley's Office of Computing Affairs.
I I • I • I I •• I I I I • I I ••• I I • I I I • I •I This paper was prepared for limited distribution I
I to the research community outside the U. S. •I Department of Agriculture. The views expressed I
I herein are not necessarily those of USDA. II •• I •• I • I I •••• I •• I • I • I I I I I I I
PageSummary •••••••••••••••• 2Introduction •••••••••••••••• 3Potential Benefits ••••••••• 3Background ••••••••••••••• 6Phase One ••••••••••••••• 7Phase Two ••••••••••••••••• 13Conclusions ••••••••••••••••• 20References •••••••••••• 21
SUMMARY This report summarizes the Iresults of a two phase studycomparing CATI versus nonCA!I telephone interviewing onthe Cattle Multiple Frame Survey in California. Itdemonstrates that on-line edit checking available withCATI can improve data quality by reducing responseerrors in SRS surveys, and provides prelimi!lary measuresof the magnitudes of thesEl reductions. ,The Agencyshould continue with research in this area, incorporat-ing additional states and sur~eys to broaden the base ofthe findings.
The second (and major) phase of the study shows 75 per-cent fewer errors on the CATl data, as measured by theSRS Generalized Edit progr~l, Time constraints gen-erally mandate that the fltatistician resolve theseerrors without recontacting the respondent. Thus weconclude that the CATl data, which requires less inter-vention by the statistician before summary, is of betterquality than the nonCATl data. Multivariate tests oneight selected variables indicated an overall differencein the level of the estimates between the two groups.Differences are significant (higher for CATl) for twoindividual variables -- total cattle deaths and responserate. Differences below '8 percent were not found to bestatistically significant due to lack of power in thetests. Tbe difference 1n response rate reflects a fewernumber of inaccessibles on the CATI side, rather than afewer number of refusals. The effect of CATIon-lineedits is to increase the estimates for some variables,and decrease them for others. This is in contrast tothe effect of the SRS operational edit procedures whichappear to increase the level of all estimates that areexamined.The first or pretest phase of this study found responseerrors from one percent in reporting milk cows to 58percent in reporting steers. Inferences from this prel-iminary phase are limited in scope, but support findingsfrom the other phase.
More research is needed as a rollowup to this studyadding more states to increase the power of the statist-ical tests and adding more surveys to broaden the baseof the findings. Future work should also explore thepotential of CATI to reduce the time required for surveymanagement and data processing, and to develop prelim-inary cost models for CATI data collection.
The Program for Computer Assisted Survey Methods at theUniversity of California - Berkeley Office of ComputerAffairs developed thE>CATI software and cooperated withSRS in this research study.
2

INTRODUCTION Computer assisted telephone interviewing (CATI) refersto the use of computer systems for telephone interview-ing and related forms of data collection, data entry,editing and coding. A telephone enumerator sits infront of a computer terminal with a cathode ray tubedisplay (television screen) and speaks with a respondentthrough a telephone headset. The computer 4s programmedto display each question in turn on the screen. Afterreading the question to the respondent, the enumeratorrecords each answer by depressing the keys on the termi-nal keyboard. The computer performs any desired editchecks and, if needed, displays a question requestingclarification. The computer stores the information,selects the next appropriate question and displays it onthe screen. In addition to these basic functions,advanced CATI systems can assist with survey managementfrom the initial assignment of the sample to enumeratorsand the scheduling of callbacks, to preparing summaryreports of the status of the survey.
The Statistical Reporting Service (SRS) of the U.S.Department of Agriculture signed a research agreementwith the Program for Computer Assisted Survey Methods(CSM) of the University of California-Berkeley in 1981to investigate jointly the feasibility of using CSM'sCATI software on surveys run by SRS. The initial testswere set up in California on the Cattle Multiple FrameSurvey. This report summarizes the results from thesetests and provides an overview of potential advantages aCATI system may have for data collection procedures inSRS.
POTENTIAL BENEFITS CATI surveys have a number of potential advantagestraditional telephone data collection. Thebelieved to have the greatest benefit to SRS arelined below:
overseven
out-
• Improvements in data qualityediting and the standardizationcedures
through on-lineof survey pro-
•••
Reduction in processing time
Efficiencies in survey management
Improvements in enumerator training
• Flexibility in questionnaire design and pretest-ing capabilities
3

Inprovenents inl"1&te fJuality
Reduction inProcessinG Tine
Efficiencies inSurvey Hanar;er"ent
* f.bility to prC'vi,j(;. cO":"lE'te au'L t trail of'data
~ Potenti~l sannle 3i~0 reductio~s throu~~ sequen-tial estimation.
ThE'se are described bel O~l to rri VA a broad overvie"l ofthe role that CATl Mi~ht play i~ SRS surveys. Thererainder of the report narro~s its attention to theHorl~ that has been done in (wantifyin,,: the first benefit-- improvements in data quality.
CATT has the pote~tial to reduce nonsa~plin~ errors intelepho~e data collection, tl,ll;' j-''''ro':i'''-the ~lJ21 j t·, of'the dat3 collected. On-Jine edit ?'1rlconsister1c" checl:scan he r-:adebetlleen da:", jte~~~ on ;;,5in('"100uestionnair,;and a~ainst previously rcportt~ control data. Oup.~tion-~aire skips and branches are conputerized on CATI, sothat they are always executed correctly for a ~ive~ setof answers. This capabili~v c~n elirinate the Missin~:i,terJ3produced IIhen enUr1crator::; iMp~'Jnerlv skip Ques-tions that should be ans\lcred or ask questions thatshould be skipped. Thereforc' the enunerators are ableto collect the Rppropriate inf~rr1ation durin~ the inter-vie\', reducin~ the likelihooc' Lhat the stCltistician ~ustjMput~ ~ value or recontact a ~cspondent. A CATI syste~can also provide ~reater o0~sistency in the way andorder in which questions are asked and can lead to stan-dardization of unstructured nrobin~ for addition~li~fornation. A specific exa~·,10 of this ni~ht be a setof qllestions to deterr:line if ;?': orer2tion reported as afa:'1ily partner:,,:"ip actu;,ll" "~'I' t s the S::S defi:1itio:1 of"Joi"tlyoperated." nve'"'"lJ, c':-;t.., <:'ollection 1l01~ld be~lf)r" standarJi::"ed both within Rnd betHeen Sr.S stateoffices.
A CA71 systCr1 creates the potential to reduce the tinerequired for surV0:' nanager,ent and data processinr. Thel.J.tteris rec1uced prinaril" by elininatinp; a separatedatH entry step. In addili~~. the 2nount of pnst-irterview editin~ should be substantially red~ced. Thiswill save time--both the statistician's and theresnondent's--hy necessit~tin~ ~ewer corrections toirconsistent data and le~s irJr!l!~~tionfor nissin,,: iter"~.A further reduction in tine can be realized by eliMinat-in~ a portion of paper han61cn~ bePore and durin~ thed,-,t.acollection ;-,l;rou,';:l211t:" ,~.tec s;)";l"le"C1",~cne"tC3:J3 ~ili ties.
The :loSt obvious i'1orovenpnt~: in su!"'vey nann~ementoffered by CATI are autonatfd procedures to scheduleintervieus and ca2.lbacks. In addi tion, nost systCl"1Sprovide for instant~neou~ S·I~'1ary of the stRtus of asurvey at any timB, allowin~ the supervisor or statisti-ciqn to keep track of the pro~re3S bein~ made, and to
4

Improvements inEnumerator Training
Flexibility
calculate interview times and refusal rates by enumera-tor. In this way the supervisor can identify problemareas quickly and correct them early in a survey. Sur-vey progress can be monitored by strata or district toredirect telephoning to low response areas. CATl sys-tems also allow for improved capability to monitor andevaluate enumerators.
With CATl, enumerator training sessions can spend lesstim~ on issues dealing with the mechanics of the ques-tionnaire, and more time on understanding what is wantedin each question, and on reviewing specific interviewingtechniques. This is because a CATI system takes overmuch of the work usually required of enumerators, allow-ing them to concentrate on interviewing. Preprogrammedskip patterns and probing reduce potential pitfalls forless experienced enumerators working on complicatedquestionnaires.
Tradeoffs on training time are required for inexperi-enced CATI enumerators to learn the commands necessaryto control a computerized interview. SRS enumeratorshave spent around eight hours on a terminal beforeinterviewing on a survey. It is too early to tell ifthe training period will remain the same length or shor-ten after the trainers become more experienced. So far,SRS enumerators have adapted very quickly to CATI, andthere do not seem to be any obvious new requirements(such as typing ability) necessary for CATl beyond thoserequired for traditional telephone interviewing.
A CATI system provides flexibility in questionnairedesign because questions are not dictated by paper siz~and shape. Intricate skip and branching patterns arepossible because CATI makes them transparent to theenumerator. Questionnaires can be developed that aretailored to respondents' characteristics. Examples ofthis range from simply inserting the respondent's namein a question, to developing of a set of sophisticatedqueries to categorize the type of farming operation.
Computerized questionnaires are more convenient to usein pretesting new survey questionnaires because changescan be made quickly to tryout different wordings,skips, etc. A final version of the questionnaire can beconstructed from the pretest version with minimaleffort. This capability simplifies methodological stu-dies, making it easier to conduct split sample tests todetermine the effects of different questionnaire word-ing, enumerators, etc.
5
Audit Trail
SequentialFstination
DisadvantaGes
BACKG::?om:n
A. sODhisticatpc CATT SV2+;n,! (';,:'] provide a cO·"llete. COr:1-
puterized audit trail of ~ll cha~res made to datR. froMit.~ in1 tial entr" by an 0DI1!,pr'ator until the dat? istransferred for cent~ali~od processing. This audittrail would include all chan-ns n?de by an enu~eratnrduring an intervie\v. clJ:'!1';e~by a statistician durinr; 2.
reviet·.••and notes recordorl 1:1 <?ither situation. Theaudit trail naintained durin~ the interview will assistthe statistician in re30lvin~ inconsistencies in datatr":JtrrJir;htreT'lainRfter the i".terview. The audit trailswill provide the tools for analysts to ~easure the typesand amount of editin~ that is bein~ done on question-n",ires. and to locate partir>1j:~:-:rquesti0r.~ that are r:iv-in~ respondents 2nd enu~erators trouble. The Ct~J sys-terJ provides 1:.1:1'"2udit tri1il aufJl""c.tic~ll;:\.'ithoutrequirin~ additional effort ~roM the state office per-sonnel.
rinall:,. cO'1;->uterized in~:crviewin,,: systeCls provideirr-0Rsed opportunities for usin~ tech~iques such asseq J,?!:tialestirJation to rec1'We' sanple sizes. These arestatistical techniques which are used at given tinesduring data collection to deternine if the responsesrec"ived up to that point will r;ive esti:Jates \-liththerequir.e~ precision. If not. the data colledion conti!"!-ue~. If the precision has be9n reached. no additionalsa:1ple units are contactpc. :ith r.PTl. th'~ cata arer:~o'1puterized inmedia tel ;,'. :na kinr: possi bl e prel il'1inar)'est~mates of variqbility.
It is i~portant to ne2~urc the actual gai!"! f!'"'o~CATIrather than nerely djscu:~ the potential benefitsbecause of the additional costs 2nd corple:-ities i~poscd~)H r'ost CATl s:,stens. ~tClrtup costs can be si""nifica:1t.These include hardware procurements. development or pro-curenent of basic CAT! ~oftware that is flexible enou~~to fill the need of the survev or~2nization. adaptatiopof questionnaires to CO'lf"tterized fornats. and thetrainin~ of staff to pro~r:~ 2nd direct CATl surveys 2ndto run new ADP equipment. Although a detailed discus-sion of th~se issues is beyond tho scope of this paper.r'eco':nizinr;their inp2.ct l):"ovides a hetter undprsta!ldinr:of the nend to investir:ate ful:y this new ~ethorlolo~y.
S~~ began enpirical experinentHtion with CATl after ini-tiatin~ the research ar:reerJent with CSI1. This asree~entprovides s~s with access to 2 ~ophisticated CATI ~YSt0~and the opportu:1ity to su;:>p(~r'~its continued develop-ment.1!
l! The agreenant actually gives SHS docu~e~ted sou~ce code forCS~( CAT:!:Conputer pro:;rar:J3.
6

PHASE ONE
The major SRS interest in CATI centers around its poten-tial to improve data Quality and to reduce the process-ing time involved 1n data collection. This initialresearch study concentrates on Quantifying the improve-ments in data Quality resulting from the use of on-lineedit and consistency checks during interviewing.
SRS set up a test site in the California SSO inSacramento. This site consisted of four interview sta-tions. each equipped with a CRT. 1200 baud high speedmodem. and two telephone lines (one for data transmis-sion and the other for interviewing). The interviewingphones were equipped with headsets. The data lines con-nected the interviewing stations in Sacramento to theDEC PDP 11/44 mini-computer on the Berkeley campus.
The Cattle Multiple Frame Survey was the first adaptedto CATI. It is an important survey to SRS and to Cali-fornia agriculture. and has the potential for a fullexploration of on-line edits to check the consistency ofthe inventory counts. SRS staff programmed the Ques-tionnaire using the CSM Q Questionnaire developmentlanguage that is a part of the CSM CAT! software.
Wording differences between the CAT! instrument and theorigina.l paper Questionnaire were minimized in order toeliminate the effect such changes might have on the dataanalysis. During an interview. when data fails to pas~a consistency check. an additional statement appears onthe screen. This statement informs the enumerator thatan edit check has failed. clearly states which one hasfailed. and gives the value(s) of the data under suspi-cion. The statement also gives the exact wording of aprobe that can be used by the enumerator to try toreconcile the inconsistency. The enumerators may usethis probe or their standard probing techniques toascertain if reporting errors vere made. Corrections ofmisreported data are then made by the enumerator. If theenumerator resolves the inconsistency without changingthe data. then the program directs the enumerator totype in a short note explaining the resolution (eg.·calf crop appears high because some cows vere sold").
SRS and CSM jointly conducted the interviewing for thefirst phase of the study during January 1982. The pri-mary objectives of this phase vere to pretest the CAT!instrument and to allow the interviewing and profes-sional staffs an opportunity to acquire experience in
7
CATl interviewing. A secondary object~,vewas to providepreliminary indications of data differEmces resultingfrom on-line editing. These objectives were satisfied.The analysis showed indications of major differences inseveral important variables. The following describesthe analysis in more detail.
A special research sample was selected from two liststrata -- one beef stratum and one dairy stratum. Fourenumerators with experience on this survey (but not withCATl). conducted the interviews. They completed 132interviews.
The computerized Questionnaire produces two sets ofdata. The first consists of the answers to Questions asthey were originally recorded by the enumerators. Thesecond data set consists of the answers to the sameQuestions. but after the program runs thr:>ugh the editlogic and the enumerator resolves any inconsistencies.Together. the two data sets provide a pair of answersfor each Question: 1) the answer as fiir'stprovided bythe respondent. and 2) the answer finally agreed to bythe respondent and enumerator as the best answer to theQuestion. A paired analysis was performed on these datato measure the impact of the edit on estimates of thenumber of head of cattle in each of sevf~ral inventorygroups. Because of the small sample sizes involved. theanalysis treats the sample units as an unstratified sim-ple random sample and makes no infe1"eneeto the popula-tion of cattle operations in California. The inferencelevel is the sample itself.
Differences between the data due simply to keystrokeerror were eliminated when they were detected. If anexamination of the pair of answers indicated that thedifference was elearly produced by transposed numbers orsimilar obvious keystroke errors. the difference betweenthe pair was set to zero. and the zero difference wasincluded in the analysis. On several occasions it wasdifficult to assess whether the difference was due tokeystroke error. or if. in fact. the respondent haddecided to change the answer. In these few specificcases. the paired answers were completely removed fromthe analysis.
The difference between the final answer tl::> a Question
B
and the first answer to the same question is defined by:diff:last-first. The distribution of these differencesis highly skewed, consisting mainly of zeros and a fewlarge values. This type of distribution, with a fewvery large values, makes the confidence intervalsextremely large so that statistical tests of the meandifferences are too weak to be useful. Therefore,analysis from Phase One consists only of descriptivestatistics of the differences found in the livestocknumbers.
The descriptive statistics (for each inventory categoryand for the overall sample) are presented in table 1 andinclude:
• total animals (based on the edited data)
• sum of the differences discussed above
• sum of the absolute value of those differences
• average difference per operation
• average absolute difference per operation.
Partioular attention should be paid to the estimates oftotal absolute difference in number of animals reported.By not allowing the errors to oancel each other out fromoperation to operation, we get a measure of the totalresponse error that is being oorrected during the CATlinterview and not just a measure of any bias that isbeing eliminated. The variable ·Percent Abs Change" iscalculated to give a relative indication of this number.
Percent Abs Change
9
=Total Abs Diff
Totalx 100S
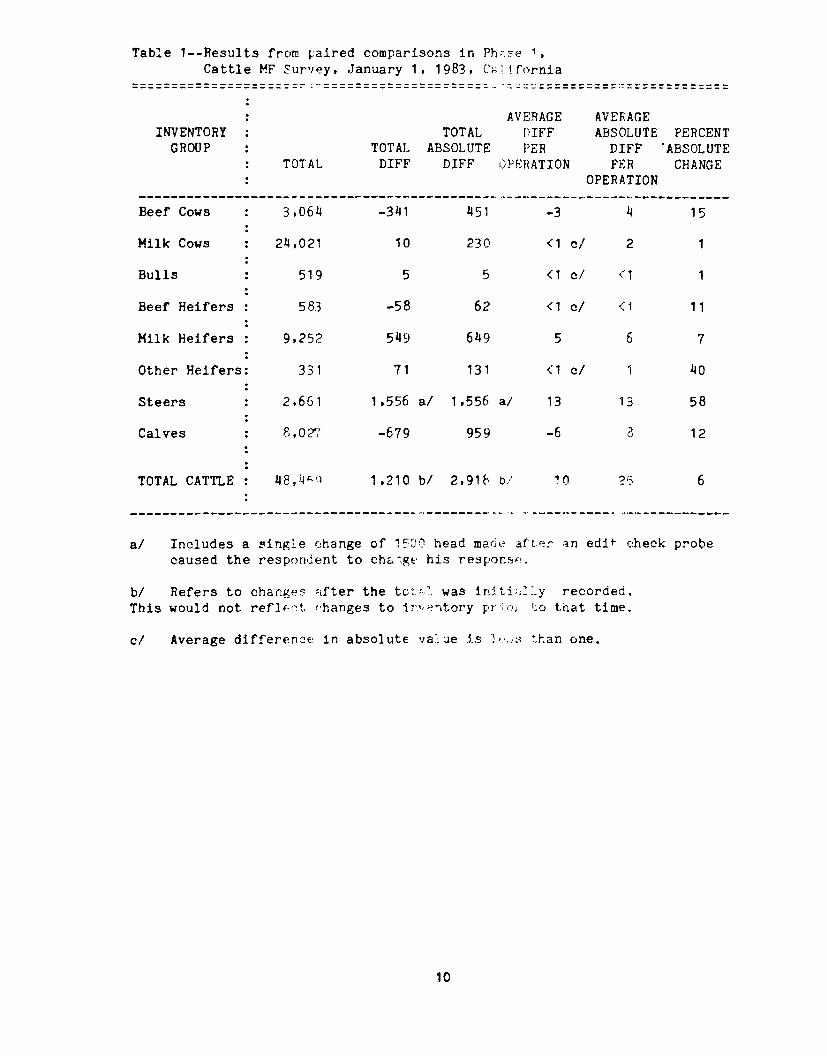
Table 1--Results from ~aired comparisons in Ph~se 1.Cattle MF Survey. January 1.1983. C;o:ifornia
----------------------.---------------------- -----------------------------_____________________ A '. " " __ • _ ~~ • _
AVERAGE AVERAGEINVENTORY TOTAL DIFF ABSOLUTE PERCENT
GROUP TOTAL ABSOL UTE PER DIFF .ABSOLUTETOTAL DIFF DIFF OPEHATION FER CHANGE
OPERATION---------------------------------------------.----.-------------------------Beef Cows 3.064 -341 451 -3 4 15Milk Cows 24.021 10 230 <1 cf 2Bulls 519 5 5 <1 cf <1
Beef Heifers 583 -58 62 <1 cf <1 11Milk Heifers 9.252 549 649 5 6 7Other Heifers: 331 71 131 <1 cf 40
Steers 2.661 1 .556 a/ 1.556 a/ 13 13 58
Calves 8.aZ;' -679 959 -6 3 12
TOTAL CATTLE 48.41:.'.1 1.210 b/ 2.91f; b/ 10 2J5 6
af Includes a single change of 1580 head mad~ after ~n edit check probecaused the respondent to ch~~R~ his responS0.
bl Refers to changes after the tct~l was inlti~:lyThis would not reflf-d, ('hanges to :ir:\,erltor'ypr~l), I~(l
recorded.that time.
of Average differenCE' in absolute va:l;.le :1.5 ~ '_:.~' U-.an one.
10
The percent of absolute change ranges from 1 to 58 per-cent. The changes are the largest in animals forslaughter market (other heifers and steers) and thesmallest in milk cows and bulls. The changes in signfrom negative (beef cows) to positive (milk cows) withinthe total differences for cows, and a similar change inthe heifer group (beef, milk and other) gres~nt evidencefor possible question order bias. In each grouping, thefirst question (beef cows or heifers) appears to beov~r-reported initially, and subsequent questions of thesame type (milk cows) (milk and other heifers) under-reported. Similar results for livestock inventory sur-veys were found earlier by Steiner and Kleweno [8].
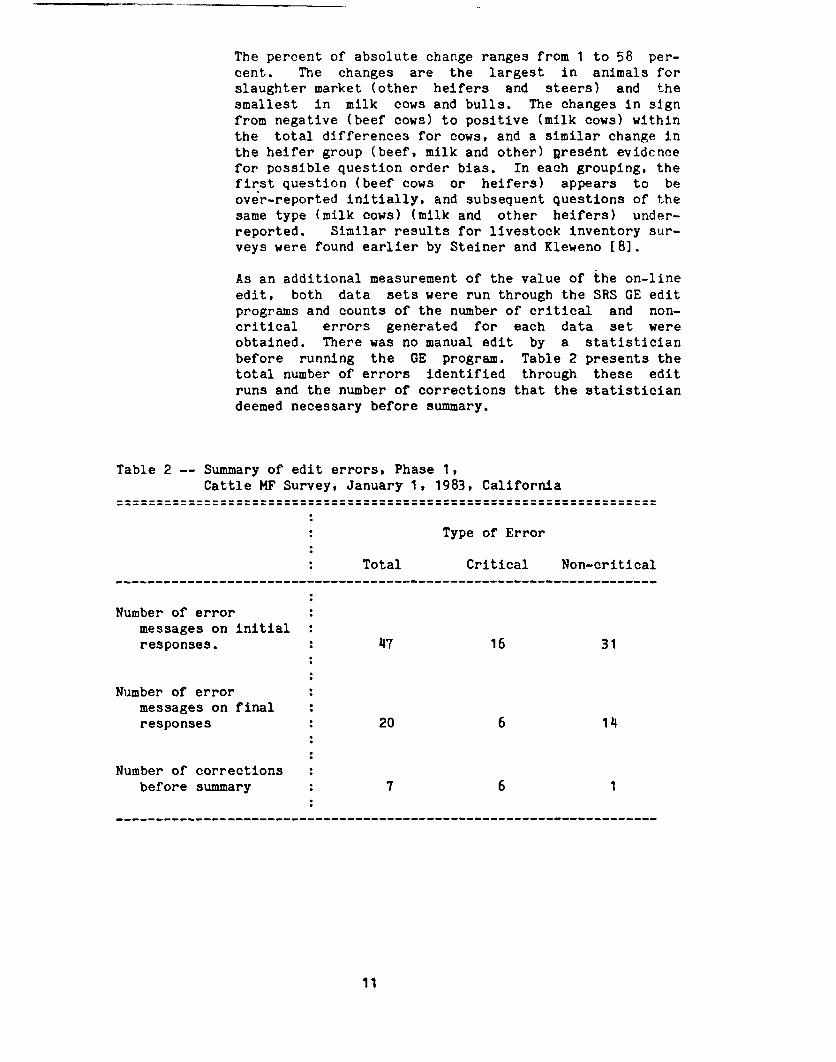
As an additional measurement of the value of the on-lineedit, both data sets were run through the SRS GE editprograms and counts of the number of critical and non-critical errors generated for each data set wereobtained. There was no manual edit by a statisticianbefore running the GE program. Table 2 presents thetotal number of errors identified through these editruns and the number of corrections that the statisticiandeemed necessary before summary.
Table 2 -- Summary of edit errors, Phase 1,Cattle HF Survey, January 1, 1983, California----------------------------------------------------------------------------------------------------------------------------------------
Type of Error
Number of errormessages on initialresponses.
Number of errormessages on finalresponses
Number of correctionsbefore summary
Total
47
20
7
11
Critical
16
6
6
Non-critical
31
14
1
Fifty-five tler2ent of th" nor.-critical (;rTOr2 fron thoori~inal data set were corrected ~lrin~ the on-lineedits. or tho 1~ non-critical errors reMainin~. onlyone rec<uirec correction before sunnariz,c;tion. and it vJaS
accoMpanied b~ a note fron the enuner2~0r which revealeda :Jisundi?rs'cC. ':r! ".nr. Sic: critical E'rrC!" rcr1ained afterthe CJI,TIe:L t C'hecl:s.all of Hhich weri' corrected forsummary. ~o of those were caused hy a respondent'srefusal to an:wer specific questions. Th.e other fourwere accC>r,":Hlied by enut:!erator notes which indicatedefinitional problems and gave adequate information tomake the ~nrrections. Thus of the b7 errors anddiscrepancie~ fla~~ed by the edit pro~r2n~ on the dataori:-irJ21ly reported by t'le re.sponcen+.:',anI:' :ifteenperce~t req~<rec intervention 2~t('r t~( rlnnc of theinterv iei!.
jTo major cond '.1~ions can be dr31m fron t.'i i.~ phase of thestudy bec~usc the i~fcrenccs are li~ited. How~verseveral patterns ener~ec that should be discussed.
First, respondents in the study did revise a siz-able n.1mber of their answers in response to therMohin~ n~ an enunerator after 31 edit checkr.pveal'?J ln~onsi...,tencies in t.h2t data. If oneexblude~ n~lk cows (half of the total aninalsreportpj'. then the percent abs);ute chan~e overthe re'~:'injn~ ip.ventor'y ca teco!":ic':,: '::" a bout fifteer.percent .. ~'he question rerJains -- hoy; r12ny of thesechan::e:; l,[0uld have been caurrht ~y a "sharp"enu~er2tor without the ai~ of CATT~ Undoubtedlysome ~IOU:~Ch2ve hern. 0n,'3 shoule r«;c,~l. hC)1Jever.that ro'::':: cf' the ch('~i;:3rC'c;uir':S0"~ :"pe of arith-netic c2:~ulation, and then need tn be cOMpared topreset Ii-its which nu...,tbe ~enori~cd or looked up.?ror~ t:C':'.: it is easy to conclu:k thdt the vastr.ajoritv Hould slip tv durinr; a tr'Jd:tiop.al inter-view. even with very Sharp enumerators.
A seC'orJdi::;sue-- is there an:, particular advantar;eto corr~c~in~ these data inconsistencies durin3 anintervio'.: since the r:r:edit .Iill prCl:);;blyfind thenlater? First, Phase 2 analysis injirates th3t theeffect nr the two procedures may not be the same.Secor-.d, +;:", assu!lption is sinpl:1 nade tha t th erespondent :~ in a bett"r position ~o resolve theinconsiste~cy in Most instances than is the statis-tician reviewin~ the r:~ edit results. Socause tineconstraints in SRS surveys gcneralJy prohibit thestatistician frOM rcco~tactin~ the rcs~ondent. weconclude t~at there is a definite advanta~e toresolvinr- trese durinp; the init.ial irlt':~rview. Innany ca.C;'3 the data are in fact cDr'rcct., and shouldnot be edited. CATT allows enunerat0r~ to type innotes tr t~e statistician e~plainj~- -he s5tuation
12
in those cases. In all cases. the respondent doesnot have to be contacted again and the statisticiancan spend much less time reviewing edit printoutsand second guessing what the respondent reallymeant to report.
In conclusion.enumerators inreporting errorsdata of betterstatistician.
CATl appears to have assisted thethis study in finding and correctingduring the interviews, thus providingquality with less intervention from the
PHASE TWO The primary purpose of the second phase was a controlledtest of CATl verses nonCATl telephone interviewing bycomparing the estimates generated from two half samplesduring an operational survey period. The operationalsample in nine selected strata for the Cattle MultipleFrame Survey in California was split randomly into twosubsamples. After eliminating sample units withouttelephone numbers, the effective sample size ~as 61~ onthe CATl sample and 609 for non-CATI.
Team assignments split the group of enumerators subjec-tively .into two teams of nearly equal experience andability. All enumerators had worked before on this sur-vey. and two enumerators on the CATI team and oneenumerator on the nonCATI team had previous CATI experi-ence. Interviewing was conducted during the last weekof December. 1982 and the first week of January. 1983.The cattle questionnaire received only minor modifica-tions between phases. such as those to correct a fewprogram bugs or to make the introduction flow moresmoothly.
Table 3 displays counts of critical and non-criticalerrors from the SRS generalized edit programs that aregenerated for the CATl and nonCATI samples. Overall,there were 76 percent fewer corrections needed beforesummary on the CATI sample than on the nonCATI sample.Since time constraints generally mandate that the sta-tistician make these changes without recontacting therespondent, we conclude that the CATI data is of higherquality than the nonCATI data.
13

Table 3 -- Summary of edit errors, Phase 2.Cattle MF Survey. January 1, 1983. Califorr
-----------------------------------------------------. -----------------------------------------------------------------' .. ------------Type of Error
Total Error Messages
Non-CATlCATl
1. ReI Difference 1/
Errors Corrected forSummary
Non-CAT!CATl
1. ReI Difference 1/
Total
245199
191.
8420
761.
Cr'1tical
5312
771.
5312
771.
" n-cr1tical
192'87
31.
318
741.
1/ 1. ReI Difference = ( (NonCATl - CATl) / NonCATl) x 1001.
The table shows that the CATl sample has 77 percentrelatively fewer critical errors than the non-CATl sam-ple. Seven of the twelve critical errors from the CATlsample result from a consistency check inadvertentlyleft out of the programming of the on-line CATl checks.This check has since been added. The remaining fiveindicate that the amount of feed fed to cattle-on-feed.although verified with the respondent. is too low to beclassified as "on-feed" by SRS.
There is only a three percent difference in non-criticalerrors between the two data sets. However, because allinconsistencies were verified by the respondents duringthe interview for the CATl sample. there were 74 percentrelatively fewer changes made to the CATl data than tothe non-CATl data as a result of these error flags.
The purpose of the following analysis is to investigate

possible biases resulting from the response errors dis-cussed above. It compares the levels of the estimatesbetween the half-samples at two different stages of theprocessing. One comparison is of the data exactly asthey come from the completed interview, before anyoperational SRS hand or batch editing. A second com-parison is of the data after they have proc~eded throughthe full operational editing procedures and are readyfor summary. Differences that are detected between theCATl and nonCATI estimates can indicate the presence ofa bias due to these response errors. However, they canalso reflect differences due to a general change in themode of data collection (even though reasonable precau-tions were taken to minimize these other effects). Afailure to detect differences can indicate that theresponse errors tend to cancel each other out, or Simplythat the tests are not powerful enough to accuratelymeasure the bias.
Seven representative inventory variables and theresponse rate were chosen for comparison. Stratumtotals for each variable were expanded by the appropri-ate stratum expansion factors to produce overall totals,and are presented in table~. 1/ Note that these arenot estimates of state totals for California, butrepresent only the nine selected strata. Tbe expandedresponse rate was computed by dividing the expandednumber of responses by the population total.
Table ~ also presents the results from multivariate andunivariate tests. All test statistics are computedusing replicate totals instead of individual data toavoid the complications of a stratified sample design intest procedures that assume a Simple random sample. [4]There are ten replicates across strata in each half-sample of data.
Results from two multivariate tests ~ / Botelling-Lawley Trace and Wilks' Criterion -- provided identicalresults and are presented in the table as a singlestatistic. These tests show significant differencesfor a=.10 for both edited and unedited data.
1/ Tbese data were adjusted to handle a large outlier in oneof the smaller stratum by setting its expansion factor to ·oneftand recalculating the original expansion factor in that stratum.This treats the outlier as if it were in a stratum of preselec:,edunits and allows it to represent only itself in summary. Earlierpresentations of these data were not adjusted for this outlier,and the adjustment did not affect the outcome of any of the testsand made only modest changes in the levels of the estimates.Z/ Computations used SAS GLH multivariate procedures.
15

Table ~ -- Direct expansion estimators, multivariate and univariate testsPhase 2. Cattle MY Survey. January 1. 1983. California====================~====================================================
VARIABLE CATI NON-CATIDIFF IS
I DIFF 11 SIGNIFICANT 21( PROB>F )
======================================================~===:==============Multivariate tests
UneditedEdited
yes (.06)yes (.05)
-----------------------------------------------.-------------------------Response Rate 80.1 65.4 22.51 yes (.00)
To tal CattleUnedited 2.570.089 2.457.652 ~.61 no (.36)Edited 2.595,691 2.5~1.160 2.11 no (.63)I EdDiff 31 1.01 3.3J
Total Beef CowsUnedited 514.833 581.498 -11.51 no (.26)Edited 518,025 581.907 -11 •01 no ( .28)I EdDiff 31 0.61 O.H
Total Milk CowsUnedited 773.403 708.353 9.21 no (.11)Edited 782,698 731.9~2 6.9J no (.19)I EdDiff 31 1.21 3.2J
Total Other HeifersUnedited 70.806 59,~55 19.11 no (.61)Edited 70 •860 61.680 14.91 no (.68)I EdDiff 31 0.11 3.61
Total SteersUnedited 136.771 149.360 -8.41 no (.67)Edited 137.531 16~.337 -16.31 no (,41>J EdDiff 3/ 0.61 9.11
Total Calves BornUnedited 1.038.447 1•020•273 1.81 no (.65)Edited 1.113.247 1.122.601 -0.81 no (.92)I EdDi ff 3/ 6.71 9.1J
Total Cattle DeathsUnedited 39.235 32.885 19.31 yes (.O~)Edited .0.283 33.918 18.M yes (.03)I EdDiff 3/ 2.61 3.01
------------------------------------------------ ..------------------------1/ I Dirt = ( (CATl - NONCATI)/NONCATI ) x 10012/ multivariate and univariate tests tor a:.l0 significance level3/ S EdDiff = ( (Edited - Unedited)/Edlted ) x 1001
16

When variables are examined individually, the responserate in the two groups is found to be significantly dif-ferent. For both the unedited and edited data, oneinventory variable - total cattle deaths - is found tobe Significantly different for 8=.10. Other inventoryvariables showed fairly large differences for bothedited and unedited data, but these differences are notdetectable at the given significance level due to lackof power in the tests. Before more powerful univariatecomparisons can be made for many of the cattle vari-ables, the tests must include several states, and thusmust wait until additional states have CATl capabili-ties.
Tbe significant difference in response rate is caused bythe number of inaccessibles rather than the number ofrefusals (which expanded to about eight percent of thepopulation in each group). An examination of the pro-cedures used to distribute and manage the sample pro-vides the most likely explanation for this difference.Sample management for both groups were handled by handbut the procedures were considerably different.
On the nonCATl sample, enumerators were given astack of questionnaires at the beginning of thesurvey and were responsible for completing as manyinterviews from that stack as possible before theend of the survey period. Exceptions occurredif the enumerator was not available for a callbackappointment; if the enumerator was not working afull shift through the survey; or in other situa-tions where either the enumerator or supervisorfelt that it would be useful to redistribute partor the assignments -- but, the general pattern wasone of minimal shuffling of assignments.
On the CATl side, two circumstances mandated a dif-ferent approach to sample distribution and manage-ment. First, because equipment availability lim-ited the test to only four interview stations, eachof these stations had to be used optimally at alltimes. The five enumerators working on CATIon agiven shift would rotate their breaks so thatinterviewing was going on at each station continu-ously. Second, because the enumerators were gen-erally inexperienced with CATl, a supervisor was
17

constantly in attendance to assist immediately withany difficulty that might arise during an inter-view. The supervisor used much of this time tosort through "no answers", "bl.lsys",and "call-backs", and to redistribute them to enumerators ina more optimal fashion. The general pattern thatemerged was that enumerators were assigned a smallnumber of calls to make at anyone time, but theseassignments were updated (and added too) frequentlyduring each shift.
The end result is a significantly higher response rateon the CATI sample. Although the mo~itoring proceduresrequired a considerable amount of staff time the samepositive results may be possible soon without the per-sonnel costs. A computerized sample manager andscheduler is being developed for the CATI system thatwill perform these functions. It is expected to beoperational by the end of this year.
Some general patterns are observable in the datapresented in table ~ which may shed light on the rela-tionships between estimates from the CATI and nonCATIsamples, and the effects that SRS operational edit pro-cedures have on these estimates.
There are relatively large differences between CATIand nonCATI for individual variables but the direc-tion of these changes differ and they tend to can-cel each other out when combined. For example, twovariables -- total cattle. total clalvesborn -- areboth sums of other variables actually reported byrespondents. The absolute relative differencebetween CATI and nonCATI for these two variables(including edited and unedited estimates) is ~.2J.In contrast, the difference for individuallyreported variables (beef cows. milk cows, otherheifers, steers, cattle deaths) i8 10.31.
The effect of CATIon-line editing is not alwaysconsistent with the effects of SRS batch editing.Without exception, the SRS operational editing pro-cedures have the effect of increasing the levels ofthe estimates. These increases ranged from 0.1S to9.11. The effect of having CATl on-line editingverses nonCATl with no on-line editing increases
18

the estimate~ of so~e variables and decreases theestimates of .others. The direction of thesechan~es are consistent with those measured in Phase1 between CATl and the original responses beforethe on-line edit checks. Of the five variablesincluded in both analyses, only the direction ofth0 chan~e for steers W2S different.
TIle effect of editinG was consistently greater onthe nonCATI sample than on the CATI sample. Themedian increases were 3.37- and 1.01 respectively.
Finally. averare interview tiMes were co~puted for theCATl ~~d nonC~T~ samples. and the results presented intable r:; ShOl.J little difference. HOI·rever, there wereproblens in ~ettin~ cOr'.pLJ.rabledata for this variable.The CA7I pro~r2n can measure interview time very pre-cise!y. It beGa~ timinG the interview when an appropri-ate respondent cane to the phone and ended when thephone was hunG up. On the nonCATI side. the be~inningand endin~ of the interview can not be defined as. pre-cisely. but is thought to be measured frOM the time thephone beGan to ring until the phone is hung up. If thisis tne case, it would tend to overstate the length ofthe nontATI interviews in relation to the CATr inter-vieHs. Because tine may have been measured differentlyno statistical co~parisons are presented alonG with theesti!:!ates.
Ta~le 5 -- Expanded esti~~tes of avera~e interview ti~e,in minutes. Cattle '7 Survey, Jan. 1, 1983. California----------------------------------------------------------------------------------------------------------------VARIABLE
All Responses
Responses reportingcat tle
19
CATI
8.2
8.5
NCW-CJl.TI
8.2
8.4

CONCLUSIONS
CATl has the potential to benefit SRS data collection ina number of important ways. This study measures theeffect that on-line editing has on data quality andindicates that it can reduce errors in SRS surveys. Tbestudy provides preliminary measures of the _magnitudeincluding a 75J reduction in the number of responseerrors as measured by the statisticians' changes beforesummary. Testing to detect specific biases due to theseresponse errOrs is inconclusive at this time. Differ-ences as high as 15 percent were common. but the testswere only powerful enough to detect those approaching 20percent. Further testing on this and other surveys inmultiple states is needed.
The comparison of CATI versus nonCATl data via the GEedit runs shows that critical errors were substantiallyfewer in number for CATl. Non-critical errors flagsoccurred in equal number for both groups. but the sta-tistician made substantially fewer changes on the CATldata because the respondent had already verified thoseinconsistencies. All together there were 75 percentfewer corrections made to the CATl data after the GEedit than to the nonCATl data.
The direction of change -- whether the effect of editingis an increase or decrease in the estimate -- is dif-ferent for individual variables and the level differ-ences tend to cancel each c,therout when combined. How-ever, the direction of chan.geis consistent between thetwo phases of the study for variables measured in both.This indicates that the effects of on-line editing maybe different from those of SRS operational edit pro-cedures which invariably increased the level of an esti-mate. Again. further testing is needed.
The reduction in the number of corrections from the GEis significant because it demonstrates the potential tosave staff time in data collection in addition toimproving data quality. 'I'hereduction in time for dataprocessing and survey management is a major area ofpotential benefit for SRS that was not addressed exten-sively in this study but needs to be evaluated in thefuture. The Agency should proceed with plans to developan automatic scheduler for the CATl system. Thisscheduler should greatly reduce staff time in managing aCATl survey. Further. the response rates in Phase 2indicate that the automatic scheduler can help improveresponse rates in telephone surveys.
20
REFERENCES[1] Groves, Robert M., Marianne Berry; and Nancy
Mathiowetz. "Some Impacts of ComputerAssisted Telephone Interviewing on SurveyMethods." In the Preceedings of the Sectionon Survey Research Methods. Washington, D. C.:American Statistical Association, 198n.p. 519-524.
[2] House, Carol C. "The Department of Agriculture'sExperience with Computer Assisted TelephoneInterviewing: An Overview of the First TestYear. Unpublished staff report .of the U. S.Department of Agriculture, StatisticalReporting Service, Statistical ResearchDivision. August, 1981.
[3] House, Carol C. and Morton, Betsy T. -MeasuringCATl Effects on Numerical Data." In the Proceedingsof the Section on Survey Research Methods.Washington, D.C.: American Statistical Association,19 83 •
[4] Kish, Leslie. Survey Sampling. New York: JohnWiley & Sons, Inc. 1965, p. 585-586.
[5] Nicholls, William L., II, and George A. Lavender.Berkeley SRC CATl: Preliminary InterviewerManual for Random Adult Studies. Berkeley:University of California, Survey ResearchCenter, December, 1979.
[6] Nicholls, William L., II, George A. Lavender, andJ. Merrill Shanks. Berkeley SRC CATI: AnOverview of Berkeley SRC CAT I Version I.Berkeley: University of California, SurveyResearch Center, February 1980.
[7] Rustemeyer, Anita, Gerald H. Shure, Hiles S. Rogers,and Robert J. Meeker. ·Computer-assistedTelephone Interviewing: De~ign Considerations."In the Preceedings of the Section on Survey ResearchMethods. Washington, D.C.: American StatisticalAssociation, 1978.
[8] Steiner, Michael A. and Douglas G. (leweno. -Studyon the Effects of Changing the Placement and Wordingof Questions in Hog Surveys. Forthcoming staff report.U.S. Department of Agricultural, StatisticalReporting Service, Statistical Research Division,Washington, D. C.
21