computer simulations and inquiry based activities in an
TRANSCRIPT

St. Cloud State UniversitytheRepository at St. Cloud State
Culminating Projects in Teacher Development Department of Teacher Development
5-2016
Computer Simulations and Inquiry BasedActivities in an 8th Grade Earth Science ClassroomAdam P. WilsonSt. Cloud State University, [email protected]
Follow this and additional works at: https://repository.stcloudstate.edu/ed_etds
This Starred Paper is brought to you for free and open access by the Department of Teacher Development at theRepository at St. Cloud State. It hasbeen accepted for inclusion in Culminating Projects in Teacher Development by an authorized administrator of theRepository at St. Cloud State. Formore information, please contact [email protected].
Recommended CitationWilson, Adam P., "Computer Simulations and Inquiry Based Activities in an 8th Grade Earth Science Classroom" (2016). CulminatingProjects in Teacher Development. 7.https://repository.stcloudstate.edu/ed_etds/7

Computer Simulations and Inquiry-Based Activities in an Eighth Grade
Earth Science Classroom
by
Adam Wilson
A Starred Paper
Submitted to the Graduate Faculty of
St. Cloud State University
in Partial Fulfillment of the Requirements
for the Degree
Master of Science in
Curriculum and Instruction
May, 2016
Starred Paper Committee:
Hsueh-I Lo, Chairperson
Ramon Serrano
Merton Thompson
2
Table of Contents
Page
List of Tables ................................................................................................................... 3
List of Figures .................................................................................................................. 4
Chapter
1. Introduction .......................................................................................................... 5
Purpose of the Study ...................................................................................... 5
Research Question ......................................................................................... 6
Rationale ........................................................................................................ 6
Defintion of Terms ......................................................................................... 7
2. Literature Review................................................................................................. 9
Inquiry-Based Learning ................................................................................. 9
Educational Computer Simulations ............................................................... 14
Computer Simulations and Inquiry-Based Learning Activities ..................... 21
3. Conclusion ........................................................................................................... 28
Conclusion ..................................................................................................... 28
Recommendation ........................................................................................... 29
Practice ........................................................................................................... 29
Summary ........................................................................................................ 31
References ........................................................................................................................ 33
3
List of Tables
Table Page
1. Means, Standard Deviations, and Standard Error Means
of the Experimental and Control Groups for
Pretest and Posttest Scores in Academic
Achievement Test .......................................................................................... 13
2. ANCOVA Analysis for the Differences in Posttest Mean
Scores Between Experimental and Control Groups
in Academic Achievement Test ..................................................................... 13
3. Means and Standard Deviations of Test Scores and Attitude
Mean Scores by the Type of Lessons ............................................................ 20
4. Key Articles ......................................................................................................... 27
4
List of Figures
Figure Page
1. Illustration of the 5E Instructional Model ............................................................ 11
2. Students’ Comprehension Gains by Treatments for Male and Female ............... 25
5
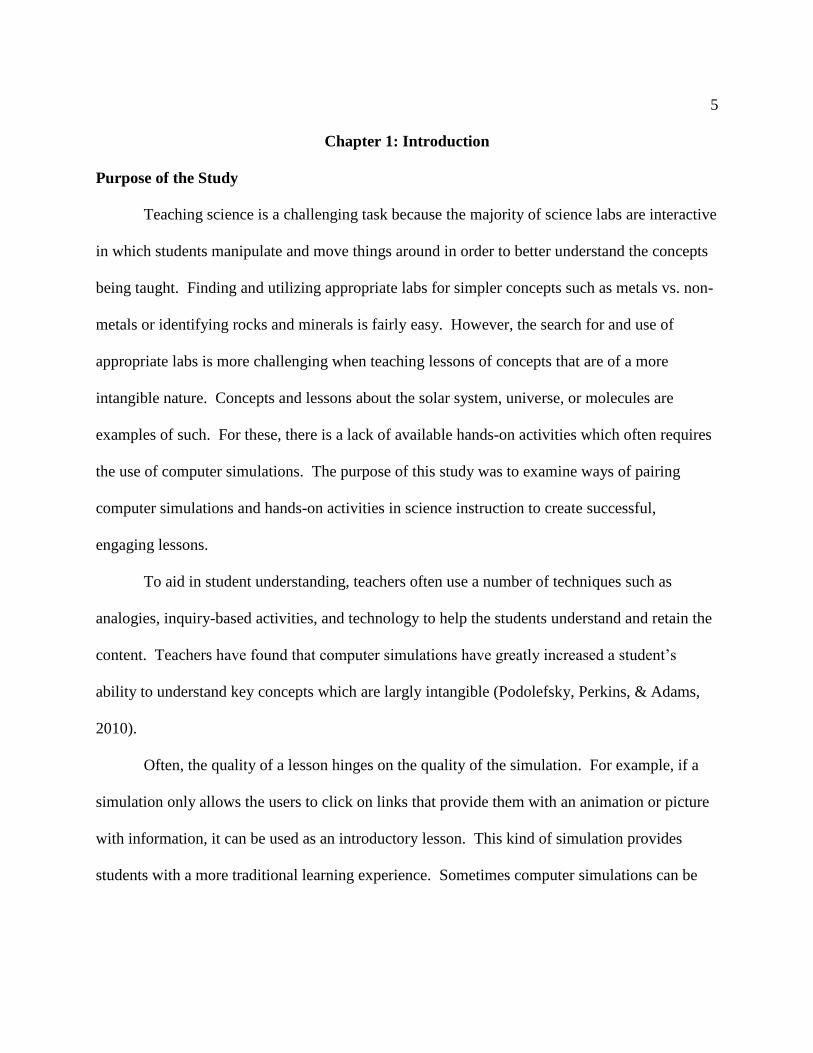
Chapter 1: Introduction
Purpose of the Study
Teaching science is a challenging task because the majority of science labs are interactive
in which students manipulate and move things around in order to better understand the concepts
being taught. Finding and utilizing appropriate labs for simpler concepts such as metals vs. non-
metals or identifying rocks and minerals is fairly easy. However, the search for and use of
appropriate labs is more challenging when teaching lessons of concepts that are of a more
intangible nature. Concepts and lessons about the solar system, universe, or molecules are
examples of such. For these, there is a lack of available hands-on activities which often requires
the use of computer simulations. The purpose of this study was to examine ways of pairing
computer simulations and hands-on activities in science instruction to create successful,
engaging lessons.
To aid in student understanding, teachers often use a number of techniques such as
analogies, inquiry-based activities, and technology to help the students understand and retain the
content. Teachers have found that computer simulations have greatly increased a student’s
ability to understand key concepts which are largly intangible (Podolefsky, Perkins, & Adams,
2010).
Often, the quality of a lesson hinges on the quality of the simulation. For example, if a
simulation only allows the users to click on links that provide them with an animation or picture
with information, it can be used as an introductory lesson. This kind of simulation provides
students with a more traditional learning experience. Sometimes computer simulations can be

6
more useful if students have concepts presented to them prior to doing the simulation, depending
on the complexity of the content.
A simulation can also allow a user to manipulate a number of variables that produce
different outputs; this kind of simulation is used as an inquiry-based lesson. Computer
simulations that are used as an inquiry lesson allow the student to digitally manipulate a number
of variables that produce different results. Inquiry-based lessons are similar to hands-on
activities in that they both provide the student opportunities to change variables.
Many times it is beneficial to pair inquiry-based computer simulations with hands-on,
inquiry-based, real life activities. Research conducted by Eskrootchi and Oskrochi (2010) and
Kim (2006) suggests that pairing in this way significantly affects students’ understanding of the
concept. Though the research done on this topic is rather sparse, the findings do suggest a
positive impact on classroom learning.
Research Question
What is the most effective way to pair computer simulations and inquiry-based learning
activities in an eighth grade Earth Science class?
Rationale
My source of information is ERIC. I searched for full text journals published from the
year 2000 to the present date.
Search terms used:
Educational Technology
Technology
Computer Simulations

7
Simulations
Secondary Science Education
Earth Science
Inquiry-Based Learning
While researching in ERIC, the xyz database included a number of articles that focused
on computer simulations in science instruction at the post-secondary and graduate levels. These
studies often used very complex computer simulations that addressed very complex physics and
chemistry content. Many studies focused on the use of computer simulations in the work place
in order to increase quality of employee training for companies. A number of studies have also
been completed on the effect of computer simulations at the primary level of education. I limited
my search to the middle school level of education and focused on research that was done in
science classrooms, due to it being most pertinent to the research question posed in this paper.
While researching, I found very few articles from years prior to the 2000s pertaining to
computer simulations. This is likely due to the fact that this is a very new area of interest. The
studies of focus used adequate sample sizes, with all sample sizes being between 2-4 class sizes,
and were closest to the grade level and subject that I teach. Also favored were articles that
addressed student attitudes prior to and after the study was completed.
Definition of Terms
Computer simulation: a computer simulation or a computer model is a computer program
that attempts to simulate an abstract model of a particular system.
8
Educational technology: the study and ethical practice of facilitating learning and
improving performance by creating, using, and managing appropriate technological processes
and resources.
Inquiry-based learning: a form of active learning where progress is assessed by how well
students develop experimental and analytical skills rather than how much knowledge they
possess.
Digital natives: a person born and raised during the age of digital technology and
therefore familiar with computers and the Internet from 1990s to present.
Technology: the application of scientific knowledge for practical purposes.
PhET: a suite of research-based interactive computer simulations for teaching and
learning physics, chemistry, math, and other sciences.
STELLA: a flexible computer modeling package with an easy, intuitive interface that
allows users to construct dynamic models that realistically simulate biological systems.
9
Chapter 2: Literature Review
Twenty first century teachers differentiate their teaching strategies from their
predecessors by using technology in their classroom in order to improve student learning. Below
is a review of studies that focus on inquiry-based learning practices and the use of computer
simulations in the science classroom. The focus of this chapter is on how computer simulations
are being paired with hands-on inquiry-based learning activities to provide the student with a
positive learning experience.
Inquiry-Based Learning
Inquiry-based learning encourages students to discover information as an alternative to
teachers dispensing the information directly to them. The 5E Instructional model is a model that
aids teachers in the building of an inquiry-based lesson that has been developed and used by
science teachers (Bybee, 2014; Bybee & Landes, 1990). Duran and Duran (2004) summarized
the five steps or phases of the 5E learning cycle as well as addressed how each phase is used.
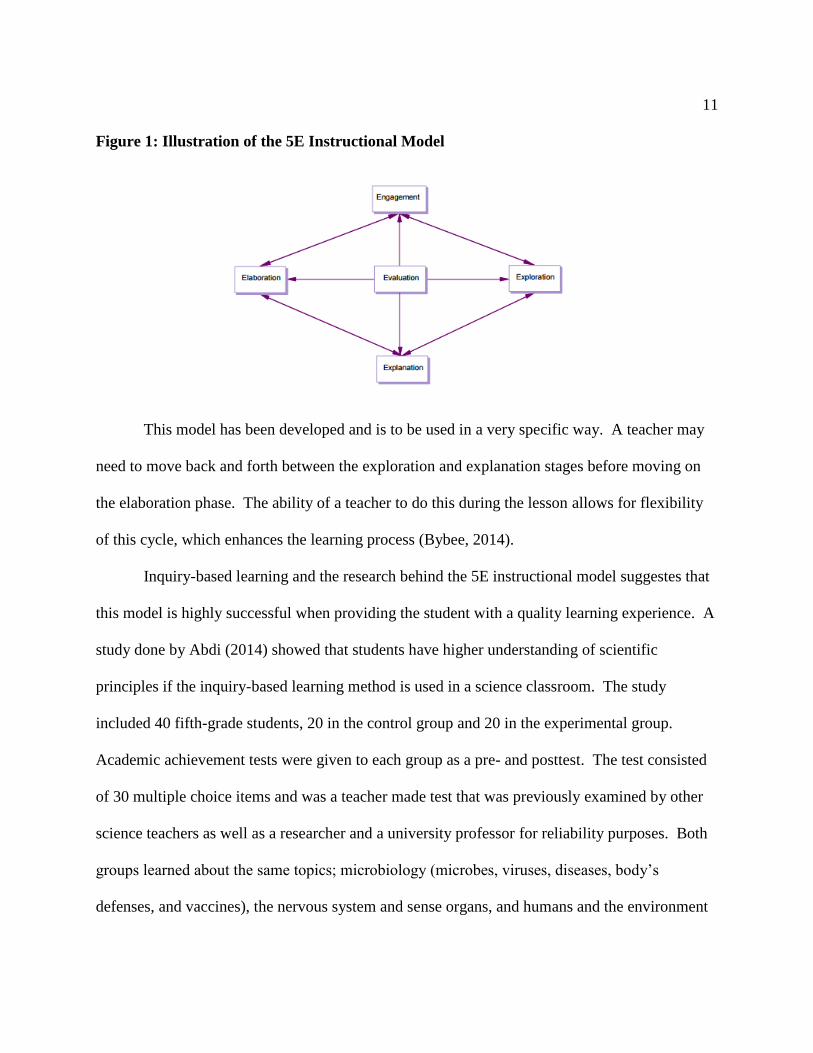
The 5E Instructional Model is broken into five phases of learning: Engagement,
Exploration, Explanation, Elaboration, Evaluation.
Engagement:
o This phase is aimed at addressing student’s prior knowledge and is a motivational
period that pushes the student to want to learn about the content.
Exploration:
o This phase encourages students to explore by making observations, questioning,
investigation, hypothesizing, testing hypotheses, and communicating their results.
This phase is where the main inquiry-based lesson is performed.
10
Explanation:
o This phase allows students to describe their understanding of the content, after it
is learned in the exploration phase. The teacher becomes more of a facilitator
providing guiding questions that enable the students to form their own
explanations. This is also a time when the teacher introduces scientific
information in a direct manner by giving formal definitions and notes.
Elaboration:
o This phase requires students to use the information learned in the explanation
phase and apply it to new situations or scenarios. During this phase students will
design new experiments or models and communicate their understandings with
peers. This phase often encourages students to integrate what they have learned
with other content areas.
Evaluation:
o The evaluation of student progress is very different when compared to traditional
lessons. Inquiry-based assessments look for continual progress in a student’s
learning, looking for the students understanding of new concepts and skills as
well as evidence to show that a student has changed their thinking.
11
Figure 1: Illustration of the 5E Instructional Model
This model has been developed and is to be used in a very specific way. A teacher may
need to move back and forth between the exploration and explanation stages before moving on
the elaboration phase. The ability of a teacher to do this during the lesson allows for flexibility
of this cycle, which enhances the learning process (Bybee, 2014).
Inquiry-based learning and the research behind the 5E instructional model suggestes that
this model is highly successful when providing the student with a quality learning experience. A
study done by Abdi (2014) showed that students have higher understanding of scientific
principles if the inquiry-based learning method is used in a science classroom. The study
included 40 fifth-grade students, 20 in the control group and 20 in the experimental group.
Academic achievement tests were given to each group as a pre- and posttest. The test consisted
of 30 multiple choice items and was a teacher made test that was previously examined by other
science teachers as well as a researcher and a university professor for reliability purposes. Both
groups learned about the same topics; microbiology (microbes, viruses, diseases, body’s
defenses, and vaccines), the nervous system and sense organs, and humans and the environment
12
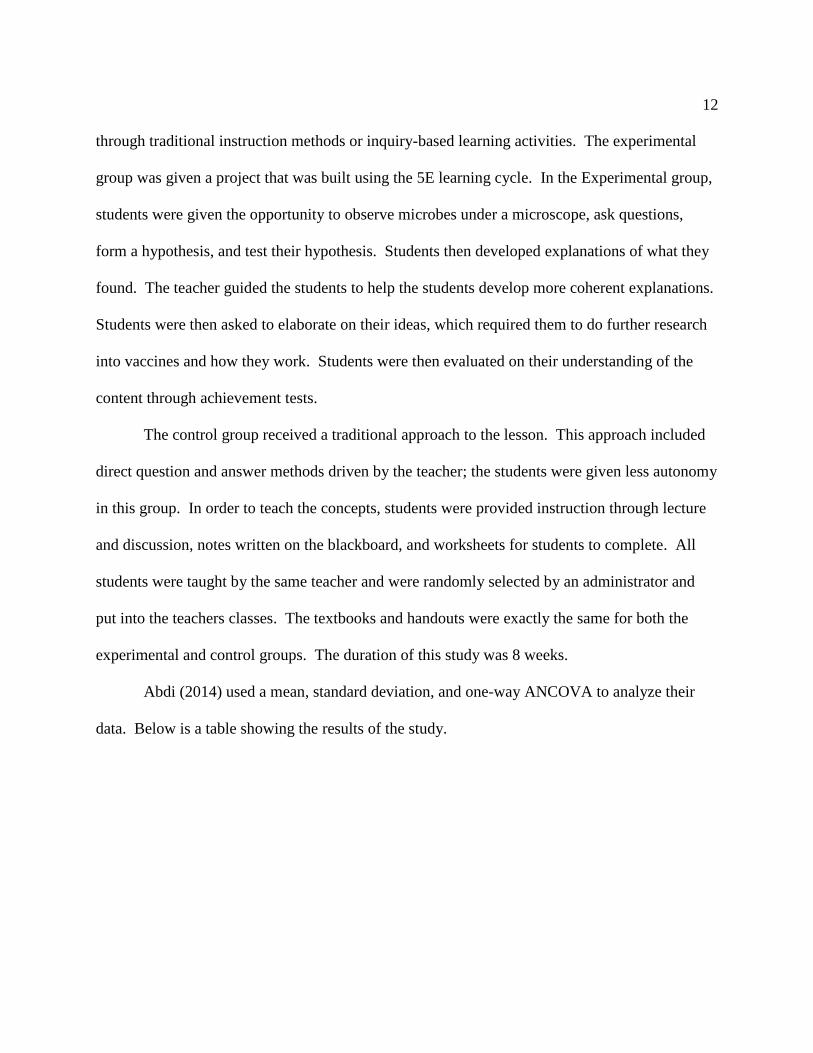
through traditional instruction methods or inquiry-based learning activities. The experimental
group was given a project that was built using the 5E learning cycle. In the Experimental group,
students were given the opportunity to observe microbes under a microscope, ask questions,
form a hypothesis, and test their hypothesis. Students then developed explanations of what they
found. The teacher guided the students to help the students develop more coherent explanations.
Students were then asked to elaborate on their ideas, which required them to do further research
into vaccines and how they work. Students were then evaluated on their understanding of the
content through achievement tests.
The control group received a traditional approach to the lesson. This approach included
direct question and answer methods driven by the teacher; the students were given less autonomy
in this group. In order to teach the concepts, students were provided instruction through lecture
and discussion, notes written on the blackboard, and worksheets for students to complete. All
students were taught by the same teacher and were randomly selected by an administrator and
put into the teachers classes. The textbooks and handouts were exactly the same for both the
experimental and control groups. The duration of this study was 8 weeks.
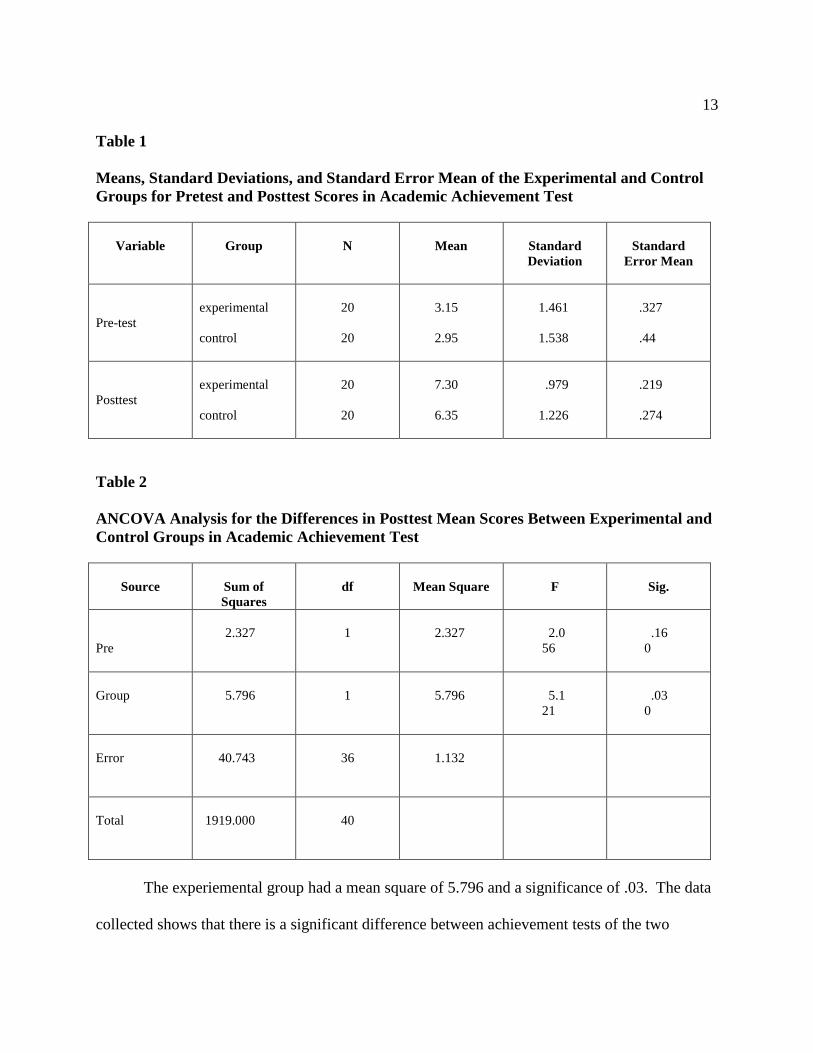
Abdi (2014) used a mean, standard deviation, and one-way ANCOVA to analyze their
data. Below is a table showing the results of the study.
13
Table 1
Means, Standard Deviations, and Standard Error Mean of the Experimental and Control
Groups for Pretest and Posttest Scores in Academic Achievement Test
Variable
Group
N
Mean
Standard
Deviation
Standard
Error Mean
Pre-test
experimental
control
20
20
3.15
2.95
1.461
1.538
.327
.44
Posttest
experimental
control
20
20
7.30
6.35
.979
1.226
.219
.274
Table 2
ANCOVA Analysis for the Differences in Posttest Mean Scores Between Experimental and
Control Groups in Academic Achievement Test
Source
Sum of
Squares
df
Mean Square
F
Sig.
Pre
2.327
1
2.327
2.0
56
.16
0
Group
5.796
1
5.796
5.1
21
.03
0
Error
40.743
36
1.132
Total
1919.000
40
The experiemental group had a mean square of 5.796 and a significance of .03. The data
collected shows that there is a significant difference between achievement tests of the two
14
groups. Overall the study found that those who were taught using an inquiry-based style (5E
learning cycle) were more successful on the achievement tests than those who were taught using
a traditional method. This could mean the students have a greater understanding of the material
if taught using the 5E learning methods.
This research was conducted with a small sample size, which is a limitation of this study.
A larger sample may provide more reliable results in the future . In addition, a pre- and post-
survey of student attitudes toward the two teaching methods may have provided more support for
inquiry-based lessons and their impact on student achievement levels.
Educational Computer Simulations
The use of technology has become an increasingly popular way to facilitate student
learning. Since the 1980s, technology has greatly enhanced learning for students today, largely
due to the way these students learn (Prensky, 2001). Children born after the 1980s are
considered to be the “digital natives” of our world, often spending more time playing video
games, checking email, surfing the web, and texting than generations before them (Prensky,
2001).
In today’s science class, the use of Internet driven computer simulations can address a
complex idea. Concepts such as states of matter, atoms, chemical reactions, plate tectonics, and
lunar phases are difficult to teach without the use of a computer simulation, simply because the
ideas being taught occur on such a large or small scale and they can sometimes be more abstract.
Because Internet driven computer simulations can address complex ideas, they challenge
students to think critically about these abstract concepts.

15
Climatologists use computer simulations or models to analyze changes in a particular
climate. Meteorologists also use simulations to predict weather a week in advance. These
computer simulations use a set of data and variables of local/regional cities to paint a picture of a
potential future. An educational computer simulation is designed in a similar way. The
simulation is a computer program that allows users to change a particular set of variables or
parameters, which then builds a virtual environment using those variables or parameters.
Because of this, computer simulations have been able to be very engaging for students, provided
the student is the one asking the questions and driving the investigation.
Adams, Paulson, and Wieman (2008) and her team’s results from their research support
this idea. Reid et al. (2008) and Podolefsky, Perkins, and Adams (2010) did similar research and
had similar results. Adams’ team conducted over 250 think aloud style interviews with 100
student volunteers. Students were interviewed multiple times throughout the simulation. The
think out loud interviews were not set up to ask for the students opinions or feedback of the
simulation, rather they were focused on how the participant thought out loud throughout the
experience. This allowed researchers to see how the participant was thinking throughout the
simulation. There were four to six interviews, lasting 30-60 minutes, conducted for each
simulation and all were videotaped to allow for a deeper analysis of the evidence. There were
four different types of interviews, or levels of guidance, and each type were created as an
independent variable. The four types were as follows:
16
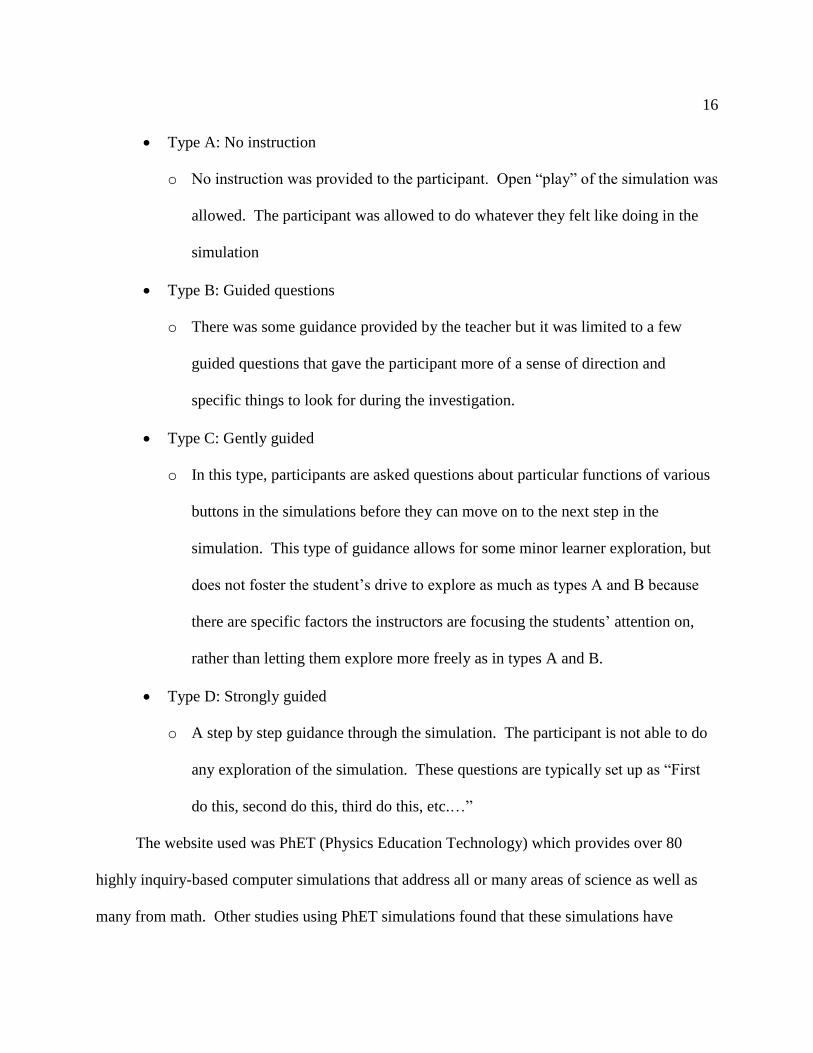
Type A: No instruction
o No instruction was provided to the participant. Open “play” of the simulation was
allowed. The participant was allowed to do whatever they felt like doing in the
simulation
Type B: Guided questions
o There was some guidance provided by the teacher but it was limited to a few
guided questions that gave the participant more of a sense of direction and
specific things to look for during the investigation.
Type C: Gently guided
o In this type, participants are asked questions about particular functions of various
buttons in the simulations before they can move on to the next step in the
simulation. This type of guidance allows for some minor learner exploration, but
does not foster the student’s drive to explore as much as types A and B because
there are specific factors the instructors are focusing the students’ attention on,
rather than letting them explore more freely as in types A and B.
Type D: Strongly guided
o A step by step guidance through the simulation. The participant is not able to do
any exploration of the simulation. These questions are typically set up as “First
do this, second do this, third do this, etc.…”
The website used was PhET (Physics Education Technology) which provides over 80
highly inquiry-based computer simulations that address all or many areas of science as well as
many from math. Other studies using PhET simulations found that these simulations have
17
dramatically increased student understanding of the physical world by allowing students to take
control over the simulation to manipulate the variables (Moore, Chamberlain, Parson, & Perkins,
2014; Perkins, Moore, Podolefsky, Lancaster, & Denison, 2012).
Adams et al. (2008) found the participants that had experienced types A and B had gained
physical insights into the ideas presented in the simulation by their ability to ask their own
questions. This allowed them to have control over where they were going throughout the
simulation. They also found that students who were told the answers, or who were strongly
guided, were not able to develop the framework necessary for solving future problems in the
content area.
The research team also found that the type of interview and the complexity of the
simulation played a very important role in the participant’s ability to work through it. If the
simulation was too complex and the participant was given type A or B guidance, researchers
found that the participant was less likely to complete the simulation, oftentimes giving up or
losing interest. They found that participants with type C guidance benefited more during a
complex simulation. Analysis of the video and audio collected showed that students with type C
guidance were able to build a better framework of the concepts at hand due to being able to
explore on their own with little guidance.
Research completed by Podolefsky et al. (2013) also supported Adams et al. (2008)
research which showed that students need to be in control of their learning. Podolefsky et al.’s
(2013) research was focused on the amount of time a student was allowed to play with the
simulation prior to doing the assignment and how well the students were able to work through
the simulation based on the type of questions that were being asked by the teacher. The
18
simulation used was a PhET simulation called “Bending Light.” Researchers used two fifth
grade science classes, one class had eight students (experimental group) and the other had five
students (control group). The experimental group was allowed 8 minutes of free play at the
beginning of the simulation and the control group started the simulation right away.
To collect their data, researchers used a video camera to record the classroom as students
worked as well as software called Camtasia, which allowed researchers to record all of the
student’s computer screens while they were working through the simulation. The research team
also used microphones that were built into the computers to record student voices. The
researchers recorded students every 15 seconds throughout the time period. In order to
effectively quantify and organize the data, they created codes to signify the type of teacher
questioning that was happening throughout the period, TOQ stands for Teacher Open Question
and TCI stands for Teacher-Centered Question. Doing this allowed them to sort through and
understand if students were using the simulation during or after teacher questioning and to
quantify the different kinds of questions being asked (TOQ or TCI). This was also paired with
microphone recordings which allowed researchers to understand how the students worked their
way through the simulation.
After analyzing the data, researchers found that the students who had more play time at
the beginning had more time using the simulation throughout the class period. When students
were allowed more play time, they found that the number of teacher envoked questions to the
class were dramatically reduced. In addition, the teacher led discussions throughout the lesson
were high quality discussions, as determained by the teacher through the amount of student
engagement during the discussions. This is an indicator that the scientific concepts addressed in
19
the simulation were being understood. The class that did not have play time at the beginning had
less time, overall, working with the simulation and had a difficult time working through the
simulation. There was found to be more teacher redirection throughout the time period and the
discussions led by the teacher did not have the quality that the play group had due to the students
inability to understand the scientific principles.
Researchers concluded that if the teacher gives the student 5-10 minutes of play time
prior to doing the simulation, students tend to feel as though they have more ownership over the
simulation and because of that will have a more productive experience during the simulation. A
limitation to this sudy is that the sample size was very small. Despite the small sample, the
results still strengthen the theory that computer simulations and instruction that is built with the
philosophy that the student is at the center of his or her learning will provide the student with the
most learning. Also, to better quantify their data, the researchers could have utilized a pre- and
posttest to better understand student progress with the scientific concepts and possibly student
attitudes about the activity.
Other types of computer simulations can be utilized in more technologically advanced
ways. The use of 3D virtual reality simulations have been successfully used in the classroom
(Kim, 2006). A study was done on fifth grade earth science students during a plate tectonics unit
(Kim, 2006). It focused on the comparison of a 3D virtual reality simulation and a traditional 2D
simulation and how they affect student’s achievement on test scores as well as how their
attitudes toward science changed from the beginning to the end of the study. In order to test this,
pre- and posttests were given, measuring student achievement as well as surveying students in
order to measure student attitudes toward science.
20
Two groups were selected, a 2D group and a 3D group. The 2D group was designated as
the control group with 20 students. The 3D group was the experimental group and contained 21
students. Gender and ethnicity were noted and no prior information about the content was taught
before the simulation.
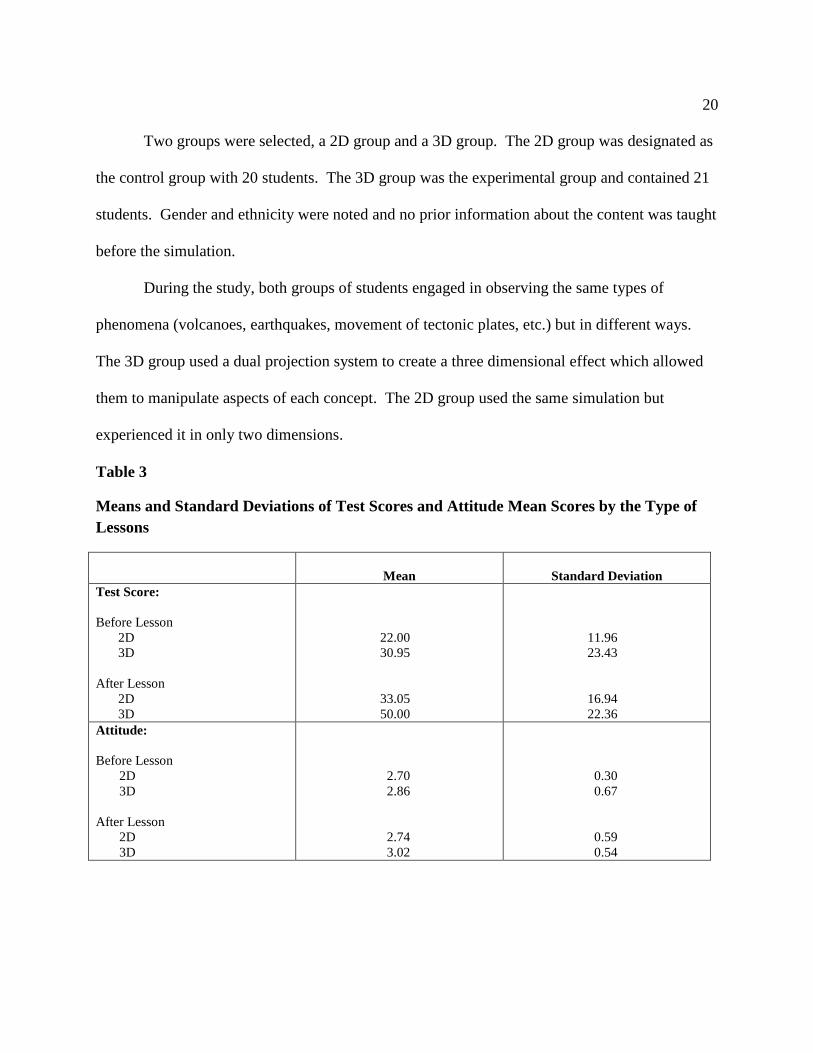
During the study, both groups of students engaged in observing the same types of
phenomena (volcanoes, earthquakes, movement of tectonic plates, etc.) but in different ways.
The 3D group used a dual projection system to create a three dimensional effect which allowed
them to manipulate aspects of each concept. The 2D group used the same simulation but
experienced it in only two dimensions.
Table 3
Means and Standard Deviations of Test Scores and Attitude Mean Scores by the Type of
Lessons
Mean
Standard Deviation
Test Score:
Before Lesson
2D
3D
After Lesson
2D
3D
22.00
30.95
33.05
50.00
11.96
23.43
16.94
22.36
Attitude:
Before Lesson
2D
3D
After Lesson
2D
3D
2.70
2.86
2.74
3.02
0.30
0.67
0.59
0.54
21
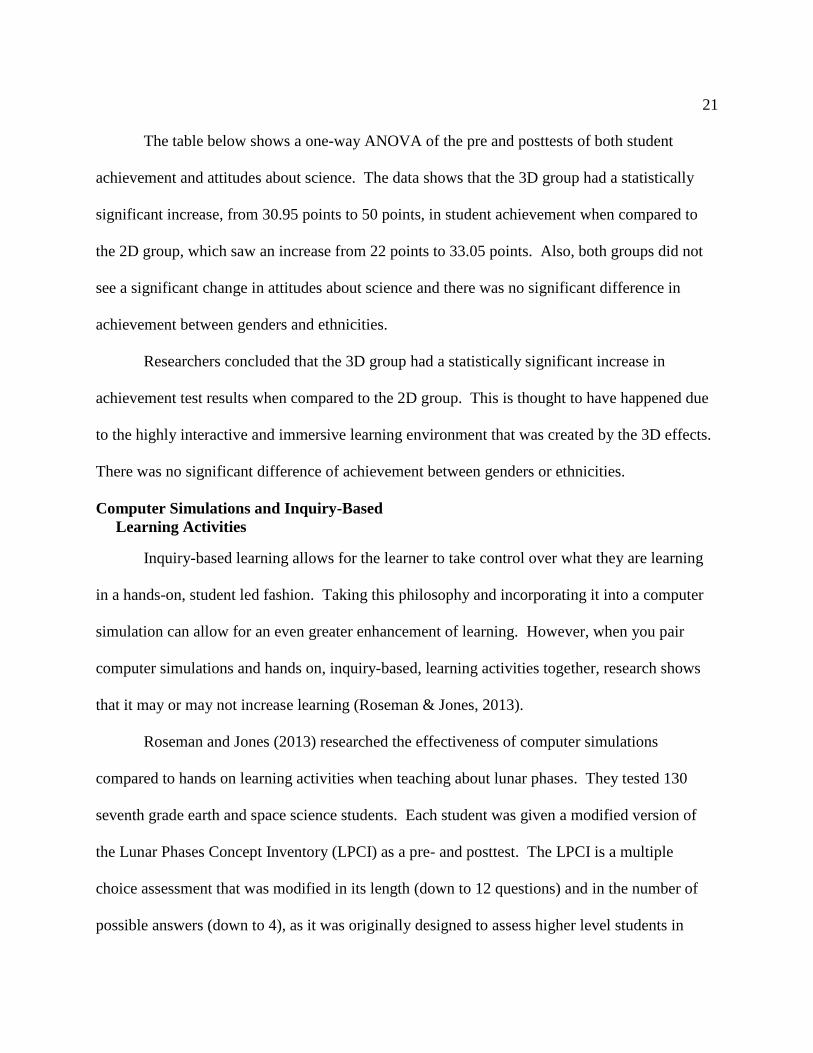
The table below shows a one-way ANOVA of the pre and posttests of both student
achievement and attitudes about science. The data shows that the 3D group had a statistically
significant increase, from 30.95 points to 50 points, in student achievement when compared to
the 2D group, which saw an increase from 22 points to 33.05 points. Also, both groups did not
see a significant change in attitudes about science and there was no significant difference in
achievement between genders and ethnicities.
Researchers concluded that the 3D group had a statistically significant increase in
achievement test results when compared to the 2D group. This is thought to have happened due
to the highly interactive and immersive learning environment that was created by the 3D effects.
There was no significant difference of achievement between genders or ethnicities.
Computer Simulations and Inquiry-Based
Learning Activities
Inquiry-based learning allows for the learner to take control over what they are learning
in a hands-on, student led fashion. Taking this philosophy and incorporating it into a computer
simulation can allow for an even greater enhancement of learning. However, when you pair
computer simulations and hands on, inquiry-based, learning activities together, research shows
that it may or may not increase learning (Roseman & Jones, 2013).
Roseman and Jones (2013) researched the effectiveness of computer simulations
compared to hands on learning activities when teaching about lunar phases. They tested 130
seventh grade earth and space science students. Each student was given a modified version of
the Lunar Phases Concept Inventory (LPCI) as a pre- and posttest. The LPCI is a multiple
choice assessment that was modified in its length (down to 12 questions) and in the number of
possible answers (down to 4), as it was originally designed to assess higher level students in
22
more advanced classes. The assessment was also modified to be in accordance to federal law for
students who have an IEP (Individualized Education Plan), in which case these students were
given fewer possible answers.
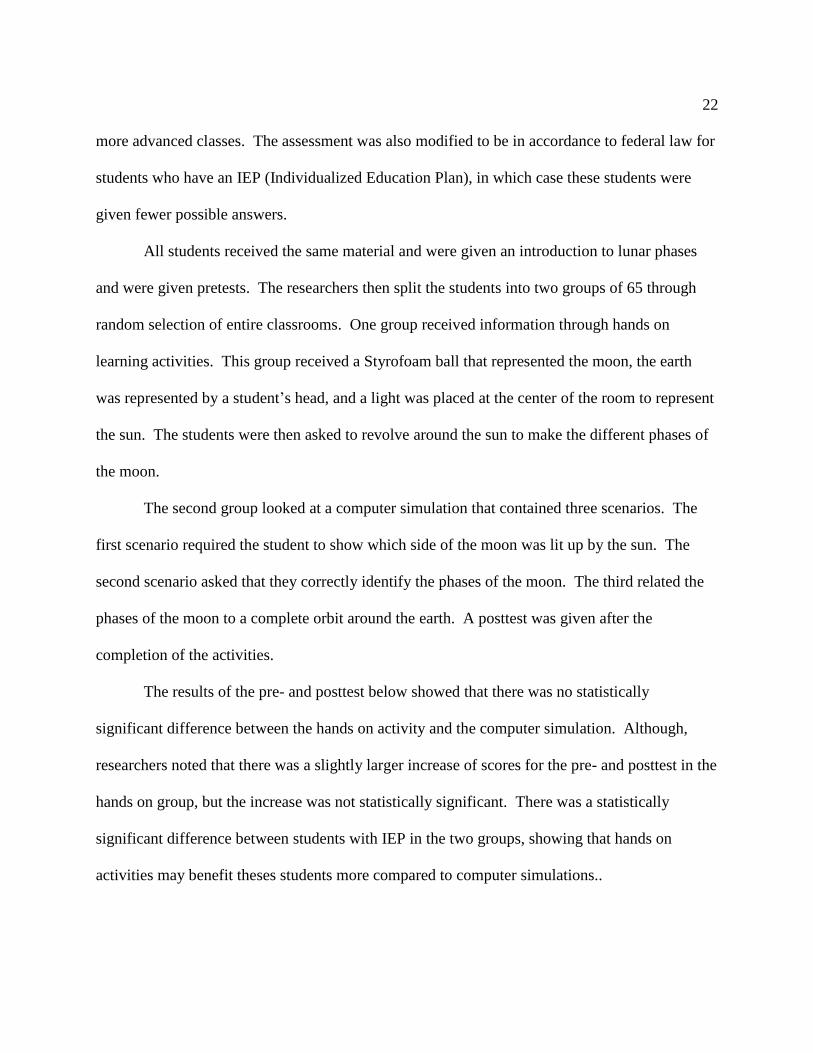
All students received the same material and were given an introduction to lunar phases
and were given pretests. The researchers then split the students into two groups of 65 through
random selection of entire classrooms. One group received information through hands on
learning activities. This group received a Styrofoam ball that represented the moon, the earth
was represented by a student’s head, and a light was placed at the center of the room to represent
the sun. The students were then asked to revolve around the sun to make the different phases of
the moon.
The second group looked at a computer simulation that contained three scenarios. The
first scenario required the student to show which side of the moon was lit up by the sun. The
second scenario asked that they correctly identify the phases of the moon. The third related the
phases of the moon to a complete orbit around the earth. A posttest was given after the
completion of the activities.
The results of the pre- and posttest below showed that there was no statistically
significant difference between the hands on activity and the computer simulation. Although,
researchers noted that there was a slightly larger increase of scores for the pre- and posttest in the
hands on group, but the increase was not statistically significant. There was a statistically
significant difference between students with IEP in the two groups, showing that hands on
activities may benefit theses students more compared to computer simulations..
23
Qualitative data was also collected in the form of field notes and documented
observations. Researchers found that during the pretest, students tended to close their eyes and
visualize with their hands, using them to model the moon as it revolved around the earth and
presumably what the moon looked like at night. This was also observed during the posttest. One
difference that was noted was that the students who were in the hands on group were orienting
themselves, in relation to the sun, in their seats. This was thought to provide a better visual when
trying to answer the posttest questions. This behavior was not seen from students in the
computer simulation group. Researchers also noticed that some students with IEPs became
frustrated with the computer simulation, which could have a negative impact in their
understanding of the material.
This study concluded that there was no statistical significance between the hands on
group and the computer simulation group. Both activities seemed to have the same increase in
test scores. One limitation to this study is that the computer simulation used may not have been
an inquiry-based computer simulation, the research did not indicate which simulation was used.
Because of that, students in the hands on group may have been provided a more student-centered
learning opportunity than those in the simulation group. That could have a major effect on the
results of this study.
Roseman and Jones (2013) found that there was no statistically significant evidence to
support using hands on activities over computer simulations. But, Eskrootchi and Oskrochi
(2010) found that instead of using one method or the other, the pairing of computer simulations
and hands-on activities proved to be successful when teaching about watersheds and the use of

24
water, when compared to more traditional teaching and sole use of simulations to teach material.
(Eskrootchi & Oskrochi, 2010)
Eskrootchi and Oskrochi (2010) conducted the study with 72 sixth- to eighth-graders
(32 males and 40 females). All students received the same initial information through online
sites, collaborating with peers, defining terminologies and using hyperlinks to additional
information. All material was delivered by the same teacher. Prior to the study, all students took
a pretest that consisted of 58 questions to assess their understanding of watersheds and content
knowledge as well as their attitude toward the project. Researchers then randomly split the
participants into three groups:
Project Based (PB): 19 participants
o Taught content through traditional lecture only.
Project Based Experimental Simulation (PBES): 33 participants
o Taught content by performing an experimental model and a simulation model.
Project Based Simulation (PBS): 20 participants
o Taught content by a simulation model only.
A lesson on the “effect of land-use on the watershed” was developed using two methods.
One method was an experimental model, or hands on method, that used a sponge and cardboard,
and the second was a computer simulation called STELLA (Structural Thinking and Experiential
Learning Laboratory with Animation) which allowed students to manipulate variables to
scenarios that investigate how humans interact with their environment. Two STELLA
applications were used. The first application, STELLA1, used data obtained from the
experimental model with the sponge and cardboard. The second application, STELLA2, was
25
more advanced and was created using real data from a watershed. The applications allowed the
students to manipulate a number of factors and variables on the watershed.
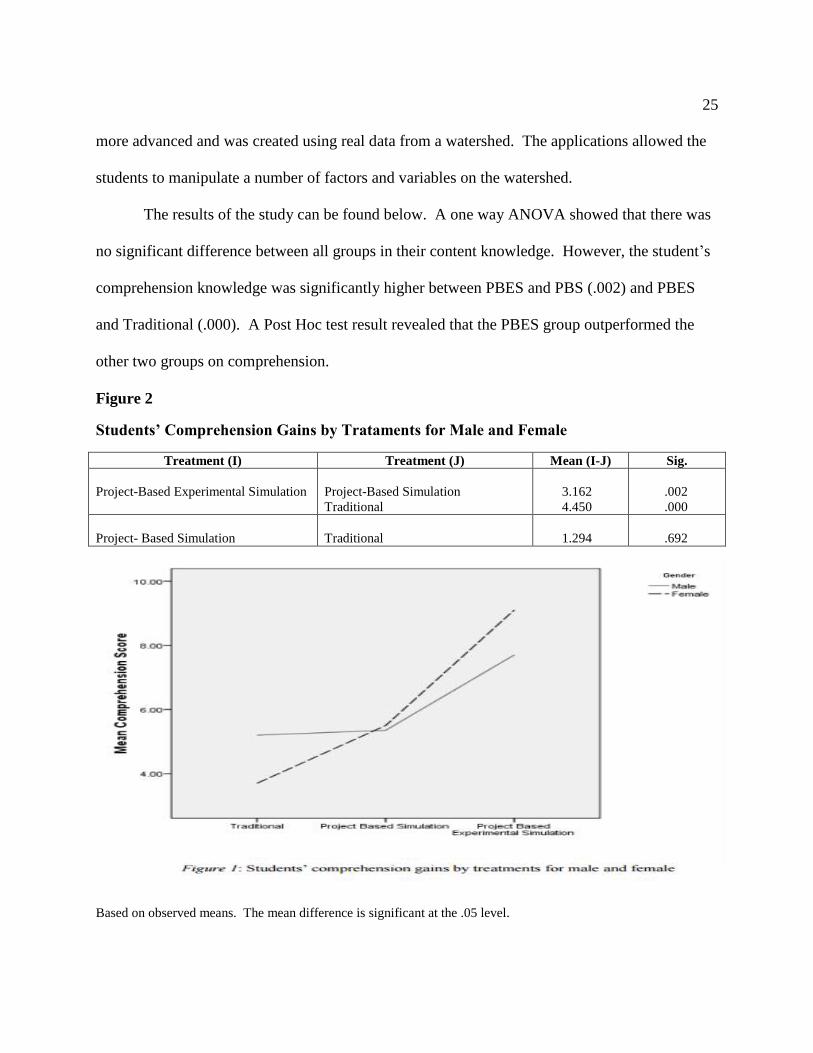
The results of the study can be found below. A one way ANOVA showed that there was
no significant difference between all groups in their content knowledge. However, the student’s
comprehension knowledge was significantly higher between PBES and PBS (.002) and PBES
and Traditional (.000). A Post Hoc test result revealed that the PBES group outperformed the
other two groups on comprehension.
Figure 2
Students’ Comprehension Gains by Trataments for Male and Female
Treatment (I) Treatment (J) Mean (I-J) Sig.
Project-Based Experimental Simulation
Project-Based Simulation
Traditional
3.162
4.450
.002
.000
Project- Based Simulation
Traditional
1.294
.692
Based on observed means. The mean difference is significant at the .05 level.
26
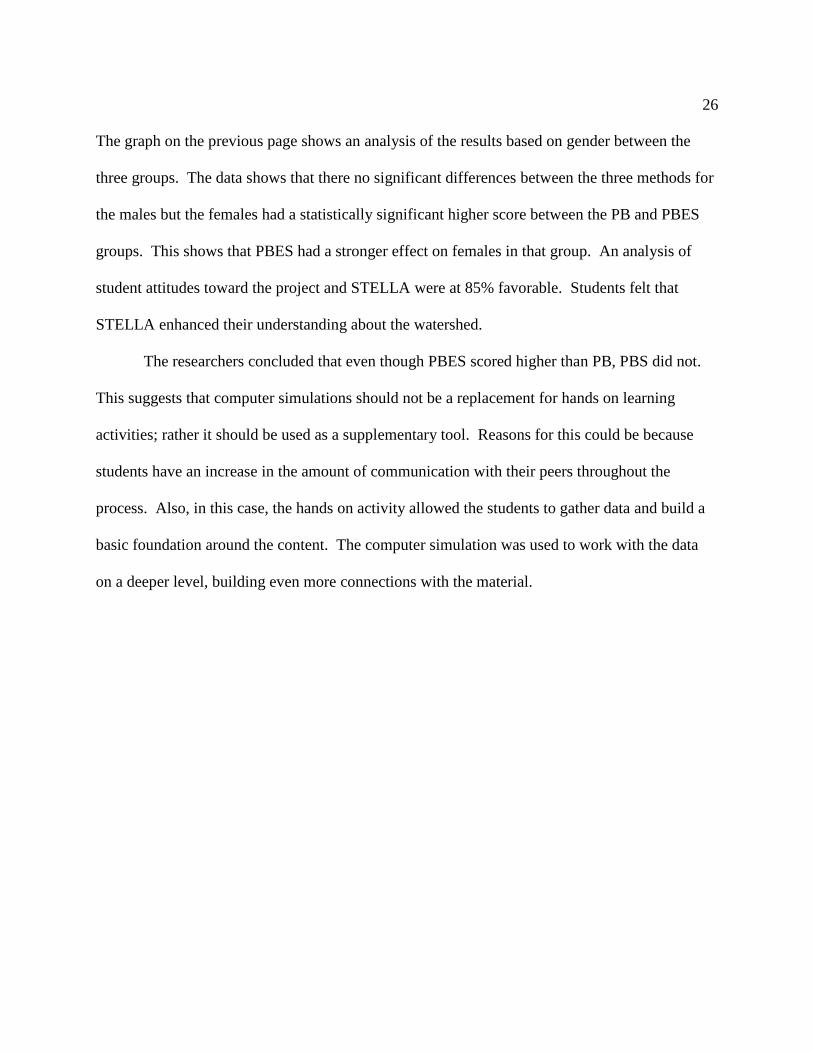
The graph on the previous page shows an analysis of the results based on gender between the
three groups. The data shows that there no significant differences between the three methods for
the males but the females had a statistically significant higher score between the PB and PBES
groups. This shows that PBES had a stronger effect on females in that group. An analysis of
student attitudes toward the project and STELLA were at 85% favorable. Students felt that
STELLA enhanced their understanding about the watershed.
The researchers concluded that even though PBES scored higher than PB, PBS did not.
This suggests that computer simulations should not be a replacement for hands on learning
activities; rather it should be used as a supplementary tool. Reasons for this could be because
students have an increase in the amount of communication with their peers throughout the
process. Also, in this case, the hands on activity allowed the students to gather data and build a
basic foundation around the content. The computer simulation was used to work with the data
on a deeper level, building even more connections with the material.
27
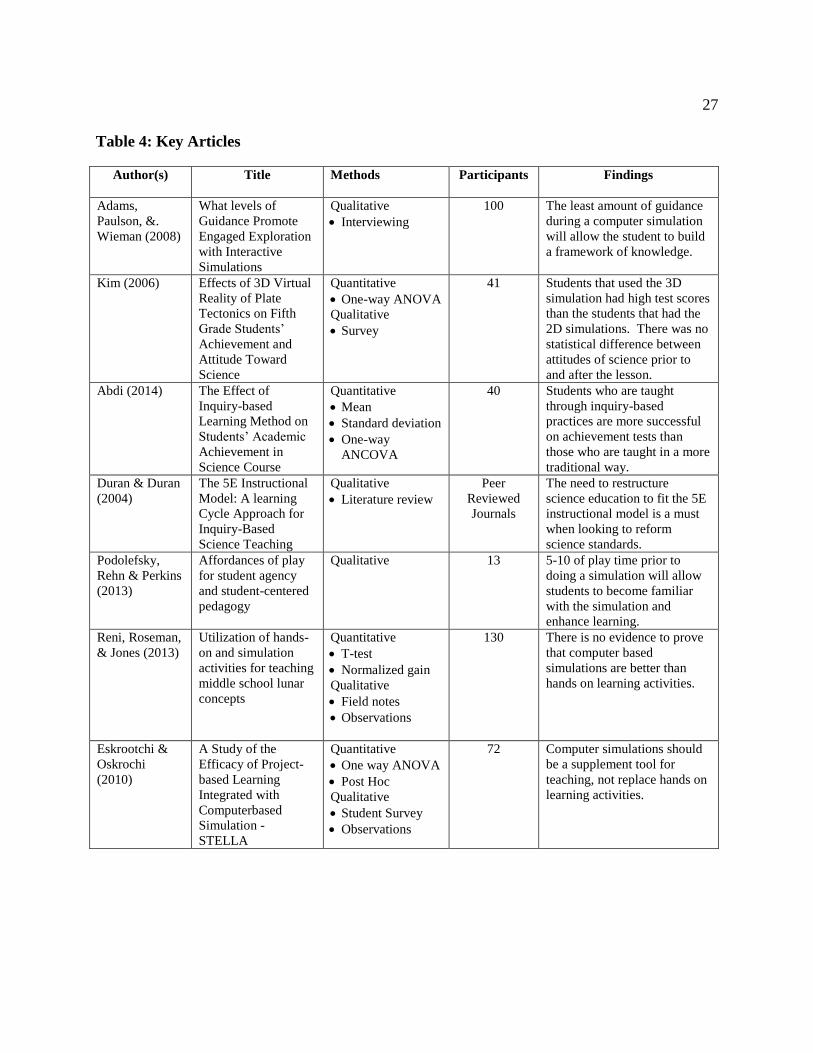
Table 4: Key Articles
Author(s) Title Methods Participants Findings
Adams,
Paulson, &.
Wieman (2008)
What levels of
Guidance Promote
Engaged Exploration
with Interactive
Simulations
Qualitative
Interviewing
100 The least amount of guidance
during a computer simulation
will allow the student to build
a framework of knowledge.
Kim (2006) Effects of 3D Virtual
Reality of Plate
Tectonics on Fifth
Grade Students’
Achievement and
Attitude Toward
Science
Quantitative
One-way ANOVA
Qualitative
Survey
41 Students that used the 3D
simulation had high test scores
than the students that had the
2D simulations. There was no
statistical difference between
attitudes of science prior to
and after the lesson.
Abdi (2014) The Effect of
Inquiry-based
Learning Method on
Students’ Academic
Achievement in
Science Course
Quantitative
Mean
Standard deviation
One-way
ANCOVA
40 Students who are taught
through inquiry-based
practices are more successful
on achievement tests than
those who are taught in a more
traditional way.
Duran & Duran
(2004)
The 5E Instructional
Model: A learning
Cycle Approach for
Inquiry-Based
Science Teaching
Qualitative
Literature review
Peer
Reviewed
Journals
The need to restructure
science education to fit the 5E
instructional model is a must
when looking to reform
science standards.
Podolefsky,
Rehn & Perkins
(2013)
Affordances of play
for student agency
and student-centered
pedagogy
Qualitative 13 5-10 of play time prior to
doing a simulation will allow
students to become familiar
with the simulation and
enhance learning.
Reni, Roseman,
& Jones (2013)
Utilization of hands-
on and simulation
activities for teaching
middle school lunar
concepts
Quantitative
T-test
Normalized gain
Qualitative
Field notes
Observations
130 There is no evidence to prove
that computer based
simulations are better than
hands on learning activities.
Eskrootchi &
Oskrochi
(2010)
A Study of the
Efficacy of Project-
based Learning
Integrated with
Computerbased
Simulation -
STELLA
Quantitative
One way ANOVA
Post Hoc
Qualitative
Student Survey
Observations
72 Computer simulations should
be a supplement tool for
teaching, not replace hands on
learning activities.
28
Chapter 3: Conclusion
I have had the opportunity to teach a variety of subjects within the science field
throughout my teaching career. In all subjects, I have relied heavily on computer simulations to
help students understand the content. The reason for this was because the content was either too
complex to be taught using a hands on activitiy or I did not have the funds available to carry out
the needed activities.
I have often used computer simulations instead of hands-on activities because computer
simulations were able to give my students an opportunity to dig deeper in their investigation than
a hands on activity would allow for. However, at times I have used hands-on activities. This
was because there was a distinct benefit in providing students the opportunity to be able to touch
and manipulate real-life objects. I have often wondered about the outcome of research which
would focus on various ways to use both computer simulations and hands on activity to get a
“best” result, when it comes to student learning. What is the most effective way to pair computer
simulations and inquiry-based learning activities in an eighth grade Earth Science class?
Conclusion
In conclusion, there are a number of different kinds of computer simulations used in the
science classroom. Inquiry-based learning practices are successful at teaching students complex
content. Studies show that students need to be at the center of their learning in order for the
lesson to be successful. The student needs to be able to drive their learning or be gently guided
by the teacher in order to explore the content on a deeper level.
Computer simulations and hands on activities should be used together as supplementary
tools. Eskrootchi and Oskrochi (2010) found that computer simulations should not be used in
29
place of hands on activities because of the benefits of peer to peer communication and
collaboration, as well as it provides a “real” experience where the student is able to use their
senses to build a framework around the content. This has been shown to improve the
comprehension of scientific concepts.
Recommendation
After reviewing the research, my recommendations are as follows: Instead of replacing
hands on activities with computer simulations, the pairing of computer simulations and inquiry-
based curriculum is a better approach. Eskrootchi and Oskrochi (2010) found that the pairing of
the two enhances the learning of the student and allows them to explore scientific principles on a
deeper level. Additionally, teachers should find ways to use both methods to enhance their
science curriculum. Third, teachers should also address the type of computer simulations as well.
Computer simulations that are built around an inquiry-based philosophy provides the learner
with the most enhanced learning opportunities when compared with computer simulations that
are built around a more traditional style of learning (information seeking, question and answer
type simulations).
Practice
The research done by Podolefsky et al. (2010) was very encouraging because I have tried
the same in my classes and had a similar result. Allowing students to play with the computer
simulation at the beginning of the period gives students a chance to explore independently. It is
similar to someone learning to play a new video game or learning how to operate an iPad.
Learning as you go seems to give students control and promotes exploration.
30
When I found the Podolefsky et al. (2010) research, I knew I wanted to test it in my
classroom. I have noticed that if I allow students time at the beginning of class, there are fewer
questions throughout the class because they already know how to operate the simulation. There
is also a greater degree of frustration from a few of the students when they are not able to
understand the controls for the first part of the class. In these instances, I found that I needed to
incorporate more guiding questions for these students. Type of questioning was also part of
Podolefsky’s et al.’s (2010) research. They found that particular types of questioning from the
teacher allowed for a better learning experience. I used more of a guided questioning method for
the time that I allowed the students to play to alleviate student frustration and prevent them from
giving up at the beginning.
Adam et al.’s (2008) research also supported the idea that the least amount of guidance
throughout the computer simulation allows the student to form a better framework of the
scientific principles. This is also an article that I came across early in my research. I used the
findings and incorporated them in a few of the PhET computer simulations (States of Matter,
Plate Tectonics, Glaciers) earlier this year and found that it worked for some classes and not for
others. I found that for classes that had students with higher academic levels or students who had
more experience playing video games tended to do well with as little guidance as possible.
Although, the students with the more gaming experience tended to get off track a little more and
required more redirection than other groups of students. The classes that had lower academic
levels or had students who did not play many video games struggled with the simulation and
required more guidance. I plan on continuing to use computer simulations but I will be more
mindful of who might need a little more guidance throughout the activity.

31
There is a lot of research that has been done on the different kinds of computer
simulations available to the classroom. There is also a lot of research done on how to effectively
implement inquiry-based activities. But there is not a lot of research out there about the use of
the two together. I found that Eskrootchi and Oskrochi’s (2010) research on the how to
incorporate computer simulations into a inquiry-based classroom to be the most informative
article I found, when it comes to pairing the teaching methods. Their research shows that
computer simulations should not take the place of inquiry-based activities; instead they should be
used as a supplementary resource to inquiry-based activities. My practices in the classroom have
been different from the recommendations of this research. I have replaced several of my hands
on lessons with computer simulations due to the fact that they do a better job at helping the
students to understand the material. In the future, however, I will be reincorporating the hands
on learning back into my curriculum and using computer simulations as a supplementation to the
lesson.
Summary
Teaching can be a challenging task, especially when teaching concepts related to science.
Many activities done in a science class are hands on activities where the students manipulate and
move things around in order to better understand the concepts at hand. Pairing computer
simulations with hands on activities can further enhance learning for the student, allowing them
to explore the content on a deeper level.
Ann Landers says it best when she says, “It is not what you do for your children, but what
you have taught them to do for themselves that will make them successful human beings.”
Teaching the student to take control of his or her own learning and allowing them to explore and

32
discover on their own, whether it’s through hands on learning or computer simulations, is the
most important part of the lesson.
33
References
Abdi, A. (2014). The effect of inquiry-based learning method on students' academic achievement
in science course. Universal Journal Of Educational Research, 2(1), 37-41.
Adams, W. K., Paulson, A., & Wieman, C. E. (2008). What levels of guidance promote engaged
exploration with interactive simulations? AIP Conference Proceedings, 1064(1), 59-62.
doi:10.1063/1.3021273
Bybee, R. W. (2014). The BSCS 5E instructional model: Personal reflections and contemporary
implications. Science & Children, p. 10.
Bybee, R., & Landes, N. M. (1990). Science for life and living: An elementary school science
program from biological sciences improvement study (BSCS). The American Biology
Teacher, 52(2), 92-98.
Duran, L. B., & Duran, E. (2004). The 5E instructional model: A learning cycle approach for
inquiry-based science teaching. Science Education Review, 3(2), 49-58.
Eskrootchi, R., & Oskrochi1, G. R. (2010). A study of the efficacy of project-based learning
integrated with computer based simulation--STELLA. Journal of Educational
Technology & Society, 13(1), 236-245.
Kim, P. (2006). Effects of 3D virtual reality of plate tectonics on fifth grade students'
achievement and attitude toward science. Interactive Learning Environments,14(1),
25-34. doi:10.1080/10494820600697687
Moore, E. B., Chamberlain, J. M., Parson, R., & Perkins, K. K. (2014). PhET interactive
simulations: Transformative tools for teaching chemistry. Journal of Chemical
Education, 91(8), 1191-1197.

34
Perkins, K., Moore, E., Podolefsky, N., Lancaster, K., & Denison, C. (2012). Towards research-
based strategies for using PhET simulations in middle school physical science
classes. AIP Conference Proceedings, 1413(1), 295-298. doi:10.1063/1.3680053
PhET (Physics Education Technology). Retrieved from http://phet.colorado.edu/en/simulations/
index.
Podolefsky, N. S., Perkins, K. K., & Adams, W. K. (2010). Factors promoting engaged
exploration with computer simulations. Physical Review Special Topics--Physics
Education Research, 6(2), 020117-1-020117-11.
Podolefsky, N. S., Rehn, D., & Perkins, K. K. (2013). Affordances of play for student agency
and student-centered pedagogy. AIP Conference Proceedings, 1513(1), 306-309.
doi:10.1063/1.4789713
Prensky, M. (2001b). Digital natives, digital immigrants part 1. On The Horizon, 9(5), 3-6.
Reid, S., Adams, W. K.,LeMaster, R., McKagan, S. B., Perkins, K. K., Dubson, M., & Wieman,
C. E. (2008). A study of educational simulations part 1--engagement and learning.
Journal of Interactive Learning Research, 19(3), 397-419.
Roseman, R. B., & Jones, D. L. (2013). Utilization of hands-on and simulation activities for
teaching middle school lunar concepts. AIP Conference Proceedings, 1513(1), 346-349.
doi:10.1063/1.4789723