computerized measurement of psychological vital signs in …€¦ · · 2017-09-27list of tables...
TRANSCRIPT
COMPUTERIZED MEASUREMENT OF PSYCHOLOGICAL VITAL SIGNS
IN A CLINICAL SETTING
by
RYAN K. RUSSON
A thesis submitted in partial fulfillment of the requirements for the degree of
Master of Arts Department of Psychology
College of Arts and Sciences University of South Florida
Major Professor: Charles D. Spielberger, Ph.D. Michael D. Coovert, Ph.D.
William P. Sacco, Ph.D.
Date of Approval: March 24, 2003
Keywords: computer-based assessment, State Trait Personality Inventory, psychological assessment, vital signs, therapy
© Copyright 2003, Ryan Russon
DEDICATION
For my parents.
ACKNOWLEDGEMENTS
It took a village. Thanks go out to all my family and friends that encouraged,
assisted, and consoled me while undertaking the biggest, ugliest research paper of my life. I
would like to especially thank a few individuals without whom this thesis certainly would
never have been completed. Deepest gratitude to Dr. Marcia Hausman for single-handedly
supplying much of my data and being an invaluable advocate in securing the participation of
other therapists. A big thanks to my advisor, Dr. Charles D. Spielberger, for his endurance
in seeing the project to the end and for always coming through when it counted most.
Thanks also to my loving wife for all her efforts in navigating the seas of bureaucracy to
submit the thesis. Lastly, heartfelt thanks to my good friend, Dr. Jordan Litman, who
helped guide me through the convoluted process and provided much needed motivation.

i
TABLE OF CONTENTS
List of Tables ....................................................................................................................................... iii
Abstract ................................................................................................................................................ vi
Introduction.......................................................................................................................................... 1
Assessment of Emotions and Personality .......................................................................... 4
Anxiety, Anger and Depression as Emotional Vital Signs .............................................. 8
The Nature and Assessment of State and Trait Anxiety, Anger, and Depression .... 11
The Assessment of State-Trait Anxiety .............................................................. 11
The Assessment of State-Trait Anger ................................................................. 15
The Assessment of State-Trait Depression........................................................ 22
Clinical Assessment of Emotional Vital Signs ................................................................. 32
Assessment, Therapy, and Accountability........................................................................ 34
Clinical Assessment and Computerized Testing of Psychological Vital Signs............ 35
Statement of the Problem ................................................................................................................ 40
Method ................................................................................................................................................ 41
Participants ............................................................................................................................ 41
Apparatus, Instruments, and Measures............................................................................. 42
Procedure............................................................................................................................... 45
Stage 1: Recruitment of Therapists and Clients................................................. 45

ii
Stage 2: Client Participation .................................................................................. 46
Stage 3: Therapists Rating of Clients ................................................................... 47
Results.................................................................................................................................................. 49
Correlations of Therapist Ratings with Client Self-Reports .......................................... 50
Therapist Ratings of The Usefulness of the Client Assessment (CA) Reports.......... 52
Client Ratings of Usability for the Paper and Computerized STPI ............................. 53
Discussion ........................................................................................................................................... 55
References ........................................................................................................................................... 61
Appendices:......................................................................................................................................... 64
Appendix A: Client Materials ............................................................................................. 74
Appendix B: Therapist Materials ....................................................................................... 78

iii
LIST OF TABLES
Table 1 Means and Standard Deviations for Clients Who Responded to Paper 49 vs. Computerized Measures Table 2 Correlations Between Therapist Ratings and Client STPI Scores for 50 the Total Sample and for the Paper vs. Computerized groups Table 3 Correlations Between Therapist Ratings and STPI scores of Client 51 States and Traits for Therapists who had and had not Conducted Previous Clinical Assessments Table 4 Means and standard deviations for Client’s Usability Ratings for the 53 Paper and Computerized (Cp) State Trait Personality Inventory (STPI)

iv
COMPUTERIZED MEASUREMENT OF PSYCHOLOGICAL VITAL SIGNS
IN A CLINICAL SETTING
Ryan Russon
ABSTRACT
Due to the increasing demands of third-party payers to show measurable results in a
decreased amount of time, mental health practitioners need new tools and techniques to
quickly and efficiently assess their client's current status and progress in treatment. The goal
of this study was to develop and validate a brief computerized measure of emotional states
and personality traits for use as an assessment tool in a clinical setting. Adapted from the
State-Trait Personality Inventory (STPI; Spielberger, 1998), the computerized instrument
measured state and trait anxiety, anger, depression, and curiosity. The computerized STPI
was examined for equivalence with the traditional STPI and compared with therapists'
ratings of their clients' emotional states and personality traits. Forty individuals (24 women,
16 men) in psychotherapy were administered either a computerized version of the STPI or
the original, paper version. Each client's therapist was asked to rate him or her on the same
4 states and 4 traits measured by the STPI. In addition, clients and therapists answered
short questionnaires regarding their reactions to the STPI and the client report generated by
the STPI, respectively.
v
A comparison of mean STPI scale scores between the computerized and paper
administration groups showed slightly higher levels of reported state emotion for the
computerized administration. There was no other evidence of differences between the two
experimental groups. Therapists who had previously conducted assessment with their client
demonstrated a significantly higher correlation of their ratings with the corresponding client
STPI self-reported scores. Feedback from the client and therapist exit questionnaires
suggested that their reactions to the procedure and the usefulness of the STPI were quite
favorable. Implications of increasing the use of computers in clinical assessment are
discussed.
1
INTRODUCTION
Since prehistoric times man has understood the importance of physical vital signs
such as pulse and temperature. Ancient Egyptian documents indicate that with the advent
of written language we had also begun to systematize the healing arts, and had begun trying
to understand physical functions such as heart rate (Guthrie, 1946). Between 1602 and 1612
Sanctorius developed an instrument to measure the relative rate of pulse and adapted
Galileo’s thermometer to the measurement of human patients (Singer & Underwood, 1962).
Innovations in the mid 18th century by Stephen Hales and Leopold Auenbrugger lead to the
measurement of blood pressure and the stethoscope, respectively. By the late 19th century
practical versions of these devices were available and began to see regular clinical use. These
inventions became the indispensable tools now routinely used by medical professionals in
the assessment of physical health.
Just as medical science had to invent and refine devices to assess the vital functions
of their patients, behavioral science must develop practical and effective instruments to
measure psychological vital signs. The routine use of such instruments will help to
systematize psychiatric science, provide a codified standard of care, and make the process of
behavioral health care more quantifiable and accountable. At present we possess a number
of instruments of varying degrees of precision to approach this problem, but most are still
too cumbersome, labor-intensive, or inaccurate to become standardized clinical tools. Most
clinical assessment today is focused on understanding long-standing personality traits and
stable psychopathology rather than indicators of the moment to moment fluctuations we all

2
experience: emotions. Much more so than long-standing personality traits, emotional states
are the psychological analog of the physician’s vital signs. If measures are developed which
can assess the important domains of an individual’s current emotional and mental states,
mental health care providers, like their medical counterparts, will be able to very quickly see
and address critical problems. There are a number of instruments in current use that have
been developed for the purpose of examining emotional states and/or traits. However,
these measures are rarely used in the course of psychiatric treatment, but often are used for
the purposes of conducting psychological research. Thus, a necessary next step in the
evolution of mental health care will be the adaptation of sound measures of emotion to a
clinical setting.
An obvious question to pose is that of exactly which emotions are most critical to
psychiatric care. Clinical assessment, as well as many theories of personality, has focused on
the assessment of individual differences in a number of traits such as anxiety (neuroticism),
anger, and depression. As will be discussed in the following sections of this prospectus,
there is strong precedent for the examination of these three emotions during the course of
psychotherapy. Also examined is an historical assessment of anxiety, anger, and depression
and the role of these emotions as vital signs of psychological well-being that should be
carefully monitored in counseling, psychotherapy, and behavioral interventions, diagnostic
evaluations, and studies of treatment outcome.
Given the ever increasing limitation of services that third party payers are willing to
reimburse, it is important to provide effective treatments much more rapidly than in the
past (Acklin, 1995). Health Maintenance Organizations and other third party payers are also
coming to expect greater and greater accountability (even “proof” of effectiveness!) for the

3
services of mental health professionals. This is yet another compelling reason to develop an
inventory of psychological vital signs, useful in the delivery and charting of psychiatric
treatment.
During a physical examination, an individual’s blood pressure is measured, pulse is
taken, and fever is assessed quickly with the help of various simple scientific instruments.
Psychological measurement now needs to move in a similar direction, making use of the
latest technology in the assessment of individuals, such that therapists can rapidly deliver the
services that help individuals most. Medical science has progressed thanks to various
advances in the physical sciences which allowed clever physicians to create instruments
useful and practical in the measurement of bodily variation. As technology has moved
forward medicine has kept pace. Sophisticated new methods and devices such as the MRI,
laser surgery, ultrasound, and DNA testing are providing an increasingly clear understanding
of each individual patient.
Psychology also has access to technologies that will allow us to accomplish
heretofore undreamed of diagnostics. Foremost in importance is the personal computer, a
device that has become so ubiquitous and affordable that few sizable mental health care
providers in the 21st century will be without this valuable tool. The modern computer has
the ability to deliver, score, and assist in the interpretation of most psychological
instruments. In many cases computers permit these common clinical tasks to be completed
much more rapidly, accurately, and with a minimum of clinician time commitment. Using
one of these “electronic helpers” will allow professionals, with minimal effort, to make
continuing assessment a part of each therapy session.

4
Assessment of Emotions and Personality
Early theorists struggled with understanding the nature of emotions and the
profound role they play in everyday experiences. According to Darwin (1872/1965),
animals and man had developed emotions in order to facilitate survival. He identified two
emotions that he believed were innate to both humans and animals: rage (anger) and fear
(anxiety). Freud (1936) theorized that the perception of danger, either from external
sources, or from one’s own repressed thoughts and feelings, produced feelings of anxiety.
According to Freud, the unpleasant state of anxiety motivated an individual to engage in
some sort of adjustment behavior to avoid or cope with the perceived danger. Thus,
consistent with Darwin, Freud interpreted anxiety as an innate and adaptive response.
As behaviorism came to dominate the field of psychology over the next 40 years,
the study of emotions waned for the reason that mental and emotional processes were
unobservable, could not be objectively measured, and thus were considered improper topics
of scientific inquiry. The strong bias against measuring experiences that were not directly
observable mandated investigators to evaluate the impact of carefully defined stimulus
conditions on precisely measured behavioral responses. In a sense, personality, thoughts,
and emotions did not exist for the behaviorists.
As a result of the cognitive revolution of the 1960's, a renewed interest in the
importance of emotions and internal experiences emerged. In current research emotions
are regarded as complex biopsychological states, which are comprised of specific feelings
and physiological reactions (Spielberger, 1966). However, because a great deal of variation
in behavior may be accounted for by an individual’s current emotional state, assessment of
both emotional traits and states is essential to developing a comprehensive theory of

5
emotion and personality. The work of pioneers such as Murray (1938) and Cattell (1966)
increased our understanding of emotions by demonstrating the importance of the states and
traits in understanding the complexities of human emotion. For example, an individual's
appraisal of a particular event or situation as stressful will greatly influence her/his
emotional reactions to that circumstance (Lazarus & Opton, 1966; Lazarus & Folkman,
1984). According to Lazarus, Deese, and Osler (1952), differences in personality traits may
also influence emotional states by predisposing individuals to respond to similar situations
(stimuli) in unique ways. According to Spielberger (1995), the quality and intensity of
feelings experienced during emotional arousal are the most distinctive features of a
particular emotion. Therefore, in order to accurately assess emotional phenomena,
measurement tools must distinguish between qualitatively different emotional states, and
also the intensity of these states as they vary over time.
Theories of emotion and personality have typically focused on the assessment of
individual differences in a number of traits such as anxiety, anger, and depression. The
nature of these dispositions as emotional states and personality traits is reviewed in the first
section of this prospectus. The following sections of this prospectus discuss the assessment
of anxiety, anger, and depression as emotional vital signs of psychological well-being that
should be carefully monitored in counseling, psychotherapy, and behavioral interventions,
as well as in diagnostic evaluations and studies of treatment outcome.
Psychological interest in personality assessment has been documented at least as far
back as the late 1800’s. Wundt (1896) employed the techniques of introspection in order to
understand the emotional experiences of individuals, however, these early attempts to use
self-report as a psychological measure received serious criticism because of lack of reliability

6
(Duffy, 1941). In 1906 Heymans and Wiersma developed a list of symptoms theorized to
indicate the presence of psychopathology. Such lists were later highly influential in the
generation of self-report personality inventories (Lanyon, 1971). Other pioneers, such as
Gordon Allport (1921), championed the cause of personality assessment as a method of
understanding and treating psychological problems.
The first self-report personality inventory was developed by Robert S. Woodworth
(Lanyon, 1971), whose Personal Data Sheet was used during World War I to determine
whether inductees had the ability to withstand the stresses of military life. The Personal Data
Sheet (later known as the Woodworth Psychoneurotic Inventory) was a standardized
psychiatric interview in the form of a “yes-no” paper and pencil questionnaire. The original
form contained 200 questions based on common neurotic symptoms, behaviors and
personality traits that had been observed in men who did not adjust well to the stresses of
war. After testing this initial set of questions on college men and draftees the number of
items was reduced to 116. The Personal Data Sheet was the precursor of modern self-report
measures of personality, emotion, and psychopathology.
Despite strong forces such as radical behaviorism working to discredit and
discourage the measurement of “invisible and intangible cognitions and feelings,” the
development of self-report measures continued. In general, self-report measures have
continued to improve, showing increased attention to methodology and using increasingly
sophisticated techniques such as factor analysis to improve item content (Guilford and
Guilford, 1939). However, some problems in using proper methodology and a great deal of
theoretical debate still persist today. Many of the instruments that have come out of the
explosion of new inventories over the past half-century have poor psychometric properties,

7
are not properly validated, and have been used in research in very careless methodological
ways.
One of the first measures to gain widespread acceptance and use was the Minnesota
Multiphasic Personality Inventory (MMPI; Hathaway and McKinley, 1942). There is more
data (and for that matter more studies) available from this measure and, by extension, its
recent revision the MMPI-2 (1989) than any other personality inventory (Butcher & Rouse,
1996). This widely used and well-documented measure was empirically generated by
examining the true-false items that best discriminated “normals” from patients having
various diagnoses. Using this method, various subscales were constructed of items that
differentiated DSM diagnosed categories from other categories and non-clinical populations.
The MMPI is scored by summing the “yes” responses for each subscale (“no” for reverse
scored items), and converting the raw scores to T-scores. Surprisingly, this instrument,
once used more widely in research than any other, is not theoretically based, uses many
“non-face valid” items, displays mediocre psychometric properties, and is excessively time
consuming for both client and clinician. Using these same empirical development methods
and more theoretically based methods, many other inventories have since been developed
for the purposes of research and clinical use.
Today, clinical assessment most commonly consists of a narrow focus on
personality traits and psychopathology as a means of orienting the clinician to a new client.
Nonetheless, there are many of instruments that have been developed for the purpose of
examining emotional states and traits. A number of these emotional assessment
instruments are also in limited use in clinical and research settings. But, with the notable
8
exception of the Beck Depression Inventory (Beck, et al., 1961), measures of emotion are
rarely used in session-to-session clinical assessment.
Anxiety, Anger and Depression as Emotional Vital Signs
The emotional vital signs that are most critical to an individual's well-being are
anxiety, anger, and depression. Variations in the intensity and duration of these
psychological states provide essential information about a person's mental health and can
point to recent events as well as long-standing conflicts that have particular meaning and
impact on an individual's life. Since more than 50% of the dropouts in therapy occur
between the first and fifth interviews (Garfield & Bergen, 1986), assessing and providing
meaningful feedback on readings of emotional vital signs during treatment will enhance
patients' awareness and understanding of their feelings. Helping them to cope more
effectively with these feelings early in treatment will also minimize dropouts.
According to de la Torre (1979), dealing with transitory feelings of anxiety (S-
Anxiety) should be a major priority in all forms of short-term psychotherapy, including
crisis intervention and dynamic treatments that focus on specific problems of the patient or
client. Moreover, diverse manifestations of anxiety in various physical and psychological
disorders generally require different forms of treatment (Suinn & Deffenbacher, 1988). As
de la Torre (1979) has noted:
The ubiquitousness of anxiety among psychiatric patients demands a
careful assessment and diagnosis. The transitory anxiety in a well-
compensated individual differs considerably from the intense anxiety
that heralds psychotic decompensation. Both situations require

9
different kinds of interventions and will have different prognostic
outcomes (p. 379).
Recent research findings suggest that problems with anger are equally ubiquitous. In a
series of studies, Deffenbacher (1992) and his associates (Deffenbacher, Demm, &
Brandon, 1986; Deffenbacher & Stark, 1990; Hazaleus & Deffenbacher, 1986; Hogg &
Deffenbacher, 1986) found that persons high in trait anger experienced heightened S-Anger
and physiological arousal on a daily basis across a wide range of situations. Treatments
designed to assist clients to learn how to reduce their anger by engaging in self-initiated
relaxation exercises helped them to function more effectively, and to use problem-solving
techniques and social skills that were previously disrupted by their angry feelings.
The assessment and control of anger has also been shown to be a critical factor in the
development of serious physical problems such as hypertension (Harburg, et al., 1973, 1979;
Gentry, et al., 1981, 1982; Johnson, 1984) and coronary heart disease (Kong, Blumenthal, &
Whalen, 1980; Julkunen, et al., 1992). Although less attention has been given to the
assessment of anger, the research of Deffenbacher (1992) and others clearly demonstrates
that anger can be readily measured and that it is important to do so.
Depression is the most common mental disorder diagnosed (Wolman, 1990) with over
100 million people worldwide currently suffering from some depressive disorder.
According to the DSM-IV (1994), lifetime prevalence for Major Depressive Episodes is
10% - 25% for women and 5% - 12% for men. The Epidemiological Catchment Area
Survey (1991) calculated the annual prevalence of depressive episodes to be about 6% of the
adult population in the U.S. Similar figures are cited for other industrial nations. According
10
to the World Health Organization (WHO), Depression is estimated to be present in over
10% of all those seeking care at primary health care facilities worldwide. In the United
States alone, depression costs some $44 billion annually based on 1990 statistics, which is
about the same as the costs resulting from heart disease (NIMH, 1997). This represents
some 30% of the total estimated annual cost of $148 billion spent on all mental illness. It
should be pointed out that this estimate excludes many hidden, indirect costs such as lost
work time spent by family members of depressed individuals. And internationally the
situation is of even graver importance. In 1990, unipolar depression was the leading global
cause of years lived with a disability (WHO). By the year 2020, WHO estimates predict
Unipolar Major Depression to climb to the number two position of global disease burden
(and number one for women and persons in developing countries).
The worst consequence of depression is suicide. Together with alcohol and drug abuse
and psychosis, depression is implicated in at least 60% of suicides, which in 1990 accounted
for 1.6% of the world’s deaths. An estimated 15 percent of people hospitalized for
depression eventually take their own lives (NIMH, 1997). Major depressive disorder and
associated suicides seem to be steadily increasing and there appears to be a worldwide trend
towards a decreasing age of onset for Major Depressive Disorder (Cross-National
Collaborative Group, 1992; DSM-IV, 1994). In sum, depression is an understated world
problem of critical importance and of paramount importance in session-to-session
assessment. Considering the financial and emotional strain of depression (both clinical and
sub-clinical) and its increasing prevalence, it’s not at all surprising that more and more
attention is being paid to its careful measurement.
11
The clinical assessment of emotional vital signs can provide essential information for
diagnosis, treatment planning, and monitoring the treatment process. Since management of
anxiety, anger, and depression during treatment is a major concern of most mental health
care professionals, the continuous assessment of these emotions can facilitate the treatment
process (Deffenbacher, et al., 1986; Novaco, 1979). Barlow (1988) emphasizes the
importance of utilizing measures that differentiate between depression and anxiety during
the course of treatment.
The Nature and Assessment of State and Trait Anxiety, Anger, and Depression
The Assessment of State-Trait Anxiety
In The Problem of Anxiety, Freud (1936) conceptualized two types of anxiety, objective
and neurotic. Objective anxiety, which Freud equated with fear, was elicited by real dangers
in the external world. Neurotic anxiety was an emotional reaction to the individual's own
repressed sexual or aggressive impulses, and was regarded as the "fundamental phenomenon
and the central problem of neurosis" (Freud, 1936, p. 85).
Cattell and Scheier (1963) included a number of self-report and physiological measures
in their multivariate assessment of anxiety. Through factor analysis, relatively independent
"state" and "trait" anxiety factors have been found to consistently emerge (Cattell, 1966).
Physiological responses (i.e. pulse rate and blood pressure) that fluctuate over time had high
loadings on the state-anxiety factor, but only slight loadings on trait-anxiety. In contrast,
the scales for which scores were relatively stable when measured under different conditions
had strong loadings on the trait anxiety factor.
In early studies of the effects of experimentally induced stress, state anxiety was
measured by assessing physiological changes associated with arousal of the autonomic

12
nervous system. Although a number of different physiological measures have been used in
research on S-Anxiety (Lader, 1975; Levitt, 1980; Martin, 1973; McReynolds, 1968;
Borkovec, Weerts, & Bernstein, 1977), galvanic skin response and changes in heart rate
appear to be the most popular. For example, college students who were told they would be
receiving strong electric shocks were found to have a marked increase in heart rate (Hodges
& Spielberger, 1966). However, the validity of physiological measures in assessing state
anxiety has been critically questioned (Hodges, 1976).
Although state and trait anxiety are usually positively correlated, they are logically quite
different constructs. State anxiety (S-Anxiety) refers to the intensity of an unpleasant
emotional experience, comparable to the fear and objective anxiety originally conceptualized
of by Darwin (1872/1965) and Freud (1936). Anxiety states are comprised of feelings of
tension, apprehension, nervousness, and associated activation of the autonomic nervous
system (Spielberger, 1972). Emotional states vary in intensity over time in response to
perceptions of physical or psychological danger. Trait anxiety (T-Anxiety) relates to the
frequency with which anxiety feelings are experienced. Persons high in T-Anxiety tend to
perceive a wider range of situations as dangerous or threatening and respond to perceived
threats with more frequent and intense feelings of S-Anxiety (Reheiser, 1991).
Self-report questionnaires are by far the most popular procedures for assessing T-
Anxiety, and include the Taylor (1953) Manifest Anxiety Scale (MAS) and the Anxiety Scale
Questionnaire (ASQ), which Cattell and Scheier (1963) developed to assess anxiety in
clinical situations. More labor-intensive clinician rating scales are also typically used in the
assessment of pathological anxiety. One such instrument, the Hamilton (1959) Rating Scale,
is widely used for evaluating symptoms of anxiety observed in clinical interviews or
13
psychotherapy sessions, and has been used to assess both S-Anxiety and T-Anxiety.
Projective techniques such as the Rorschach Inkblots and the Thematic Apperception Test
have also been used extensively in the clinical evaluation of anxiety, but fail to distinguish
between S-Anxiety and T-Anxiety. Auerbach and Spielberger (1972) have found that
Rorschach indicators of anxiety appear to be confounded with psychological defenses.
Zuckerman’s (1960; Zuckerman & Lubin, 1965) Affect Adjective Check List (AACL)
was the first instrument designed to assess both state and trait Anxiety. In assessing S-
Anxiety, subjects are instructed to check those adjectives that describe how they feel
"today"; in measuring T-Anxiety they are asked to report how they "generally" feel.
Evidence of the validity of the AACL-Today Form as a measure of S-Anxiety is impressive,
but the instructions and format for this scale make it relatively insensitive for assessing
momentary changes in the intensity of anxiety as an emotional state. For example, checking
or not checking a particular adjective, e.g., "tense," does not accurately distinguish between
feeling "somewhat" and "very" tense. The concurrent validity of the AACL General Form
as a sensitive measure of T-Anxiety is also questionable, as reflected in relatively small
correlations with other trait anxiety measures.
The State-Trait Anxiety Inventory (STAI) was developed by Spielberger, Gorsuch,
and Lushene (1970) to provide reliable, relatively brief, self-report scales for assessing both
state and trait anxiety. Freud's (1936) Danger Signal Theory and Cattell's concepts of state
and trait anxiety (Cattell, 1966; Cattell & Scheier, 1958, 1961, 1963), as refined and
elaborated by Spielberger (1966, 1972, 1976, 1977, 1979, 1983), provided the conceptual
framework that guided construction of the STAI. The state-trait distinction in anxiety

14
research has been subsequently validated in numerous studies (e.g., Gaudry, Spielberger, &
Vagg, 1975).
In responding to the S-Anxiety items, subjects report how they feel "right now, at
this moment" by rating the intensity of their anxiety feelings on the following 4-point scale:
(1) Not at all; (2) Somewhat; (3) Moderately so; (4) Very much so. The STAI T-Anxiety
Scale instructs subjects to report how they "generally" feel by rating themselves on the
following 4-point frequency scale: (1) Almost never; (2) Sometimes; (3) Often; (4) Almost
always.
Evidence of construct validity of the STAI S-Anxiety Scale is reflected in findings
for patients undergoing surgery whose S-Anxiety scores are substantially higher the day
before surgery than five to seven days following successful surgery (Auerbach, Wadsworth,
Dunn, Taulbee, & Spielberger, 1973). Similarly, the S-Anxiety scores of college students are
significantly higher when they are tested during an examination, and significantly lower after
relaxation training, than when they are tested in a regular class period (Spielberger, 1983).
Correlations of scores on the STAI T-Anxiety scale with the ASQ and the MAS
range from .73 to .85, indicating a high degree of concurrent validity. Since correlations
among these scales approach the scale reliabilities, the three inventories can be considered
as more or less equivalent T-Anxiety measures, however, the STAI T-Anxiety scale is
comprised of only 20 items as compared with the 43-item ASQ and the 50-item MAS, and
thus requires only about half as much time to administer. Moreover, the STAI-Y is less
contaminated with feelings of depression and anger than are the MAS and the ASQ.
Evidence of the construct validity of the T-Anxiety scale is reflected in findings that
various neuropsychiatric patient (NP) groups have substantially higher mean scores as

15
compared with normal subjects (Spielberger, 1983). General medical and surgical (GMS)
patients with psychiatric complications also have higher T-Anxiety scores than GMS
patients without such complications, indicating that the T-Anxiety scale can help to identify
non-psychiatric patients with emotional problems. Lower T-Anxiety scores of patients with
character disorders, for whom the absence of anxiety is an important defining condition,
provide further evidence of the discriminant validity of the STAI.
Test-retest stability coefficients for the STAI-Y S-Anxiety scale are relatively low,
with a median of only .33, as would be expected since anxiety states vary in intensity as a
function of perceived stress. Alpha coefficients for the STAI-Y S-Anxiety Scale are .90 or
higher for large, independent samples of high school and college students, working adults,
and military recruits, with a median alpha of .93.
Since its introduction more than a quarter century ago (Spielberger & Gorsuch,
1966), the STAI has become an international standard, translated and adapted in 48
different languages and dialects (Spielberger, 1989). Norms for high school and college
students; working adults; military personnel; prison inmates; and psychiatric, medical, and
surgical patients are reported in the revised STAI-Y Test Manual (Spielberger, 1983).
The Assessment of State-Trait Anger
While much has been written about the negative impact of anger and hostility on
physical health (Deffenbacher, 1994; Friedman, Tucker, & Reise, 1995) and psychological
well-being, definitions of these constructs are often ambiguous and contradictory (Biaggio,
Supplee, & Curtis, 1981). Spielberger, Johnson, Russell, Crane, Jacobs, and Worden (1985)
refer collectively to anger, hostility, and aggression as the AHA! Syndrome. According to
Spielberger, Jacobs, Russell, and Crane (1983),

16
“Anger usually refers to an emotional state that consists of feelings that
vary in intensity, from mild irritation or annoyance to intense fury and
rage. Although hostility usually involves angry feelings, this concept has
the connotation of a complex set of attitudes that motivate aggressive
behaviors directed toward destroying objects or injuring other
people...the concept of aggression generally implies destructive or
punitive behavior directed towards other persons or objects.” (p. 16)
A number of self-report psychometric scales were developed in the 1950s to
measure hostility (e.g., Buss, 1957; Buss & Durkee, 1957; Cook & Medley, 1954; Schultz,
1954; Siegel, 1956). Of these measures, the Buss-Durkee Hostility Inventory (BDHI) is
generally considered the most carefully constructed measure of hostility.
During the 1970s, three scales were developed which attempted to distinguish
between anger and hostility: The Reaction Inventory (RI), the Anger Inventory (AI), and
the Anger Self-Report (ASR). The RI was developed by Evans and Stangeland (1971) to
assess the degree to which anger was evoked in a number of specific situations. Similar in
conception and format to the RI, Novaco's (1975) AI consists of statements that describe
anger-provoking incidents. The ASR was designed by Zelin, Adler, and Myerson (1972) to
assess both "awareness of anger" and different modes of anger expression.
Two common problems with these measures of anger and hostility are that, in
varying degrees, these measures fail to take the state-trait distinction into account and they
tend to confound the experience and expression of anger with situational determinants of
angry reactions. In a series of studies, Biaggio (1980) and her colleagues (Biaggio & Maiuro,
17
1985; Biaggio et al., 1981) examined and compared the reliability, concurrent and predictive
validity, and the correlates of the BDHI and the RI, ASR, and AI anger scales. On the basis
of their research findings, these investigators concluded that the empirical evidence for the
validity of the four anger and hostility measures was both fragmentary and limited.
The State-Trait Anger Scale (STAS), which is analogous in conception and similar in
format to the STAI (Spielberger, 1983; Spielberger et al., 1970), was developed to assess the
intensity of anger as an emotional state, and individual differences in anger proneness as a
personality trait (Spielberger et al., 1983). It was assumed that S-Anger fluctuates over time
as a function of perceived frustration, whereas Trait anger (T-Anger) was defined in terms
of individual differences in the frequency with which anger was experienced. Persons high
in T-Anger, as compared to those low in this trait are likely to experience both more
frequent and more intense elevations in S-Anger whenever annoying or frustrating
conditions are encountered.
Crane (1981) found the T-Anger scores of hypertensive patients were significantly
higher than those of medical and surgical patients with normal blood pressure, and that this
difference was due entirely to the substantially higher T-Anger/Angry Reaction scores of
the hypertensives. No difference was found in the T-Anger scores of the hypertensives and
controls.
Deffenbacher (1992) and his colleagues used the STAS T-Anger Scale in a series of
studies to assess the correlates and consequences of trait anger. Individuals with high T-
Anger scores reported experiencing more intense and more frequent day-to-day anger
across a wide range of provocative situations. They also experienced anger-related
physiological symptoms two to four times more often than low T-Anger subjects. When

18
provoked, the high T-Anger individuals manifested stronger general tendencies to both
express and suppress anger, and more dysfunctional physical and verbal antagonism.
Negative events such as failure appeared to have a more devastating (catastrophizing)
impact on the high T-Anger individuals (Story & Deffenbacher, 1985), who also reported
experiencing higher levels of anxiety than persons low in T-Anger.
The importance of distinguishing between the experience and expression of anger
has also long been recognized in psychophysiological investigations of the effects of anger
on the cardiovascular system. In the classic studies of anger expression, Funkenstein and
his co-workers (Funkenstein, King, & Drolette, 1954), exposed healthy college students to
anger-inducing laboratory conditions. Those who became angry and directed their anger
toward the investigator or the laboratory situation were subsequently classified as anger-out;
those who suppressed their anger and/or directed it at themselves were classified as anger-
in. The increase in pulse rate was three times greater for students classified as anger-in than
for the anger-out group.
Anger directed outward involves both the experience of S-Anger and its
manifestation in some form of aggressive behavior. Anger-out can be expressed in physical
acts such as slamming doors, destroying objects, and assaulting or injuring other persons, or
in verbal behavior such as criticism, threats, insults, or the extreme use of profanity. These
physical and verbal manifestations of anger may be directed toward the source of
provocation or expressed indirectly toward persons or objects associated with, or symbolic
of, the provoking agent.
Harburg and his associates have reported impressive evidence demonstrating that
anger-in and anger-out have different effects on the cardiovascular system (Harburg, Erfurt,
19
Hauenstein, Chape, Schull, & Schork, 1973; Harburg, Blakelock & Roeper, 1979; Harburg &
Hauenstein, 1980; Harburg, Schull, Erfurt & Schork, 1970). Gentry (1972) and his
colleagues (Gentry, Chesney, Hall, & Harburg, 1981; Gentry, Chesney, Gary, Hall &
Harburg, 1982) subsequently corroborated and extended Harburg's findings. It should be
noted, however, that Harburg and Gentry classified individuals as anger-in who did not
report feeling angry, along with those who indicated that they experienced and suppressed
their angry feelings. Very different personality dynamics have been attributed to
"impunitive" persons, who do not experience anger in anger-provoking situations, and
"intrapunitive" persons, who turn anger in and often blame themselves for the anger that is
directed toward them by others (Rosenzweig, 1976, 1978).
From the foregoing review, it may be noted that anger expression has been
implicitly defined as comprising a single dimension (e.g., Funkenstein et al., 1954; Harburg et
al., 1973; Gentry et al., 1982), varying from extreme suppression or inhibition of anger
(anger-in) to the expression of anger in destructive behavior (anger-out). The first step in
constructing a scale to assess anger expression, Spielberger et al. (1985) was the formulation
of working definitions of anger-in and anger-out. Anger-in was defined in terms of how
often an individual experiences but holds in (suppresses) angry feelings. Anger-out was
defined on the basis of the frequency that an individual expresses angry feelings in verbally
or physically aggressive behavior. Consistent with these working definitions, the content of
the items for the Anger Expression (AX) Scale ranged from strong inhibition or
suppression of angry feelings (AX/In) to extreme expression of anger toward other persons
or objects in the environment (AX/Out).
20
The rating scale format for the AX Scale was the same as that used with the STAS
T-Anger scale, but the instructions differed markedly from those used in assessing T-Anger.
Rather than asking subjects to indicate how they generally feel, they are instructed to report
"...how often you generally react or behave in the manner described when you feel angry or
furious" by rating themselves on the following standard four-point frequency scale: (1)
Almost never; (2) Sometimes; (3) Often; (4) Almost always.
Factor analyses of the AX items identified two independent factors that were labeled
Anger/In and Anger/Out. The selection of the items for the AX Anger-In (AX/In) and
Anger-Out (AX/Out) subscales was based on the results of further factor analyses and
subscale item-remainder correlations (Spielberger et al., 1985). The AX/In subscale items
had uniformly high loadings for both sexes on the Anger/In factor and negligible loadings
on Anger/Out; median loadings of the 8 Anger-In items on the Anger/In and Anger/Out
factors were .665 and -.045, respectively. Similarly, the median loadings for the 8 Anger-Out
items were .59 on the Anger/Out factor and -.01 on the Anger/In factor. Alpha
coefficients for these brief 8-item measures varied from .73 to .84, indicating good internal
consistency. Jacobs et al. (1988) have reported test-retest stability coefficients for the AX
subscales, ranging from .64 to .86. Essentially zero correlations between the AX/In and
AX/Out subscales have been reported for large samples of high school and college students
(Johnson, 1984; Knight, Chisholm, Paulin, & Waal-Manning, 1988; Pollans, 1983;
Spielberger, 1988). Thus, the anger-in and anger-out factors are factorially and empirically
independent, suggesting that these scales assess two different dimensions of anger-
expression.

21
A study by Johnson (1984) investigated the relationship between anger expression
and blood pressure (BP). The AX Scale was administered to a large sample of high school
students, and measures of systolic (SBP) and diastolic (DBP) blood pressure were obtained
during the same class period. The correlations of AX/In scores with SBP and DBP were
positive, curvilinear, and highly significant for both sexes. Inverse correlations of AX/Out
scores with BP were significant but quite small. Height, weight, dietary factors (e.g., salt
intake), racial differences, and family history of hypertension and cardiovascular disorders
also correlated significantly with BP. However, after partialling out the influence of these
variables, AX/In scores were still positively and significantly associated with elevated SBP
and DBP. Moreover, multiple regression analyses indicated that AX/In scores were better
predictors of blood pressure than any other measure.
Three items included in the AX Scale to measure the middle range of the anger-
in/anger-out dimension ("I control my temper," "I keep my cool;" "I calm down faster")
had substantial loadings in early studies on both the Anger/In and Anger/Out factors
(Spielberger et al., 1985). In subsequent research, these items coalesced to form the nucleus
of an anger control factor (Spielberger, 1988), stimulating further work to construct
additional anger-control items. This resulted in the development of an 8-item Anger
Control (AX/Con) subscale, which correlated negatively with AX/Out (r = -.59 for males; -
.58 for females) in a large sample of university students (Spielberger, Krasner, & Solomon,
1988). The correlations of the AX/In and AX/Out subscales were essentially zero for both
sexes.
The STAS and the AX Scale were recently combined to form the State-Trait Anger
Expression Inventory (STAXI), which measures the experience, expression, and control of

22
anger (Spielberger, 1988). Fuqua, Leonard, Masters, Smith, Campbell, and Fischer (1991)
administered the 44-item STAXI to a large sample of college students and factored their
responses to the individual items. The first six factors identified by Fuqua et al. (1991), in
the order that they emerged, were: S-Anger, Anger/Con, Anger/In, Anger/Out, T-
Anger/Temperament and T-Anger/Reaction. The STAXI has proven useful for assessing
anger in both normal and abnormal individuals (Deffenbacher, 1992; Moses, 1992), and in
evaluating the components of anger in a variety of disorders, including alcoholism,
hypertension, coronary heart disease, and cancer (Spielberger, 1988).
Although the impact of anger and hostility on the etiology of hypertension have
been recognized for more than a half-century (Alexander, 1948), empirical verification of
this relationship was difficult to obtain because valid measures of anger and hostility were
lacking. With the development of better measures of the experience, expression and
control of anger, the critical role of anger in hypertension and cardiovascular disorders has
now been clearly demonstrated (Booth-Kewley & Friedman, 1987; Hartfield, 1985; Janisse,
Edguer, & Dyck, 1986; Williams, Haney, Lee, Kong, Blumenthal, & Whalen, 1980).
Consistent with these findings, high scores on the STAXI AX/In subscale are associated
with elevated blood pressure in high school students (Johnson, 1984). Very high scores on
both the AX/In and AX/Out scales (above the 90th percentile) may place an individual at
risk for coronary artery disease and heart attacks.
The Assessment of State-Trait Depression
According to man’s oldest records, depression has been a part of the human
experience from our earliest history. The Iliad, which dates back to 800 BC, describes
depressive symptoms in the Greek warrior Achilles such as insomnia, depressed mood, loss
23
of appetite, loss of pleasure or interest, and fatigue. It also contains reference to using drug-
laced wine as a possible treatment for such conditions (perhaps the earliest recorded use of
pharmacotherapy). For many cultures depressed mood was long considered a curse from
god or gods. In fact psychopathology in general was thought to be indicative of possession
by demons the work of evil spirits or a form of divine punishment. Throughout the Bible
there are a number of instances of God punishing his followers with an enduring sorrow.
For example, in the first book of the Old Testament, Genesis, God tells Adam “cursed is
the ground for thy sake; in sorrow shalt thou eat of it all the days of thy life.” And the
prophet Jerimiah in the book of Lamentations (1:12) says “Behold, and see if there be any
sorrow like unto my sorrow, which is done unto me, wherewith the Lord hath afflicted me in the
day of his fierce anger” (italics added).
Hippocrates in the 4th century BC espoused a theory that chronic depressed affect—
known for centuries as melancholia—was due to an excess of black bile in the body. This
point of view was largely unchallenged by competing theories until the middle ages, when
the theological explanation regained popularity (Wetzel, 1984). Witch-hunts, severe
punishment, and other untoward deeds were prescribed as treatment for the afflicted.
In 1621 Robert Burton published his immensely popular Anatomy of Melancholy, a
work considered by many scholars to be a critically important monograph on the subject.
Although his Anatomy is steeped in superstition and religion, Burton and some of his
contemporaries did much to promote the humane treatment of the mentally ill.
Further progress towards rational understanding and treatment of depression
occurred in the late 1800’s when Emil Kraepelin classified mental disorders under a disease
model. This implied that all mental disorders had physical causes, which while not

24
completely true, was a step in the right direction. This was truly a milestone for the
understanding of psychopathology and psychometric theory—after all, you can’t measure
demonic possession or black bile.
Moving into the 20th century, Freud developed his psychoanalysis and a theory of
depression including etiology and treatment. Once this gateway had been opened, theories
of psychopathology, depression, and treatment proliferated, each with its own preferred
modality of measurement (dream analysis, interview, neurochemical analysis, self-report,
projective test, etc.). And somewhere in this process of exploration and variegation the
concept of depression became so much more complex and difficult to agree upon.
Although many of us know what it is to feel “depressed,” this is only one aspect of
the word. According to the American Psychiatric Glossary (1994), depression can be used
to describe a normal mood state of sadness and despair, a symptom (seen in another
disorder), a syndrome (associated symptoms seen in another disorder), or a mental disorder
such as Major Depressive Disorder. The semantic difficulties this can create are confusing
enough that some researchers tend to circularly define depression in terms of symptoms of
the syndrome and the symptoms as signs of depression.
One set of generally accepted standards for identifying the clinical syndrome of
depression that has been refined over the years is the Diagnostic and Statistical Manual of
Mental Disorders (DSM) criteria for Mood Disorders. The current edition (IV) includes the
following criteria for a Major Depressive Episode: (1) Depressed mood or (2) loss of
interest or pleasure, and (3) weight loss (without dieting), (4) insomnia or hypersomnia, (5)
psychomotor agitation or retardation, (6) fatigue or loss of energy, (7) feelings of
worthlessness or excessive guilt, (8) difficulties in thinking or concentrating, or (9) recurring
25
thoughts of death. Self-report instruments such as the Beck Depression Inventory propose
to measure depression based on this definition. Unfortunately, even using the best
instruments to poll a construct so carefully defined by the DSM, there are still large
problems to solve in measurement such as the high correlation between depression and
anxiety.
A fairly recent conceptualization of depression considers depression to be one of
three parts of a depression/anxiety syndrome. Since instruments measuring these two
emotional states are often highly correlated (sometimes more so than with other measures
of the same construct!) Clark and Watson (1991) have tried to extricate the experience of
depression from the experience of anxiety as expressed on self-report inventories. Clark
and Watson’s tripartite model breaks down symptoms of the depression/anxiety syndrome
into general nonspecific distress, anhedonia/low positive affect (specific to depression), and
Physiological hyperarousal (specific to anxiety). Clark and Watson’s Positive
Affectivity/Negative Affectivity Scale (PANAS) and the depression subscales in the State-
Trait Personality Inventory (STPI; Spielberger, 1998) both measure the lack of positive
affect that is specific to depression.
Depression is the most common mental disorder diagnosed (Wolman, 1990) with
over 100 million people worldwide currently suffering from some depressive disorder.
According to the DSM-IV (1994), lifetime prevalence for Major Depressive Episodes is
10% - 25% for women and 5% - 12% for men. The Epidemiological Catchment Area
Survey (1991) calculated the annual prevalence of depressive episodes to be about 6% of the
adult population in the U.S. Similar figures are cited for other industrial nations. According
to the World Health Organization (WHO), Depression is estimated to be present in over

26
10% of all those seeking care at primary health care facilities worldwide. In the United
States alone, depression costs some $44 billion annually based on 1990 statistics, which is
about the same as the costs resulting from heart disease (NIMH, 1997). This represents
some 30% of the total estimated annual cost of $148 billion spent on all mental illness. It
should be pointed out that this estimate excludes many hidden, indirect costs such as lost
work time spent by family members of depressed individuals. And internationally the
situation is of even graver importance. In 1990, unipolar depression was the leading global
cause of years lived with a disability (WHO). By the year 2020, WHO estimates predict
Unipolar Major Depression to climb to the number two position of global disease burden
(and number one for women and persons in developing countries).
The worst consequence of depression is suicide. Together with alcohol and drug
abuse and psychosis, depression is implicated in at least 60% of suicides, which in 1990
accounted for 1.6% of the world’s deaths. An estimated 15 percent of people hospitalized
for depression eventually take their own lives (NIMH, 1997). Major depressive disorder and
associated suicides seem to be steadily increasing and there appears to be a worldwide trend
towards a decreasing age of onset for Major Depressive Disorder (Cross-National
Collaborative Group, 1992; DSM-IV, 1994). In sum, depression is an understated world
problem of critical importance. Considering the financial and emotional strain of
depression (both clinical and sub-clinical) and its increasing prevalence, it’s not at all
surprising that more and more attention is being paid to its careful measurement.
In 1930, Jasper developed the first self-report measure of depression, which is a 40-
item questionnaire that he claimed measures the trait of “depression-elation.” Jasper
developed the questionnaire specifically to assess the relationship between “depression-

27
elation” and the trait dimension of “extraversion-introversion”. From his first study with
this measure Jasper concluded that, “the individual whose behavior is characteristically
introverted has a higher probability of being depressed in affective quality than elated.”
Chant and Myers (1936) conceptualized depression as an aspect of a dimensional rather
than categorical personality trait, with elation/optimism on one side and depression on the
other. Their contribution was the construction of a more refined 22-item measure of
depression, scored by taking an average of all endorsed items.
In general, self-report depression measures have continued to improve, showing
increased attention to methodology and using increasingly sophisticated techniques such as
factor analysis to improve item content (e.g. Guilford and Guilford, 1939). However, some
problems in using proper methodology and a great deal of theoretical debate still persist
today. Many of the instruments that have come out of the explosion of new inventories
over the past half-century have poor psychometric properties, are not properly validated, or
have been used in very careless methodological ways. There are many critical examples of
such research problems. There are also modern day foibles in the study of depression that
hamper progress and understanding of this ailment. Consider, for instance, that before
1970 most research on depression used psychiatric patients as subjects and that since then
studies have come to rely on dysphoric “normal” university students (Gotlib, 1984). The
general belief that various studies of depression across time are comparable is based upon
an assumption that subsyndromal depressive affect is not qualitatively different from a
major depressive episode. And yet some researchers are actually still treating data from
these two groups as equivalent.
28
One of the first personality measures to gain widespread acceptance and use was the
Minnesota Multiphasic Personality Inventory (MMPI; Hathaway and McKinley, 1942).
There is more data (and for that matter more studies) available from this measure and, by
extension, its recent revision the MMPI-2 (1989) than any other personality inventory
(Butcher & Rouse, 1996). The depression scale of the MMPI, one of 10 clinical subscales,
has 60 true-false items (57 in the MMPI2) that inquire about depressive symptoms,
cognitions, behaviors, and affect. It can be administered in less than 15 minutes when given
separately from the entire battery. Usually the entire test (571 items) is administered (which
can take from 1 ½ to 2 hours), making the MMPI less attractive for research and rather
cumbersome in the monitoring of mood states. The depression subscale does appear to
measure depressive state, but it has been criticized for lack of a specific time reference
period (McNair, 1974). Although the MMPI-D appears to have acceptable reliability (split-
half correlation > .70), various other criticisms have been made regarding its unreliable
factor structure and its sensitivity to the effects of drugs (since many items tap somatic
functioning). Another criticism is that factor analytic studies have revealed various unrelated
factors such as cynicism, apathy, and hostility in the MMPI-D scale. Fortunately, at least
one area of concern in the original MMPI was corrected in the validation of the MMPI2; in
the development of the first measure, relatives of patients in the various test groups served
as the “norm” group. Although a great deal of informative data exists on this measure,
considering its shortcomings, it doesn’t appear to be the best measure for the examining
various aspects of depression.
The next major self-report of depression to be developed was the Beck Depression
Inventory (BDI; Beck, et al., 1961). Beck intended to develop an instrument that would

29
measure depression as a construct that cuts across a variety of diagnostic categories. The
general critical consensus is that the BDI performs this task adequately. The BDI is
considered the standard in the clinical assessment of depression; it is usually used to
establish the validity of new measures related to depression. The BDI is currently the most
popular instrument for assessment of depression in general, with annual estimated use in
clinical and research settings at least twice as great as any other measure (Ritterband, 1997).
It has been used in outcome studies, private practice, hospital settings, and a multitude of
other purposes. The BDI has been translated into Arabic, Bulgarian, Chinese, Danish,
Dutch, Finnish, French, German, Hmong, Indian, Iranian, Japanese, Korean, Polish,
Russian, Spanish, Swedish, Turkish, Xhosa and several other languages (Sartorius & Ban,
1986).
The BDI contains a total of 21 items, each item theoretically derived from clinical
observations of depressed patients. Each item is actually a collection of four related self-
referent statements arranged in increasing severity of the symptom, cognition, or affect
being measured. These statements are scored from 0 to 3. Total score is simply the sum of
all items, with the possible exception of one item concerning weight loss that is not counted
in the case of dieting. On average, the BDI takes about 10 minutes to complete.
The BDI underwent revision in 1978 to clarify language and put all items on a 4-
point scale (0 to 3) for a total of 84 self-statements. At this time Beck, et al. also changed
the general instructions from state instructions (subjects were instructed to respond
according to how they felt at the time of administration) to more long-term state
instructions (“during the past week”). The current instrument displays good psychometric
properties and has been consistently shown to have satisfactory clinical utility and reliability.
30
There are 2 subscales described in the manual for the BDI: Cognitive-Affective (first side—
13 items) and Somatic-Performance (back side—8 items), but there is little support for their
validity. Factor analysis of the BDI generally yields 3 major factors: (1) negative view of self
and future, (2) physiological symptomatology, and (3) physical withdrawal, but this isn’t
always consistent. The BDI has excellent validity and good split-half reliability (.87). Test-
retest reliability (.60) is acceptable, yet brings to attention the fact that the BDI is not a
purely state or trait measure and therefore neither completely stable in trait measurement
nor completely sensitive to subtle changes in depressive affect. Most criticism in this regard
is directed towards the BDI’s poor sensitivity to detect subtle differences in low levels of
depression.
The Zung Self-Rating Depression Scale (SDS; Zung, 1965) consists of 20 items
developed from previous factor analytic studies of clinical depression. The 20 items (10
positive, 10 negative) are on a 4-point scale ranging from “none or a little of the time” to “
most or all of the time” to assess frequency of each item. Scoring is based on the total of
the item scores divided by the maximum possible score (80). The scale appears to assess
pervasive affect, physiological equivalents or concomitants, and psychological concomitants (Gotlib and
Cane, 1989).
The SDS takes about 30 minutes to complete. Instructions for the SDS are to select
the answer “which applies best to how you have been feeling during the past week.”
However, many items could be interpreted as unclear in time, so the SDS is not really an
ideal measure of change in affect or a stable measure of long standing depression. There is
some disagreement over whether the SDS’s psychometric properties are sufficient for
general use and whether it is capable of differentiating different levels of depression (Carroll,

31
et al., 1973). The SDS does not appear to have a stable factor structure. Furthermore,
gender and age variables have different effects on scores in patient and non-patient
populations, with the elderly and adolescents tending to score in the clinical range on the
SDS. Another criticism is that the SDS items were never tested for internal reliability, and
often separate into factors based on positive and negative phrasing of the items (Gotlib and
Cane, 1989). Because of these numerous psychometric flaws, the SDS has seen a decline in
use and is not considered one of the better measures of depression.
The Depression Adjective Checklists (DACL; Lubin, 1965) consist of 7 lists of
affectively related adjectives which subjects are instructed to check if a particular adjective
describes their current feelings (“how you feel now—today”). The lists are divided into two
sets, with the lists in one set consisting of 32 items (the first four lists) and the lists in the
other set consisting of 34 items (the last 3 lists). In each list there are groups of negative
adjectives (which indicate depressive affect when checked) and groups of positive adjectives
(which should be more neutral). Scores are obtained by adding the number of checked
positive items to the number of unchecked negative items. Items inquire about affective
state, notably ignoring physiological symptoms and other aspects of the depressive
syndrome. Scoring is based on a total of checked items and unchecked reverse scored
items. Time to complete one of the DACL lists is about 2 ½ minutes. Lubin (1965)
indicates that normative data is extensive and good, internal consistency (split-half) is
strong, and intercorrelations of the lists are high. The instrument is generally a good
measure of state depressive affect.
The Center for Epidemiologic Studies –Depression scale (CES-D; Radloff, 1977) is
a 20-item scale designed to measure depressive symptoms in general (non-psychiatric)

32
populations. Its construction is very similar to that of the DACL and SDS. Items are on a
4-point scale indicating how frequently the subject has experienced the symptom item in the
last week, from “rarely or none of the time” to “most or all of the time.” Created from
items borrowed from other measures (BDI, SDS, MMPI), the CES-D was not intended as a
diagnostic or assessment instrument (although Radloff suggests that a score of 16 indicates
the presence of depression), but as a epidemiological research tool. Items assess depressed
mood, feelings of guilt, loneliness, hopelessness, worthlessness, psychomotor retardation,
concentration problems, appetite loss, and sleep disturbance. Factor analysis reveals
indicates that the CES-D has three strong factors: depressed affect, positive affect, and
somatic/retarded activities (Radloff, 1977). According to Radloff, the CES-D has high
internal consistency (.84+), and good sensitivity (.90). Many researchers feel the CES-D is
fine for research purposes, but shouldn’t be used as a clinical diagnostic instrument, mainly
because of too many false positives and negatives (Gotlib and Crane, 1989).
Clinical Assessment of Emotional Vital Signs
Clinical Assessment has historically focused on the measurement of individual
differences in various personality traits such as neuroticism, anxiousness, and other relatively
stable characteristics. Since much of our behavior and mental well-being is stable over time,
initial measurement of various personality traits allows some prediction of future behavior,
response to various treatments, etc. However, despite this knowledge of an individual’s
predisposition to act, feel, and think in a certain manner, there is still a great deal of
variation which is accounted for by their current emotional state. Although the strategy of
measuring emotional and personality traits can be rather useful in the diagnosis and

33
treatment of a number of mental disorders, it completely ignores important dynamic
elements of a patient’s treatment.
When clinicians possess some knowledge of both the personality traits and the
emotional states of an individual, they have a much more accurate picture of that
individual’s mental health. As a brief, illustrative example: imagine an individual in a therapy
session who, according to various measures of intelligence and trait personality, should have
no difficulty attending to and processing important information during a therapy session. If
this individual were to show up for a session in an extremely angry, anxious, or depressed
mood it could have a very serious effect on that individual’s ability to process information
during the session. Clinicians who are able to discern such an internal state in their clients
would be wise to begin by addressing these states early in the session. Moreover, using
assessment tools from session to session would provide clinicians with critical emotional
state information that would make it easier to address such disruptive emotional states and
to determine their antecedents.
Just as a physician’s routine measurement of physical vital signs (e.g., pulse rate,
blood pressure, and temperature) in medical examinations is used to assess general physical
health, it is essential to monitor emotional states, in order to evaluate psychological well-
being. Elevations in temperature that define a fever are interpreted by physicians as
indicative of the presence of infection that requires immediate attention (Guyton, 1977).
Similarly, symptoms of extreme emotion indicate the presence of pervasive unresolved
conflicts that result in an emotional fever. And, just as fevers can usually be reduced by
antipyretics (e.g., aspirin, acetaminophen) in patients with colds or the flu, depressed mood,
34
anxiety, etc. when detected, can be decreased by pharmacological or psychotherapeutic
intervention.
Assessment, Therapy, and Accountability
In the last 20 years, Managed Care Organizations (MCOs) and other types of third
party payers have become the predominant source of health care funding (Moreland,
Fowler, &Honaker 1994). Mental health care is the fastest rising cost in health care
(Winslow, 1989) and individuals in emotional distress are twice as likely to seek medical
services (VandenBos & DeLeon, 1988). Because of the recognized increased need for
mental health care and its documented effect on physical health care costs, third party
payers have made the control of mental health costs one of their top agenda items for the
coming decade (Kesler, 1986).
When striving to reduce the cost of mental health care, clinical assessment makes an
easy target, being one of the more costly and time consuming aspects of psychological
services (Moreland et al., 1994). In fact, early in the relationship between MCOs and mental
health services the process of assessment was viewed as an inordinate expense and payment
was often rejected (Marcus, 1993). Although there is substantial evidence to support the
value and effectiveness of assessment in clinical settings, MCOs and others are demanding
that the cost of assessment be very well justified from a financial standpoint. According to
Moreland et al. "... there is no surer way to justify testing than to go straight to the bottom
line: does test feedback have a direct positive impact on the client and is it ultimately
cheaper than simply forging ahead with therapy in the absence of testing?" (p.597). Given
the constraints of cost-effectiveness, therapy today is under ever increasing accountability
and pressure to effect results in just a few sessions and to provide objective evidence of

35
effectiveness. To this end, clinicians must give increasing attention to using assessment
instruments that are treatment-relevant, cost-effective, and clinically proven.
Clinical Assessment and Computerized Testing of Psychological Vital Signs
A major improvement in psychological testing is the development and increased use
of Computer Based Assessment (CBA). The numerous advantages CBA offers include
increased speed and efficiency, easier administration, improved access to assessment data,
potential for remote administration, lowered expense, innovative types of assessment (e.g.
measuring exact latency of responses), elimination of redundant data entry, and instant
feedback (Weber, et al., 2003). Furthermore, the science of clinical psychology will advance
through improved standardization of assessment (providing real comparability of studies),
improved data quality, and increased availability of data (Dow, et al., 1996).
Computers have already been a part of psychological assessment longer than most
clinicians have been in practice (Butcher, 1993) and are continually demonstrating increased
capability to perform routine assessment tasks. Although the use of computers in
psychological testing goes back as far as the early 1970's (e.g. J. Johnson and colleagues’
work at the Salt Lake City VA Hospital), CBA is still not widely used (Fowler, 1993). Some
of the likely reasons for this include: a lack of familiarity with computers, fear of client
reaction to computers, uncertainty regarding computerized testing issues, legal/ethical
concerns, misguided fear of clinician obsolescence, and general resistance to change. It is
likely that many of these concerns were felt as self-report questionnaires began to supplant
direct clinician interviews, forever changing the nature of psychological assessment (viz.
Krug, 1993).
36
Although CBA is still not being utilized by a majority of clinicians, there is growing
support for the development and use of CBA. Spielberger and Piotrowski (1990) assessed
the attitudes of 476 members of the Society for Personality Assessment towards
computerized testing, and found that the majority of clinicians considered CBA useful in
their work. As CBA and other technologies become increasingly important and
commonplace, many improvements and wholly new methods of assessment will become
available to clinicians everywhere.
One key area of improvement will be easier, more efficient administration. Just as
new technologies have lightened administrative time burdens in other areas, the
incorporation of various automated procedures will create more time for the behavioral
health care system to attend to real client problems rather than paperwork. Clients as well
as psychologists will also appreciate not having to re-enter a great deal of information from
various paperwork. Some of the expense from printing, data entry, and administration
costs will also be salvaged. Also, for individuals who have difficulty making frequent visits
to the clinic office, remote administration of assessment devices will provide improved
coverage and monitoring between sessions.
The facility with which assessments can be entered and recorded will allow much
easier tracking of client progress as well as the generation of data for practitioners to do
research on their own methods and efficacy. An excellent example of such an initiative is
The Psychological Corporation’s (1997) Optaio software package that contains various CBA
measures and a “practice manager” module for this very purpose. Management of records
will of course be greatly simplified too, resulting in cost and time-savings for mental health
care providers and researchers. The orderly storage of data will allow easier access to
37
assessment data, client records, and medical data. Records will be instantly accessible from
remote locations, eliminating the need to search for client files in volumes of filing cabinets
or waiting days to get the records through the mail. In addition to being easy to access,
computerization will allow for greater security for confidential information and easy
anonymitization of records for various research purposes.
Clinical psychology research will become easier and more efficient as improved
standardization of assessment allows meta-analyses and follow-up studies to be conducted
on existing data sets. In addition, CBA will bring an end to missing or illegible data from
poorly completed forms; since computerized measures can be programmed to require
completion of every item, inadvertent bad data can be eliminated completely. Vast stores of
quality data will be readily available to researchers around the world (e.g. the Florida Mental
Health Institute’s initiative to freely provide data from all institute research via the World
Wide Web). The volumes of standardized data generated by computerized assessments will
be easy to examine for clinical research such as outcome studies, resulting in greatly
enhanced accountability at all levels. As researchers, institutions, and individual therapists
make use of these data, techniques and policies that don’t work can be tracked, recognized,
and eliminated. The outcome of this improved, automated assessment and record keeping
will be the betterment and vertical development of behavioral health care.
Widely used computer scoring programs such as the Personality Assessment
Inventory (PAI) computerized diagnostic report are already helping therapists by providing
almost instant assessment feedback on the measure. Considering the impinging time limits
of managed care and the therapeutic value of being able to jump more quickly into therapy,
such tools will be of great value to psychology. As systems become more sophisticated and

38
well integrated, regular and repeated computerized assessment will become part of standard
therapy procedure. Marcus (1993) states that “[he] believe[s] that computerized
psychological testing is the only viable way to generate the objective data needed to end the
adversarial relationship between psychology and managed care organizations.”
Although it is not unusual for a client’s level of depression to be examined before
each therapy session, the measurement of other critical emotional states before therapy
sessions is very rare. Just like depressive emotion, other emotions such as anger and anxiety
are critical indicators of current mental well being, but since there are few quick and
adequate measures of these emotions, they are generally not assessed on a regular pre-
session basis. If there was an instrument that tapped all these psychological vital signs in a
quick and efficient manner, it could be of great value to the therapist in bringing attention
to immediate problems with their client at the beginning of each session.
The assessment of psychological vital signs at the beginning of the intake procedure
will make it possible provide feedback and help the client learn to cope with these feelings
early in treatment. If a patient is depressed or experiencing intense anxiety or anger, it is
imperative for the examiner to deal immediately and directly with these feelings. Intense
emotional feelings can greatly interfere with judgment and reality testing, and can result in
injuries to the patient or others. Feedback concerning patients' emotional vital signs, as
revealed by assessing anxiety, anger, and depression, can help them to recognize and report
relationships between their thoughts and feelings and the events which give rise to them,
and thus facilitate the therapeutic process. The therapeutic process would also be facilitated
if emotional vital signs were taken at the beginning of each treatment session. With such
information available at the beginning of a session, the therapist will be alerted to special

39
problems that require immediate attention. Dealing with elevations in a client's emotional
vital signs should take precedence over regular therapeutic procedures since these signs
indicate more immediate needs that must be addressed. Charting sequential levels of S-
Anxiety, S-Anger and S-Depression over the course of treatment, and providing patients
with feedback about these emotional vital signs can also help to identify significant problem
areas, thereby facilitating the patients' understanding of how specific problems influence
their emotions.
In order to take the science of clinical psychology forward to meet the new
expectations of third-party payers, new tools and techniques must be devised and
implemented (Moreland, Fowler, & Honaker, 1994). An ideal instrument should be fairly
brief, psychometrically sound, easy to administer and score, and should provide quick,
valuable information on the client’s mental condition (Marcus, 1993). Unfortunately, most
clinical assessment devices in current use fall short of these ideals. Therefore, new and
improved instruments must be designed and implemented in order to forward the practice
of clinical psychology.

40
STATEMENT OF THE PROBLEM
The goals of this study were to administer and validate a brief computerized measure
of emotional states and personality traits for use as an assessment tool in a clinical setting.
Adapted from the State-Trait Personality Inventory (STPI; Spielberger, 1998), this
instrument measures state and trait anxiety, anger, depression, and curiosity. The
computerized STPI (STPI-Cp) was administered and scored by computer rather than in the
conventional pencil-and-paper format. The following hypotheses were evaluated:
1. The psychometric characteristics (means and standard deviations) of the STPI-Cp will
be comparable to those for this instrument when it is administered in the conventional
pencil-and-paper format.
2. Client scores and Therapist ratings will correlate positively and significantly on all eight
measures of emotional states and personality traits.
3. Correlation of therapist ratings with client scores on the computerized state-trait
measure of psychological vital signs will be comparable to those of clients who
responded to the conventional paper-and-pencil format of the measure.
4. Clients completing the STPI-Cp will report that it was easy to understand and that
responding to the measure was easily accomplished.

41
METHOD
Participants
There were two categories of participants in the present study, therapists and clients,
who were recruited from one of two settings at a large Southeastern university: (1) The
Counseling Center for Human Development (CCHD), or (2) the Psychological Services
Center (PSC). The CCHD is a student services center that provides free counseling for
university students. The PSC is a training clinic that provides therapy and other services to
both students and the general community. The 40 clients (24 females; 16 males), ranging in
age from 21 to 77 years old (mdn age = 29) were currently receiving psychological treatment
at the CCHD or the PSC. Based on their self-reports of demographic characteristics, 93%
of the clients were Caucasian (n=37); the remaining 7% (n = 3) were either Asian American
or African American. Although females outnumbered the males by a ratio of 3:2, the
distribution for each sex across experimental conditions and data collection sites was
approximately even. Clients at the CCHD were all receiving free counseling sessions, while
clients at the PSC were receiving treatment with payment on a sliding scale.
The 18 therapists who participated in this study were mental health service providers
who were employed by the CCHD (n=9) or in training at the PSC (n=9). The CCHD
therapists were either interns or staff members; therapists at the PSC were all advanced
graduate students enrolled in an APA approved doctoral program in clinical psychology. All
therapists had seen their clients at least twice before participating in the present study.
Since most therapists saw multiple clients, several therapists participated more than once in
the study.

42
Apparatus, Instruments, and Measures
State-Trait Personality Inventory (STPI). The STPI (Spielberger, 1979, 1998) is a self-
report inventory comprised of eight 10-item scales for assessing state and trait anxiety,
anger, depression, and curiosity. The STPI state scales are designed to measure the
intensity, at a particular moment, of the respondent's feelings. Respondents rate themselves
using items (e.g. "I feel tense.") on the following 4-point scale: (1) “not at all,” (2)
“somewhat,” (3) “moderately so,” and (4) “very much so.” The STPI trait scales measure
individual differences in anxiety, anger, depression, and curiosity by evaluating how often
these emotions are experienced. Respondents rate themselves on trait items (e.g. "I feel
tense.") with the following 4-point frequency scale: (1) “almost never,” (2) “sometimes,” (3)
“often,” and (4) “almost always.” The STPI has good internal consistency (Spielberger,
1998) with alpha coefficients ranging from .80 to .96. with stability coefficients of Test-
retest reliability is also very good for trait scales, but lower for state scales, in accordance
with the definition of these constructs.
The standard STPI is presented on a double-sided test form. Participant
demographics, the state scale instructions, and 40 state items are on the front side; the trait
scale instructions and 40 trait items are on the reverse side (see Appendix C). Respondents
blacken in circles (labeled 1 through 4) next to each question to indicate the intensity (state)
or frequency (trait) response for each item. Since respondents can view the entire
instrument at once, they are able to complete items out of order or change their responses
if they desire to do so.

43
Computerized State Trait Personality Inventory (STPI-Cp). The STPI-Cp is a direct
adaptation of the conventional pencil-and-paper STPI, which includes the same
instructions, rating scales and items, which are presented in the same order as the original
version, but, unlike the paper STPI, the STPI-Cp items are presented one at a time and each
item must be answered before the respondent is presented with the next item. It is not
possible to complete the items out of sequence. The STPI-Cp instructions and items are
presented on a computer screen. Participants respond to each STPI-Cp item simply by
using the mouse to point and click on their response to each item.
The STPI-Cp program was developed using Microsoft Access97, a database
application that compiles the clients' responses and serves as the interface for the
questionnaire items that are presented on-screen. The STPI-Cp was administered to
participants using IBM compatible computers with Pentium class processors and the
Windows 95 operating system. All computers were equipped with 15-inch VGA color
monitors set at 800 x 600 resolution for optimal visibility. Screenshots of the STPI-Cp
application can be found in Appendix A.
Client Assessment (CA) Report. The Client Assessment report provides graphical and
tabular summaries of each client's STPI state and trait anxiety, anger, depression, and
curiosity scale scores, as compared with graphical and tabular norms for the STPI, which
were based on large samples of undergraduate students (STPI; Spielberger, 1998). For the
traditional paper administration of the STPI, the CA report is generated based on the
client’s responses, which are manually entered by the experimenter. For the STPI-Cp, client

44
responses are used to automatically generate the CA report. An example of the CA report
can be found in Appendix A
Client and Therapist Exit Questionnaires. The Client Exit Questionnaire (CEQ)
consisted of the following 3 items that were administered immediately after each client
completed the STPI and before client debriefing: (1) “Was the self-analysis-questionnaire
easy to understand?”; (2) “Was it easy to complete the questionnaire?”; and (3) “How
familiar are you with using computers?” Responses to each CEQ item are made on a 9-
point Likert-type scale with end points of (1) “not at all” and (9) “very much so;” the
intermediate points were labeled “somewhat” and “moderately so.” (CEQ can be found in
Appendix A.)
The Therapist Exit Questionnaire (TEQ) consisted of 4 items regarding their agreement
with the CA report and the usefulness of this report; their judgment of how their client
reacted to the assessment procedure; the approximate number of therapy sessions they have
had with their client; and when they had last administered clinical assessment tools such as
the Beck Depression Inventory to their client. Therapist responses to each TEQ item are
recorded using a 9-point Likert-type scale with end points of (1) “not at all” and (9) “very
much so,” and intermediate points labeled “somewhat” and “moderately so.” (TEQ can be
found in Appendix A.)
Therapist Ratings of Client's Emotional States and Personality Traits. Therapists rated their
clients on each of the four STPI state and trait dimensions (anxiety, anger, depression, and
curiosity) using a 9-point scale. This brief rating scale consisted of 8 items that described

45
the client’s emotional states and personality traits. The meaning of each of the emotional
states and personality traits were explained in an attached cover sheet. The anchor points
for rating the 4 state items were: “Not at All” (1) and “Very Much” (9), with “Somewhat”
and “Moderately” as intermediate points. State instructions indicated the respondents
should evaluate the client's emotional states during the first 10 minutes of the therapy
session. For the trait items, the anchor points were: “Almost Never” (1) and “Almost
Always” (9), with “Sometimes” and “Often” as intermediate points. Trait instructions
indicated that respondents should provide an evaluation of the client's general personality
traits.
Procedure
The procedures for this study consisted of three main stages: The first stage
involved the recruitment of therapist and clients, the second stage was client participation,
and the third stage therapist rating of clients and feedback. Each of these phases is
described below:
Stage 1: Recruitment of Therapists and Clients
Therapists at the PSC and CCHD were provided information that explained the
procedure of the study and the amount of time required for participation. The therapists
who volunteered to participate were asked to approach their clients at the end of the next
therapy session to explain the study, and to ask if the client would be willing to participate in
the study. Clients who agreed to take part in the study were asked to arrive at least 15
minutes early before their next scheduled session in order to complete the client

46
instruments before their therapy session was scheduled to begin. Before the client arrived,
therapists signed an informed consent form to indicate that the study had been explained to
them, they had had an opportunity to ask questions, and that they had consented to
participate in the study.
Stage 2: Client participation
The 40 clients who were recruited by their therapists to participate in the study were
randomly assigned by the experimenter to complete either the computerized form of the
STPI (STPI-Cp) or the conventional pencil-and-paper form (STPI). Clients were told they
would be given a short questionnaire regarding their feelings that would in no way effect
their treatment; that their responses to this questionnaire would take about 10 minutes to
complete and would be strictly confidential; and that participation was voluntary. Clients
then signed an informed consent form to indicate the study had been explained to them,
they had had an opportunity to ask questions, and had consented to participate in the study.
After giving their informed consent to participate, each client was familiarized with the
rating procedures for the assessment tool that they would be given. Several key differences
between the paper and computerized administrations of the STPI should be noted. First,
the STPI-Cp items would be presented one at a time, and clients responded to each item in
the sequence as they appeared. Also unlike the paper version, the clients who responded to
the STPI-Cp would not have the opportunity to view the entire questionnaire at once, nor
could they review or revise their responses to previous items.
The instructions printed on the test form for the paper STPI (see Appendix A) were
explained to the clients, who responded to each state and trait STPI item by blackening a
circle that corresponded to their response on the instrument’s 4-point scale. Instructions

47
for the computerized STPI were presented on-screen and, like the paper version, were
explained to the clients. Clients responded to each state and trait STPI item by pointing and
clicking with the computer mouse on graphical buttons, each of which displayed an anchor
of the appropriate 4-point scale. Screenshots of the STPI-Cp are located in Appendix A.
After the client had finished responding to either the computer or paper STPI, they
were given the 3-item CEQ to assess their impression of the assessment device and
procedure. Once the STPI and the CEQ were completed, all clients were thanked for their
participation, and debriefed. The clients were informed about the potential value of
measuring psychological vital signs, the major hypotheses of the study, and that their STPI
state and trait scale scores would be shared with their therapists who might discuss these
with the client in an upcoming session. All clients were encouraged to return to the
experiment area after their therapy session if they wished to see their STPI scale scores or
discuss the study further. Following this debriefing, the clients proceeded immediately to
their scheduled therapy session. After the client had left for their therapy session, client
responses were entered into the STPI-Cp by the experimenter if the client was given the
paper STPI and a Client Assessment (CA) report was automatically generated for the
therapist’s review.
Stage 3: Therapists rating of Clients
After the client’s therapy session, each therapist was asked to rate his perception of
the client’s mood during the first ten minutes of the session for each State dimension and
the client's general mood for each Trait dimension. Each therapist provided ratings of their
client's state and trait anxiety, anger, depression, and curiosity using a 9-point rating scale
(See Appendix B) that was designed to assess the same constructs as the STPI state and trait
48
scales. The therapist then received a printed report (see Appendix C) of their client’s scale
scores on the State-Trait instrument. After viewing the STPI report, each therapist
completed the 5-item TEQ. After the therapists had finished responding to the TEQ, they
were thanked for their participation in the study and debriefed about the potential value of
measuring psychological vital signs and the major hypotheses of the study.
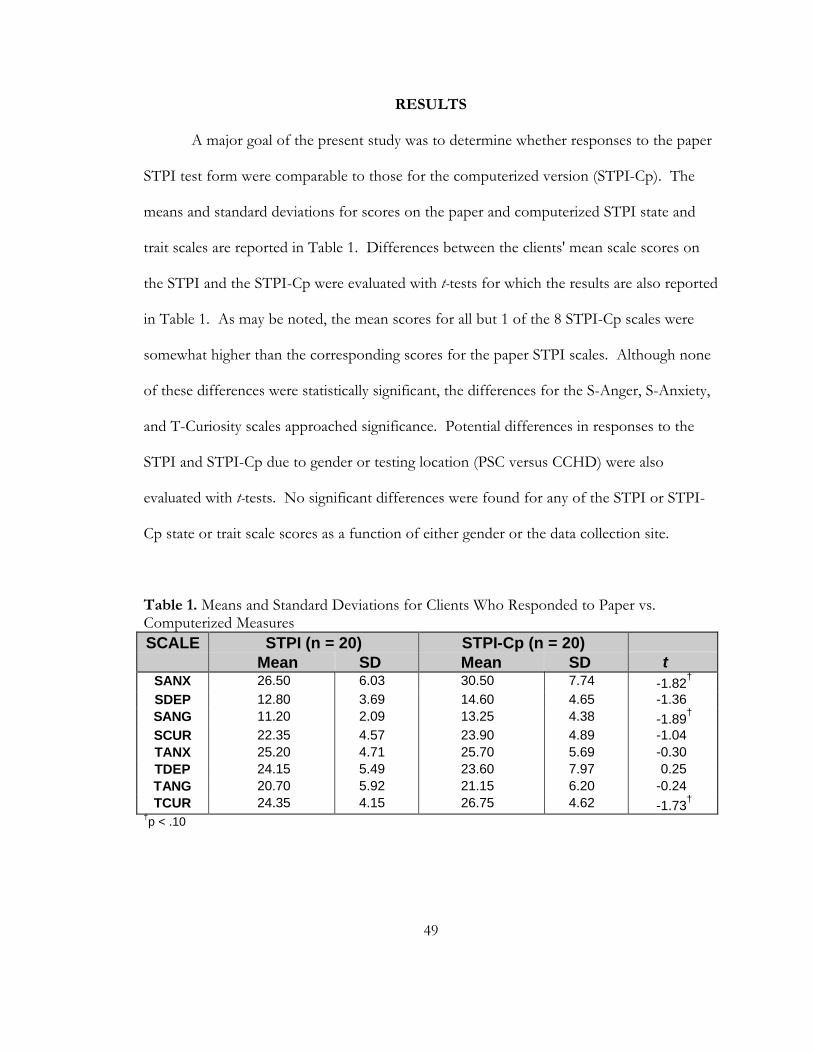
49
RESULTS
A major goal of the present study was to determine whether responses to the paper
STPI test form were comparable to those for the computerized version (STPI-Cp). The
means and standard deviations for scores on the paper and computerized STPI state and
trait scales are reported in Table 1. Differences between the clients' mean scale scores on
the STPI and the STPI-Cp were evaluated with t-tests for which the results are also reported
in Table 1. As may be noted, the mean scores for all but 1 of the 8 STPI-Cp scales were
somewhat higher than the corresponding scores for the paper STPI scales. Although none
of these differences were statistically significant, the differences for the S-Anger, S-Anxiety,
and T-Curiosity scales approached significance. Potential differences in responses to the
STPI and STPI-Cp due to gender or testing location (PSC versus CCHD) were also
evaluated with t-tests. No significant differences were found for any of the STPI or STPI-
Cp state or trait scale scores as a function of either gender or the data collection site.
Table 1. Means and Standard Deviations for Clients Who Responded to Paper vs. Computerized Measures SCALE STPI (n = 20) STPI-Cp (n = 20)
Mean SD Mean SD t SANX 26.50 6.03 30.50 7.74 -1.82† SDEP 12.80 3.69 14.60 4.65 -1.36 SANG 11.20 2.09 13.25 4.38 -1.89† SCUR 22.35 4.57 23.90 4.89 -1.04 TANX 25.20 4.71 25.70 5.69 -0.30 TDEP 24.15 5.49 23.60 7.97 0.25 TANG 20.70 5.92 21.15 6.20 -0.24 TCUR 24.35 4.15 26.75 4.62 -1.73†
†p < .10

50
Correlations of Therapist Ratings with Client Self-Reports
Pearson product-moment correlations of therapist ratings of their client's emotional
states and personality traits with the clients’ STPI scale scores are reported in Table 2. For
the total sample, therapist ratings and client STPI scores correlated positively for all 4 STPI
trait scales and for S-Depression. Other State scales were essentially unrelated. Correlations
of therapist ratings with client scores were statistically significant for T-Anxiety, T-
Depression, and S-Depression (p < .05), while approaching significance for T-Anxiety and
T-Curiosity (p < .10).
Table 2. Correlations Between Therapist Ratings and Client STPI Scores for the Total Sample and for the Paper vs. Computerized groups
SCALE Total Sample (n=40)
Paper & Pencil (n=20)
Computer (n=20)
z-test
SANX .088 .007 .124 -0.34 SDEP .430* .272 .460* -0.64 SANG -.019 -.011 -.101 0.26 SCUR -.170 -.087 -.315 -0.70 TANX .475* .519* .441† 0.30 TDEP .437* .422† .513* -0.34 TANG .297† .396† .203 0.62 TCUR .274† -.031 .361 -1.19
†p < .10 * p < .05
For the traditional paper STPI, therapists’ ratings showed positive correlations with
clients’ STPI scores for the T-Anxiety, T-Depression, and T-Anger scales, with a significant
correlation for T-Anxiety (p < .05). Positive correlations were also found between
therapists’ ratings and clients’ scores for the S-Depression, T-Anxiety, and T-Depression
scales of the computerized STPI. To determine whether the correlations between therapist
ratings and client scores differed due the testing modality, differences in these correlations
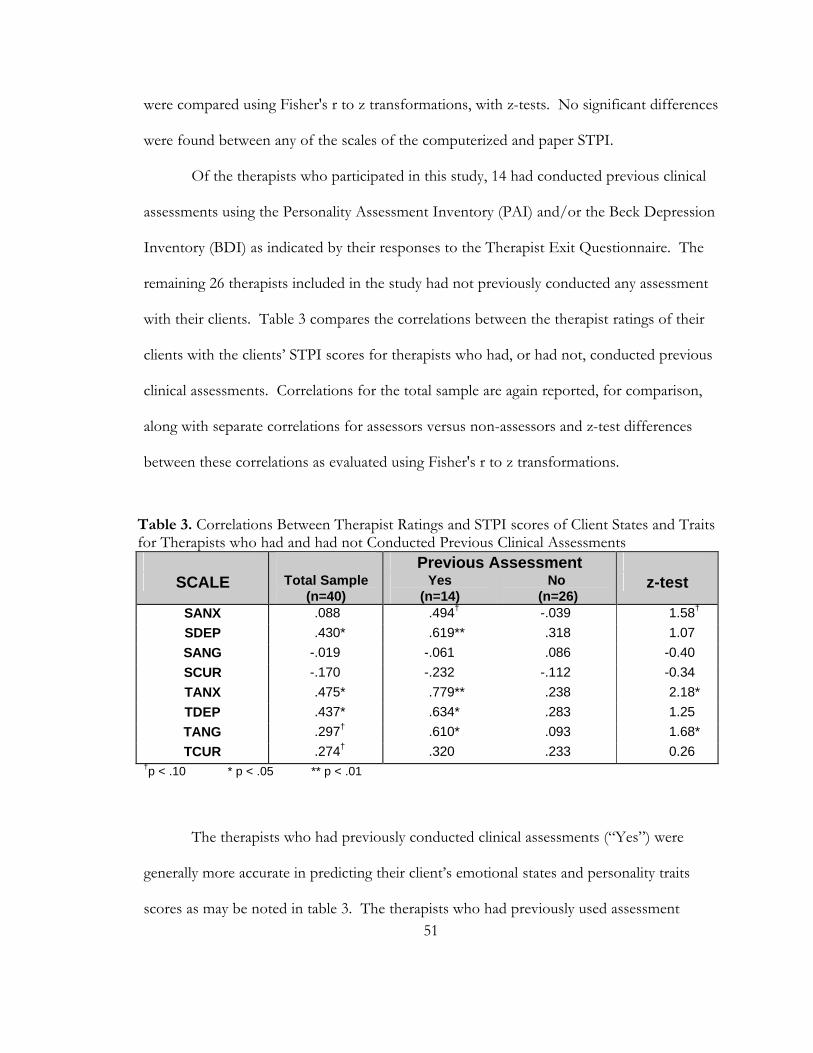
51
were compared using Fisher's r to z transformations, with z-tests. No significant differences
were found between any of the scales of the computerized and paper STPI.
Of the therapists who participated in this study, 14 had conducted previous clinical
assessments using the Personality Assessment Inventory (PAI) and/or the Beck Depression
Inventory (BDI) as indicated by their responses to the Therapist Exit Questionnaire. The
remaining 26 therapists included in the study had not previously conducted any assessment
with their clients. Table 3 compares the correlations between the therapist ratings of their
clients with the clients’ STPI scores for therapists who had, or had not, conducted previous
clinical assessments. Correlations for the total sample are again reported, for comparison,
along with separate correlations for assessors versus non-assessors and z-test differences
between these correlations as evaluated using Fisher's r to z transformations.
Table 3. Correlations Between Therapist Ratings and STPI scores of Client States and Traits for Therapists who had and had not Conducted Previous Clinical Assessments
Previous Assessment SCALE Total Sample
(n=40) Yes
(n=14) No
(n=26) z-test
SANX .088 .494† -.039 1.58† SDEP .430* .619** .318 1.07 SANG -.019 -.061 .086 -0.40 SCUR -.170 -.232 -.112 -0.34 TANX .475* .779** .238 2.18* TDEP .437* .634* .283 1.25 TANG .297† .610* .093 1.68* TCUR .274† .320 .233 0.26
†p < .10 * p < .05 ** p < .01
The therapists who had previously conducted clinical assessments (“Yes”) were
generally more accurate in predicting their client’s emotional states and personality traits
scores as may be noted in table 3. The therapists who had previously used assessment

52
measures with their client displayed significant correlation on three out of four of their
clients’ personality traits (T-Anx, T-Dep, T-Ang). Assessing therapists' ratings also showed
significant correlation with client S-Depression (p < .05) and nearly significant correlation
with S-Anxiety (p < .10).
The therapists who had not previously assessed their clients failed to show
significant predictions in any of the correlations of their ratings with clients’ reported
emotional states or traits. Comparing the strength of the correlations using z-tests,
therapists who had previously conducted assessment had higher correlation for 3 out of 4
Trait scales, and the correlations of their ratings with T-Anxiety and T-Anger were
significantly higher (p < .05). Therapists who had previously assessed also showed higher
correlations for S-Anxiety and S-Depression, with S-Anxiety approaching significance (p <
.10).
Therapist Ratings of the Usefulness of the Client Assessment (CA) Reports
The STPI-Cp generated Client Assessment (CA) reports, consisting of graphical and
tabular displays of the clients’ state and trait scale scores, which were given to therapists for
review after they had completed their ratings of their clients. Therapists evaluated the utility
of the CA report by responding to two Therapist Exit Questionnaire (TEQ) items which
asked them to indicate their “agreement with” information from the CA report and
perceived “usefulness of” this report as a clinical tool. The correlation for the total sample
between ratings of “agreement” and “usefulness” was near zero (r = .06, Agree: M = 5.79,
SD = 1.42; Useful: M = 6.53, SD = 1.11), indicating that these items were essentially
unrelated. This finding suggests that therapists were relatively unbiased since they did not

53
rate the usefulness of the CA report more positively or negatively on the basis of the
accuracy of their prediction of clients’ assessment scores.
Client Ratings of Usability for the Paper and Computerized STPI
Clients also evaluated the usability of the computerized or paper STPI by
responding to the Client Exit Questionnaire (CEQ), which asked them to rate whether the
STPI was “easy to understand” and “easy to complete.” In addition, clients also rated
themselves on their computer experience. Means and standard deviations for the CEQ
items are reported in Table 4. For both the paper and computer conditions, means for the
usability items were high, with a modal response of 9 (on a scale of 1 to 9). No significant
differences in the mean CEQ ratings were found between the computerized and traditional
STPI. However, the clients who responded to the STPI-Cp tended to rate it as being
somewhat easier to complete and also reported more computer experience.
Table 4. Means and standard deviations for Client’s Usability Ratings for the paper and computerized (Cp) State Trait Personality Inventory (STPI)
CEQ item Paper Computer t-test
M (SD) M (SD) Easy to Understand 8.30 (0.87) 8.25 (0.97) 0.172 Easy to Complete 7.75 (2.12) 8.60 (0.82) -1.669 Computer Experience 6.90 (1.89) 7.70 (1.98) -1.308
†p < .10
In examining the correlations among the client usability ratings, it is interesting to
note that for clients who responded to the STPI-Cp, there was a substantial positive
correlation between the two usability ratings (r=.80, p < .001). This suggests that ease of
completing the STPI-Cp was strongly related to clients’ understanding of how to respond to

54
the computerized administration of the test. In contrast, for clients who responded to the
traditional paper STPI, ratings of ease of understanding this test were unrelated to their
ratings for ease of completion (r=.01). However, when two extreme outliers in the paper
STPI condition, with scores of 1 and 3 (responses otherwise ranged from 7 to 9) on “Ease
of Completion,” were eliminated from the analysis, the mean “Ease of Completion” rating
increased to 8.39 (SD = 0.78) and a similar high correlation (r=.81, p < .001) was found
between these two items for the traditional paper STPI.

55
DISCUSSION
A major goal of the present study was to determine whether responses to the
computerized version of the STPI were comparable to those for the traditional paper form.
Although no significant differences were found in any of the eight scale scores for the STPI
and STPI-Cp, it is interesting to note that the mean scores for the four STPI-Cp state scales
were somewhat higher than the corresponding scale scores for the traditional STPI (see
Table 1) and that two of these differences (S-Anx and S-Ang) approached significance (p <
.10). Given that relatively high anxiety, anger, and depression scores are generally expected
for clinical outpatients, these findings suggested that the respondents were somewhat more
forthright in reporting their emotional states when responding on the computer, as has
been found in previous research (Kobak, et al., 1997; Turner, C.F., et al., 1998). Means for
the four STPI trait scales showed little difference between the STPI-Cp and the
corresponding scale scores for the traditional STPI, with the exception of T-Curiosity,
which was over two points higher for the STPI-Cp. Perhaps the novelty of the
computerized assessment influenced clients to report a higher degree of curious thoughts
and behaviors.
For the total sample, therapist ratings of their clients’ emotional states and
personality traits correlated positively with the clients’ self-reports for the state depression
scale and all four STPI trait scales, with significant correlation ( p < .05) for the S-Dep, T-
Anx, and T-Dep scales. For the paper STPI, therapist ratings of their clients’ states and
traits correlated positively with the clients’ self-reports for the trait anxiety, anger, and
depression measures and for the state depression scale. Positive correlations were also
found between therapist ratings and client self-reports for the STPI-Cp state depression

56
scale, and for the anxiety and depression trait scales. No significant differences were found
between the correlations of therapist ratings and client scores for any scales of the
computerized and paper STPI, suggesting that the assessment modality had relatively little
influence on therapist accuracy in predicting client scores.
A second comparison of therapists’ ratings with clients’ STPI scores examined
correlations for therapists who had previously assessed their clients for depression and/or
general psychopathology versus correlations for therapists who had not done assessment.
Therapists who had previously conducted clinical assessments were generally more accurate
in assessing their client’s emotional states and personality trait scores, as reflected by higher
correlations of therapist ratings with client scores. As may be noted in Table 3, for previous
assessors, the correlations were significant or approached significance for five out of the
eight STPI scales. Therapists who had previously conducted assessment had significantly
stronger correlations of therapist ratings with client scores for T-Anxiety and T-Anger and a
nearly significant difference in their assessment of S-Anxiety. Considering that the previous
assessment devices used by the therapists were the PAI and/or the BDI, it stands to reason
that therapists who previously assessed would have better knowledge of their clients for the
emotional states and traits that are measured by these inventories –or at least a good chance
of remembering the client's previous assessment scores. Therapists who had not assessed
their clients failed to show significant prediction for any of their clients’ emotional states or
traits. Assuming self-reports such as the STPI accurately reflect a therapy client's emotions,
these findings demonstrate the potential value of performing psychological assessment as a
bridge to better understanding individuals in therapy.
57
In evaluating the usability of the STPI and the STPI-Cp as clinical tools, client
ratings were quite favorable, suggesting that completing this inventory as part of therapy was
practical and did not represent a difficulty for the clients. In both the administration of the
STPI-Cp and the paper form of the STPI, the client’s ease of understanding the STPI was
highly related to their ease in responding to the instrument. There was no difference in
client ratings of how easy it was to understand the two forms. However, clients who
responded to the computerized administration rated this procedure as somewhat easier to
complete.
Therapist ratings of how useful the STPI would be in a therapeutic setting were less
favorable, but still suggested that the therapists recognized some value to assessing the
emotional well being of their clients at the beginning of therapy. Although most therapists
involved in the study were not currently conducting assessment as part of their intake
procedure, informal comments and ratings of the procedure suggested that therapists would
be agreeable to using a short self-report with their future clients.
Unfortunately, the current study had several major shortcomings in large part due to
the difficulty of obtaining data from therapists and clients. These problems included small
sample size, a fairly heterogeneous sample, uneven subgroups, and statistical difficulties
(such as insufficient power) due to these limitations. In retrospect, a Multi-Level Model
analysis of the experiment data would probably have been a more powerful method of
examining differences in the various groupings, but when this study was proposed MLM
analyses were not in common use. Future, better-powered studies of computerized
assessment might examine the causes of higher levels of reporting of emotion on

58
computerized questionnaires and the various factors that effect client and therapist reaction
to the use of the computer in a clinical setting.
Even though computerized psychological assessment has been used for more than
30 years, it is still not widely used (Fowler, 1993). As previously noted, lack of familiarity
with computers, concerns about client reaction to computers, uncertainty regarding
computerized testing issues, legal/ethical concerns, misguided fear of clinician obsolescence,
and general resistance to change are likely reasons for the infrequent use of computerized
assessment in clinical settings. The findings of the present study provide evidence that
computerized assessment is as easy to use as traditional paper-and-pencil instruments, that
the information it provides about clients is just as reliable as that obtained with traditional
assessment procedures, that it is far more efficient to administer, and it is much easier to
score. With regard to therapist resistance, the most frequent reason given by therapists,
during recruitment, for not participating in the study was their concern that this would
disrupt therapy or be discomfiting to their client.
The improved efficiency of computerized assessment procedures could help reduce
the data entry and test-scoring burdens of behavioral health care professionals, which would
leave clinicians with more time to spend in treating clients’ problems rather than on sorting
their paperwork. The facility with which assessments can be entered and recorded will
allow much easier tracking of client progress while also generating data for practitioners to
do research on their own methods and efficacy. In running this experiment, the advantages
of computerized administration were obvious. Thanks to automatic scoring and the fact
that the client had already entered all scale data, the experimenter typically spent
considerably less time administering the STPI on the computer, despite having to provide
59
more assistance to some participants in that condition. The biggest difficulty encountered
during the administration of the experiment by computer was acquiring access to a printer,
which was occasionally difficult to access at one of the testing locations.
The assessment of psychological vital signs at the beginning of the intake procedure
can facilitate therapists’ ability to provide immediate feedback to their clients. If a patient is
depressed or experiencing intense anxiety or anger, it is imperative for the therapist to deal
immediately and directly with these emotional feelings, which can greatly interfere with
judgment and reality testing, and can result in injuries to the patient or others. Feedback
concerning patients’ emotional vital signs, as revealed by assessing anxiety, anger, and
depression, can help them to recognize and report relationships between their thoughts and
feelings and the events which give rise to them, and thus facilitate the therapeutic process.
With the use of computerized testing, the assessment of emotional vital signs, as measured
by levels of state anxiety, anger, and depression, can be taken at the beginning of each
treatment session, and may alert the therapist to special problems that require immediate
attention. Charting sequential levels of state anxiety, anger, and depression over the course
of treatment, and providing patients with feedback about their emotional vital signs, may
also help identify significant problem areas, which can facilitate the patients' understanding
of how specific problems influence their emotions.
Given the increasing demands of managed care to show measurable results and the
decreased amount of time practitioners have for client contact, a quick assessment of
current status and client progress in treatment would make a valuable clinical tool. If this
type of data can be regularly gathered with relatively little effort or cost on the part of the
clinician, it takes nothing away from the therapeutic process while increasing value,
60
accountability, and insight. Computerization of standard clinical measures holds great
promise for clinical research and practice, but first, many questions must be explored in
more detail such as whether computerized adaptations of existing tests are equivalent to
traditional formats (Weber, et al., 2003) and what important new factors must be considered
(Carroll, J.M., 2001) when individuals are responding to computer-based assessments.
.

61
REFERENCES
Acklin, M.W. (1995). Personality assessment and managed care. Meeting of the Society for
Personality Assessment (1995, Atlanta, Georgia, US). Journal of Personality Assessment,
66(1), 194-201
Alexander, F.G. (1948). Emotional factors in hypertension. In F. Alexander & T.M.
French (Eds.), Studies in psychosomatic medicine: An approach to the cause and
treatment of vegetative disturbances. New York: Ronald Press. [Originally published,
1939.]
Auerbach, S.M., & Spielberger, C.D. (1972). The assessment of state and trait anxiety with
the Rorschach test. Journal of Personality Assessment, 36, 314-335.
Auerbach, S.M., Wadsworth, A.D., Dunn, T.M., Taulbee, E.S., & Spielberger, C.D. (1973).
Emotional reactions to surgery. Journal of Consulting and Clinical Psychology, 40, 33-
38.
Averill, J.R. (1982). Anger and aggression: An essay on emotion. New York: Spring-
Verlag.
Barlow, D.H. (1988). Anxiety and its disorders. New York: The Guilford Press.
Barlow, D.H., DiNardo, D.A., Vermilyea, B.B., Vermilyea, J.A., & Blanchard, G.B. (1986).
Co-morbidity and depression among the anxiety disorders: Issues in diagnosis and
classification. Journal of Nervous and Mental Disease, 174, 63-72.
Beck, A.T. (1967). Depression: Clinical, experimental, and theoretical aspects. New York:
Hoeber.

62
Beck, A. (1976). Cognitive therapy and the emotional disorders. New York: International
Universities Press.
Beck, A.T., Resnik, H.L.P., & Lettieri, D. (Eds.) (1974). The prediction of suicide. Bowie,
MD: Charles Press.
Beck, A.T., Rush, A.J., Shaw, B.F., & Emery, G. (1979). Cognitive therapy of depression.
New York: Guilford Press.
Benshoof, B.G. (1987). A comparison of anxiety and depression symptomatology in the
anxiety and affective disorders. Unpublished doctoral dissertation, State University of
New York at Albany.
Biaggio, M.K. (1980). Assessment of anger arousal. Journal of Personality Assessment, 44,
289-298.
Biaggio, M.K., & Maiuro, R.D. (1985). Recent advances in anger assessment. In C.D.
Spielberger & J.N. Butcher (Eds.), Advances in Personality Assessment (Vol. 5).
Hillsdale, NJ: Lawrence Erlbaum Associates, Inc.
Biaggio, M.K., Supplee, K., & Curtis, N. (1981). Reliability and validity of four anger scales.
Journal of Personality Assessment, 45, 639-648.
Booth-Kewley, S., & Friedman, H.S. (1987). Psychological predictors of heart disease: A
quantitative review. Psychological Bulletin, 101 343-362.
Borkovec, T.D., Weerts, T.C., & Bernstein, D.A. (1977). Assessment of anxiety. In A.R.
Ciminero, K.S. Calhoun, & H.E. Adams (Eds.), Handbook of Behavioral Assessment
(pp. 367-428). New York: John Wiley and Sons.
Burns, D.D. (1980) Feeling good. New York: William Morrow and Company, Inc.
Buss, A.H. (1961). The psychology of aggression. New York: John Wiley & Sons.
63
Buss, A.H., & Durkee, A. (1957). An inventory for assessing different kinds of hostility.
Journal of Consulting Psychology, 21, 343-349.
Buss, A.H., & Perry, M. (1992). The aggression questionnaire. Journal of Personality and
Social Psychology, 63, 452-459.
Butcher, J.N. (1990). The MMPI-2 in psychological treatment. New York: Oxford
University Press.
Carroll, J. M. (2001). Human–computer interaction, the past and the present. In J.M. Carroll
(Ed.), Human–computer interaction in the new millennium (pp. xxvii–xxxvii). New
York, Boston, San Francico: ACM Press and Addison-Wesley.
Cattell, R.B. (1966). Patterns of change: Measurement in relation to state-dimension, trait
change, lability, and process concepts. Handbook of Multivariate Experimental
Psychology. Chicago: Rand McNally.
Cattell, R.B., & Scheier, I.H. (1958). The nature of anxiety: A review of thirteen
multivariate analyses comprising 814 variables. Psychological Reports, 4, 351.
Cattell, R.B., & Scheier, I.H. (1961). The meaning and measurement of neuroticism and
anxiety (pp. 57, 182). New York: Ronald Press.
Cattell, R.B., & Scheier, I.H. (1963). Handbook for the IPAT Anxiety Scale (2nd ed.).
Champaign, IL: Institute for Personality and Ability Testing.
Cohen, J. (1988). Statistical Power Analysis for the Behavioral Sciences (2nd ed.). Hillsdale,
NJ: Lawernce Erlbaud.
Cook, W.W., & Medley, D.M. (1954). Proposed hostility and pharisaic-virtue scales for the
MMPI. The Journal of Applied Psychology, 38, 414-418.
64
Crane, R.S. (1981). The role of anger, hostility, and aggression in essential hypertension.
(Doctoral dissertation, University of South Florida, Tampa, FL, 1981). Dissertation
Abstracts International, 42, 2982B.
Cronbach, L.J. (1951). Coefficient alpha and the internal structure of tests. Psychometrika,
16, 297-335.
Curtis, G., Kinder, B., Kalichman, S., & Spana, R. (1988). Affective differences among
subgroups of chronic pain patients. Anxiety Research: An International Journal, 1, 65-
73.
Darwin, C. (1965 version, original publication 1872). The expression of emotions in man
and animals. Chicago: University of Chicago Press.
Deffenbacher, J.L. (1992). Trait anger: Theory, findings, and implications. In C.D.
Spielberger & J.N. Butcher (Eds.), Advances in Personality Assessment (Vol. 9, pp.
177-201). Hillsdale, NJ: Lawrence Erlbaum Associates, Inc.
Deffenbacher, J.L., Demm, P.M., & Brandon, A.D. (1986). High general anger: Correlates
and treatment. Behaviour Research and Therapy, 24, 480-489.
Deffenbacher, J.L., & Stark, R.S. (1990). Relaxation and cognitive-relaxation treatments of
general anger. Manuscript submitted for publication, Department of Psychology,
Colorado State University, Fort Collins, CO.
de la Torre, J. (1979). Anxiety states and short-term psychotherapy. In W.E. Fann, I.
Karacan, A.D. Polorny, & R.L. Williams (Eds.), Phenomenology and treatment of
anxiety (pp. 377-388). Jamaica, NY: Spectrum Publications, Inc.
DeRubeis, R.J., & Beck, A.T. (1988). Cognitive therapy. In K.S. Dobson (Ed.), Handbook
of Cognitive-Behavioral Therapies (pp. 273-306). New York: The Guilford Press.

65
Duffy, F. (1941). An explanation of "emotional" phenomena without the use of the
concept "emotion." Journal of General Psychology, 25, 283-293.
Evans, D.R., & Stangeland, M. (1971). Development of the reaction inventory to measure
anger. Psychological Reports, 29, 412-414.
Freud, S. (1924). Collected papers (Vol. 1). London: Hogarth Press.
Freud, S. (1936). The problem of anxiety. New York: W.W. Norton.
Funkenstein, D.H., King, S.H., & Drolette, M.E. (1954). The direction of anger during a
laboratory stress-inducing situation. Psychosomatic Medicine, 16, 404-413.
Fuqua, D.R., Leonard, E., Masters, M.A., Smith, R.J., Campbell, J.L., & Fischer, P.C.
(1991). A structural analysis of the State-Trait Anger Expression Inventory (STAXI).
Educational and Psychological Measurement, 51, 439-446.
Garfield, S.L., & Bergin, A.E. (Eds.) (1986). Handbook of Psychotherapy and Behavior
Change (3rd ed.). New York: John Wiley & Sons.
Gaudry, E., Spielberger, C.D., & Vagg, P.R. (1975). Validation of the state-trait distinction
in anxiety research. Multivariate Behavior Research, 10, 331-341.
Gentry, W.D. (1972). Biracial aggression: 1. Effect of verbal attack and sex of victim.
The Journal of Social Psychology, 88, 75-82.
Gentry, W.D., Chesney, A.P., Gary, H.G., Hall, R.P., & Harburg, E. (1982). Habitual
anger-coping styles: I. Effect on mean blood pressure and risk for essential
hypertension. Psychosomatic Medicine, 44, 195-202.
Gentry, W.D., Chesney, A.P., Hall, R.P., & Harburg, E. (1981). Effect of habitual anger-
coping pattern on blood pressure in black/white, high/low stress area respondents.
Psychosomatic Medicine, 43, 88.

66
Guyton, A.C. (1977). Basic Human Physiology: Normal Function and Mechanism of
Disease. Philadelphia: W.B. Saunders.
Hamilton, M. (1959). The assessment of anxiety states by rating. British Journal of
Medical Psychology, 32, 50.
Harburg, E., Blakelock, E.H., & Roeper, P.J. (1979). Resentful and reflective coping with
arbitrary authority and blood pressure: Detroit. Psychosomatic Medicine, 3, 189-202.
Harburg, E., Erfurt, J.C., Hauenstein, L.S., Chape, C., Schull, W.J., & Schork, M.A. (1973).
Socio-ecological stress, suppressed hostility, skin color, and black-white male blood
pressure: Detroit. Psychosomatic Medicine, 35, 276-296.
Harburg, E., & Hauenstein, L. (1980). Parity and blood pressure among four race-stress
groups of females in Detroit. American Journal of Epidemiology, 111, 356-366.
Harburg, E., Schull, W.J., Erfurt, J.C., & Schork, M.A. (1970). A family set method for
estimating heredity and stress-I. Journal of Chronic Disease, 23, 69-81.
Hartfield, M.T. (1985). Appraisals of anger situations and subsequent coping responses in
hypertensive and normotensive adults: A comparison. (Doctoral dissertation,
University of California, 1985). Dissertation Abstracts International, 46, 4452B.
Hazaleus, S.L., & Deffenbacher, J.L. (1986). Relaxation and cognitive treatments of anger.
Journal of Consulting and Clinical Psychology, 54, 222-226.
Hodges, W.F. (1976). The psychophysiology of anxiety. In M. Zuckerman & C.D.
Spielberger (Eds.), Emotions and anxiety: New concepts, methods, and applications
(pp. 175-194). Hillsdale, NJ: Lawrence Erlbaum Associates.
Hodges, W.F., & Spielberger, C.D. (1966). The effects of threat of shock on heart rate for
subjects who differ in manifest anxiety and fear of shock. Psychophysiology, 2, 287-294.

67
Hogg, J.A., & Deffenbacher, J.L. (1986). Irrational beliefs, depression and anger in college
students. Journal of College Student Personnel, 27, 349-353.
Jacobs, G.A., Latham, L.E., & Brown, M.S. (1988). Test-retest reliability of the State-Trait
Personality Inventory and the Anger Expression Scale. Anxiety Research, 1, 263-265.
Janisse, M.P., Edguer, N., & Dyck, D.G. (1986). Type A behavior, anger expression, and
reactions to anger imagery. Motivation and Emotion, 10, 371-385.
Johnson, E.H. (1984). Anger and anxiety as determinants of elevated blood pressure in
adolescents. Unpublished doctoral dissertation, University of South Florida, Tampa.
Kobak, K., Dottl, S., Serlin, R. (1997). Journal of the American Medical Association, 278,
11, 905-910.
Knight, R.G., Chisholm, B.J., Paulin, J.M., & Waal-Manning, H.J. (1988). The Spielberger
Anger Expression Scale: Some psychometric data. Journal of Clinical Psychology, 27,
279-281.
Lader, M. (1975). Psychophysiological parameters and methods. In L. Levi (Ed.),
Emotions: Their parameters and measurement (pp. 341-367). New York: Raven Press.
Lazarus, R.S., & Folkman, S. (1984). Stress, appraisal, and coping. New York: Springer
Publishing Co.
Lazarus, R.S., Deese, J., & Osler, S.F. (1952). The effects of psychological stress upon
performance. Psychological Bulletin, 49, 293-317.
Lazarus, R.S., & Opton, E.M., Jr. (1966). The study of psychological stress. In C.D.
Spielberger (Ed.), Anxiety and behavior (pp. 225-262). New York: Academic Press.
Levitt, E.E. (1980). The psychology of anxiety (2nd ed.). Hillsdale, NJ: Lawrence
Erlbaum Associates.

68
Martin, I. (1973). Somatic reactivity: Methodology. In H.J. Eysenck (Ed.), Handbook of
abnormal psychology (2nd ed., pp. 417-456). San Diego: Knapp.
McReynolds, P. (1968). The assessment of anxiety: A survey of available techniques. In P.
McReynolds (Ed.), Advances in psychological assessment (Vol. 1, pp. 244-264). Palo
Alto: Science and Behavior Books.
Moras, K., Telfer, L.A., & Barlow, D.H. (1993). Efficacy and specific effects data on new
treatments: A case study strategy with mixed anxiety-depression. Journal of Consulting
and Clinical Psychology, 61, 412-420.
Moses, J.A. (1992). State-Trait Anger Expression Inventory, research edition. In D.J.
Keyser & R.C. Sweetland (Eds.), Test critiques (Vol. IX, pp. 510-525). Austin, TX:
PRO-ED, Inc.
Novaco, R.W. (1975). Anger control: The development and evaluation of an experimental
treatment. Lexington, MA: Lexington Books/D.C. Heath.
Novaco, R.W. (1979). The cognitive regulation of anger and stress. In P.C. Kendall & S.D.
Hollon (Eds.), Cognitive behavioral interventions, theory, research, and procedures (pp.
241-285). New York: Academic Press.
Ogles, B.M., Lambert, M.J., Masters, K.S. (1996). Assessing outcome in clinical practice.
Boston, MA. Allyn & Bacon, Inc.
Plutchik, R. (1962). The emotions. New York: Random House.
Pollans, C.H. (1983). The psychometric properties and factor structure of the Anger
EXpression (AX) Scale. Unpublished master's thesis, University of South Florida,
Tampa.

69
Reheiser, E.C. (1991). The interactions of state anxiety and trait anxiety: As evoked by
stressful episodic imagery. Unpublished Honors Thesis, University of South Florida,
Tampa.
Rosenzweig, S. (1976). Aggressive behavior and the Rosenzweig picture frustration study.
Journal of Clinical Psychology, 32, 885-891.
Rosenzweig, S. (1978). The Rosenzweig Picture-Frustration (P-F) Study basic manual and
adult form supplement. St. Louis: Rana.
Roth, M.S., & Mountjoy, C.Q. (1982). The distinction between anxiety states and
depressive disorders. In E.S. Paykel (Ed.), Handbook of affective disorders.
Edinburgh: Churchill Livingstone.
Russon, R. K. (1996). Stress and manifestations of anxiety in a sleep deprived graduate
student: a case study. Unpublished cognitions presented at 4:00AM.
Schultz, S.D. (1954). A differentiation of several forms of hostility by scales empirically
constructed from significant items on the MMPI. Dissertation Abstracts, 17, 717-720.
Schuyler, D., & Katz, M.M. (1973). The depressive illnesses: A major public health
problem. Washington, DC: U.S. Government Printing Office.
Secunda, S.K., Katz, M.M., Friedman, R.J., & Schuyler, D. (1973). Special report: 1973 -
The depressive disorders. Washington, DC: U.S. Government Printing Office.
Sharkin, B.S. (1988). Treatment of client anger in counseling. Journal of Counseling and
Development, 66, 361-365.
Siegel, S. (1956). The relationship of hostility to authoritarianism. Journal of Abnormal
and Social Psychology, 52, 368-373.

70
Spielberger, C.D. (1966). Theory and research on anxiety. In C.D. Spielberger (Ed.),
Anxiety and behavior (pp. 3-20). New York: Academic Press.
Spielberger, C.D. (1972). Anxiety as an emotional state. In C.D. Spielberger (Ed.),
Anxiety: Current trends in theory and research (Vol. 1, pp. 24-49). New York:
Academic Press.
Spielberger, C.D. (1973). Manual for the State-Trait Anxiety Inventory for Children. Palo
Alto: Consulting Psychologists Press.
Spielberger, C.D. (1976). Stress and anxiety and cardiovascular disease. Journal of the
South Carolina Medical Association (Suppl. 15), 72, 15-22.
Spielberger, C.D. (1977). Anxiety: Theory and research. In B.B. Wolman (Ed.),
International Encyclopedia of Neurology, Psychiatry, Psychoanalysis, and Psychology.
New York: Human Sciences Press.
Spielberger, C.D. (1979). Understanding stress and anxiety. London: Harper and Row.
Spielberger, C.D. (1980). Preliminary manual for the State-Trait Anger Scale (STAS).
Tampa, FL: University of South Florida, Human Resources Institute.
Spielberger, C.D. (1983). Manual for the State-Trait Anxiety Inventory: STAI(Form Y).
Palo Alto: Consulting Psychologists Press.
Spielberger, C.D., (1988). Manual for the State-Trait Anger Expression Inventory (STAXI).
Odessa, FL: Psychological Assessment Resources, Inc. (PAR).
Spielberger, C.D. (1989). State-Trait Anxiety Inventory: A comprehensive bibliography
(2nd ed.). Palo Alto: Consulting Psychologists Press.
Spielberger, C.D., & Gorsuch, R.L. (1966). The development of the State-Trait Anxiety
Inventory. In C.D. Spielberger & R.L. Gorsuch, Mediating processes in verbal

71
conditioning. Final report to the National Institutes of Health, U.S. Public Health
Service on Grants MH-7229, MH-7446, and HD-947.
Spielberger, C.D., Gorsuch, R.L., & Lushene, R.D. (1970). STAI: Manual for the State-
Trait Anxiety Inventory. Palo Alto: Consulting Psychologists Press.
Spielberger, C.D., Jacobs, G., Russell, S., & Crane, R. (1983). Assessment of anger: The
State-Trait Anger Scale. In J.N. Butcher & C.D. Spielberger (Eds.), Advances in
personality assessment (Vol. 2, pp. 159-187). Hillsdale, NJ: Lawrence Erlbaum
Associates.
Spielberger, C.D., Johnson, E.H., Russell, S.F., Crane, R.J., Jacobs, G.A., & Worden, T.J.
(1985). The experience and expression of anger: Construction and validation of an
anger expression scale. In M.A. Chesney & R.H. Rosenman (Eds.), Anger and hostility
in cardiovascular and behavioral disorders (pp. 5-30). New York:
Hemisphere/McGraw-Hill.
Spielberger, C.D., Krasner, S.S., & Solomon, E.P. (1988). The experience, expression and
control of anger. In M.P. Janisse (Ed.), Health psychology: Individual differences and
stress (pp. 89-108). New York: Springer/Verlag Publishers.
Story, D., & Deffenbacher, J.L. (1985, April). General anger and personality. Paper
presented at Rocky Mountain Psychological Association, Tucson, AZ.
Suinn, R.M., & Deffenbacher, J.C. (1988). Anxiety management training. The Counseling
Psychologist, 16, 31-49.
Tavris, C. (1982). Anger, the misunderstood emotion. New York: Simon & Schuster.
Taylor, J.A. (1953). A personality scale of manifest anxiety. Journal of Abnormal Social
Psychology, 48, 285.

72
Titchener, E.B. (1897). An outline of psychology. New York: MacMillan.
Turner, C. F., Ku, L., Rogers, S. M., Lindberg, L. D., Pleck, J. H., & Sonenstein, F. L.
(1998). Adolescent sexual behavior, drug use and violence: increased reporting with
computer survey technology. Science, 280, 867–873.
Weber, B., Schneider, B., Fritze, J., Gille, B., Hornung, S., Kühner, T., Maurer, K. (2003).
Acceptance of computerized compared to paper-and-pencil assessment in psychiatric
inpatients. Computers in Human Behavior 19, 81–93.
Williams, R.B., Haney, T.L., Lee, K.L., Kong, Y., Blumenthal, J., & Whalen, R.E. (1980).
Type A behavior, hostility, and coronary atherosclerosis. Psychosomatic Medicine, 42,
539-549.
Wundt, W. (1896). Outlines of Psychology. New York: Dustav E. Stechert.
Young, P.T. (1943). Emotion in man and animal. New York: Wiley.
Zelin, M.L., Adler, G., & Myerson, P.G. (1972). Anger self-report: An objective
questionnaire for the measurement of aggression. Journal of Consulting and Clinical
Psychology, 39, 340.
Zuckerman, M. (1960). Development of an Affect Adjective Check List for the
measurement of anxiety. Journal of Consulting Psychology, 26, 291.
Zuckerman, M., & Lubin, B. (1965). Manual for the Multiple Affect Adjective Checklist.
San Diego: Educational and Industrial Testing Service.

73
APPENDICES

74
Appendix A: Client Materials
1- Screen shots of computerized State Trait Personality Inventory (STPI-Cp)
2- Client Exit Questionnaire (CEQ)
3- STPI-Cp Output

75
STPI-CP: Main Menu (Screen Shot)
STPI-CP: State Instructions and Response screen (Screen Shot)
Appendix A: (Continued)

76
Appendix A: (Continued)
Initials: ________ Date: __________________
Dear Client: Thanks again for your help with this study. Please respond to this 2-item questionnaire. Remember, your responses to this questionnaire are strictly confidential and are used only for the purposed of this study. Please rate the Self-Analysis Questionnaire on the following characteristics. WAS THE SELF-ANALYSIS-QUESTIONNAIRE EASY TO UNDERSTAND? Did you find the Questionnaire instructions easy to understand? Did you feel, after reading the instructions, you knew how to respond to the Questionnaire?
Easy to Understand?: 1 2 3 4 5 6 7 8 9 not at all somewhat moderately extremely WAS IT EASY TO COMPLETE THE QUESTIONNAIRE? Did you have any difficulty completing the questionnaire? Was the task of responding to the items straightforward and easily accomplished?
Easy to Use?: 1 2 3 4 5 6 7 8 9 not at all somewhat moderately extremely HOW FAMILIAR ARE YOU WITH USING COMPUTERS? How much experience do you have using some type of computer?
Computer Familiarity: 1 2 3 4 5 6 7 8 9 not at all somewhat moderately extremely

77
Appendix A: (Continued)
STPI-CP: Sample Output

78
Appendix B: Therapist Materials
1- Therapists Rating of Clients Emotional States and Traits
2- Therapist Exit Questionnaire

79
Appendix B: (Continued)
Dear Therapist: On the next page please rate your client on the following characteristics.
STATE ANXIETY: An emotional state or condition that consists of feelings of tension, apprehension, and worry, and associated activation (arousal) of the autonomic nervous system as reflected in increased heart rate and trembling.
TRAIT ANXIETY: Individual differences in the frequency that state anxiety is experienced over time.
STATE DEPRESSION: An emotional state or condition characterized by feeling sad, gloomy, down, etc. and the absence of happy feelings.
TRAIT DEPRESSION: Individual differences in the frequency that state depression is experienced over time.
STATE CURIOSITY: An emotional state or condition of stimulus seeking and general intellectual interest in exploring one’s environment.
TRAIT CURIOSITY: Individual differences in the frequency that state curiosity is experienced over time.
STATE ANGER: An emotional state or condition that consists of subjective feelings of tension, annoyance, irritation, fury and rage, with concomitant activation or arousal of the autonomic nervous system.
TRAIT ANGER: Individual differences in the frequency that state anger is experienced over time.

80
Appendix B: (Continued)
Client Initials________ Client ID#________ Date________
Please rate your client’s mood during the first 10 minutes of your current session.
Anxious: 1 2 3 4 5 6 7 8 9
Not at all somewhat moderately very much
Angry: 1 2 3 4 5 6 7 8 9
Not at all somewhat moderately very much
Depressed: 1 2 3 4 5 6 7 8 9
Not at all somewhat moderately very much
Curious: 1 2 3 4 5 6 7 8 9
Not at all somewhat moderately very much
Now please rate your client’s general mood.
Anxiety: 1 2 3 4 5 6 7 8 9
Almost never sometimes often almost always Depression: 1 2 3 4 5 6 7 8 9
Almost never sometimes often almost always
Anger: 1 2 3 4 5 6 7 8 9
Almost never sometimes often almost always
Curiosity: 1 2 3 4 5 6 7 8 9
Almost never sometimes often almost always

81
Appendix B: (Continued)
Client Initials:______ Client ID#:_______ Date:_________
Dear Therapist: Thanks again for your help and your client’s help with this study. As a final procedure, please examine the attached assessment report and then respond to this 4-item questionnaire. Please return this completed questionnaire (this sheet only) to the experimenter. You may keep the assessment report to discuss with your client if you would find it useful to do so. Please rate the feedback from the Assessment report on the following characteristics. AGREEMENT WITH ASSESSMENT: How close was the information provided by the assessment report to your perception of the client’s emotional state at the beginning of the therapy session?
Agreement with Assessment: 1 2 3 4 5 6 7 8 9 not at all somewhat moderately extremely
OTHER ASSESSMENTS: When were the PAI and BDI administered to your client? PAI Administered: Never 1-2 weeks 3-4 weeks more than BDI Administered: ago ago 4 weeks ago
USEFULNESS OF ASSESSMENT: If the information generated by the assessment report was available at the beginning of each therapy session, how clinically useful would this be?
Usefulness of Assessment: 1 2 3 4 5 6 7 8 9 not at all somewhat moderately extremely
CLIENT REACTION: Based on your observations, how did your client react to the assessment procedure?
Client Reaction: 1 2 3 4 5 6 7 8 9 unfavorable couldn’t tell favorable
NUMBER OF SESSIONS: Approximately how many sessions have you seen this client? Number of Sessions: 3 4-5 6-7 8-9 10-12 13-17 18-25 26-35 36+
X Note: Please return this sheet to the experimenter when complete