computers & education - yonsei...
TRANSCRIPT
Computers & Education 53 (2009) 142–154
Contents lists available at ScienceDirect
Computers & Education
journal homepage: www.elsevier .com/ locate/compedu
Comparison of intelligent systems in detecting a child’s mathematical gift
Margita Pavlekovic a, Marijana Zekic-Susac b,*, Ivana Djurdjevic a
a Faculty of Teacher Education, University of Josip Juraj Strossmayer in Osijek, L. Jagera 9, 31000 Osijek, Croatiab Faculty of Economics, University of Josip Juraj Strossmayer in Osijek, Gajev trg 7, 31000 Osijek, Croatia
a r t i c l e i n f o
Article history:Received 24 February 2008Received in revised form 7 January 2009Accepted 12 January 2009
Keywords:Elementary educationEvaluation methodologiesMathematical giftExpert systemNeural networks
0360-1315/$ - see front matter � 2009 Elsevier Ltd. Adoi:10.1016/j.compedu.2009.01.007
* Corresponding author. Tel.: +385 31224400; fax:E-mail addresses: [email protected] (M. Pavlekov
a b s t r a c t
This paper compares the efficiency of two intelligent methods: expert systems and neural networks, indetecting children’s mathematical gift at the fourth grade of elementary school. The input space forthe expert system and the neural network model consisted of 60 variables describing five basic compo-nents of a child’s mathematical gift identified in previous research. The expert system estimated a child’sgift based on heuristically defined logic rules, while the scientifically confirmed psychological evaluationof gift based on Raven’s standard progressive matrices was used at the output of neural network models.Three neural network algorithms were tested on a Croatian dataset. The results show that both the expertsystem and the neural network recognize more pupils as mathematically gifted than teachers do. Theexpert system produces the highest average hit rate, although the highest accuracy in classifying giftedchildren is obtained by the radial basis neural network algorithm, which also yields lower type II error.Due to the ability of expert systems to explain the result, it can be suggested that both the expert systemand the neural network model have potential to serve as effective intelligent decision support tools indetecting mathematical gift in early stage, therefore enabling its further development.
� 2009 Elsevier Ltd. All rights reserved.
1. Introduction
Precocious mathematical ability of children in elementary schools is usually detected using scientifically approved standard Raven pro-gressive matrices in the process of pychological evaluation of a child. When investigating the brain activity of high-level mathematicalthinking and reasoning, O’Boyle et al. (2005) used psychometrical identification of math-gifted male adolescents by SAT-Math and SAT-Verbal tests, as well as Raven standard progressive matrices. In schools where psychologists are not available, teachers usually use math-ematical competencies as the only criterion for determining a child’s gift. However, it is also important to include other components whiledeciding about giftedness in mathematics, as emphasized by Johnson (2000), whose research also highlights the need for accurate detec-tion and further development of mathematical gift.
The paper compares the efficiency of the expert system (ES) called MathGift suggested by Pavlekovic, Zekic-Susac, and Djurdjevic (2007)and the neural network (NN) model for detecting a child’s mathematical gift in the fourth grade of elementary school. Besides mathemat-ical competencies, both systems include cognitive components of gift, personal components that contribute the gift development, strate-gies of learning and exercising, as well as some environmental factors. The initial survey (Pavlekovic et al., 2007) showed that MathGift ESdetected more children as gifted than teachers did in their estimates. The ES and teachers’ estimations were compared to psychologicalfindings (obtained by Raven’s standard matrices). Since the statistical tests showed the expert system estimations are more similar to psy-chologists’ estimations, it was challenging to test another intelligent method that has abilities of prediction, classification, and associationof robust data. Therefore, three NN algorithms were tested in order to classify children in one of the two gift categories. The model is aimedto learn psychological findings, and to use the incorporated knowledge with children in schools where psychologist’s estimations are notavailable.
A survey was conducted at ten Croatian elementary schools where the psychologists’, teachers’, and the expert system estimates wereobtained for each child in the sample. The results of the expert system and the best NN model were compared. Besides finding the mostaccurate model, this paper discusses some differences among the estimations of children’s mathematical gift obtained by teachers, psy-chologists, the expert system and the NN model. The advantages and limitations of both approaches are also discussed.
ll rights reserved.
+385 31211604.ic), [email protected] (M. Zekic-Susac), [email protected] (I. Djurdjevic).
M. Pavlekovic et al. / Computers & Education 53 (2009) 142–154 143
In previous research (Pavlekovic et al., 2007) teachers, the expert system, and psychologists classified each pupil into one of the fourcategories: (1) presumably gifted child in mathematics, (2) child with a special interest in mathematics, (3) child with average mathemat-ical competencies, and (4) child with insufficiently developed mathematical competencies. In order to furtherly investigate possibleimprovement of gift estimation by using neural network methodology, the output of the model was binary defined such that the firsttwo categories were considered as (1) – gifted children, while the last two categories were considered as (0) – non-gifted children. Anempirical research is conducted at the end of 2006, including 106 pupils of age 10 (fourth grade) in different elementary schools in Osijek.The estimations were compared using statistical tests.
The structure of this paper is the following: Section 2 contains a review of previous research in the area, followed by the description ofartificial intelligence (AI) methodology used to develop the expert system and NNs. Then the model variables used to determine the po-tential gift in mathematics by the expert system and NNs are explained. The data about examinees are described in a separate section. Afterthe results, the conclusion and guidelines for future research are given.
2. Description of previous research
Research in the area of intelligent systems in education were mostly focused on developing tutoring systems aimed to support learn-ing and teaching a specific topic, with the ability of including multimedia and customized approach. Stathacopoulou, Magoulas, Grigo-riadou, and Samarakou (2005) propose to use the methodology of NNs and fuzzy logic for advanced student diagnosis process in anintelligent learning system. Their model enables a system to ‘‘imitate” teacher in diagnosing student characteristics, and in selectingthe learning style that suits those characteristics. The system is tested in learning vector construction in physics and mathematics. Re-sults obtained by the system are compared to the recommendations of a group of experienced teachers, showing that the system is ableto manage the diagnostic process, especially for marginal cases, where it was difficult even for teacher to bring accurate evaluation ofstudent. Canales, Pena, Peredo, Sossa, and Gutierrez (2007) developed an adaptive and intelligent web-based education system (WBES),which takes into account individual student learning requirements and enables the usage of different techniques, learning styles, learn-ing strategies, and ways of interaction. Zeleznikov and Nolan (2001) created a decision support system based on fuzzy logic and pred-icated rules to assist teachers in grading essays. Saito, Imansyah, Kubok, and Hendayana (2007) investigate the influence ofcollaboration among schools and universities to the school teachers and university faculty members. Their results show the following:(1) joint lesson planning, observation and reflection contribute the improvement of teaching methodologies, (2) faculty members andteachers observe that students included in collaboration are more participative, (3) the linkage between students and materials, as wellas among students is necessary, and (4) collaboration resulted in the development of collegiality within schools and among facultymembers and teachers.
Intelligent systems for detecting children’s gift in particular areas such as mathematics are still not investigated enough. Gorr, Nagin,and Szczypula (1994) tried to predict student grade point averages (GPAs) by using linear regression, stepwise polynomial regression,and NNs, then compared the predictions with an index used by an admissions committee for predicting student GPAs in professionalschool. Their results show that none of the tested methods was significantly better than the practitioners’ index. Hardgrave, Wilson,and Walstrom (1994) investigated NNs in predicting students success in graduate program. They showed that non-parametric proceduressuch as neural networks perform at least as well as traditional methods and are worthy of further investigation.
Various approaches to mathematical giftedness are present in literature. Some of them are oriented to genetic factors (Terman & Oden,1959), others to cognitive models (Sterberg, 2001), achievement (Renzuli, 1986), and there is a system approach (Tannenbaum, 1983). Thelack of psychologists in some countries makes the process of detecting gifted children even more difficult. For example, only 140 psychol-ogists are employed in 931 elementary schools in Croatia (Vlahovic-Stetic, 2006). In such situations, teachers usually rely on mathematicaltests and their subjective judgments in detecting mathematically gifted children. Due to that fact, an effective decision support tool thatwill be able to assist teachers will valuably improve the process of identifying children with potential mathematical gift which is some-times hidden and cannot be observed by mathematical tests only.
It can be concluded from the above that there is a great expansion of artificial intelligence methodology usage in education tutoringtools in the last decade. However, the area of determining the giftedness in mathematics should be more investigated in order to provideteacher with an efficient decision support.
3. Problem definition
For the purpose of research it was necessary to define the categories of gift in which the systems will classify children. Based on scien-tific literature (Renzuli, 1986; Sterberg, 2001; Vlahovic-Stetic, 2006) and heuristical knowledge (Pavlekovic et al., 2007), the following fourcategories were detected in our initial survey:
(A) Potentially gifted child in mathematics – the pupil is motivated and supported by external factors, according to its achievements inknowledge, skills, and application of mathematics on the level that overcomes expectations of mathematics curriculum for thatage. With the appropriate teaching strategies teacher and mentor enhance and guide the development of pupils’ competenciestowards the realization of their gift. The pupil learns actively, controls its progress and prepares for public assessment of its knowl-edge and skills, i.e., competition in mathematics.
(B) Child with a special interest in mathematics – the pupil’s knowledge, skills and mathematical application is on the level or somewhatabove the level of expectations of mathematics curriculum for that age. However, a pupil belonging to this category expresses anextra interest towards mathematics and is also supported by the environment, although she/he is not willing to expose its knowl-edge and skills to public assessment at competitions in mathematics.
(C) Child with average mathematical competencies – the pupil shows no interest for additional practice in mathematics, but her/hisachievements are on the level of expectations of mathematics curriculum for that age. Appropriate learning methods are used tosystematically enhance the development of pupil’s mathematical competencies.
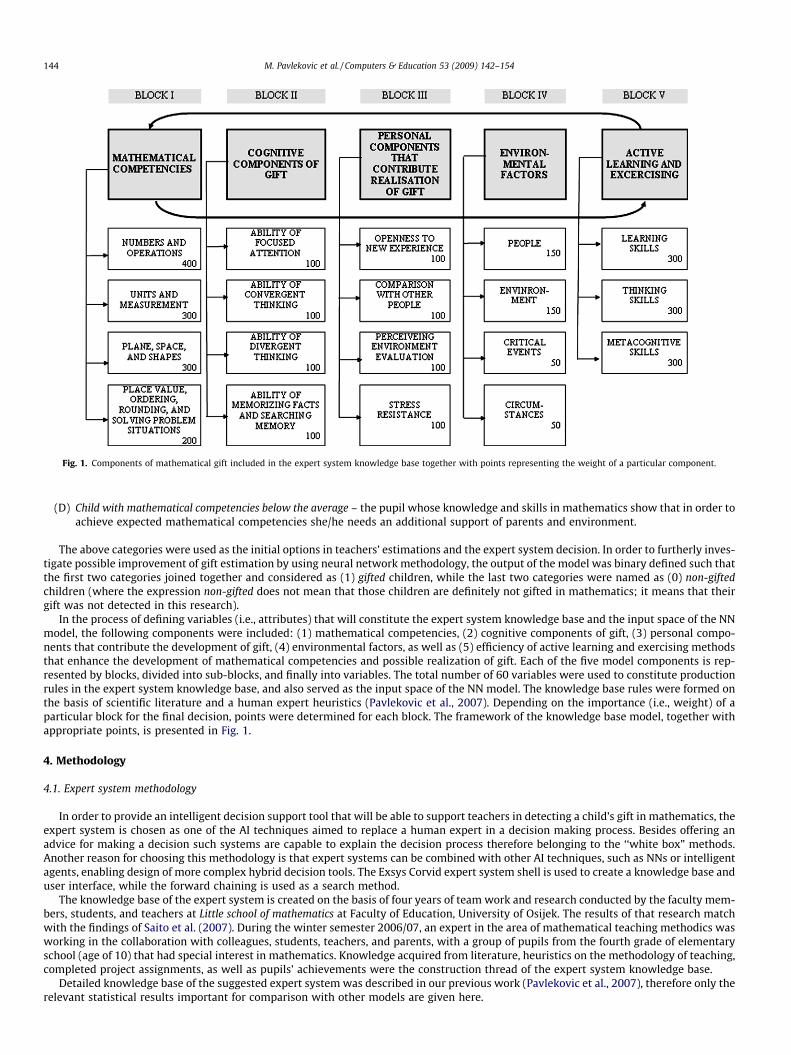
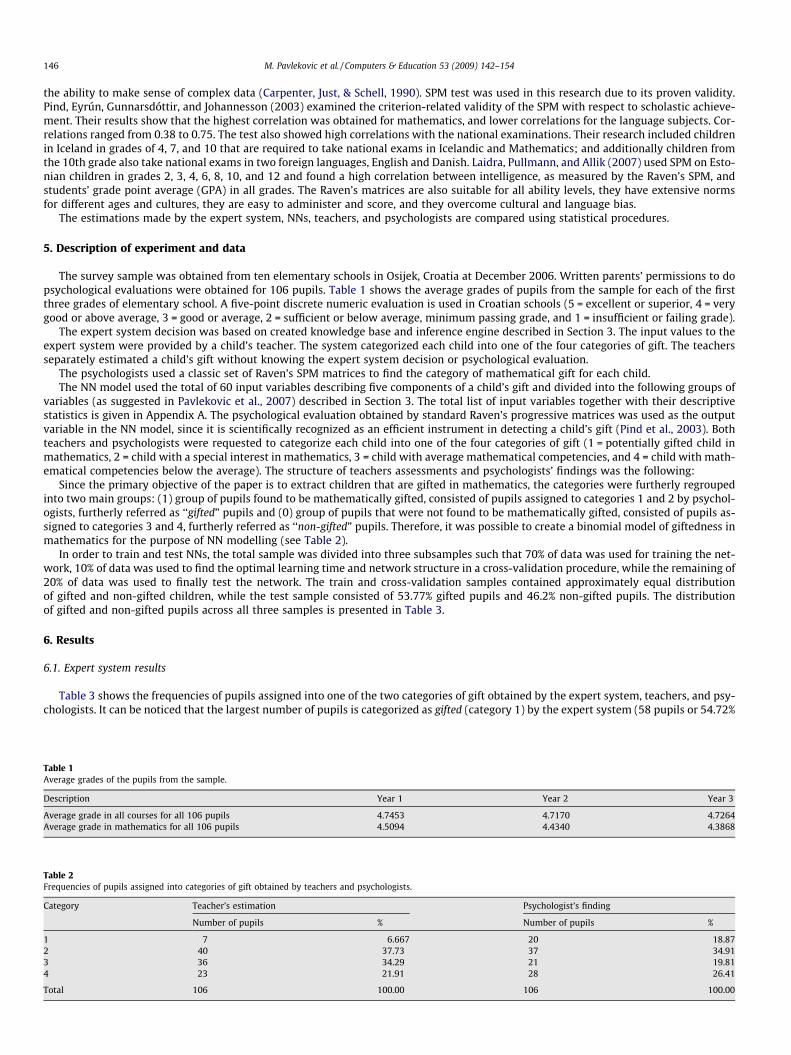
Fig. 1. Components of mathematical gift included in the expert system knowledge base together with points representing the weight of a particular component.
144 M. Pavlekovic et al. / Computers & Education 53 (2009) 142–154
(D) Child with mathematical competencies below the average – the pupil whose knowledge and skills in mathematics show that in order toachieve expected mathematical competencies she/he needs an additional support of parents and environment.
The above categories were used as the initial options in teachers’ estimations and the expert system decision. In order to furtherly inves-tigate possible improvement of gift estimation by using neural network methodology, the output of the model was binary defined such thatthe first two categories joined together and considered as (1) gifted children, while the last two categories were named as (0) non-giftedchildren (where the expression non-gifted does not mean that those children are definitely not gifted in mathematics; it means that theirgift was not detected in this research).
In the process of defining variables (i.e., attributes) that will constitute the expert system knowledge base and the input space of the NNmodel, the following components were included: (1) mathematical competencies, (2) cognitive components of gift, (3) personal compo-nents that contribute the development of gift, (4) environmental factors, as well as (5) efficiency of active learning and exercising methodsthat enhance the development of mathematical competencies and possible realization of gift. Each of the five model components is rep-resented by blocks, divided into sub-blocks, and finally into variables. The total number of 60 variables were used to constitute productionrules in the expert system knowledge base, and also served as the input space of the NN model. The knowledge base rules were formed onthe basis of scientific literature and a human expert heuristics (Pavlekovic et al., 2007). Depending on the importance (i.e., weight) of aparticular block for the final decision, points were determined for each block. The framework of the knowledge base model, together withappropriate points, is presented in Fig. 1.
4. Methodology
4.1. Expert system methodology
In order to provide an intelligent decision support tool that will be able to support teachers in detecting a child’s gift in mathematics, theexpert system is chosen as one of the AI techniques aimed to replace a human expert in a decision making process. Besides offering anadvice for making a decision such systems are capable to explain the decision process therefore belonging to the ‘‘white box” methods.Another reason for choosing this methodology is that expert systems can be combined with other AI techniques, such as NNs or intelligentagents, enabling design of more complex hybrid decision tools. The Exsys Corvid expert system shell is used to create a knowledge base anduser interface, while the forward chaining is used as a search method.
The knowledge base of the expert system is created on the basis of four years of team work and research conducted by the faculty mem-bers, students, and teachers at Little school of mathematics at Faculty of Education, University of Osijek. The results of that research matchwith the findings of Saito et al. (2007). During the winter semester 2006/07, an expert in the area of mathematical teaching methodics wasworking in the collaboration with colleagues, students, teachers, and parents, with a group of pupils from the fourth grade of elementaryschool (age of 10) that had special interest in mathematics. Knowledge acquired from literature, heuristics on the methodology of teaching,completed project assignments, as well as pupils’ achievements were the construction thread of the expert system knowledge base.
Detailed knowledge base of the suggested expert system was described in our previous work (Pavlekovic et al., 2007), therefore only therelevant statistical results important for comparison with other models are given here.
M. Pavlekovic et al. / Computers & Education 53 (2009) 142–154 145
On the basis of variables mentioned above, logic blocks are created in the form of if-then production rules, whose logical values (true orfalse) imply appropriate evaluation of options of the expert system decision. The total knowledge base of the expert systems consists of 250production rules grouped into five main blocks presented in Fig. 1. The Exsys Corvid knowledge automation system shell was used to createthe model. The process of evaluating options is defined on the basis of heuristics. The method used for searching production rules is theforward chaining, meaning that the search starts from the attribute values at marginal nodes and moves up accumulating points towardsthe final goal – to make a decision about the category in which the system places a child according to her/his gift in mathematics.
After testing its formal and logical accuracy, the expert system is used to detect children’s gift in mathematics in a survey conducted in10 elementary schools in Osijek. On the basis of the conducted survey, a descriptive statistics of the assessments is computed, the corre-lation coefficients are analyzed, and statistical t-test for dependent samples is used to compare the difference in assessments of the expertsystem, teachers, and psychologists.
4.2. NN methodology
According to Detienne, Detienne, and Joshi (2003), artificial NNs are rapidly gaining popularity in the hard sciences and in social science.Some of the reasons are in their numeorus advantages, such as the fact that they do not need the a priori knowledge required by expertsystems and regression. Other NN advantages such as nonlinearity, adaptivness, and high degree of robustness contribute its successful-ness at analyzing problems that are solved by generating predictions and classifications of complicated phenomena rather than by gener-ating explanations (Detienne et al., 2003). Previous research showed that NNs as a non-parametric method have the ability to perform atleast as well as statistical methods in predicting student success (Hardgrave et al., 1994). However, the lack of standardized paradigms thatcan determine the efficiency of certain NN algorithms and architectures in particular problem domains is emphasized by many authors (Li,1994; Russell & Norvig, 2002). Testing only one NN algorithm could mislead the evaluation of NN efficiency, therefore we compare theperformance of three NN algorithms: multi-layer perceptron, radial basis function, and probabilistic network.
MLP is a general purpose feedforward network, and one of the most frequently used NN algorithms. In order to optimize the error func-tion it uses the classical backpropagation algorithm based on deterministic gradient descent algorithm originally developed by Paul Wer-bos in 1974, extended by Rumelhart, Hinton and Williams in Masters (1995). Since the main disadvantage of the backpropagationalgorithm is the danger of local minima, the conjugate gradient algorithm is also tested in order to overcome this limitation. The conceptof this algorithm is in minimizing the error in a direction that is conjugate to the previous directions, while the detailed computation isgiven in Masters (1995). Conjugate gradient is combined with the classical backpropagation such that backpropagation is used in first100 epochs, while the conjugate gradient is used in the next 500 epochs. The standard delta rule was used for learning, while the learningrates and the momentum were dynamically optimized during the learning process (learning rate ranged from 0.08 to 0.01, while themomentum ranged from 0.8 to 0.1). Overtraining is avoided by a cross-validation process which alternatively trains and tests the network(using a separate test sample) until the performance of the network on the test sample does not improve for n number of attempts (n = 10).The maximum number of epochs in our experiments was set to 1000. After the best network is selected, it is tested on a new validationsample to determine its generalization ability.
RBFN is based on a clustering procedure for computing distances among each input vector and a center, represented by the radial unit.Its advantages over multi-layer perceptron algorithms are that it does not suffer from the local minima problem, it is able to model anynonlinear function using a single hidden layer, and is characterized by fast training and reasonably compact networks. Since it uses a radi-ally symmetric and radially bounded transfer functions in its hidden layer, it is a general form of probabilistic and general regression net-works. The ability of RBFN with one hidden layer to approximate any nonlinear function is proved by Park and Sandberg in Karayiannis andWeigun (1997). Michelli (in Karayiannis and Weigun (1997)) showed how this network can produce an interpolating surface which passesthrough all the pairs of the training set. RBFN algorithm uses Euclidean distance and Gaussian transfer function in the hidden layer whichmaps the output of the distance function according to:
f ðxÞ ¼ uðkx� ckÞ ¼ e
I2k
r2k
� �ð1Þ
where x is an input vector, c is the center determined by a clustering algorithm, and parameter r is determined by the nearest neighbor tech-nique. Learning through the architecture can be described in the following steps: (1) clustering phase is present from the input to the hiddenlayer, where the incoming weights to the prototype layer learn to become the centers of clusters of input vectors using a dynamic k-meansalgorithm, (2) in the hidden layer the radii of the Gaussian functions at the cluster centers are computed using a two-nearest neighbor tech-nique, where the radius of a given Gaussian is set to the average distance to the two-nearest cluster centers, and finally (3) the error is com-puted at the output layer. RBFN algorithm also suffers from some disadvantages, such as that the number of radial units must be decided inadvance, and their centers and deviations must be set.
In order to overcome those limitations, a pruning procedure for gradually decreasing the number of hidden units is used in our exper-iments. The initial number of hidden units is set to the size of the training sample. Since RBFN is primarily designed for the prediction typeof problems, a softmax activation function was added in its output layer in order to obtain probabilities in the output classes. Overtrainingwas avoided by a cross-validation process which alternatively trains and tests the network (using a separate test sample) until the perfor-mance of the network on the test sample does not improve for n number of iterations. After the best network is selected, it was tested on anew validation sample to determine its generalization ability.
The output layer consisted of one neuron in all NN models (valued as 1 for gifted pupils and 0 for pupils that were not found gifted inmathematics. Sensitivity analysis is performed on the test sample in order to determine the significance of input variables to the model.
4.3. Standard progressive Raven’s matrices
The psychologists used a classic set of Raven’s standard progressive matrices (SPM) to find the category of mathematical gift foreach child. It is a widely used, nonverbal test of analytic intelligence designed to assess a person’s intellectual and reasoning ability and
146 M. Pavlekovic et al. / Computers & Education 53 (2009) 142–154
the ability to make sense of complex data (Carpenter, Just, & Schell, 1990). SPM test was used in this research due to its proven validity.Pind, Eyrún, Gunnarsdóttir, and Johannesson (2003) examined the criterion-related validity of the SPM with respect to scholastic achieve-ment. Their results show that the highest correlation was obtained for mathematics, and lower correlations for the language subjects. Cor-relations ranged from 0.38 to 0.75. The test also showed high correlations with the national examinations. Their research included childrenin Iceland in grades of 4, 7, and 10 that are required to take national exams in Icelandic and Mathematics; and additionally children fromthe 10th grade also take national exams in two foreign languages, English and Danish. Laidra, Pullmann, and Allik (2007) used SPM on Esto-nian children in grades 2, 3, 4, 6, 8, 10, and 12 and found a high correlation between intelligence, as measured by the Raven’s SPM, andstudents’ grade point average (GPA) in all grades. The Raven’s matrices are also suitable for all ability levels, they have extensive normsfor different ages and cultures, they are easy to administer and score, and they overcome cultural and language bias.
The estimations made by the expert system, NNs, teachers, and psychologists are compared using statistical procedures.
5. Description of experiment and data
The survey sample was obtained from ten elementary schools in Osijek, Croatia at December 2006. Written parents’ permissions to dopsychological evaluations were obtained for 106 pupils. Table 1 shows the average grades of pupils from the sample for each of the firstthree grades of elementary school. A five-point discrete numeric evaluation is used in Croatian schools (5 = excellent or superior, 4 = verygood or above average, 3 = good or average, 2 = sufficient or below average, minimum passing grade, and 1 = insufficient or failing grade).
The expert system decision was based on created knowledge base and inference engine described in Section 3. The input values to theexpert system were provided by a child’s teacher. The system categorized each child into one of the four categories of gift. The teachersseparately estimated a child’s gift without knowing the expert system decision or psychological evaluation.
The psychologists used a classic set of Raven’s SPM matrices to find the category of mathematical gift for each child.The NN model used the total of 60 input variables describing five components of a child’s gift and divided into the following groups of
variables (as suggested in Pavlekovic et al., 2007) described in Section 3. The total list of input variables together with their descriptivestatistics is given in Appendix A. The psychological evaluation obtained by standard Raven’s progressive matrices was used as the outputvariable in the NN model, since it is scientifically recognized as an efficient instrument in detecting a child’s gift (Pind et al., 2003). Bothteachers and psychologists were requested to categorize each child into one of the four categories of gift (1 = potentially gifted child inmathematics, 2 = child with a special interest in mathematics, 3 = child with average mathematical competencies, and 4 = child with math-ematical competencies below the average). The structure of teachers assessments and psychologists’ findings was the following:
Since the primary objective of the paper is to extract children that are gifted in mathematics, the categories were furtherly regroupedinto two main groups: (1) group of pupils found to be mathematically gifted, consisted of pupils assigned to categories 1 and 2 by psychol-ogists, furtherly referred as ‘‘gifted” pupils and (0) group of pupils that were not found to be mathematically gifted, consisted of pupils as-signed to categories 3 and 4, furtherly referred as ‘‘non-gifted” pupils. Therefore, it was possible to create a binomial model of giftedness inmathematics for the purpose of NN modelling (see Table 2).
In order to train and test NNs, the total sample was divided into three subsamples such that 70% of data was used for training the net-work, 10% of data was used to find the optimal learning time and network structure in a cross-validation procedure, while the remaining of20% of data was used to finally test the network. The train and cross-validation samples contained approximately equal distributionof gifted and non-gifted children, while the test sample consisted of 53.77% gifted pupils and 46.2% non-gifted pupils. The distributionof gifted and non-gifted pupils across all three samples is presented in Table 3.
6. Results
6.1. Expert system results
Table 3 shows the frequencies of pupils assigned into one of the two categories of gift obtained by the expert system, teachers, and psy-chologists. It can be noticed that the largest number of pupils is categorized as gifted (category 1) by the expert system (58 pupils or 54.72%
Table 1Average grades of the pupils from the sample.
Description Year 1 Year 2 Year 3
Average grade in all courses for all 106 pupils 4.7453 4.7170 4.7264Average grade in mathematics for all 106 pupils 4.5094 4.4340 4.3868
Table 2Frequencies of pupils assigned into categories of gift obtained by teachers and psychologists.
Category Teacher’s estimation Psychologist’s finding
Number of pupils % Number of pupils %
1 7 6.667 20 18.872 40 37.73 37 34.913 36 34.29 21 19.814 23 21.91 28 26.41
Total 106 100.00 106 100.00
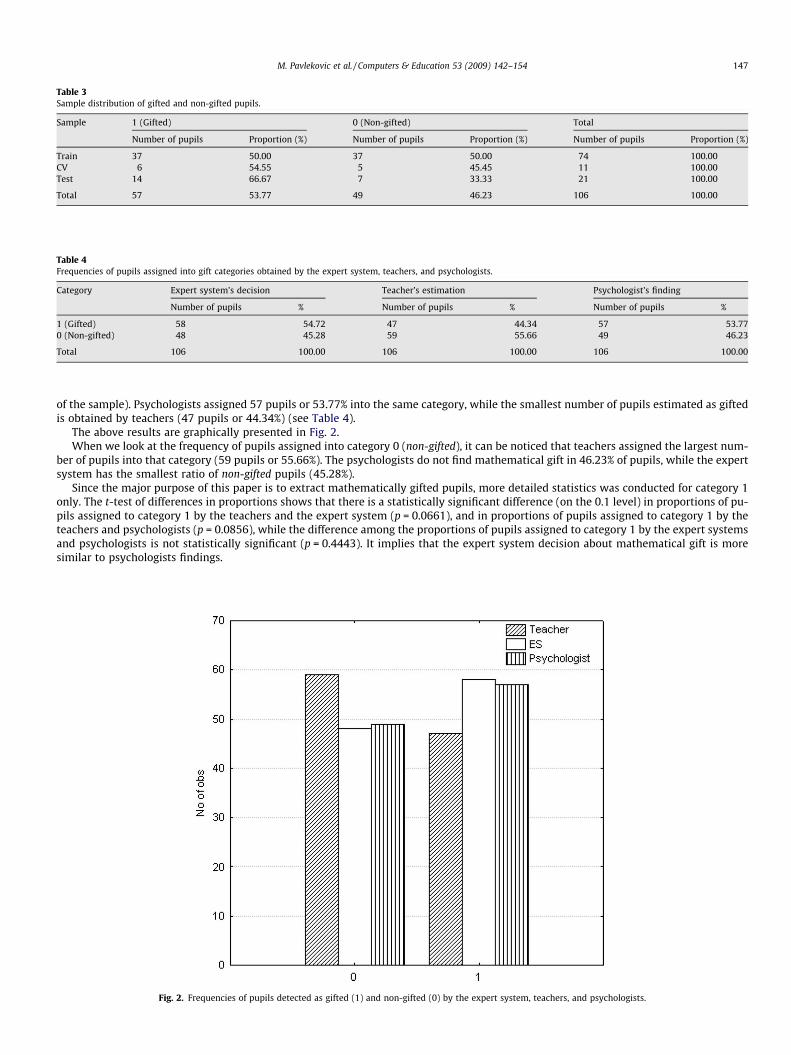
Table 3Sample distribution of gifted and non-gifted pupils.
Sample 1 (Gifted) 0 (Non-gifted) Total
Number of pupils Proportion (%) Number of pupils Proportion (%) Number of pupils Proportion (%)
Train 37 50.00 37 50.00 74 100.00CV 6 54.55 5 45.45 11 100.00Test 14 66.67 7 33.33 21 100.00
Total 57 53.77 49 46.23 106 100.00
Table 4Frequencies of pupils assigned into gift categories obtained by the expert system, teachers, and psychologists.
Category Expert system’s decision Teacher’s estimation Psychologist’s finding
Number of pupils % Number of pupils % Number of pupils %
1 (Gifted) 58 54.72 47 44.34 57 53.770 (Non-gifted) 48 45.28 59 55.66 49 46.23
Total 106 100.00 106 100.00 106 100.00
M. Pavlekovic et al. / Computers & Education 53 (2009) 142–154 147
of the sample). Psychologists assigned 57 pupils or 53.77% into the same category, while the smallest number of pupils estimated as giftedis obtained by teachers (47 pupils or 44.34%) (see Table 4).
The above results are graphically presented in Fig. 2.When we look at the frequency of pupils assigned into category 0 (non-gifted), it can be noticed that teachers assigned the largest num-
ber of pupils into that category (59 pupils or 55.66%). The psychologists do not find mathematical gift in 46.23% of pupils, while the expertsystem has the smallest ratio of non-gifted pupils (45.28%).
Since the major purpose of this paper is to extract mathematically gifted pupils, more detailed statistics was conducted for category 1only. The t-test of differences in proportions shows that there is a statistically significant difference (on the 0.1 level) in proportions of pu-pils assigned to category 1 by the teachers and the expert system (p = 0.0661), and in proportions of pupils assigned to category 1 by theteachers and psychologists (p = 0.0856), while the difference among the proportions of pupils assigned to category 1 by the expert systemsand psychologists is not statistically significant (p = 0.4443). It implies that the expert system decision about mathematical gift is moresimilar to psychologists findings.
Fig. 2. Frequencies of pupils detected as gifted (1) and non-gifted (0) by the expert system, teachers, and psychologists.
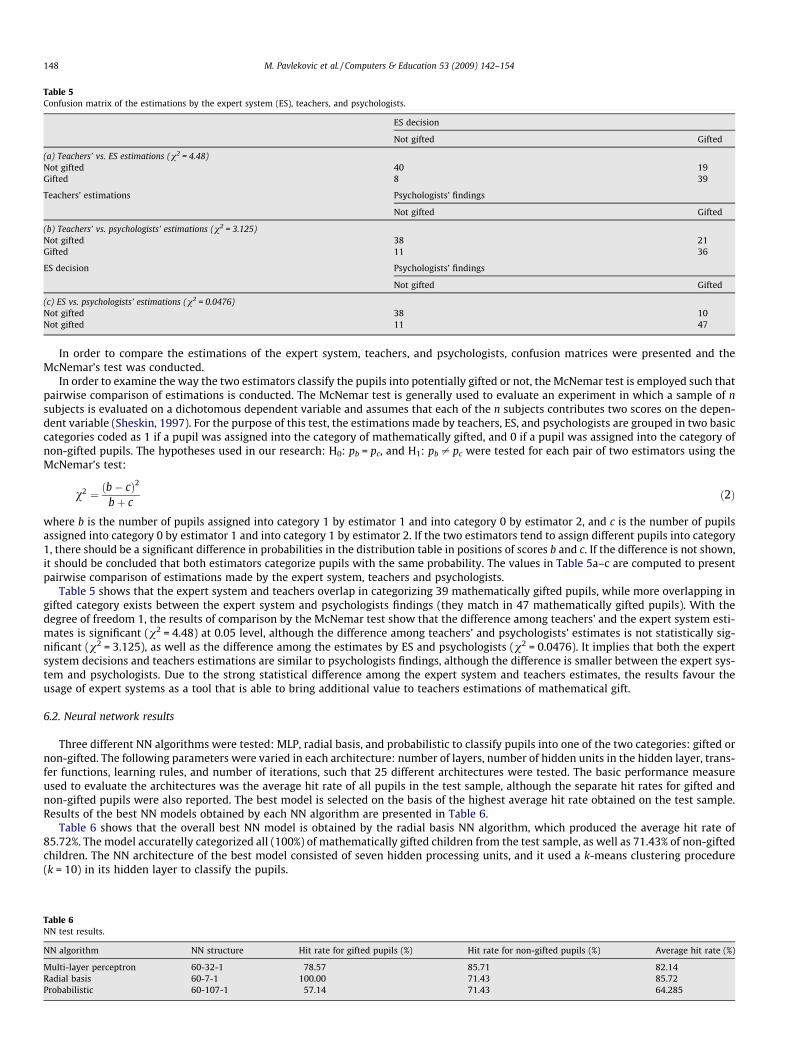
Table 5Confusion matrix of the estimations by the expert system (ES), teachers, and psychologists.
ES decision
Not gifted Gifted
(a) Teachers’ vs. ES estimations (v2 = 4.48)Not gifted 40 19Gifted 8 39
Teachers’ estimations Psychologists’ findings
Not gifted Gifted
(b) Teachers’ vs. psychologists’ estimations (v2 = 3.125)Not gifted 38 21Gifted 11 36
ES decision Psychologists’ findings
Not gifted Gifted
(c) ES vs. psychologists’ estimations (v2 = 0.0476)Not gifted 38 10Not gifted 11 47
148 M. Pavlekovic et al. / Computers & Education 53 (2009) 142–154
In order to compare the estimations of the expert system, teachers, and psychologists, confusion matrices were presented and theMcNemar’s test was conducted.
In order to examine the way the two estimators classify the pupils into potentially gifted or not, the McNemar test is employed such thatpairwise comparison of estimations is conducted. The McNemar test is generally used to evaluate an experiment in which a sample of nsubjects is evaluated on a dichotomous dependent variable and assumes that each of the n subjects contributes two scores on the depen-dent variable (Sheskin, 1997). For the purpose of this test, the estimations made by teachers, ES, and psychologists are grouped in two basiccategories coded as 1 if a pupil was assigned into the category of mathematically gifted, and 0 if a pupil was assigned into the category ofnon-gifted pupils. The hypotheses used in our research: H0: pb = pc, and H1: pb – pc were tested for each pair of two estimators using theMcNemar’s test:
Table 6NN test
NN algo
Multi-laRadial bProbabi
v2 ¼ ðb� cÞ2
bþ cð2Þ
where b is the number of pupils assigned into category 1 by estimator 1 and into category 0 by estimator 2, and c is the number of pupilsassigned into category 0 by estimator 1 and into category 1 by estimator 2. If the two estimators tend to assign different pupils into category1, there should be a significant difference in probabilities in the distribution table in positions of scores b and c. If the difference is not shown,it should be concluded that both estimators categorize pupils with the same probability. The values in Table 5a–c are computed to presentpairwise comparison of estimations made by the expert system, teachers and psychologists.
Table 5 shows that the expert system and teachers overlap in categorizing 39 mathematically gifted pupils, while more overlapping ingifted category exists between the expert system and psychologists findings (they match in 47 mathematically gifted pupils). With thedegree of freedom 1, the results of comparison by the McNemar test show that the difference among teachers’ and the expert system esti-mates is significant (v2 = 4.48) at 0.05 level, although the difference among teachers’ and psychologists’ estimates is not statistically sig-nificant (v2 = 3.125), as well as the difference among the estimates by ES and psychologists (v2 = 0.0476). It implies that both the expertsystem decisions and teachers estimations are similar to psychologists findings, although the difference is smaller between the expert sys-tem and psychologists. Due to the strong statistical difference among the expert system and teachers estimates, the results favour theusage of expert systems as a tool that is able to bring additional value to teachers estimations of mathematical gift.
6.2. Neural network results
Three different NN algorithms were tested: MLP, radial basis, and probabilistic to classify pupils into one of the two categories: gifted ornon-gifted. The following parameters were varied in each architecture: number of layers, number of hidden units in the hidden layer, trans-fer functions, learning rules, and number of iterations, such that 25 different architectures were tested. The basic performance measureused to evaluate the architectures was the average hit rate of all pupils in the test sample, although the separate hit rates for gifted andnon-gifted pupils were also reported. The best model is selected on the basis of the highest average hit rate obtained on the test sample.Results of the best NN models obtained by each NN algorithm are presented in Table 6.
Table 6 shows that the overall best NN model is obtained by the radial basis NN algorithm, which produced the average hit rate of85.72%. The model accuratelly categorized all (100%) of mathematically gifted children from the test sample, as well as 71.43% of non-giftedchildren. The NN architecture of the best model consisted of seven hidden processing units, and it used a k-means clustering procedure(k = 10) in its hidden layer to classify the pupils.
results.
rithm NN structure Hit rate for gifted pupils (%) Hit rate for non-gifted pupils (%) Average hit rate (%)
yer perceptron 60-32-1 78.57 85.71 82.14asis 60-7-1 100.00 71.43 85.72listic 60-107-1 57.14 71.43 64.285
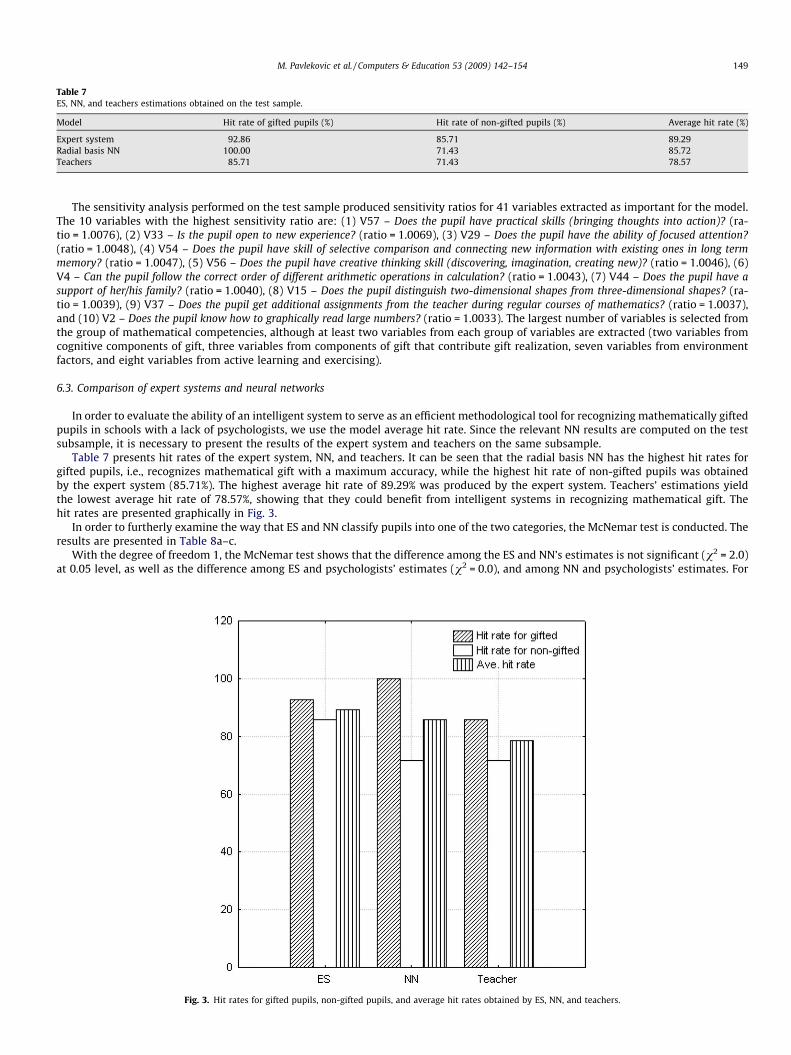
Table 7ES, NN, and teachers estimations obtained on the test sample.
Model Hit rate of gifted pupils (%) Hit rate of non-gifted pupils (%) Average hit rate (%)
Expert system 92.86 85.71 89.29Radial basis NN 100.00 71.43 85.72Teachers 85.71 71.43 78.57
M. Pavlekovic et al. / Computers & Education 53 (2009) 142–154 149
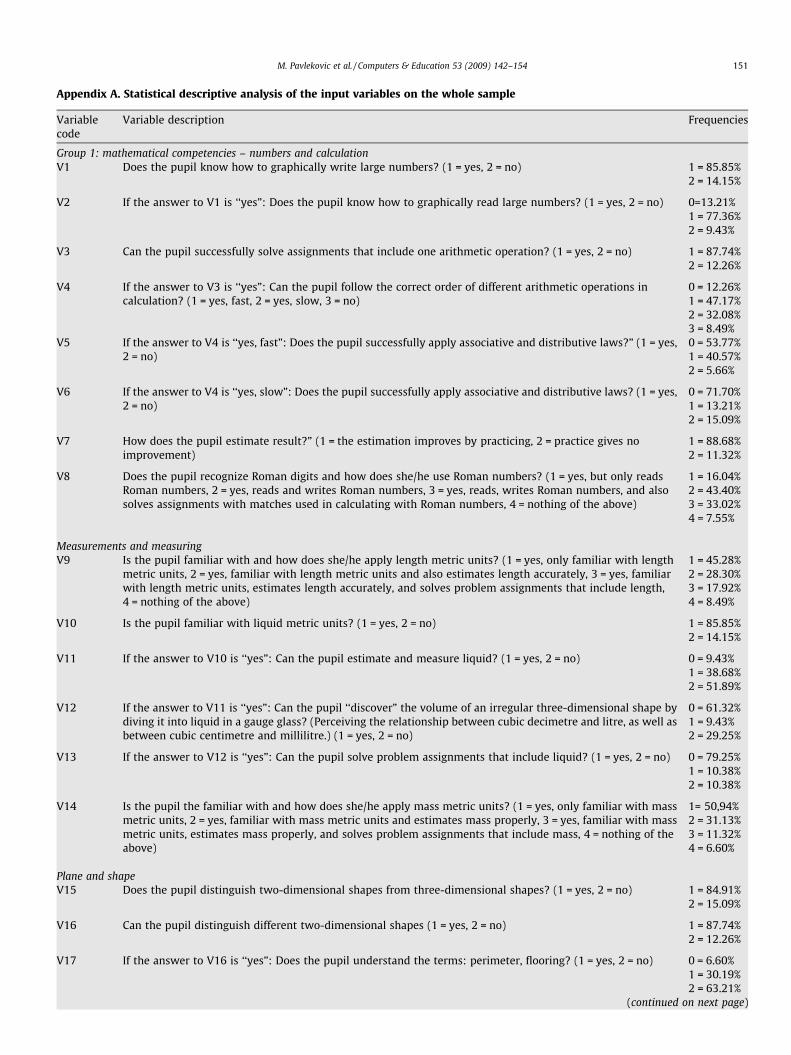
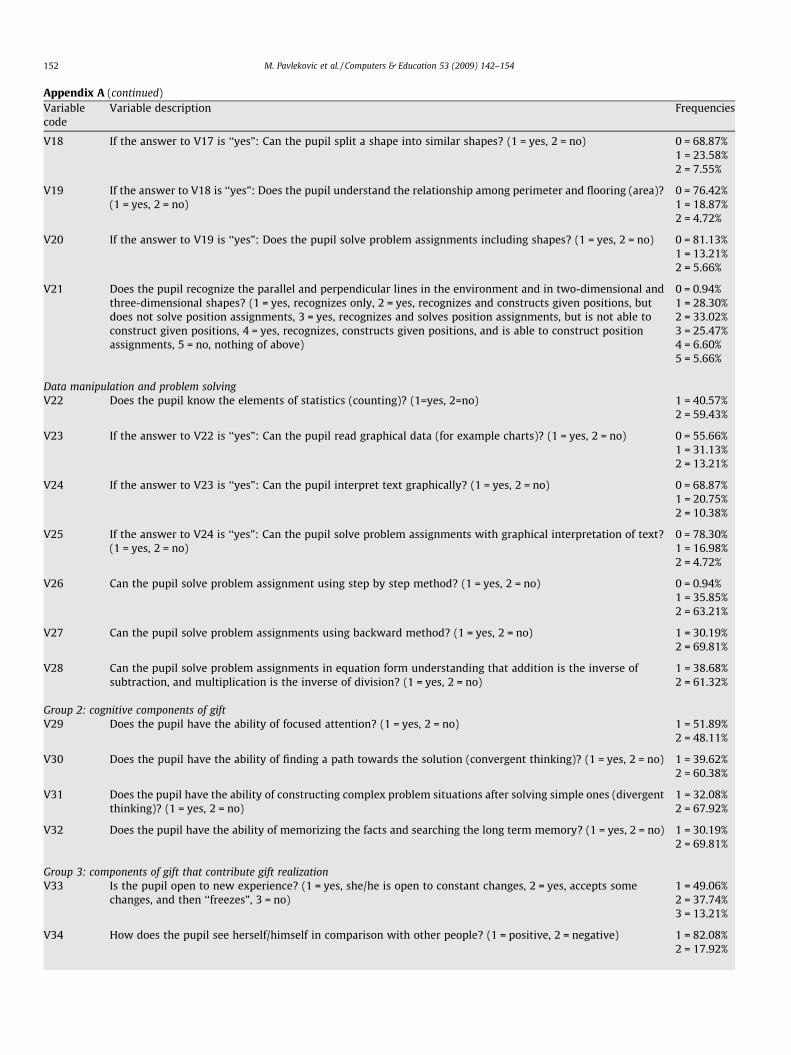
The sensitivity analysis performed on the test sample produced sensitivity ratios for 41 variables extracted as important for the model.The 10 variables with the highest sensitivity ratio are: (1) V57 – Does the pupil have practical skills (bringing thoughts into action)? (ra-tio = 1.0076), (2) V33 – Is the pupil open to new experience? (ratio = 1.0069), (3) V29 – Does the pupil have the ability of focused attention?(ratio = 1.0048), (4) V54 – Does the pupil have skill of selective comparison and connecting new information with existing ones in long termmemory? (ratio = 1.0047), (5) V56 – Does the pupil have creative thinking skill (discovering, imagination, creating new)? (ratio = 1.0046), (6)V4 – Can the pupil follow the correct order of different arithmetic operations in calculation? (ratio = 1.0043), (7) V44 – Does the pupil have asupport of her/his family? (ratio = 1.0040), (8) V15 – Does the pupil distinguish two-dimensional shapes from three-dimensional shapes? (ra-tio = 1.0039), (9) V37 – Does the pupil get additional assignments from the teacher during regular courses of mathematics? (ratio = 1.0037),and (10) V2 – Does the pupil know how to graphically read large numbers? (ratio = 1.0033). The largest number of variables is selected fromthe group of mathematical competencies, although at least two variables from each group of variables are extracted (two variables fromcognitive components of gift, three variables from components of gift that contribute gift realization, seven variables from environmentfactors, and eight variables from active learning and exercising).
6.3. Comparison of expert systems and neural networks
In order to evaluate the ability of an intelligent system to serve as an efficient methodological tool for recognizing mathematically giftedpupils in schools with a lack of psychologists, we use the model average hit rate. Since the relevant NN results are computed on the testsubsample, it is necessary to present the results of the expert system and teachers on the same subsample.
Table 7 presents hit rates of the expert system, NN, and teachers. It can be seen that the radial basis NN has the highest hit rates forgifted pupils, i.e., recognizes mathematical gift with a maximum accuracy, while the highest hit rate of non-gifted pupils was obtainedby the expert system (85.71%). The highest average hit rate of 89.29% was produced by the expert system. Teachers’ estimations yieldthe lowest average hit rate of 78.57%, showing that they could benefit from intelligent systems in recognizing mathematical gift. Thehit rates are presented graphically in Fig. 3.
In order to furtherly examine the way that ES and NN classify pupils into one of the two categories, the McNemar test is conducted. Theresults are presented in Table 8a–c.
With the degree of freedom 1, the McNemar test shows that the difference among the ES and NN’s estimates is not significant (v2 = 2.0)at 0.05 level, as well as the difference among ES and psychologists’ estimates (v2 = 0.0), and among NN and psychologists’ estimates. For
Fig. 3. Hit rates for gifted pupils, non-gifted pupils, and average hit rates obtained by ES, NN, and teachers.
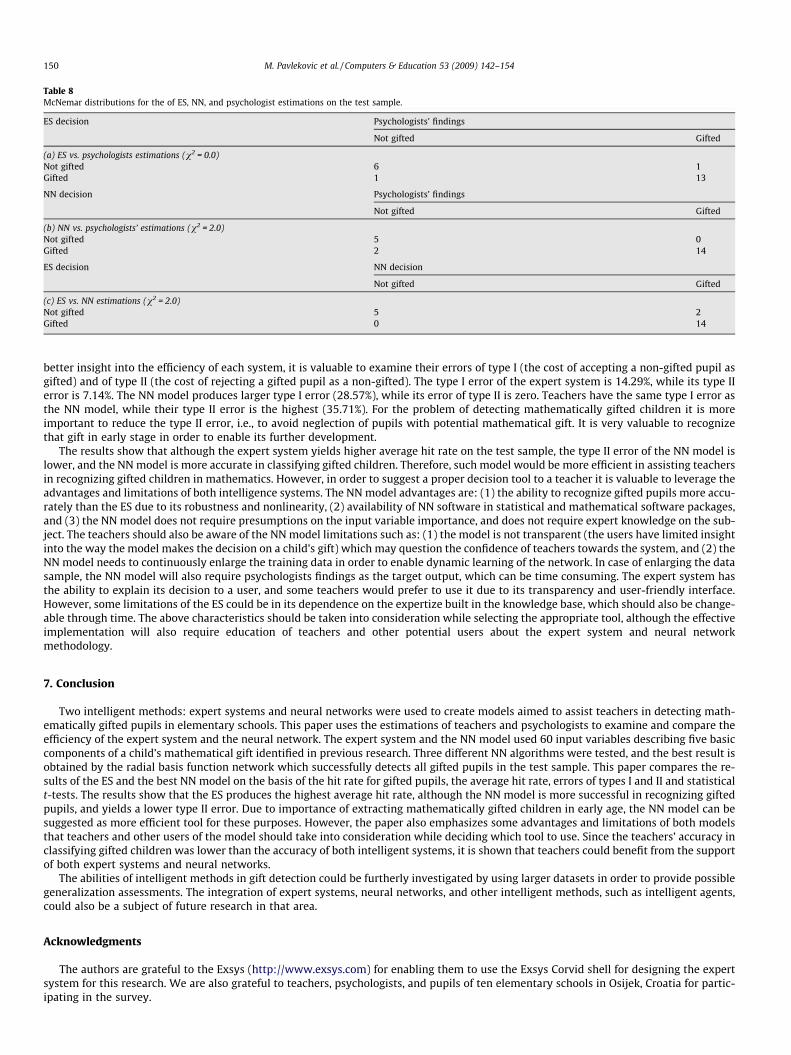
Table 8McNemar distributions for the of ES, NN, and psychologist estimations on the test sample.
ES decision Psychologists’ findings
Not gifted Gifted
(a) ES vs. psychologists estimations (v2 = 0.0)Not gifted 6 1Gifted 1 13
NN decision Psychologists’ findings
Not gifted Gifted
(b) NN vs. psychologists’ estimations (v2 = 2.0)Not gifted 5 0Gifted 2 14
ES decision NN decision
Not gifted Gifted
(c) ES vs. NN estimations (v2 = 2.0)Not gifted 5 2Gifted 0 14
150 M. Pavlekovic et al. / Computers & Education 53 (2009) 142–154
better insight into the efficiency of each system, it is valuable to examine their errors of type I (the cost of accepting a non-gifted pupil asgifted) and of type II (the cost of rejecting a gifted pupil as a non-gifted). The type I error of the expert system is 14.29%, while its type IIerror is 7.14%. The NN model produces larger type I error (28.57%), while its error of type II is zero. Teachers have the same type I error asthe NN model, while their type II error is the highest (35.71%). For the problem of detecting mathematically gifted children it is moreimportant to reduce the type II error, i.e., to avoid neglection of pupils with potential mathematical gift. It is very valuable to recognizethat gift in early stage in order to enable its further development.
The results show that although the expert system yields higher average hit rate on the test sample, the type II error of the NN model islower, and the NN model is more accurate in classifying gifted children. Therefore, such model would be more efficient in assisting teachersin recognizing gifted children in mathematics. However, in order to suggest a proper decision tool to a teacher it is valuable to leverage theadvantages and limitations of both intelligence systems. The NN model advantages are: (1) the ability to recognize gifted pupils more accu-rately than the ES due to its robustness and nonlinearity, (2) availability of NN software in statistical and mathematical software packages,and (3) the NN model does not require presumptions on the input variable importance, and does not require expert knowledge on the sub-ject. The teachers should also be aware of the NN model limitations such as: (1) the model is not transparent (the users have limited insightinto the way the model makes the decision on a child’s gift) which may question the confidence of teachers towards the system, and (2) theNN model needs to continuously enlarge the training data in order to enable dynamic learning of the network. In case of enlarging the datasample, the NN model will also require psychologists findings as the target output, which can be time consuming. The expert system hasthe ability to explain its decision to a user, and some teachers would prefer to use it due to its transparency and user-friendly interface.However, some limitations of the ES could be in its dependence on the expertize built in the knowledge base, which should also be change-able through time. The above characteristics should be taken into consideration while selecting the appropriate tool, although the effectiveimplementation will also require education of teachers and other potential users about the expert system and neural networkmethodology.
7. Conclusion
Two intelligent methods: expert systems and neural networks were used to create models aimed to assist teachers in detecting math-ematically gifted pupils in elementary schools. This paper uses the estimations of teachers and psychologists to examine and compare theefficiency of the expert system and the neural network. The expert system and the NN model used 60 input variables describing five basiccomponents of a child’s mathematical gift identified in previous research. Three different NN algorithms were tested, and the best result isobtained by the radial basis function network which successfully detects all gifted pupils in the test sample. This paper compares the re-sults of the ES and the best NN model on the basis of the hit rate for gifted pupils, the average hit rate, errors of types I and II and statisticalt-tests. The results show that the ES produces the highest average hit rate, although the NN model is more successful in recognizing giftedpupils, and yields a lower type II error. Due to importance of extracting mathematically gifted children in early age, the NN model can besuggested as more efficient tool for these purposes. However, the paper also emphasizes some advantages and limitations of both modelsthat teachers and other users of the model should take into consideration while deciding which tool to use. Since the teachers’ accuracy inclassifying gifted children was lower than the accuracy of both intelligent systems, it is shown that teachers could benefit from the supportof both expert systems and neural networks.
The abilities of intelligent methods in gift detection could be furtherly investigated by using larger datasets in order to provide possiblegeneralization assessments. The integration of expert systems, neural networks, and other intelligent methods, such as intelligent agents,could also be a subject of future research in that area.
Acknowledgments
The authors are grateful to the Exsys (http://www.exsys.com) for enabling them to use the Exsys Corvid shell for designing the expertsystem for this research. We are also grateful to teachers, psychologists, and pupils of ten elementary schools in Osijek, Croatia for partic-ipating in the survey.
M. Pavlekovic et al. / Computers & Education 53 (2009) 142–154 151
Appendix A. Statistical descriptive analysis of the input variables on the whole sample
Variablecode
Variable description
FrequenciesGroup 1: mathematical competencies – numbers and calculation
V1 Does the pupil know how to graphically write large numbers? (1 = yes, 2 = no) 1 = 85.85%2 = 14.15%
V2
If the answer to V1 is ‘‘yes”: Does the pupil know how to graphically read large numbers? (1 = yes, 2 = no) 0=13.21%1 = 77.36%2 = 9.43%V3
Can the pupil successfully solve assignments that include one arithmetic operation? (1 = yes, 2 = no) 1 = 87.74%2 = 12.26%V4
If the answer to V3 is ‘‘yes”: Can the pupil follow the correct order of different arithmetic operations incalculation? (1 = yes, fast, 2 = yes, slow, 3 = no)0 = 12.26%1 = 47.17%2 = 32.08%3 = 8.49%
V5
If the answer to V4 is ‘‘yes, fast”: Does the pupil successfully apply associative and distributive laws?” (1 = yes,2 = no)0 = 53.77%1 = 40.57%2 = 5.66%
V6 If the answer to V4 is ‘‘yes, slow”: Does the pupil successfully apply associative and distributive laws? (1 = yes, 0 = 71.70%
2 = no) 1 = 13.21%2 = 15.09%
V7 How does the pupil estimate result?” (1 = the estimation improves by practicing, 2 = practice gives no 1 = 88.68%
improvement) 2 = 11.32%V8
Does the pupil recognize Roman digits and how does she/he use Roman numbers? (1 = yes, but only readsRoman numbers, 2 = yes, reads and writes Roman numbers, 3 = yes, reads, writes Roman numbers, and alsosolves assignments with matches used in calculating with Roman numbers, 4 = nothing of the above)1 = 16.04%2 = 43.40%3 = 33.02%4 = 7.55%
Measurements and measuring
V9 Is the pupil familiar with and how does she/he apply length metric units? (1 = yes, only familiar with lengthmetric units, 2 = yes, familiar with length metric units and also estimates length accurately, 3 = yes, familiarwith length metric units, estimates length accurately, and solves problem assignments that include length,4 = nothing of the above)
1 = 45.28%2 = 28.30%3 = 17.92%4 = 8.49%
V10 Is the pupil familiar with liquid metric units? (1 = yes, 2 = no) 1 = 85.85%
2 = 14.15%V11
If the answer to V10 is ‘‘yes”: Can the pupil estimate and measure liquid? (1 = yes, 2 = no) 0 = 9.43%1 = 38.68%2 = 51.89%V12
If the answer to V11 is ‘‘yes”: Can the pupil ‘‘discover” the volume of an irregular three-dimensional shape bydiving it into liquid in a gauge glass? (Perceiving the relationship between cubic decimetre and litre, as well asbetween cubic centimetre and millilitre.) (1 = yes, 2 = no)0 = 61.32%1 = 9.43%2 = 29.25%
V13
If the answer to V12 is ‘‘yes”: Can the pupil solve problem assignments that include liquid? (1 = yes, 2 = no) 0 = 79.25%1 = 10.38%2 = 10.38%V14
Is the pupil the familiar with and how does she/he apply mass metric units? (1 = yes, only familiar with massmetric units, 2 = yes, familiar with mass metric units and estimates mass properly, 3 = yes, familiar with massmetric units, estimates mass properly, and solves problem assignments that include mass, 4 = nothing of theabove)1= 50,94%2 = 31.13%3 = 11.32%4 = 6.60%
Plane and shape
V15 Does the pupil distinguish two-dimensional shapes from three-dimensional shapes? (1 = yes, 2 = no) 1 = 84.91%2 = 15.09%
V16
Can the pupil distinguish different two-dimensional shapes (1 = yes, 2 = no) 1 = 87.74%2 = 12.26%V17
If the answer to V16 is ‘‘yes”: Does the pupil understand the terms: perimeter, flooring? (1 = yes, 2 = no) 0 = 6.60%1 = 30.19%2 = 63.21%(continued on next page)
Appendix A (continued)
152 M. Pavlekovic et al. / Computers & Education 53 (2009) 142–154
Variablecode
Variable description
FrequenciesV18
If the answer to V17 is ‘‘yes”: Can the pupil split a shape into similar shapes? (1 = yes, 2 = no) 0 = 68.87%1 = 23.58%2 = 7.55%V19
If the answer to V18 is ‘‘yes”: Does the pupil understand the relationship among perimeter and flooring (area)?(1 = yes, 2 = no)0 = 76.42%1 = 18.87%2 = 4.72%
V20
If the answer to V19 is ‘‘yes”: Does the pupil solve problem assignments including shapes? (1 = yes, 2 = no) 0 = 81.13%1 = 13.21%2 = 5.66%V21
Does the pupil recognize the parallel and perpendicular lines in the environment and in two-dimensional andthree-dimensional shapes? (1 = yes, recognizes only, 2 = yes, recognizes and constructs given positions, butdoes not solve position assignments, 3 = yes, recognizes and solves position assignments, but is not able toconstruct given positions, 4 = yes, recognizes, constructs given positions, and is able to construct positionassignments, 5 = no, nothing of above)0 = 0.94%1 = 28.30%2 = 33.02%3 = 25.47%4 = 6.60%5 = 5.66%
Data manipulation and problem solving
V22 Does the pupil know the elements of statistics (counting)? (1=yes, 2=no) 1 = 40.57%2 = 59.43%
V23
If the answer to V22 is ‘‘yes”: Can the pupil read graphical data (for example charts)? (1 = yes, 2 = no) 0 = 55.66%1 = 31.13%2 = 13.21%V24
If the answer to V23 is ‘‘yes”: Can the pupil interpret text graphically? (1 = yes, 2 = no) 0 = 68.87%1 = 20.75%2 = 10.38%V25
If the answer to V24 is ‘‘yes”: Can the pupil solve problem assignments with graphical interpretation of text?(1 = yes, 2 = no)0 = 78.30%1 = 16.98%2 = 4.72%
V26
Can the pupil solve problem assignment using step by step method? (1 = yes, 2 = no) 0 = 0.94%1 = 35.85%2 = 63.21%V27
Can the pupil solve problem assignments using backward method? (1 = yes, 2 = no) 1 = 30.19%2 = 69.81%V28
Can the pupil solve problem assignments in equation form understanding that addition is the inverse ofsubtraction, and multiplication is the inverse of division? (1 = yes, 2 = no)1 = 38.68%2 = 61.32%
Group 2: cognitive components of gift
V29 Does the pupil have the ability of focused attention? (1 = yes, 2 = no) 1 = 51.89%2 = 48.11%
V30
Does the pupil have the ability of finding a path towards the solution (convergent thinking)? (1 = yes, 2 = no) 1 = 39.62%2 = 60.38%V31 Does the pupil have the ability of constructing complex problem situations after solving simple ones (divergent 1 = 32.08%
thinking)? (1 = yes, 2 = no) 2 = 67.92%V32
Does the pupil have the ability of memorizing the facts and searching the long term memory? (1 = yes, 2 = no) 1 = 30.19%2 = 69.81%Group 3: components of gift that contribute gift realization
V33 Is the pupil open to new experience? (1 = yes, she/he is open to constant changes, 2 = yes, accepts somechanges, and then ‘‘freezes”, 3 = no)
1 = 49.06%2 = 37.74%3 = 13.21%V34
How does the pupil see herself/himself in comparison with other people? (1 = positive, 2 = negative) 1 = 82.08%2 = 17.92%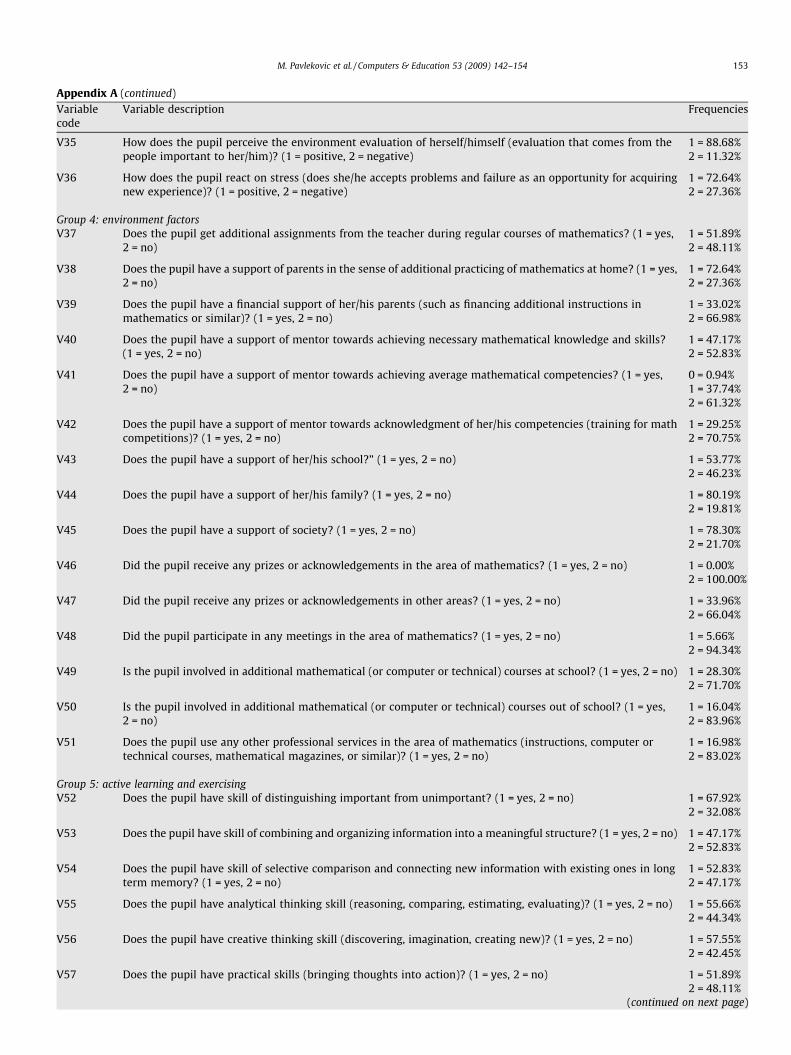
Appendix A (continued)
M. Pavlekovic et al. / Computers & Education 53 (2009) 142–154 153
Variablecode
Variable description
(continued o
Frequencies
V35
How does the pupil perceive the environment evaluation of herself/himself (evaluation that comes from thepeople important to her/him)? (1 = positive, 2 = negative)1 = 88.68%2 = 11.32%
V36 How does the pupil react on stress (does she/he accepts problems and failure as an opportunity for acquiring 1 = 72.64%
new experience)? (1 = positive, 2 = negative) 2 = 27.36%Group 4: environment factors
V37 Does the pupil get additional assignments from the teacher during regular courses of mathematics? (1 = yes,2 = no)
1 = 51.89%2 = 48.11%V38
Does the pupil have a support of parents in the sense of additional practicing of mathematics at home? (1 = yes,2 = no)1 = 72.64%2 = 27.36%
V39
Does the pupil have a financial support of her/his parents (such as financing additional instructions inmathematics or similar)? (1 = yes, 2 = no)1 = 33.02%2 = 66.98%
V40
Does the pupil have a support of mentor towards achieving necessary mathematical knowledge and skills?(1 = yes, 2 = no)1 = 47.17%2 = 52.83%
V41
Does the pupil have a support of mentor towards achieving average mathematical competencies? (1 = yes,2 = no)0 = 0.94%1 = 37.74%2 = 61.32%
V42
Does the pupil have a support of mentor towards acknowledgment of her/his competencies (training for mathcompetitions)? (1 = yes, 2 = no)1 = 29.25%2 = 70.75%
V43 Does the pupil have a support of her/his school?” (1 = yes, 2 = no) 1 = 53.77%
2 = 46.23%V44
Does the pupil have a support of her/his family? (1 = yes, 2 = no) 1 = 80.19%2 = 19.81%V45 Does the pupil have a support of society? (1 = yes, 2 = no) 1 = 78.30%
2 = 21.70%V46
Did the pupil receive any prizes or acknowledgements in the area of mathematics? (1 = yes, 2 = no) 1 = 0.00%2 = 100.00%V47
Did the pupil receive any prizes or acknowledgements in other areas? (1 = yes, 2 = no) 1 = 33.96%2 = 66.04%V48
Did the pupil participate in any meetings in the area of mathematics? (1 = yes, 2 = no) 1 = 5.66%2 = 94.34%V49
Is the pupil involved in additional mathematical (or computer or technical) courses at school? (1 = yes, 2 = no) 1 = 28.30%2 = 71.70%V50 Is the pupil involved in additional mathematical (or computer or technical) courses out of school? (1 = yes, 1 = 16.04%
2 = no) 2 = 83.96%V51
Does the pupil use any other professional services in the area of mathematics (instructions, computer ortechnical courses, mathematical magazines, or similar)? (1 = yes, 2 = no)1 = 16.98%2 = 83.02%
Group 5: active learning and exercising
V52 Does the pupil have skill of distinguishing important from unimportant? (1 = yes, 2 = no) 1 = 67.92%2 = 32.08%
V53 Does the pupil have skill of combining and organizing information into a meaningful structure? (1 = yes, 2 = no) 1 = 47.17%
2 = 52.83%V54
Does the pupil have skill of selective comparison and connecting new information with existing ones in longterm memory? (1 = yes, 2 = no)1 = 52.83%2 = 47.17%
V55 Does the pupil have analytical thinking skill (reasoning, comparing, estimating, evaluating)? (1 = yes, 2 = no) 1 = 55.66%
2 = 44.34%V56
Does the pupil have creative thinking skill (discovering, imagination, creating new)? (1 = yes, 2 = no) 1 = 57.55%2 = 42.45%V57
Does the pupil have practical skills (bringing thoughts into action)? (1 = yes, 2 = no) 1 = 51.89%2 = 48.11% n next page)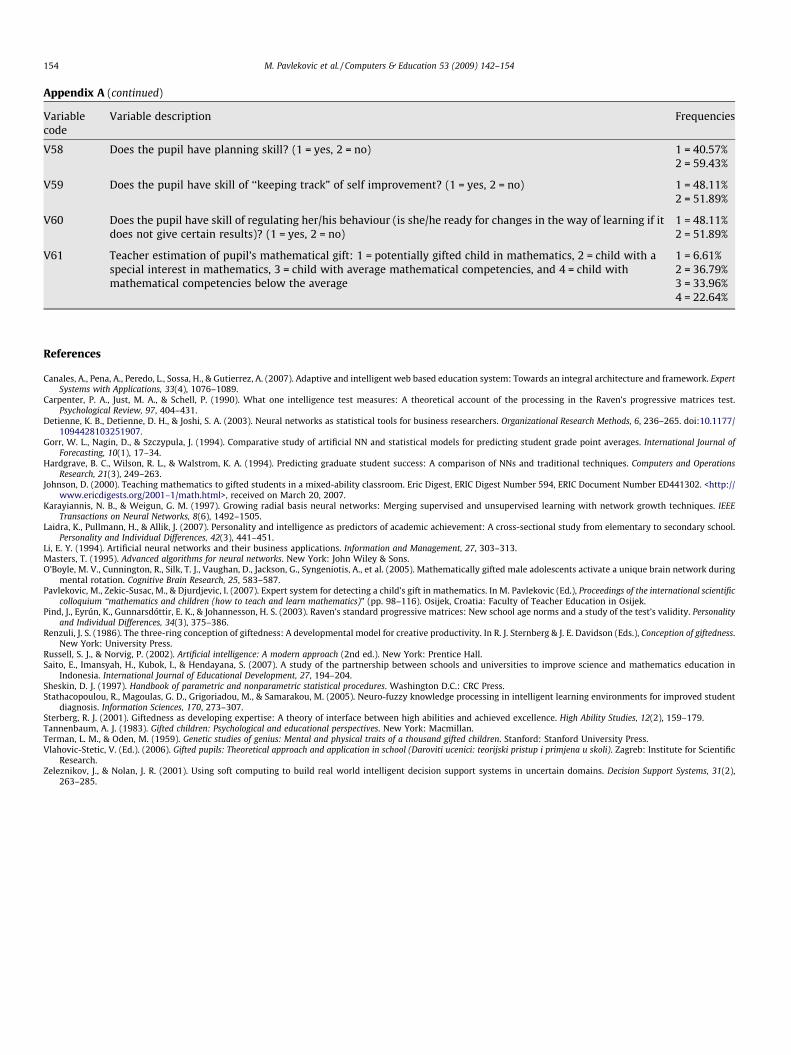
Appendix A (continued)
154 M. Pavlekovic et al. / Computers & Education 53 (2009) 142–154
Variable Variable description Frequencies
codeV58
Does the pupil have planning skill? (1 = yes, 2 = no) 1 = 40.57%2 = 59.43%V59
Does the pupil have skill of ‘‘keeping track” of self improvement? (1 = yes, 2 = no) 1 = 48.11%2 = 51.89%V60 Does the pupil have skill of regulating her/his behaviour (is she/he ready for changes in the way of learning if it 1 = 48.11%
does not give certain results)? (1 = yes, 2 = no) 2 = 51.89%V61
Teacher estimation of pupil’s mathematical gift: 1 = potentially gifted child in mathematics, 2 = child with aspecial interest in mathematics, 3 = child with average mathematical competencies, and 4 = child withmathematical competencies below the average1 = 6.61%2 = 36.79%3 = 33.96%4 = 22.64%
References
Canales, A., Pena, A., Peredo, L., Sossa, H., & Gutierrez, A. (2007). Adaptive and intelligent web based education system: Towards an integral architecture and framework. ExpertSystems with Applications, 33(4), 1076–1089.
Carpenter, P. A., Just, M. A., & Schell, P. (1990). What one intelligence test measures: A theoretical account of the processing in the Raven’s progressive matrices test.Psychological Review, 97, 404–431.
Detienne, K. B., Detienne, D. H., & Joshi, S. A. (2003). Neural networks as statistical tools for business researchers. Organizational Research Methods, 6, 236–265. doi:10.1177/1094428103251907.
Gorr, W. L., Nagin, D., & Szczypula, J. (1994). Comparative study of artificial NN and statistical models for predicting student grade point averages. International Journal ofForecasting, 10(1), 17–34.
Hardgrave, B. C., Wilson, R. L., & Walstrom, K. A. (1994). Predicting graduate student success: A comparison of NNs and traditional techniques. Computers and OperationsResearch, 21(3), 249–263.
Johnson, D. (2000). Teaching mathematics to gifted students in a mixed-ability classroom. Eric Digest, ERIC Digest Number 594, ERIC Document Number ED441302. <http://www.ericdigests.org/2001–1/math.html>, received on March 20, 2007.
Karayiannis, N. B., & Weigun, G. M. (1997). Growing radial basis neural networks: Merging supervised and unsupervised learning with network growth techniques. IEEETransactions on Neural Networks, 8(6), 1492–1505.
Laidra, K., Pullmann, H., & Allik, J. (2007). Personality and intelligence as predictors of academic achievement: A cross-sectional study from elementary to secondary school.Personality and Individual Differences, 42(3), 441–451.
Li, E. Y. (1994). Artificial neural networks and their business applications. Information and Management, 27, 303–313.Masters, T. (1995). Advanced algorithms for neural networks. New York: John Wiley & Sons.O’Boyle, M. V., Cunnington, R., Silk, T. J., Vaughan, D., Jackson, G., Syngeniotis, A., et al. (2005). Mathematically gifted male adolescents activate a unique brain network during
mental rotation. Cognitive Brain Research, 25, 583–587.Pavlekovic, M., Zekic-Susac, M., & Djurdjevic, I. (2007). Expert system for detecting a child’s gift in mathematics. In M. Pavlekovic (Ed.), Proceedings of the international scientific
colloquium ‘‘mathematics and children (how to teach and learn mathematics)” (pp. 98–116). Osijek, Croatia: Faculty of Teacher Education in Osijek.Pind, J., Eyrún, K., Gunnarsdóttir, E. K., & Johannesson, H. S. (2003). Raven’s standard progressive matrices: New school age norms and a study of the test’s validity. Personality
and Individual Differences, 34(3), 375–386.Renzuli, J. S. (1986). The three-ring conception of giftedness: A developmental model for creative productivity. In R. J. Sternberg & J. E. Davidson (Eds.), Conception of giftedness.
New York: University Press.Russell, S. J., & Norvig, P. (2002). Artificial intelligence: A modern approach (2nd ed.). New York: Prentice Hall.Saito, E., Imansyah, H., Kubok, I., & Hendayana, S. (2007). A study of the partnership between schools and universities to improve science and mathematics education in
Indonesia. International Journal of Educational Development, 27, 194–204.Sheskin, D. J. (1997). Handbook of parametric and nonparametric statistical procedures. Washington D.C.: CRC Press.Stathacopoulou, R., Magoulas, G. D., Grigoriadou, M., & Samarakou, M. (2005). Neuro-fuzzy knowledge processing in intelligent learning environments for improved student
diagnosis. Information Sciences, 170, 273–307.Sterberg, R. J. (2001). Giftedness as developing expertise: A theory of interface between high abilities and achieved excellence. High Ability Studies, 12(2), 159–179.Tannenbaum, A. J. (1983). Gifted children: Psychological and educational perspectives. New York: Macmillan.Terman, L. M., & Oden, M. (1959). Genetic studies of genius: Mental and physical traits of a thousand gifted children. Stanford: Stanford University Press.Vlahovic-Stetic, V. (Ed.). (2006). Gifted pupils: Theoretical approach and application in school (Daroviti ucenici: teorijski pristup i primjena u skoli). Zagreb: Institute for Scientific
Research.Zeleznikov, J., & Nolan, J. R. (2001). Using soft computing to build real world intelligent decision support systems in uncertain domains. Decision Support Systems, 31(2),
263–285.