con guring ibm websphere monitor for process mining -...
TRANSCRIPT
Configuring IBM WebSphere Monitor forProcess Mining
H.M.W. Verbeek and W.M.P. van der Aalst
Technische Universiteit EindhovenDepartment of Mathematics and Computer Science
P.O. Box 513, 5600 MB Eindhoven, The Netherlands{h.m.w.verbeek,w.m.p.v.d.aalst}@tue.nl
Abstract. Process mining has emerged as a way to discover or check theconformance of processes based on event logs. This enables organizationsto learn from processes as they really take place. Since web services aredistributed over autonomous parties, it is vital to monitor the correct ex-ecution of service processes. Fortunately, the “web services stack” assistsin collecting structured event logs. These logs can be used to extract newinformation about service processes (like bottlenecks) and to check theconformance. In this paper, we demonstrate that such an event log canbe obtained in the context of the IBMs WebSphere environment. Morespecifically, we show how to configure the WebSphere Business Monitorin such a way that it collects all the information needed for generatingan event log.
1 Introduction
IBM’s WebSphere suite is IBM’s solution for Service Oriented Architectures(SOAs for short), and includes tools like the WebSphere Business Modeler (Mod-eler for short), the WebSphere Integration Developer (WID), the WebSphereProcess Server (Server), and the WebSphere Business Monitor (Monitor). Fig. 1shows an overview of these tools, and how they are positioned in the lifecycle ofa service. When a service process is running on the Server, the Server will emitall kinds of events related to that service on the system’s event bus, called theCommon Event Infrastructure (CEI for short). The Monitor can monitor therunning process by subscribing to these events.
The events that pass the CEI can potentially be used by process miningtechniques. The goal of process mining is to extract information (e.g., processmodels, social networks, bottlenecks, and predictive models) from event logs.Typically, process mining assumes that it is possible to sequentially record eventssuch that each event refers to an activity (a well-defined step in the process, like“Register complaint”) and is related to a particular case (a process instance,like “Complaint of John Doe”). Furthermore, some techniques use additionalinformation such as the resource that performed the activity that generated theevent, the timestamp of the event, or data elements recorded with the event (likethe name of the complainant).

2 H.M.W. Verbeek and W.M.P. van der Aalst
6 Business Process Management: Modeling through Monitoring
IBM business process management solutionThe IBM process integration portfolio provides capabilities required for the delivery of the comprehensive enterprise wide business process management strategies and solution. It offers a holistic approach to transform and manage a business by aligning strategic and operational objectives with business activities and supporting IT services.
The IBM BPM solution includes development tools, used to implement custom artifacts that leverage the infrastructure capabilities, and business performance management tools, used to monitor and manage the runtime implementations at both the IT and business process levels.
Business process management allows companies to implement the continuous end-to-end business process lifecycle in an open environment (Figure 1-1).
Figure 1-1 Business process management lifecycle
The IBM BPM solution component tools support the following major activities:
� Model—Capture, simulate, analyze and optimize business models to reduce risk and increase flexibility
� Assemble—Develop, assemble and test integrated solution
Websphere Business Modeler Websphere Business Monitor
Webphere Process ServerWebsphere Integration Developer- Integrate people- Integrate processes- Manage and integrate information- Run and manage complex applications
- Discover- Design, construct, and test- Compose
- Gather requirements- Model, design & simulate- Define business metrics
- Monitor business metrics and runtime- Dashboards, scorecards
Fig. 1. Service lifecycle supported by the “Modeler”, the “WID”, the “Server”, andthe “Monitor” (taken from [7]).
In this paper, we discuss the possibility of doing process mining on the eventsthat pass from the Server to the Monitor through the CEI. It seems straight-forward to tap the events from the CEI, store them in a log, and do processmining on that log, but there are some problems with this approach, as we willshow. As demonstrated in this paper, these problems can be solved by limitingourselves to the events that the Monitor requires. Unfortunately, the Monitoronly stores aggregated data, and in general this is not sufficient for doing processmining. Finally, we will show a way to have the Monitor store sufficient data fordoing process mining, which shows that it is possible to apply process miningtechniques in the context of the IBM WebSphere SOA suite.
The remainder of this paper is organized as follows. Section 2 introducesIBM’s WebSphere suite. Section 3 briefly introduces process mining. Section 4shows that an event log can be obtained using the Monitor as the source ofevents. Finally, Section 5 concludes the paper.
2 IBM WebSphere
This section describes the tools of the WebSphere suite that are relevant for thispaper: the Modeler, the WID, the Server, and the Monitor. As the Monitor iscrucial for our process mining goal, the emphasis of this section will be on theMonitor. The reader interested in additional details on the Monitor is referredto [7]. As a running example for this Section, we take the fictional Clips andTacks company which is also used in [7].
Configuring IBM WebSphere Monitor for Process Mining 3
Clips and Tacks is an office supply company. First, some client submits anorder. Second, a business rule evaluates whether the order can be automaticallyapproved, which happens if the total order price does not exceed 750 US$. Oth-erwise, it requires approval from an employee. Third, after the order has beenapproved, the systems checks whether the customer account is in good standing.If not, an additional review by an employee is required. Fourth, if all is okay, theorder is shipped. Otherwise, the order is canceled and the client is notified.
2.1 Modeler
The Modeler is the component used by business analysts to make an abstractmodel of the business. Apart from a process model and a list of business items,this model also contains list of business measures. These business measures areto be monitored by the Monitor. A business measure can either be a businessperformance indicator or a monitored value. Business performance indicatorsinclude Key Performance Indicators (KPIs for short), instance metrics, and ag-gregate metrics. A KPI corresponds to a variable with a numerical value (whichincludes durations), and has a target and an optional time period. The target ofthe KPI corresponds to the value the business has to achieve at least. Examplesof KPIs are “Average Process Duration” with a target of 3 days, or “Percentageof Orders Shipped” with a target of 90% and a rolling time period of 30 days.Note that the Modeler does not provide any information on how to actuallycompute these KPIs.
2.2 WID
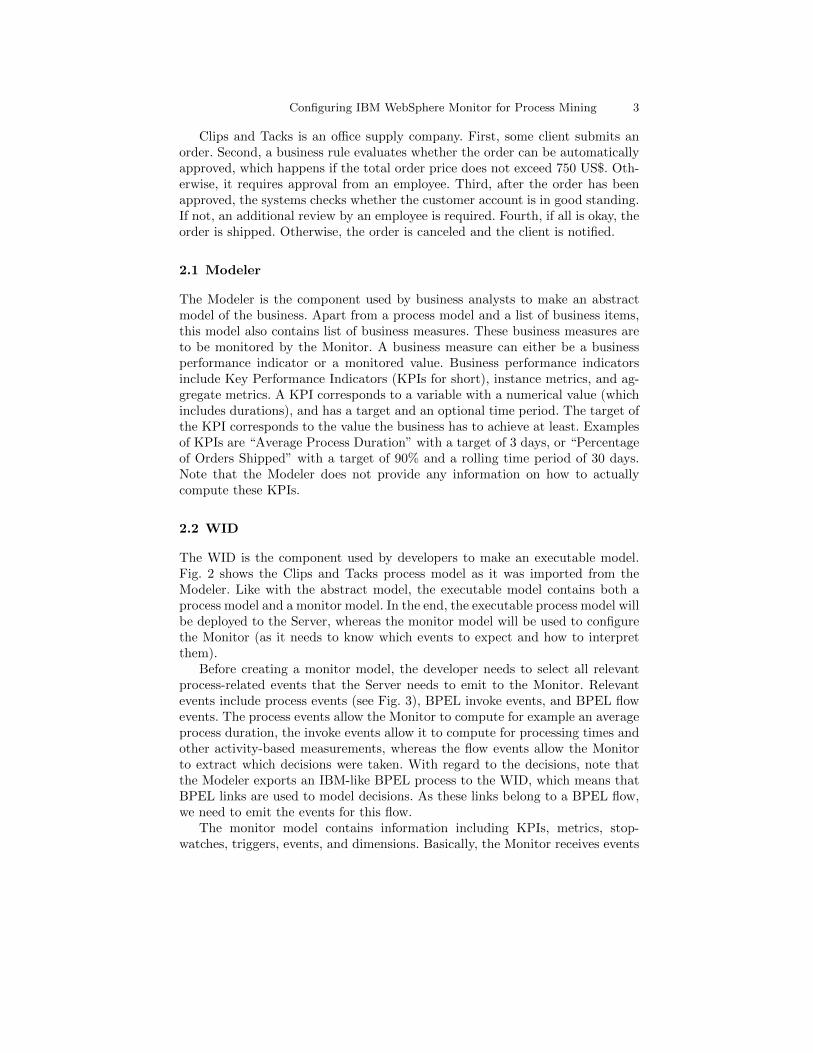
The WID is the component used by developers to make an executable model.Fig. 2 shows the Clips and Tacks process model as it was imported from theModeler. Like with the abstract model, the executable model contains both aprocess model and a monitor model. In the end, the executable process model willbe deployed to the Server, whereas the monitor model will be used to configurethe Monitor (as it needs to know which events to expect and how to interpretthem).
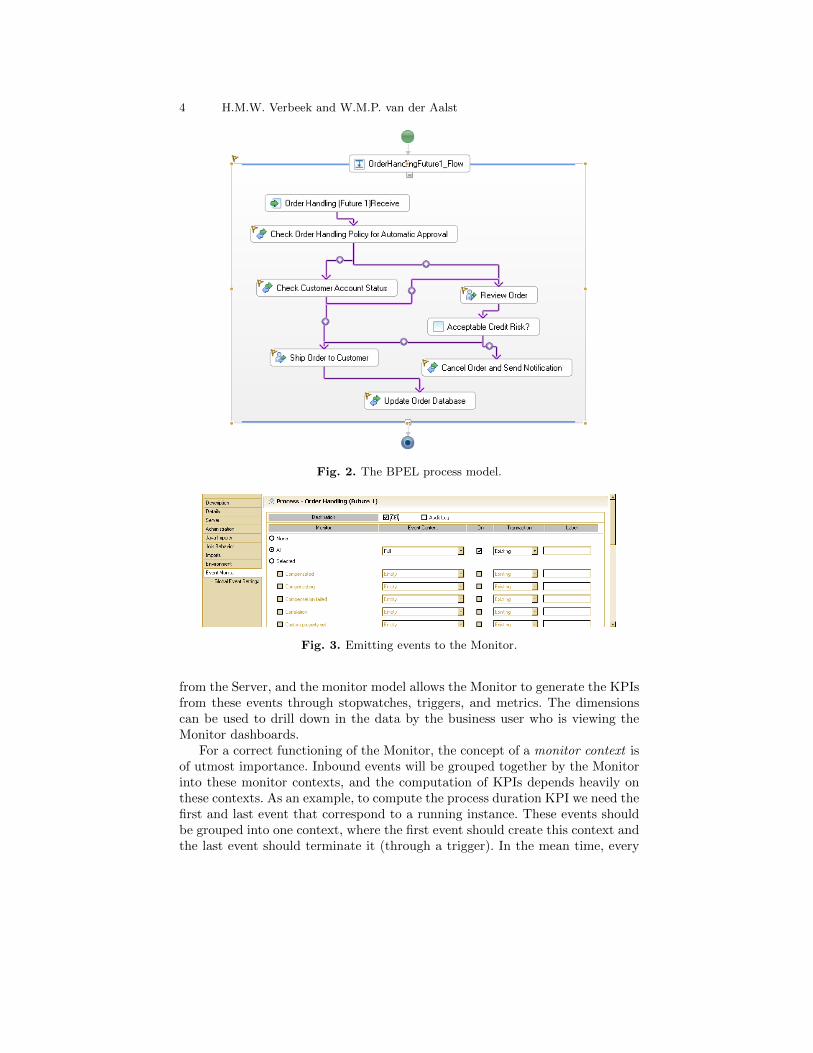
Before creating a monitor model, the developer needs to select all relevantprocess-related events that the Server needs to emit to the Monitor. Relevantevents include process events (see Fig. 3), BPEL invoke events, and BPEL flowevents. The process events allow the Monitor to compute for example an averageprocess duration, the invoke events allow it to compute for processing times andother activity-based measurements, whereas the flow events allow the Monitorto extract which decisions were taken. With regard to the decisions, note thatthe Modeler exports an IBM-like BPEL process to the WID, which means thatBPEL links are used to model decisions. As these links belong to a BPEL flow,we need to emit the events for this flow.
The monitor model contains information including KPIs, metrics, stop-watches, triggers, events, and dimensions. Basically, the Monitor receives events
4 H.M.W. Verbeek and W.M.P. van der Aalst
Fig. 2. The BPEL process model.
Fig. 3. Emitting events to the Monitor.
from the Server, and the monitor model allows the Monitor to generate the KPIsfrom these events through stopwatches, triggers, and metrics. The dimensionscan be used to drill down in the data by the business user who is viewing theMonitor dashboards.
For a correct functioning of the Monitor, the concept of a monitor context isof utmost importance. Inbound events will be grouped together by the Monitorinto these monitor contexts, and the computation of KPIs depends heavily onthese contexts. As an example, to compute the process duration KPI we need thefirst and last event that correspond to a running instance. These events shouldbe grouped into one context, where the first event should create this context andthe last event should terminate it (through a trigger). In the mean time, every
Configuring IBM WebSphere Monitor for Process Mining 5
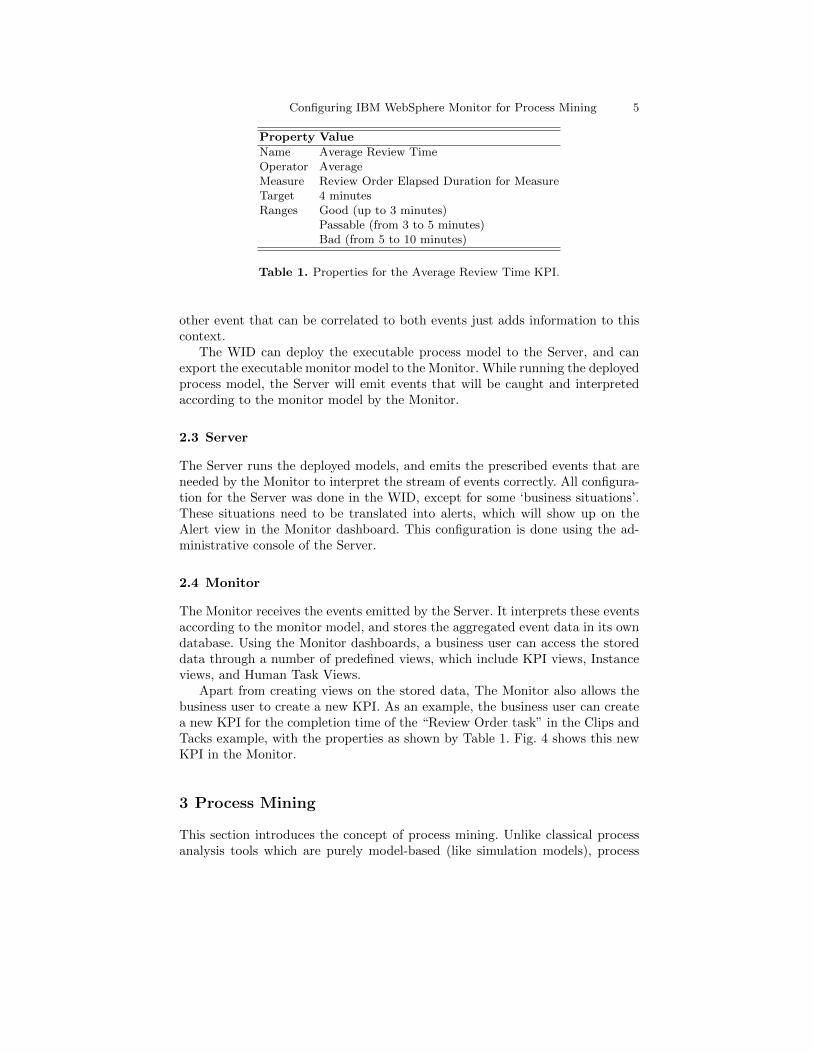
Property Value
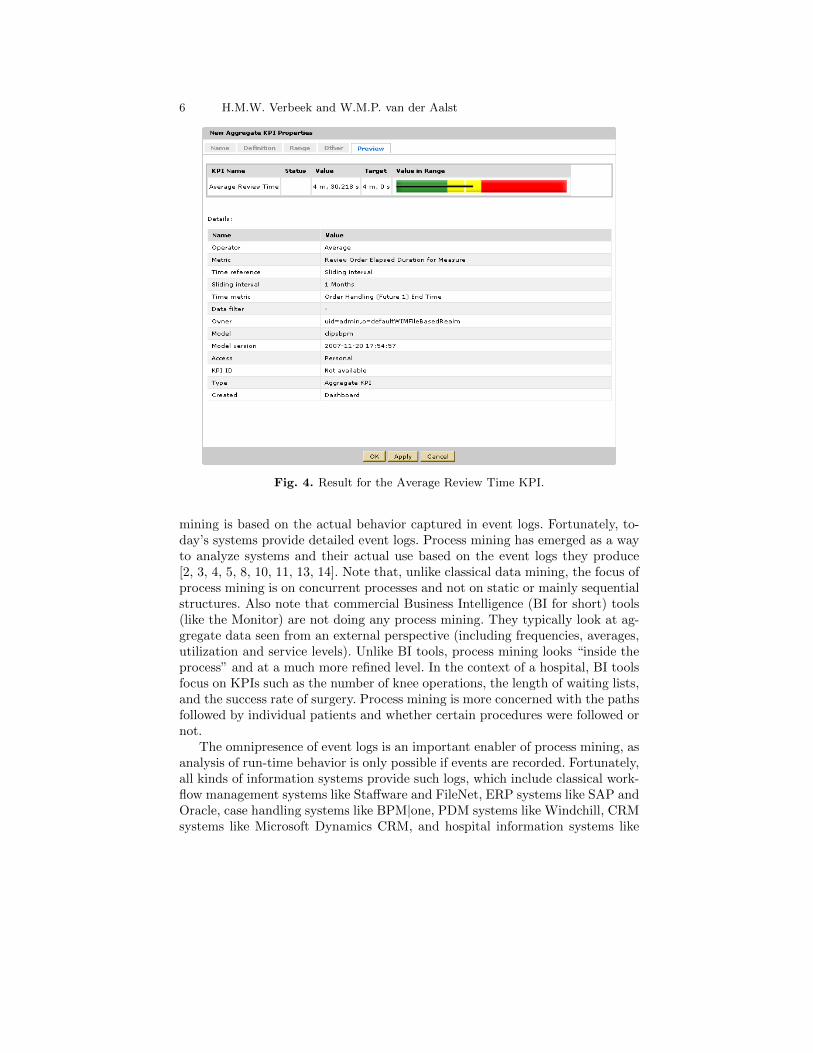
Name Average Review TimeOperator AverageMeasure Review Order Elapsed Duration for MeasureTarget 4 minutesRanges Good (up to 3 minutes)
Passable (from 3 to 5 minutes)Bad (from 5 to 10 minutes)
Table 1. Properties for the Average Review Time KPI.
other event that can be correlated to both events just adds information to thiscontext.
The WID can deploy the executable process model to the Server, and canexport the executable monitor model to the Monitor. While running the deployedprocess model, the Server will emit events that will be caught and interpretedaccording to the monitor model by the Monitor.
2.3 Server
The Server runs the deployed models, and emits the prescribed events that areneeded by the Monitor to interpret the stream of events correctly. All configura-tion for the Server was done in the WID, except for some ‘business situations’.These situations need to be translated into alerts, which will show up on theAlert view in the Monitor dashboard. This configuration is done using the ad-ministrative console of the Server.
2.4 Monitor
The Monitor receives the events emitted by the Server. It interprets these eventsaccording to the monitor model, and stores the aggregated event data in its owndatabase. Using the Monitor dashboards, a business user can access the storeddata through a number of predefined views, which include KPI views, Instanceviews, and Human Task Views.
Apart from creating views on the stored data, The Monitor also allows thebusiness user to create a new KPI. As an example, the business user can createa new KPI for the completion time of the “Review Order task” in the Clips andTacks example, with the properties as shown by Table 1. Fig. 4 shows this newKPI in the Monitor.
3 Process Mining
This section introduces the concept of process mining. Unlike classical processanalysis tools which are purely model-based (like simulation models), process
6 H.M.W. Verbeek and W.M.P. van der Aalst
Fig. 4. Result for the Average Review Time KPI.
mining is based on the actual behavior captured in event logs. Fortunately, to-day’s systems provide detailed event logs. Process mining has emerged as a wayto analyze systems and their actual use based on the event logs they produce[2, 3, 4, 5, 8, 10, 11, 13, 14]. Note that, unlike classical data mining, the focus ofprocess mining is on concurrent processes and not on static or mainly sequentialstructures. Also note that commercial Business Intelligence (BI for short) tools(like the Monitor) are not doing any process mining. They typically look at ag-gregate data seen from an external perspective (including frequencies, averages,utilization and service levels). Unlike BI tools, process mining looks “inside theprocess” and at a much more refined level. In the context of a hospital, BI toolsfocus on KPIs such as the number of knee operations, the length of waiting lists,and the success rate of surgery. Process mining is more concerned with the pathsfollowed by individual patients and whether certain procedures were followed ornot.
The omnipresence of event logs is an important enabler of process mining, asanalysis of run-time behavior is only possible if events are recorded. Fortunately,all kinds of information systems provide such logs, which include classical work-flow management systems like Staffware and FileNet, ERP systems like SAP andOracle, case handling systems like BPM|one, PDM systems like Windchill, CRMsystems like Microsoft Dynamics CRM, and hospital information systems like
Configuring IBM WebSphere Monitor for Process Mining 7
Chipsoft. These systems provide very detailed information about the activitiesthat have been executed.
Traditionally, process mining has been focusing on discovery, that is, derivinginformation about the original process model, the organizational context, andexecution properties from enactment logs. An example of a technique addressingthe control flow perspective is the α-algorithm, which constructs a Petri netmodel [9, 12] describing the behavior observed in the event log. However, processmining is not limited to process models, and recent process mining techniques aremore and more focusing on other perspectives, like the organizational perspectiveor the data perspective. For example, there are approaches to extract socialnetworks from event logs and analyze them using social network analysis [1].This allows organizations to monitor how people, groups, or software/systemcomponents are working together.
Note that the Monitor in IBM WebSphere does not (yet) support processmining. The focus is on showing KPIs rather than finding out what the actualprocess is. For example, the Monitor does not support the discovery of processmodels, social networks, predictive model, etc. Given the large installed basedof WebSphere and the need for more refined run-time analysis, it is interestingto add process mining to IBM’s suite.
4 WebSphere Event Logs
This section investigates whether the IBM WebSphere suite allows for the collec-tion and extraction of event logs that can be used as input for process mining. Atfirst sight, it seems logical to tap the event log directly from the CEI, as all eventsin the suite pass this bus and this format seems well-suited for process mining.However, there are a number of problems with this approach (see also [6]). First,we would need to specify which events should be collected into the event log.If we’re interested in a certain process, we should only collect events that cor-respond to that process. Adding events from other processes will make processmining hard. Second, the events related to a particular process may correspondto different levels of abstraction. Some events correspond to a very high-levelevent, like starting some activity, whereas some other events correspond to avery low-level event, like updating the value for some variable. Having events onmultiple levels of abstractions also makes process mining hard. Third, we wouldneed to be able to cluster the collected events into process instances, that is, wewould need to be able to retrieve for some event to which process instance itactually belongs. Unfortunately, this information is not always easy to obtain.As a result, it is certainly not straightforward to collect the events directly fromthe CEI.
The use of a monitor model and the Monitor can help solving the problemsmentioned above. Creating a monitor model in the WID serves two purposes.First, it extends the process model in such a way that the Server will emita proper set of events (all related to the process and all at the same level ofabstraction) once it is running. Second, it creates a matching monitor model

8 H.M.W. Verbeek and W.M.P. van der Aalst
that enables the Monitor to catch and interpret these incoming events, and todivide these events up into monitor contexts. By default, the monitor model willbe such that a monitor context corresponds to the notion of a process instance,hence the Monitor will collect all events to a single process instance into a singlemonitor context.
There is, however, a downside related to using the Monitor as the source ofevent logs, as it only stores aggregated data. By default, this aggregated eventdata contains all kinds of metrics on the process level, which are required tocompute the necessary KPIs. Thus, if the sojourn time of a case happens tobe a KPI, then the timestamps of the first and last events will be stored asmetrics. Clearly, for process mining the event log should contain more detailedinformation on these events (like the name of the corresponding activity), andit should also contain this information for the other events. By default, thisinformation is not stored by the Monitor.
Fortunately, the monitor model can be easily adapted to our needs. Until now,we more or less have assumed that a monitor context would contain all events ofan entire process instance. The first event of a process instance typically createsthe monitor context, the last typically terminates it, while the other events justadd information to the running monitor context. However, it is not mandatoryto have monitor context correspond to a process instance. For example, it is alsopossible to have a monitor context for a single event, and to store the necessaryevent-related information required for process mining into that monitor context.This would fit our purposes nicely, as we can simply store all information weneed for a certain event into its corresponding monitor context.
For the process instance id, which is vital to process mining, it is importantto realize that process-instance-related events will have this id as the currentid (that is, ECSCurrentID), whereas the activity-related (BPEL invoke) eventswill have this as the parent id (ECSParentID). For this reason, it is importantto distinguish these two kinds of events. As a result, in our monitor context, wewill have two types of inbound events. Fig. 5 shows how the process instanceid can be defined for the Clips and Tacks example, where the AnyParentEventcorresponds to a process-instance-related event, and the AnyChildEvent to anactivity-related event.
Fig. 5 also shows a number of metrics for the event context, which includethe activity name, the resource name, and the creation time. This informationcan be retrieved from the standard event in a straightforward way, as Fig. 6shows for the creation time metric. For sake of completeness, we mention herehow the other metrics can be retrieved as well:
activityKind AnyChildEvent/BPELGenericData/bpc:activityKindactivityName AnyChildEvent/BPELGenericData/bpc:activityTemplateNameresourceName AnyChildEvent/BPELGenericData/bpc:principal
After having added this monitor context to our monitor model, we can rede-ploy our running Clips and Tacks example and extract the events. Each eventrefers to a process instance id and has an activity name, activity type, times-tamp, and selected data elements. Based on this we can apply a wide variety

Configuring IBM WebSphere Monitor for Process Mining 9
Fig. 5. Process instance id.
Fig. 6. Creation time.

10 H.M.W. Verbeek and W.M.P. van der Aalst
Fig. 7. Some process mining results using ProM 5.2

Configuring IBM WebSphere Monitor for Process Mining 11
of process mining techniques. Figure 7 shows a screenshot of ProM 5.2 whileanalyzing the Clips and Tacks log. The top-left window shows some informa-tion about the event log loaded. The top-right window shows the events usinga so-called “dotted chart”. This visualization provides a helicopter view of theprocesses and the resources involved. The bottom-left part of Figure 7 showstwo process models; one is discovered by the “fuzzy miner” and the other by the“FSM miner”. The bottom-middle window in shows an animation of the eventlogs on top of the discovered model. Such an animation can be used to visualizebottlenecks, hotspots, transient behavior, etc. The lower-right window shows asocial network extracted from the log. This model shows the cooperation amongthe resources involved.
Note that Figure 7 merely serves as an illustration of possible process min-ing results based on WebSphere logs. It demonstrates that through our ap-proach process mining comes into reach for WebSphere users. Due to spaceconstraints we cannot elaborate on the many types of analysis supported byProM 5.2 nor illustrate our approach using a more extensive example. For moreinformation on ProM and the various process mining techniques we refer towww.processmining.org.
5 Conclusions
The main conclusion of this paper is that process mining is possible in the contextof the IBM WebSphere suite, as it is quite easy to configure a monitor modelin such a way that the WebSphere Business Monitor (Monitor for short) willcollect the information required for an event log. This configuration is achievedthrough addition of a new monitor context. This context corresponds to a singleevent instead of to a single process instance. This single-event monitor contextwill contain all the information of an event that is relevant to process mining.
We have tried various alternative approaches, but all failed because of the lackof a clear instance concept that is consistent throughout the whole WebSpheresuite. Our findings will help developers and end-users interested in analyzingprocesses supported by WebSphere. The monitor based approach has been testedon various systems and example processes. Next we plan to conduct several in-depth case studies to evaluate the usability of our approach.
6 Acknowledgements
The research was supported by IBM Research & Development GmbH. The au-thors would like to thank Dave Enyeart, Eric Wayne, and Gerhard Pfau for theirhelp and feedback.

12 H.M.W. Verbeek and W.M.P. van der Aalst
References
1. W.M.P. van der Aalst, H.A. Reijers, and M. Song. Discovering Social Networksfrom Event Logs. Computer Supported Cooperative work, 14(6):549–593, 2005.
2. W.M.P. van der Aalst, H.A. Reijers, A.J.M.M. Weijters, B.F. van Dongen, A.K.Alves de Medeiros, M. Song, and H.M.W. Verbeek. Business Process Mining: AnIndustrial Application. Information Systems, 32(5):713–732, 2007.
3. W.M.P. van der Aalst, B.F. van Dongen, J. Herbst, L. Maruster, G. Schimm, andA.J.M.M. Weijters. Workflow Mining: A Survey of Issues and Approaches. Dataand Knowledge Engineering, 47(2):237–267, 2003.
4. W.M.P. van der Aalst, A.J.M.M. Weijters, and L. Maruster. Workflow Mining:Discovering Process Models from Event Logs. IEEE Transactions on Knowledgeand Data Engineering, 16(9):1128–1142, 2004.
5. R. Agrawal, D. Gunopulos, and F. Leymann. Mining Process Models from Work-flow Logs. In Sixth International Conference on Extending Database Technology,pages 469–483, 1998.
6. G.A. Chipaila. Mining Data in the Context of Semi-Structured Business Pro-cesses: Applying Process Mining in IBM WebSphere. Master’s thesis, EindhovenUniversity of Technology, 2007.
7. IBM Corporation. Business Process Management: Modeling through MonitoringUsing WebSphere V6.0.2 Products Redbook. www.redbooks.ibm.com, 2006.
8. A. Datta. Automating the Discovery of As-Is Business Process Models: Proba-bilistic and Algorithmic Approaches. Information Systems Research, 9(3):275–301,1998.
9. J. Desel and J. Esparza. Free Choice Petri Nets, volume 40 of Cambridge Tractsin Theoretical Computer Science. Cambridge University Press, Cambridge, UK,1995.
10. B.F. van Dongen and W.M.P. van der Aalst. Multi-Phase Process Mining: BuildingInstance Graphs. In P. Atzeni, W. Chu, H. Lu, S. Zhou, and T.W. Ling, editors, In-ternational Conference on Conceptual Modeling (ER 2004), volume 3288 of LectureNotes in Computer Science, pages 362–376. Springer-Verlag, Berlin, 2004.
11. J. Herbst. A Machine Learning Approach to Workflow Management. In Proceedings11th European Conference on Machine Learning, volume 1810 of Lecture Notes inComputer Science, pages 183–194. Springer-Verlag, Berlin, 2000.
12. W. Reisig and G. Rozenberg, editors. Lectures on Petri Nets I: Basic Models,volume 1491 of Lecture Notes in Computer Science. Springer-Verlag, Berlin, 1998.
13. A. Rozinat and W.M.P. van der Aalst. Conformance Testing: Measuring the Fitand Appropriateness of Event Logs and Process Models. In C. Bussler et al., editor,BPM 2005 Workshops (Workshop on Business Process Intelligence), volume 3812of Lecture Notes in Computer Science, pages 163–176. Springer-Verlag, Berlin,2006.
14. A.J.M.M. Weijters and W.M.P. van der Aalst. Rediscovering Workflow Modelsfrom Event-Based Data using Little Thumb. Integrated Computer-Aided Engi-neering, 10(2):151–162, 2003.