conacyt overview & paraguay sti system - …€œdeveloping a culture of science, technology,...
TRANSCRIPT
“Developing a Culture of Science, Technology, Innovation and Quality in Paraguay”
CONACYT Overview & ParaguaySTI System
Idelin Molinas Vega, Ph.D., PMPExecutive Secretary
February 2017

Road Map
Paraguay Overview CONACYT in context
◦ Mission and Policies◦ Strategies and Initiatives
Main STI Indicators R&D Projects and Innovation Results Challenges and Next Steps Key Success Factors


Paraguay at a Glance
DESCRIPTION PARAGUAY
GDP (US$ billions) - 2015(*) 28,10
GDP per capita (USD$) - 2015 (*) 4.010
GDP (PPP) per capita (US$) - 2015 (*) 8.708
Exports/GDP 29,9%
% Poverty/Total Population(% extreme poverty) - 2015 22,24% (9,97%)
Area (1000 km2) 406,80
Population (millions) - 2015 (*) 7,00
(*)Fuente: Global Competitiveness Report 2015-2016

DESCRIPCIÓN PARAGUAY EL SALVADOR URUGUAY COSTA RICA
GDP (US$ billions)(*) 28,10 25,80 53,80 52,90
GDP per capita (USD$) (*) 4.010 4.040 15.748 10.936
GDP (PPP) per capita(US$) (*) 8.708 8.303 21.507 15.482
Area (1000 km2) 406,80 21,00 176.2 51.1
Population (millions) (*) 7,00 6,40 3,40 4,80
Global Competitive Report2015-2016 (140 countries)– 12 pillars
118 95 73 52
Global Innovation Index(128 countries) 2016 – 7pillars
94 104 62 45
(*)Fuente: Global Competitiveness Report 2015-2016
PY and other LA Countries

Paraguay Exports - TechnologicalSophistication Level
Aggregate Level 2007 2010 2013 2016
Raw Material 43% 55% 59% 56%
Processed Raw Material 10% 8% 10% 10%
Low Technology 4% 4% 4% 4%
Medium Technology 2% 1% 2% 3%
High Technology 1% 1% 1% 1%
Other Transactions / w/o specified level 40% 31% 24% 26%
Total (Thousands US$ CIF) 4.723.764 6.504.792 9.456.264 8.493.664
Paraguay’s Exports (selected years)

Vision of Paraguay 2030 (highlights)
A competitive Paraguay, ranked among the most efficient producers of food
with vibrant and innovative industries, employing highly qualified workforce
Provider of high technology products in a knowledge-based economy
Connected and open to the neighbors and the world
Indices of social development in the highest ranks of South America
Environmentally and economically sustainable
A high level of legal and public security
Attention to indigenous peoples, a strong role of women in the society, and trained
young visionaries leading the country
A supportive and transparent state that promotes equal opportunity

PovertyReduction& SocialDevelopment
PovertyReduction& SocialDevelopment
InclusiveEconomicGrowth
InclusiveEconomicGrowth
Insertion ofParaguay inthe world
Insertion ofParaguay inthe world11 22 33
Strategies within the PND2030

• Established in 1997 (Law 1028/97)• Updated by Law 2279/03

CONACYT - MISSION
Coordinate, evaluate and promote the National
System of Science, Technology and Innovation and
the National System of Quality, generating and
promoting Public Policies and Strategies for
scientific and technological development, in a
social, ethical and environmentally sustainable
manner.

ExecutiveSecretary of
CONACYT (STI)
Council
PRESIDENT
General Directorateof Finance andAdministration
Presidency of the Republic
MICMAGMSPyBSSTPMEC
Public Univ.Private Univ.
FEPRINCOUIPAPYMEARP
Executive Secretary ofONA (National
Accreditation Agency)
National QualityCommission APC
PY ScientificSociety
Worker’s Union.
CONACYT
STAFF
MIC: Ministry of Industry & Commerce MAG: Ministry of Agriculture & LivestockMSyBS: Ministry of Health MEC: Ministry of Education and CultureSTP: National Planning Secretary FEPRINCO: Federation for Industry and CommerceUIP: Paraguayan Industry Chamber ARP: Rural Association of ParaguayAPYME: SME Association APC: Paraguayan Association for Quality

Main Initiatives Carried Out
Since 1999 Sector Assessment
2000 - 2003 National Science and Technology Public Policy –
2004 - 2012Launching of first set of instruments to promote
STI and Advance Human Capital training
2006 - 2009 Institutional Strengthening
2010 - 2016Launching of second set of instruments to
promote STI and Production Based Incentive forResearchers
2014 - 2019 Launching of third set of instruments to promoteS&T and AHC training
Public Policy for STI – Assessment and Revision2012 - 2017
S&T Demand Evaluation1999S&T Activities Survey– 2001 a 2012Bibliometric Indicators - 2006Innovation Survey – 2007
Enacted by Presidential Bill 19007 -October de 2002
PROCIT Program 2005 a 2012 –Financed by IDB
Increment in Public Budget (Infrastructure& hiring of administrative and technicalpersonnel) (2007 – 2009)
DeTIEC since 2010PRONII since 2011
Assessment of key variables andincorporation of Innovation (2013-2015)
Revision of Policy (2016-2017)Innovation Survey (2010-2012
PROCIENCIA 2014-2019S&T Activities Survey (2014-2015)
2016 - 2020 Launching of fourth set of instruments topromote Private Business Innovation
PROINNOVA 2016-2020Innovation survey (2013-2015) - ongoing

http://www.conacyt.gov.py/libro-blanco
White Book on Guidelines for a National Policy on Science,Technology and Innovation in Paraguay, 2014

Defines 4 Action Lines
Strengthening the role of CONACYT as rector of STI policy and as anarticulator of the network of STI activities among Sectorial Ministries,integrating R&D institutions, universities, Non-Profit STI organizations,Business Organizations and international networks for STI.
Promote scientific knowledge appropriation and its application tosocial innovation.
Increase innovation levels in private sectors as a mean of improvingcompetitiveness.
Strengthening of the National STI System through R&D and itscontribution to productive and social demands.
White Book on Guidelines for a National Policy on Science,Technology and Innovation in Paraguay, 2014

Prioritized Productive Sectors
Forestry andbiomass
Mining andMetallurgic
Agro industrialClusters
Transportationand Logistics
Clean andrenewable energy
Tourism andculturalindustries
Medium and hightechnology industries
Metal mechanicConstruction

Health
Social Securityand PublicSafety
Habitat
Education
Prioritized Social Sectors

Biotechnology Nanotechnology Information andCommunication Technologies -
ICT
Transversal Technologies

Prioritized Sectors from Different Sources
PND 2030 Industrial PolicyDpt (MIC)
REDIEX II(MIC) PTI
Food Food(*) FoodAgricultural
RelatedTechnologies
Logistic /Transport
Logistic /Transport
Logistic /Transport
Automatization &Control
ICT/SoftwareTextile /
Garments(*) Forestry ProductsICT & Computer
Science/Eng
KnowledgeEconomy Auto parts Manufacture
BusinessDevelopment
Plastics(*) TourismEnvironmental
Related Technol.
Footwear(*) Services & NewBusinesses
Energy RelatedTechnologies
Assembly(*) IADB (BID) has commissioned in-depth studies of these sector, 2016
NATIONALINNOVATION SYSTEM
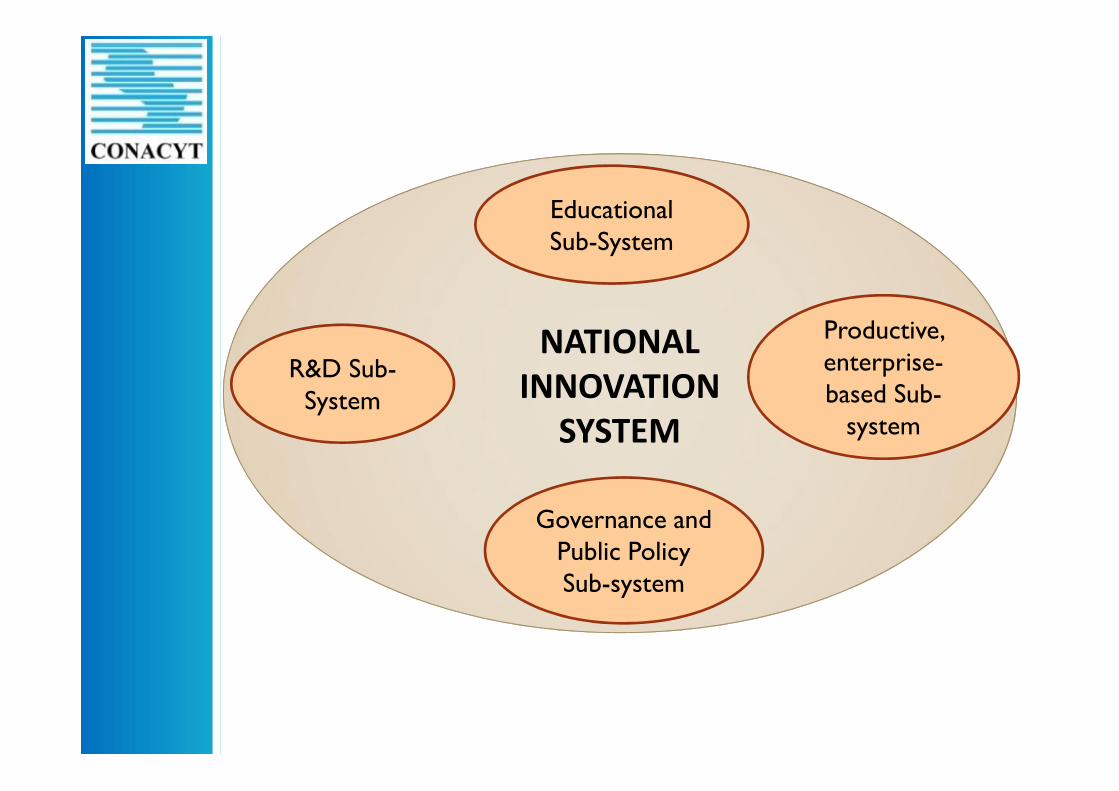
NATIONALINNOVATION
SYSTEM
EducationalSub-System
Productive,enterprise-based Sub-
system
Governance andPublic PolicySub-system
R&D Sub-System

NIS –Value Chain
• CONACYT’sInstruments
• FF10• FF30 – FONACIDE /
FOCEM• FF20 - Loans
NIS Actors•Universities•Research Centers•Office of TechnologicalTransfer
•Enterprises (Private Sector)•Public Sector
•Contribute to thesolution ofsocioeconomic andenvironmentalproblems
How do we Finance it?
Which tools do we have?
Which Stakeholders areInvolved? Why do we do it?
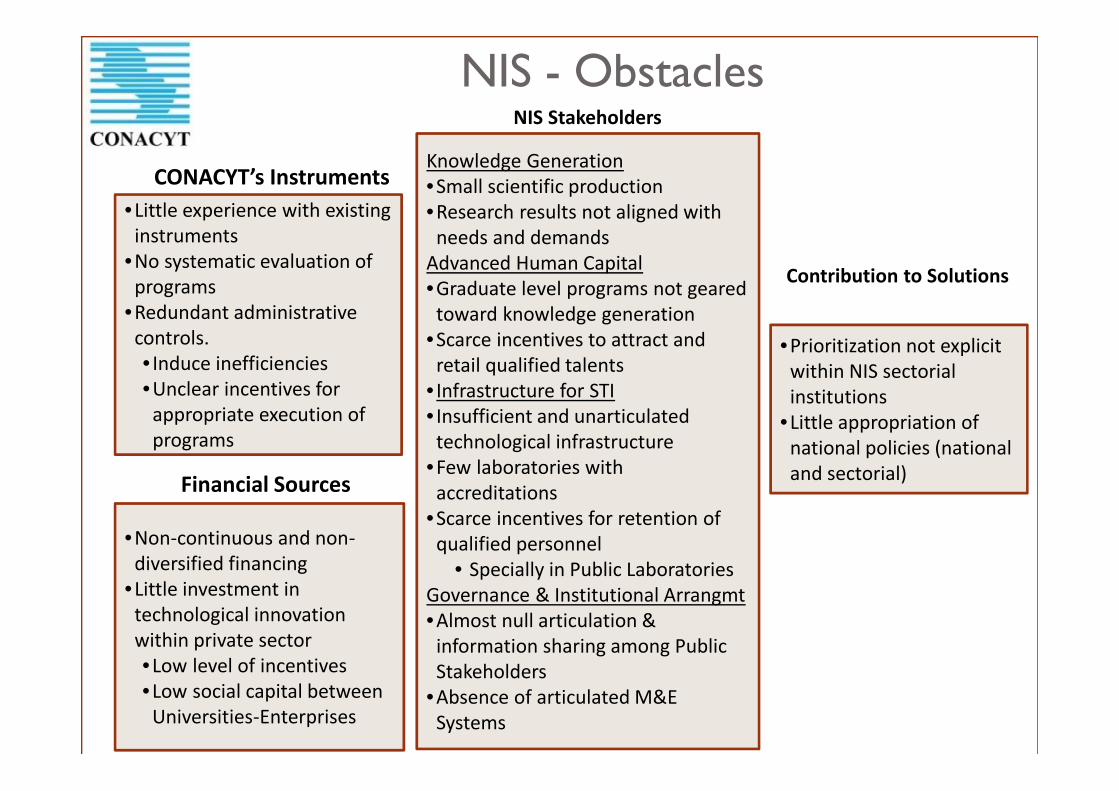
NIS - Obstacles
CONACYT
•Little experience with existinginstruments
•No systematic evaluation ofprograms
•Redundant administrativecontrols.• Induce inefficiencies•Unclear incentives for
appropriate execution ofprograms
•Non-continuous and non-diversified financing
•Little investment intechnological innovationwithin private sector•Low level of incentives•Low social capital between
Universities-Enterprises
Knowledge Generation•Small scientific production•Research results not aligned with
needs and demandsAdvanced Human Capital•Graduate level programs not geared
toward knowledge generation•Scarce incentives to attract and
retail qualified talents• Infrastructure for STI• Insufficient and unarticulated
technological infrastructure•Few laboratories with
accreditations•Scarce incentives for retention of
qualified personnel• Specially in Public Laboratories
Governance & Institutional Arrangmt•Almost null articulation &
information sharing among PublicStakeholders
•Absence of articulated M&ESystems
•Prioritization not explicitwithin NIS sectorialinstitutions
•Little appropriation ofnational policies (nationaland sectorial)Financial Sources
CONACYT’s Instruments
NIS Stakeholders
Contribution to Solutions

MAIN STI INDICATORS

Indicator 2012 2015
•R&D / GDP (%) - Govt & Academic (Avg. LAC:0,77%) 0,09 0,13
•Enterprise Funding/Total R&D Expenditure (%) 0,85 0,28
•R&D / GDP (%) – Manufacturing, IT, Services 0,03 -
•Number of Researchers / 1000 EAP(*) – (Avg.LAC 1,35) 0,48 0,53
•Number of Categorized Researchers (PRONII) 284 515
•Number of SCI publications 115 191
•Number of patent by residents 1 1
(*) Economically active population

R&D PROJECTS,INNOVATION RESULTSAND CHALLENGES

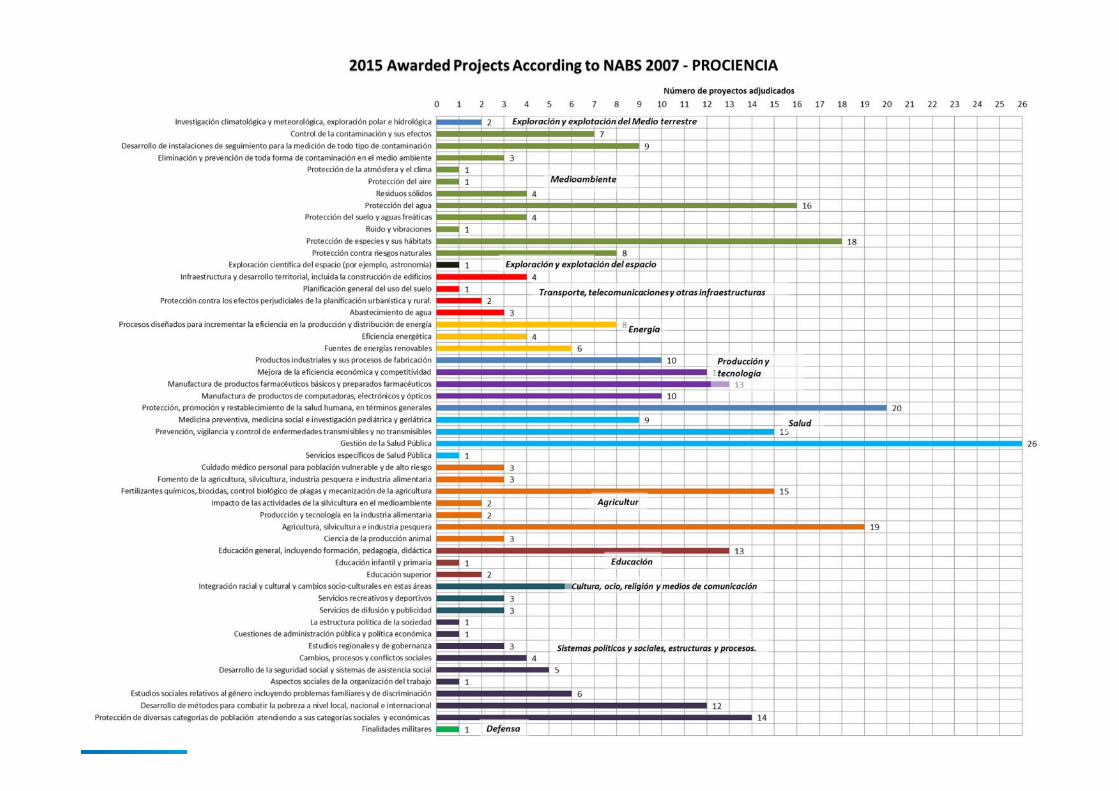
2015-2016 Awarded Projects Accordingto NABS 2007
Nr ofProjectsAwarded
% of TotalAmountAwarded
% of GrantValue
1 Exploration and exploitation of Earth 3 1% 1%2 Environment 95 18% 17%3 Exploration and exploitation of space 2 0% 1%4 Transport, telecommunication, and other infrastructures 17 3% 3%5 Energy 22 4% 4%6 Industrial production and technology 72 13% 12%7 Health 130 24% 26%8 Agriculture 71 13% 12%9 Education 25 5% 4%10 Culture, recreation, religion, and mass media 15 3% 3%11 Political and social systems, structures, and processes 83 15% 16%14 Defense 1 0% 0%
TOTAL 536 34.675.146 US$

R&D Project Awarded in 2015-2016(total of 536 projects awarded)
PrioritizedSector 2014 OSE NABS 2007 Nbr of Projects
Water 2.7, 2.8, 4.9, 27Energy Cap. 5 22
Agriculture Cap. 8 71Education Cap. 9 25
Health Cap. 7 130Total 275 (51%)
Environment (excl.Water)
Cap. 2 67
342 (64%)

Consideration for the Use/Applicationof Knowledge?
Low High¿Q
uest
for
fun
dam
enta
lun
ders
tand
ing? H
igh
Low
Source: Survey to International Peer Reviewers, Convocatoria-2014 and Convocatoria-2015
Conv-14: 10 %
Conv-15: 25 %
Conv-14: 49 %
Conv-15: 69%
Conv-14: 11 %
Conv-15: 1 %
Conv-14: 30 %
Conv-15: 5 %
Pasteur’s Quadrant – David Stokes (1987)Perception of International Peer Reviewers on the contribution of
awarded projects (Call for Proposals 2014 and 2015)

Private Sector Strategies for Innovation(*)
However, when compared to industrializedcountries it can be observed a large difference inthe portion assigned to R&D.
Strategies for innovation investment issimilar to the other countries in theregion
(*) Results from Innovation Survey (2013)

Level of Innovation(*)
64%
36%
0%
10%
20%
30%
40%
50%
60%
70%
Nivel firma Mercado nacional ointernacional
Level of Product Innovation(*) Results from Innovation Survey (2013)
Only 36% of reported product innovation were new to the national andinternational market.
Firm level innovation is consistent with large proportion of acquisition ofequipment as an innovation strategy

Source of Information for InnovationActivities(*)
Business that innovated also relied onuniversities, R&D Labs, patent andspecialized data bases, although still in avery small proportion.
0% 10% 20% 30% 40% 50% 60% 70% 80%
Internet
Proveedores
Clientes
Ferias, conferencias y exposiciones
Revistas y catálogos
Competidores
Consultores
Empresas relacionadas
Universidades
Bases de datos
Organismos Públicos
Empresas del Grupo
Otros
Patentes y propiedad intelectual
Laboratorios/Empresas de I+D
No Innovadora Innovadora
(*) Results from Innovation Survey (2013)
Main source of information are opensource (internet, magazines and fairs)or market (customer and suppliers)

Obstacles(*)
0% 5% 10% 15% 20% 25% 30% 35% 40%
Insuficientes incentivos a la innovación por…
Dificultad de acceso a financiamiento
Falta de personal calificado en mercado…
Carencia de personal calificado en la empresa
Dificultades financieras
Bajo ritmo de cambio tecnológico en el…
Reducido tamaño de mercado
Deficiencia en protección de DPI
Período de retorno excesívamente largo
Organización Industrial
Problemas de acceso a conocimiento
Baja receptividad de la demanda
Deficiencias en la infraestructura
Deficiencias organizativas
No Innovadora Innovadora
(*) Results from Innovation Survey (2013)
Main obstacle, according to respondents, is the lack of public policies that stimulatesinnovation. The following main obstacles are: lack of financial means (both, internal andexternal), as well as scarce competent personnel for innovation activities and management(both within the firms as well as within the market)

Taxonomy of Uruguayan InnovativeEnterprises (B. Baptista, 2016)
Technological Innovation based on science (G_TOT2– 5%-, G_TOT3 -5%- y G_TOT6 -6%-)
Exp: Knowledge Intensive Suppliers (KIS), sciencebased manufacture
Techno-organizational (incremental) innovations, basedon interactions (G_TOT1 -18%-)
Exp.: Agricultural based enterprises with orientation toprocessing
Techno-organizational (incremental) innovations, based onstrengthening internal capacities (G-TOT5 -9%-)
Process-based innovation, efforts biased toward incorporation ofEquipment and Capital Goods (G-TOT7 -17%-)
Exp.: capital intensive enterprises, infrastructure based services,traditional enterprise services
No innovative enterprises, with low capacities (G-TOT4 -40%-)
Exp.: wide arrange of enterprises, no distinction of productive sector or sub-sector
Usual R+D+Iprograms
TechnologyExtensionServices
(technologydiffusion &adoption)
Promotion(evangeliza-
ción)

STRATEGIES &INITIATIVES

National Development Plan 2030Public Policy of Science, Technology and Innovation
CompetentHHRR
EffectiveInstitutional
Communication
AppropriateTechnological
Support
EffectiveManagement
Leadership
Effective STIProgram’s
Definition andManagement
EffectiveResults
OrientedM&E System
EffectiveFinancial &
AdministrativeManagement
FosterDevelopment of
Advanced HumanCapital for STI
StrengthenInfrastructure for
STIFoster R+D+i
Develop,Articulate andDisseminate
Public Policies onSTI
PromoteknowledgeProduction
Promote InnovativeSolutions to National
Problems
Increase valorization ofSTI as an agent for socio-
economictransformations
Lear
ning
&Gr
owth
Inte
rnal
Proc
esse
sVa
lue
Adde
dSe
rvice
sC
ontr
ibut
ion
to S
ocie
ty
EffectiveOrganization
al Design
NbrResearchers/
KPEA
R&DInvestment
/ PIB
NbrPatents/
MHab
R & D & i/ Sales
Draft
EffectiveProspecting and
TechnologicalVigilance

Initiative Status Funding
• R&D Competitive Funds Ongoing PROCIENCIA
•Innovation Projects Competitive Funds Ongoing DeTIEC/PROINNOVA
•Support for research results transfer toproductive sector (OTRI) Ongoing PROCIENCIA
•Support for Technological TransferOffices (CDTs) Ongoing DeTIEC /
PROINNOVA
•Support for Business Incubators Ongoing DeTIEC /PROINNOVA
• Technological Missions 1Q2017 PROINNOVA
•Access to scientific and technologicaldatabases Ongoing PROCIENCIA
•Support for Ph.D. in industries ..
•Support for young engineers in SMEs --
Objective: Foster R+D+I (*)
(*) This is an example. For each strategic objective, a list of initiatives (instruments)have been defined, some of them are undergoing, but some still need to be funded

Current Main Initiatives
PROCIENCIA (2014-2019): a 125 MUSD focused on R&D◦ Competitive funds for R&D projects◦ Incentive to Researchers based on scientific production◦ Support for Advanced Human Capital training◦ Competitive R&D Infrastructure funds◦ Support for research results transfer to productive sector◦ Support for Short-term exchange for Researchers and Tech
Personnel
DeTIEC (2010-2016) : a 6.6 MUSD program focused onInnovation Projects & the National Quality System◦ Competitive funds for innovation projects◦ Support for Technological Transfer Offices (CDTs)◦ Support for Business Incubators

Current Main Initiatives - cont.
PROINNOVA (2017-2021): a 10 MUSD focused onPrivate Sector Innovation◦ Competitive funds for innovation projects◦ Support for Technology & Innovation Management programs
with focus on SMEs (culture and needs)◦ Support for technology based new enterprises◦ Support for Technological Transfer Offices (CDTs)◦ Support for Business Incubators
Other Initiatives underwayEvaluation of supported innovation projects and incubatorsNational survey of R&D Equipment

LOOKING FORWARD

Challenges and Next Steps
Low R&D investment as compared to the region and OCDEcountries◦ Both private and public/academic sectors
R&D results on socioeconomic objectives are aligned withcountry’s needs but must be monitored to gain effectivenessand improve support from society, including enterprises
Very low connection between Universities/Research Centersand Enterprises
Level of product innovation in private sector must beimproved to increase firm and country competitiveness◦ Focus on technology transfer
Role of CONACYT as an articulator among STI institutionneeds to be strengthen
Public policy and STI instruments need to focus on few buteffective sectors, both in productive and social areas

Selected STI Indicators to 20302015 LAC 2014 2030
GDP (millions PPC) 61.021 153.031EAP (*) (millions) 3,49 17,20 4,52R&D Investment (millions PPC) 79 765R&D/GDP 0,13 0,76 0,50%Enterprises contribution to R&D/GDP (% of total) 0,28% 36,61% 35%Enterprises contribution to R&D(millions PPC) 0,22 267,80Government contribution to R&D/GDP (% oftotal) 73,09% 59,26% 64%Government contribution to R&D(millions PPC) 57,98 489,70Researchers (EJC) 1.126 6.781Researchers / 1000 EAP 0,53 1,45 1,50Doctorate Graduates 87 24.750 1.067Annual investment per Researcher (thousands PPP) 30.000 143.000 112.836Patent Applications (residents) 16 70Publications listed on SCI 129 81.784 930
Note: in Green are established targets and in Blue areprojected values (aligned with targets)Fuente: R. Barrere, “Proyecciones de Indicadores de ACT 2030 para el CONACYT”, 2016
(*) EAP: Economically active population

Key Success Factors
Competent and Motivated Team
Clear leadership from all organizational levels
Evidence based decision making
Procedures and IT tools to facilitate management ofR+D+I programs
Synergic work among public institutions to fosterR+D+I

¡¡GRACIAS!!
THANKYOU!