concentration in lending: commercial vs financial credits lucia gibilaro lecturer of economics and...
Post on 21-Dec-2015
214 views
TRANSCRIPT
Concentration in lending:commercial vs financial
creditsLucia Gibilaro
Lecturer of Economics and Management of Financial IntermediariesUniversity of Bergamo – Faculty of Economics
and
Gianluca MattarocciLecturer of Economics and Management of Financial Intermediaries
University of Rome “Tor Vergata” – Faculty of Economics
Research questions
Which are approaches allowed to measure concentration risk?Could differences among commercial and financial credits impact on concentration measures?Looking at Italian market, are there differences on concentration estimates for different types of financial instruments on the basis of criterion adopted?

Structure
IntroductionSingle name concentration vs sectoral / geographical concentrationThe characteristics of financial and commercial creditsEvidence from the Italian marketFinal remarks

Introduction
Pillar I“… limits are established on the basis of the risk
exposure and of the amount of lending offered to each counterparty …” (Bank of Italy, 2006)
Pillar II“ To define the amount of economic capital, Banks
and financial groups estimate or evaluate all risk exposures using methodologies that fit the best…” (Bank of Italy, 2006)

Structure
IntroductionSingle name concentration vs sectoral / geographical concentrationThe characteristics of financial and commercial creditsEvidence from the Italian marketFinal remarks

Single name vs sectoral / geographical concentration (1/2)
Single name concentration considers non-systematic risk linked to specific characteristics of counterparties
The relevance of this type of risk could be explained by:
the collusion risk; the risk of illiquidity of assets.

Single name vs sectoral / geographical concentration (2/2)
The impact of macroeconomic dynamics on each counterparty is influenced by the characteristic of the context where the enterprise works (sector and / or geographical area)
Diversification on the basis of geographical and sectoral aspects allow to reduce the overall risk of lending portfolio but too much diversification implies an high level of screening and monitoring costs
Structure
IntroductionSingle name concentration vs sectoral / geographical concentrationThe characteristics of financial and commercial creditsEvidence from the Italian marketFinal remarks

The characteristics of financial and commercial credits (1/2)
Financial credits
Financial determinants
- Rating- Assets- Guarantees- etc…
Commercial credits
Financial determinants+Real determinants
- Guarantee of product quality- Price discrimination tool- Enhancement of customers
loyalty- etc…

The characteristics of financial and commercial credits (2/2)
The single name approach fits the best to estimate the concentration risk for commercial credits if the role of financial determinants prevails
Some empirical evidences demonstrate that commercial credits are more single name concentrated respect to financial onesIf there is a difference in single name concentration, it must be considered a signal of higher risk of these types of lending or it is only related to the contract characteristics

Structure
IntroductionSingle name concentration vs sectoral / geographical concentrationThe characteristics of financial and commercial creditsEvidence from the Italian marketFinal remarks

Evidence from the Italian market (1/7)
Sample
Financial CreditsOfficial statistics
Source: Bank of Italy data
Commercial CreditsFactoring as a proxy of commercial credits
Source: Assifact data
Time horizon: 2003 – 2006Frequency of data collected: quarterly
Type of data collected:- Amount of overall credit classified for sector and geographical region- Exposure to Top customers - Default

Evidence from the Italian market (2/7)
Methodology
Single name concentration
Sectoral / geographical concentration
n
i Tot
it Exp
ExpCR
1
n
iiit pxEExp
nG
1
ˆ1
2
n
i
Tot
i
Tot
i
t n
ExpExp
ExpExp
H1 log
log
n
i
Tot
i
Tot
i
Tot
i
Tot
i
t
ExppxE
ExpExp
ExppxE
ExpExp
nD
1ˆ
ˆ
1
Gini index Entropy index Relative distance index

Evidence from the Italian market (3/7)
Mean CR
RangeCR
Factoring companies
12.40% 26.57% - 4.89%
Banks 7.01% 8.33% - 6.25%
Single name concentration
Biggest banks 12.19% 14.37% - 10.31%
Big banks 10.65% 12.33% - 9.71%
Medium banks 11.22% 12.52% - 10.25%
Small banks 9.52% 10.56% - 8.75%
Smallest banks 6.01% 7.12% - 4.13%

Evidence from the Italian market (4/7)
Statistics
Counterpart evaluated
OverallTransferor
Pro-solvendo
Transferor Pro-solvendo
Debtor Pro-soluto
Number of defaults for big exposures respect total number
Mean 2.34% 0.12% 3.75% 0.86%
Range0.00% - 15.67%
0.00% - 1.47%
0.01% - 16.14%
0.00% - 6.07%
Amount of defaults related to big exposures respect to overall defaults
Mean 3.69% 1.23% 3.15% 1.31%
Range1.00% - 10.00%
1.00% - 3.00%
1.00% - 7.00%1.00% – 2.00%
Defaults and single name concentration

Evidence from the Italian market (5/7)
Gini Index Entropy index
Mean Range Mean Range
Financial credits Overall 68.18% 69.41% - 66.51% 74.62%73.56% - 76.03%
Commercial credits
Overall 71.04% 71.91% – 70.36% 72.55%41.41% - 81.07%
Pro-soluto 66.01% 64.78% - 66.90% 72.59% 43.70% - 79.64
Pro-solvendo
77.33% 76.15% - 78.90% 76.96%71.48% - 87.58%
Relative distance index for
commercial credit respect to
financial credits
Mean RangeRegions with higher
and lower differences
Overall 36.26% 0.05% - 92.13% Lazio – Molise
Pro-soluto 24.05% 0.10% - 96.84% Toscana – Molise
Pro-solvendo
24.62% 0.04% - 95.21% Lombardia – Molise
Geographical concentration
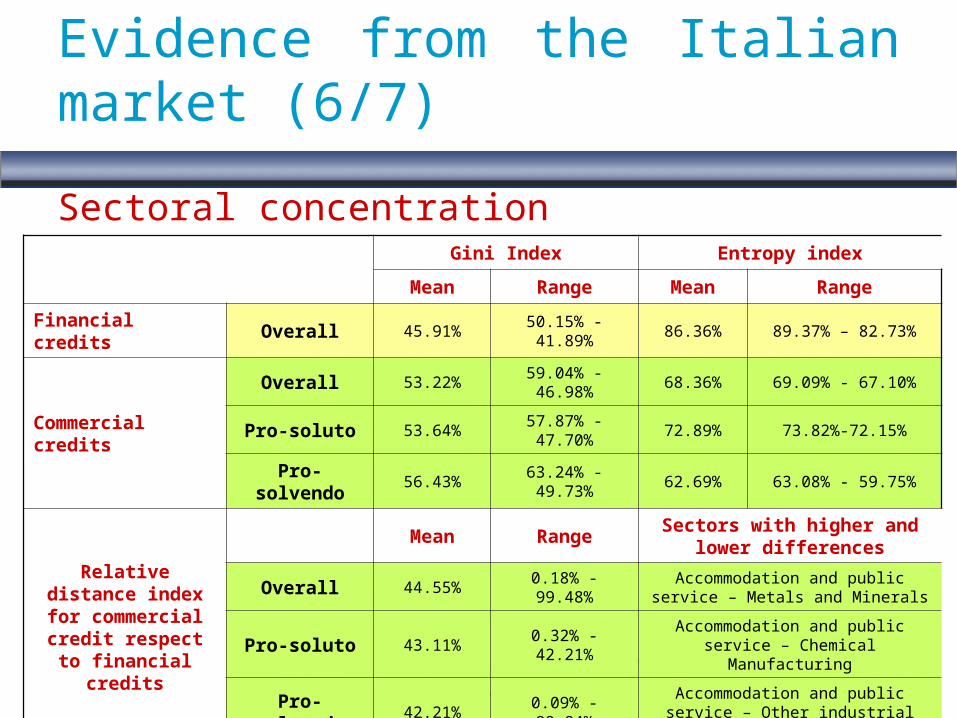
Evidence from the Italian market (6/7)
Gini Index Entropy index
Mean Range Mean Range
Financial credits Overall 45.91%50.15% - 41.89%
86.36% 89.37% – 82.73%
Commercial credits
Overall 53.22%59.04% - 46.98%
68.36% 69.09% - 67.10%
Pro-soluto 53.64%57.87% - 47.70%
72.89% 73.82%-72.15%
Pro-solvendo
56.43%63.24% - 49.73%
62.69% 63.08% - 59.75%
Relative distance index for
commercial credit respect to financial credits
Mean RangeSectors with higher and
lower differences
Overall 44.55% 0.18% - 99.48%Accommodation and public service
– Metals and Minerals
Pro-soluto 43.11% 0.32% - 42.21%Accommodation and public service
– Chemical Manufacturing
Pro-solvendo
42.21% 0.09% - 99.84%Accommodation and public service
– Other industrial products
Sectoral concentration

Evidence from the Italian market (7/7)
Defaults and sectoral / geographical concentration for commercial credits
Coherence between starting exposure and
defaults for each category
Coherence between starting exposure and defaults for group of
categories
Media Max Min Media Max Min
Sectoral classification 13.16% 26.32% 5.26% 92.54% 94.74% 78.85%
Geographical classification
9.21% 21.05% 0.00% 50.00% 63.16% 36.84%
Structure
IntroductionSingle name concentration vs sectoral / geographical concentrationThe characteristics of financial and commercial credits Evidence from the Italian marketFinal remarks
Final remarks
Commercial credits are structurally more concentrated respect to financial onesHigher level of single name concentration for commercial credits does not impact on the riskiness of lendingsGeographical and sectoral concentration in commercial credits are better proxies for the riskiness of counterparties’ portfolios

Thanks for your attention
Contact information:
Gianluca Mattaroccie-mail [email protected]. +390672595930