concentration processes under tubesheet sludge … library/njc-1-2-06.pdf · concentration...
TRANSCRIPT
Concentration Processes under Tubesheet SludgePiles in Nuclear Steam Generators
F. Gonzalez and P. SpekkensOntario Hydro Research Division800 Kipling AvenueToronto, OntarioM8Z554
AbstractThe process by which bulk water solutes are concentratedunuer tubesheet sluuge piles in nuc.;!eClr sleClrTl generClturswas investigated in the laboratory under simulated CANDU
operating conditions. Concentration rates were found to depend on the tube heat flux and pile depth, although beyond acritical depth the concentration efficiency decreased. Thisefficiency could be expressed by a concentration coefficient.and was found to depend also on the sludge pile porosity.Solute concentration profiles in the sludge pile suggested thatthe concentration mechanism in a high-porosity / permeabilitypile is characterized by boiling mainly near or at the tubesurface, while in low-porosity piles, the change of phase mayalso become important in the body of the sludge pile. In allcases, the full depth of the pile was active to some extent inthe concentration process. As long as the heat transfer underthe pile was continued, the solute remained under the pile andslowly migrated toward the bottom. When the heat transferwas stopped, the solute diffused back into the bulk solution ata rate slower than that of the concentration process.
ResumeL:accumulation des especes chimiques solubles sous lesdepots de produits de corrosion sur la plaque tubulaire desgenerateurs de vapeur dans les centrales nucleaires CANDU aEM etudie au laboratoire. Le taux de concentration depend duflux thermique ainsi que de I'epaisseur des depots. Au delad'une profondeur critique. I'efficacite de concentration diminue. Cette efficacite peut etre exprimee par un Coefficient de
Concentration, qui depend aussi de la porosite des depots. La
distribution des solutes dans les depots indique que dans Iecas des depots aporosite elevee, I'ebullition a lieu pres de lasurface des tubes, tandis qu'avec des depots de porositebasse, I'ebullition dans la masse des depots devient plus
importante. Dans tous les cas, la profondeur entiere desdepots est plus ou moins active dans I'accumulation desimpuretes. Tant que Ie transport de chaleur continue, lessolutes restent sous les depots et sont transportes de plus enplus profondement. Quand Ie transport thermique cesse, lessolutes retournent par diffusion vers I'eau du generateur devapeur. Ce processus de diffusion est beaucoup plus lent quecelui de concentration.
IntroductionSteam generators are crucial components of pressurized water reactors. Steam generator failure as a resultof tube degradation has been a major cause of PWR
plant unavailability world-wide. Steam generator problems have caused major economic losses in terms oflostelectricity production through forced unit outages,and, in cases of extreme damage, as additional directcosts for large-scale repair or replacement of steamgenerators.
Steam generator tubes are susceptible to failure by avariety of mechanisms, the vast majority of which arerelated to corrosion [1]. Although in some cases thisattack has occurred on the inside of the tubes (i.e. inthe primary coolant), it has more usually originated onthe outside of the tubes or on the tube support structures (support plates, lattice bars, tubesheets, scallopbars) on the secondary side of the steam generator.
The feedwater that enters the steam generators undernormal operating conditions is extremely pure, butnevertheless contains low levels (generally in the J.1g / Lconcentration range) of impurities such as iron, copper, chloride, sulphate, etc. When water is convertedto steam and exits the steam generator, the non-volatileimpurities are left behind. As a result, their concentrations in the bulk steam generator water are considerably higher than those in the feedwater. Nevertheless,the concentrations of corrosive impurities are still generally sufficiently low that the bulk water is not significantly aggressive towards steam generator materials(in exceptional circumstances, such as massive condenser failures or major make-up water treatment plant
Keywords: steam generator, sludge piles, tubesheet, hideout, concentration processes, dry-out, corrosion product deposits,secondary side, water chemistry, feedwater, thermalhydraulics, boiling, modelling.
NUCLEAR JOURNAL OF CANADA / 1:2 / pp. 129-140 129

excursions, bulk steam generator water chemistry maydeteriorate sufficiently to become directly aggressive,but such occurrences are relatively rare). However, incertain restricted-flow areas at the heat transfer surface, boiling causes further localized increases in impurity concentrations, and conditions may developthat are aggressive to steam generator materials.
The performance of the recirculating steam generators in Ontario Hydro CANDU plants has been outstanding. The percentage of tubes plugged (-0.02%)is well below the industry average of -2%. Steamgenerator tube integrity is particularly important in aCANDU reactor because of the severe economic penaltyof losing heavy water from the primary system. Theexcellent performance to date of CANDU steam generators can be attributed, in part, to their design andperformance characteristics, which typically involvehigher recirculation ratios and lower heat fluxes andtemperatures than do other PWR steam generators.Tube support structures are either tri-foil broachedplates or lattice bar supports, thus minimizing the likelihood of 'denting' attack. There are no deep tube /tubesheet crevices because of a roll near the secondaryface of the tubesheet.
Tubesheet Sludge PilesSludge piles have accumulated on the tubesheets inCANDU units, as in most steam generators world-wide.In this region, the thermalhydraulic conditions arefavorable for particle formation and deposition. Thesludge piles are kidney-shaped and are deepest in themiddle of the hot leg bundle. At the Bruce 'A' plant,the piles are estimated to be up to 12 cm deep, while inthe Pickering 'A' steam generators they are up to 50 cmin depth. The sludge piles have been determined to berock-hard, despite the fact that the units have alwaysused A VT chemical control. Analysis of the sludgesamples indicates that their main constituents are magnetite and elemental copper. In the Pickering samples,high concentrations of silicates and sulphates of calcium and magnesium have been detected. These are theresult of chronic condenser leakage experienced in thePickering 'A' units. The Pickering sludge samples werefound to have high compressive strength (-17MPa)and relatively low porosity (between 20 and 35%).Some of the samples showed a layered structure, withplatelets of magnetite embedded in a matrix of calciumsulphate / silicate. The composition and structure ofthe samples are indicative of considerable in situ precipitation and recrystallization of the constituents,presumably driven by temperature and concentrationgradients in the porous sludge pile [2].
Ontario Hydro is conducting a research program toinvestigate corrosion processes under tubesheet sludgepiles, since this is the area where our steam generatorsare judged to be at greatest risk of widespread degradation. Although the build-up of concentrated solu-
130
tions in sludge piles and crevices is qualitatively understood, there are a number of aspects of the concentrationprocess where more detailed information is required inorder to predict the effect of operating events on materials integrity. Most of the detailed studies reportedto date have been carried out with tube / support platecrevices and tube / tubesheet crevices. While indicative of the overall processes that take place in confinedregions of steam generators, these results can not bedirectly applied to describe the behaviour under sludgepiles. This paper describes the results of experimentscarried out at Ontario Hydro to study the influence ofsome physical characteristics of sludge piles (depth,porosity) on the rate of accumulation of contaminants(so-called 'hideout'), on the de-concentration ('hideout return') of the contaminants when heat transferstops, and on the distribution of the contaminants inthe sludge pile.
Solute Concentration under Sludge PilesOn the free, unobstructed tube surfaces of a nuclearsteam generator, heat is transferred by nucleate boiling. In this process, the phase change occurs on thetube surface. The bubbles generated move away fromthe surface due to buoyancy forces and large quantities of liquid are also moved because of the turbulencegenerated, thus effectively preventing the accumulation of solutes which may be present in the bulk water.Concentration factors of only five or less have beenmeasured in this type of boiling [3].
The mechanisms of the boiling process in confinedregions can be drastically different. The flow of liquidto the heat transfer surface may be insufficient compared to the amount required to sustain nucleate boiling. Vapour tends to stay near the heat transfer surface, since it cannot easily escape. The remainingliquid is not replaced as effectively as in the nucleateboiling process, and as a consequence it may becomeenriched in the bulk water solutes.
The accumulation of vapour near the heat transfersurface increases the resistance of the medium to heattransfer. Consequently, monitoring the temperature ofthe tube wall can provide an indication of the heattransfer regime. This approach has been used andresults are reported in the literature [4].
Although the heat transfer process determines thevaporization rate, and this in turn the concentrationrate under the pile of the bulk water solutes, certainaspects of the mass transfer process cannot be wellunderstood from the heat transfer data alone. Forintance, in an alternate wetting and drying condition,the tube surface temperature changes with variablefrequency, depending on the degree of dry-out in theregion. To relate the wetting and drying frequencywith the concentration rate is quite complex.
The flow of liquid in a boiling process under aporous body is determined by capillary forces. Several
flow configurations have been postulated. The liquidmay flow towards the heat transfer surface along smallpores, where capillary forces are important, while thesteam flows away from the heat transfer surface throughthe larger pores. Alternatively, the liquid may be flowing along the periphery of the pores while escapingsteam flows through the centre [4]. In either case, theconcentration process under the sludge pile is stronglydependent on the structure of the porous body and onheat transfer parameters that determine the flow pattern. While wall temperature measurements can beindicative of the heat transfer process, they fail toexplain fully the mass transfer into the pile. Therefore,it is necessary to measure directly solute concentrations to characterize the process. This was the approachfollowed in the present study.
ExperimentalTwo series of experiments were carried out (series Aand B, respectively). Each series consisted of tests todetermine concentration / deconcentration rates, andtests to characterize the concentration profiles in thesludge.
Autoclave VesselsThe experimental apparatus consisted of a four-litreInconel600 autoclave, equipped with a temperaturecontrol system and a small volume «10 mL) samplingcondenser. The autoclave lid had several access ports,three of which allowed the insertion of the test probes.The remainder were connected with the control instrumentation. The autoclave was part of a high-pressureloop and could be operated in a refreshed mode or in astatic mode.
IHELIUM
CONNECTION
HEATEDLENGTH
ARMOURED CONDUIT
CARTRIDGE HEATER
r///I~_STAINLESSSTEEL FITTING
ALLOY TUBE
HELIUM INTERFACE
THERMOCOUPLE POSITION
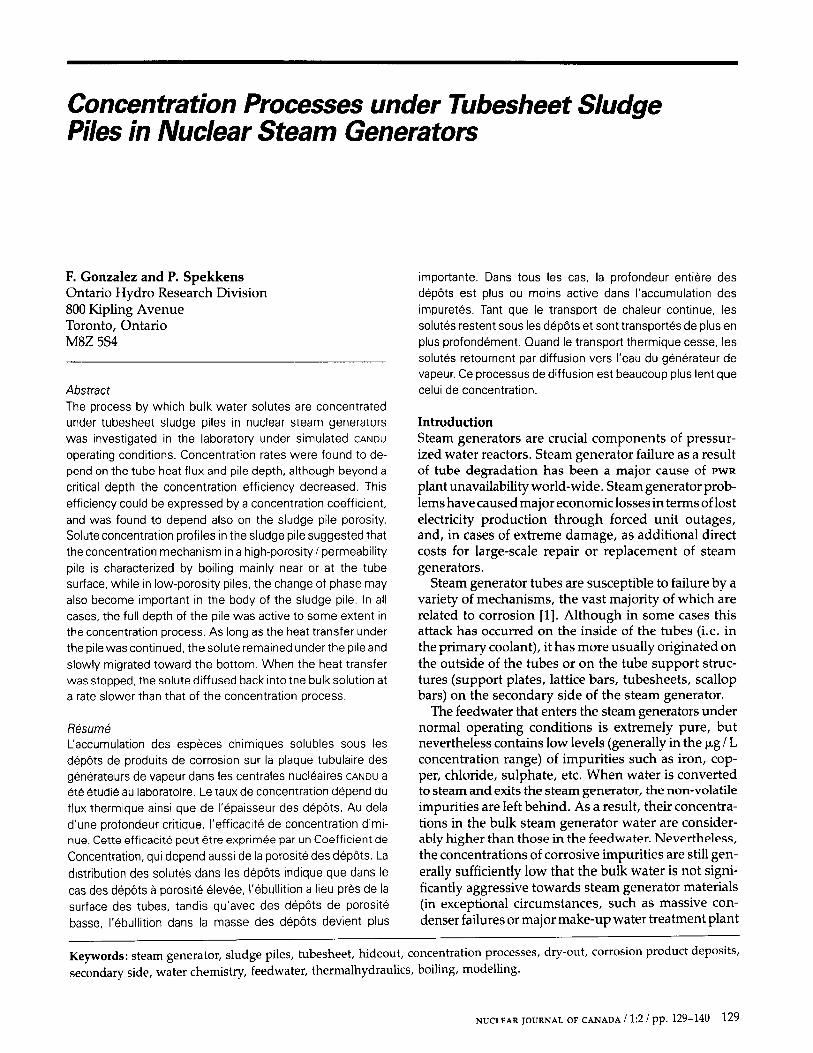
Test ProbesThe two series of experiments used test probes ofdifferent designs. The probes used in the series A testswere constructed by welding a length of steam generator alloy tube (Inconel600, 13mm o.d.) to a stainlesssteel fitting that could be attached to the autoclave lid.Electric cartridge heaters (9.5 mm diameter) were inserted into the probes, and the gap between the heaterand the tube was pressurized with helium at a pressure of 9 MPa (see Figure 1). Helium was chosen for itshigh thermal conductivity and chemical inertness.
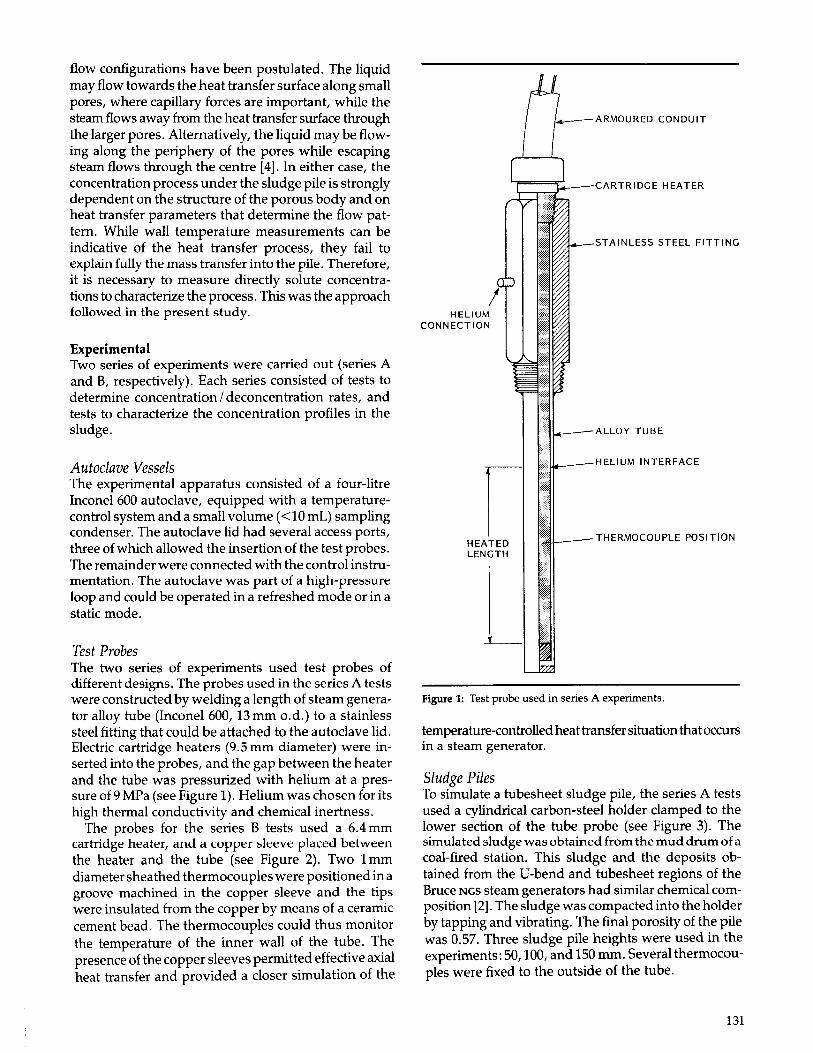
The probes for the series B tests used a 6.4 mmcartridge heater, and a copper sleeve placed betweenthe heater and the tube (see Figure 2). Two 1mmdiameter sheathed thermocouples were positioned in agroove machined in the copper sleeve and the tipswere insulated from the copper by means of a ceramiccement bead. The thermocouples could thus monitorthe temperature of the inner wall of the tube. Thepresence of the copper sleeves permitted effective axialheat transfer and provided a closer simulation of the
Figure 1: Test probe used in series A experiments.
temperature-controlledheat transfer situation thatoccursin a steam generator.
Sludge PilesTo simulate a tubesheet sludge pile, the series A testsused a cylindrical carbon-steel holder clamped to thelower section of the tube probe (see Figure 3). Thesimulated sludge was obtained from the mud drum ofacoal-fired station. This sludge and the deposits obtained from the V-bend and tubesheet regions of theBruce NGS steam generators had similar chemical composition [2]. The sludge was compacted into the holderby tapping and vibrating. The final porosity of the pilewas 0.57. Three sludge pile heights were used in theexperiments: 50, 100, and 150 mm. Several thermocouples were fixed to the outside of the tube.
131
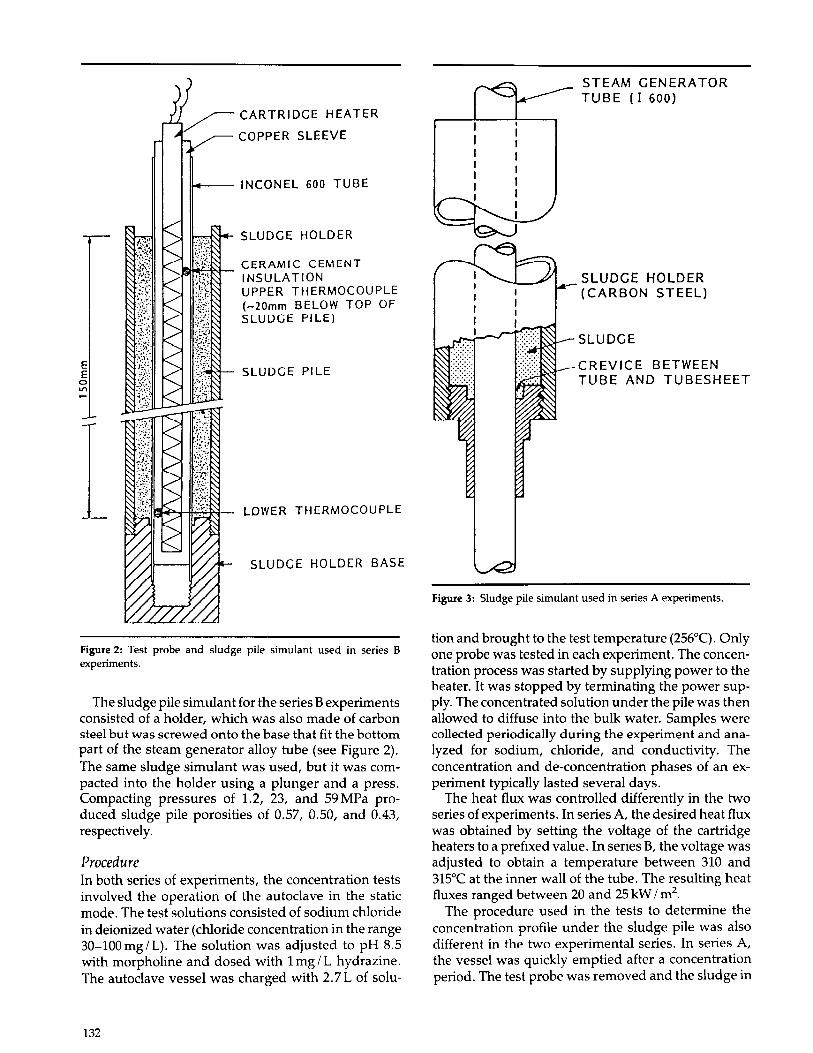
Figure 2: Test probe and sludge pile simulant used in series Bexperiments.
ProcedureIn both series of experiments, the concentration testsinvolved the operation of the autoclave in the staticmode. The test solutions consisted of sodium chloridein deionized water (chloride concentration in the range30-100mg/L). The solution was adjusted to pH 8.5with morpholine and dosed with 1mg/L hydrazine.The autoclave vessel was charged with 2.7 L of solu-
STEAM GENERATORTUBE (I 600)
SLUDGE HOLDER(CARBON STEEL)
SLUDGE
CREVICE BETWEENTUBE AND TUBESHEET
Figure 3: Sludge pile simulant used in series A experiments.
tion and brought to the test temperature (256°C). Onlyone probe was tested in each experiment. The concentration process was started by supplying power to theheater. It was stopped by terminating the power supply. The concentrated solution under the pile was thenallowed to diffuse into the bulk water. Samples werecollected periodically during the experiment and analyzed for sodium, chloride, and conductivity. Theconcentration and de-concentration phases of an experiment typically lasted several days.
The heat flux was controlled differently in the twoseries of experiments. In series A, the desired heat fluxwas obtained by setting the voltage of the cartridgeheaters to a prefixed value. In series 5, the voltage wasadjusted to obtain a temperature between 310 and315°C at the inner wall of the tube. The resulting heatfluxes ranged between 20 and 25 kW / m2
.
The procedure used in the tests to determine theconcentration profile under the sludge pile was alsodifferent in the two experimental series. In series A,the vessel was quickly emptied after a concentrationperiod. The test probe was removed and the sludge in
SLUDGE HOLDER BASE
LOWER THERMOCOUPLE
SLUDGE PILE
SLUDGE HOLDER
INCONEL 600 TUBE
CARTRIDGE HEATER
COPPER SLEEVE
......l!~~l-- CERAMIC CEMENTINSULATIONUPPER THERMOCOUPLE(-20mm BELOW TOP OFSLUDGE PI LE)
The sludge pile simulant for the series Bexperimentsconsisted of a holder, which was also made of carbonsteel but was screwed onto the base that fit the bottompart of the steam generator alloy tube (see Figure 2).The same sludge simulant was used, but it was compacted into the holder using a plunger and a press.Compacting pressures of 1.2, 23, and 59 MPa produced sludge pile porosities of 0.57, 0.50, and 0.43,respectively.
EEolI'l
132

the holder was extracted in 25-mm sections. The sodium and chloride content of each section was thendetermined. In series B, the vessel was operated in therefreshed mode to maintain a constant solution concentration of 100 mg / L chloride in the bulk water. Theheat transfer process in the three probes carried on foreight days. The system was then shut down and thevessel quickly emptied. The sludge pile simulants wereremoved and cut radially into l2-mm sections thatincluded the tube and carbon steel holder. Thesesections were mounted in epoxy resin and examined ina Scanning Electron Microscope (SEM) equipped withan Energy Dispersive X-ray attachment (EDXA) withmapping capabilities.
ResultsDynamics of Contaminant ConcentrationFigure 4 shows the variation of the bulk water chlorideconcentration with time for a typical experiment fromseries A (100 mm sludge pile, 40 kW / m2
). The soluteconcentration in the bulk water continuously decreasedafter time zero (when the heat transfer through thetube was started). After approximately 50 hours, thesolute concentration reached a value below the detectability limit of the analytic technique used (0.1 mg / L).As long as the heat transfer was maintained, the solutehideout in the sludge pile persisted. As soon as theheat transfer was stopped, the solute began to diffuseinto the bulk water. The slightly altered probe designused in the series B tests showed the same behaviour,as shown in Figure 5. This test was carried out with a150 mm sludge pile of porosity 0.50. In this experiment,as in others, the hideout return process was significantly slower than the concentration process. The samebehaviour as that illustrated in Figures 4 and 5 wasobserved in all the concentration tests with differentcombinations of pile heights, porosities and heat fluxes.
200 400 600 800TIME (HOURS)
+CARTRIDGE
HEATEROFF
+CARTRIDGE
HEATERON
Figure 5: Bulk water chloride concentration versus time for a typicalseries B experiment (sludge pile porosity: 0.50; sludge pile depth:150 mm; inner wall tube temperature: 310°C; heat flux: 20 kW / m2
).
100Z0-~I-...J 80< ....a:: 0\I--S~a:: 60U Wzl-0<u:C 40w~C...J-:Ja::m 200...JZ:z:-U
Influence of Pile Depth and Heat FluxIn the series A tests, the rate of concentration ofsodium chloride under the sludge pile was measured,atthree heat fluxes (40, 75, and 110 kW / m2) for the 50and 100-mm-deep sludge piles and at 40 kW / m2 for thelSO-mm-deep sludge pile. The concentration rates increased when the heat flux was increased. This isshown in Figure 6, where the sludge pile concentration factor is plotted versus time for a 50-mm-deepsludge pile at three heat fluxes. The concentrationfactor is defined here as the solute concentration in thepile over the solute concentration in the bulk water.The solute concentration in the pile was obtained bycalculating the solute hideout from a mass balance, andthe void volume in the flludge pile from the initialporosity. The concentration factor calculated in thismanner is an average value; actual factors are likely tobe much higher in localized regions. Figure 6 showsthat the concentration factor after 30 h can be greaterthan 105
.
The influence of sludge pile depth on the soluteconcentration process is shown in Figure 7, in whichthe concentration factors are plotted vs time for threedifferent pile depths at a heat flux of 40 kW / m2
• The50-mm-deep pile showed lower concentration ratesthan the two deeper piles, whose concentration rateprofiles were similar.
Most of the concentration tests were carried out induplicate. The reproducibility was satisfactory.
5020 30 40TIME (HOURS)
10
zoj: :J 30<I::-0::0\I-~rEa::u W 20zl0<u::UJ::'<:
eS lO0::00o...JZ:r:-U
Figure 4: Bulk water chloride concentration versus time for a typicalseries Aexperiment (sludge piledepth: 100 mm; heat flux: 40 kW / m2
).
Influence of Sludge Pile PorosityIn the series B tests, the influence of sludge pile
133
3530
SLUDGE PILE
o 150mm
o 100mm
l1 50mm
15 20 25TIME (HOURS)
10510
CI •• • ...11~
Na+0 0 '" Na+ m2
1030
•e::0
a:: I-0 ~ 102I-U u.« zu. 0Z t-O «l- e::« l-e:: z 10
wI- UZ z CIw 0u uz0 wu :::! 103
Cl..
wlJ0:J-lVI
10210 5 10 15 20 25 30 35
TIME (HOURS)
Figure 6: Concentration factors versus time at different heat fluxes(sludge pile depth: 50mm).
porosity on the contaminant concentration rate wasinvestigated. Figure 8 shows the bulk water chlorideconcentration I time profiles for sludge piles with porosities of 0.43, 0.50, and 0.57. Heat fluxes during theexperiment were 25, 20 and 20kW 1m2
, respectively.The concentration rate decreased with decreasing pileporosity.
Figure 7: Concentration factors versus time for different sludge piledepths (heat flux: 40kW 1m2).
Figure 8: Bulk water chloride concentration versus time for severalsludge pile porosities (pile depth: 150 mm; heat flux: 20-25 kW 1m2
).
oL-'-':~~_.L-_~~::::2:::L-_--3o 50 100 150 200
TIME (HOURS)
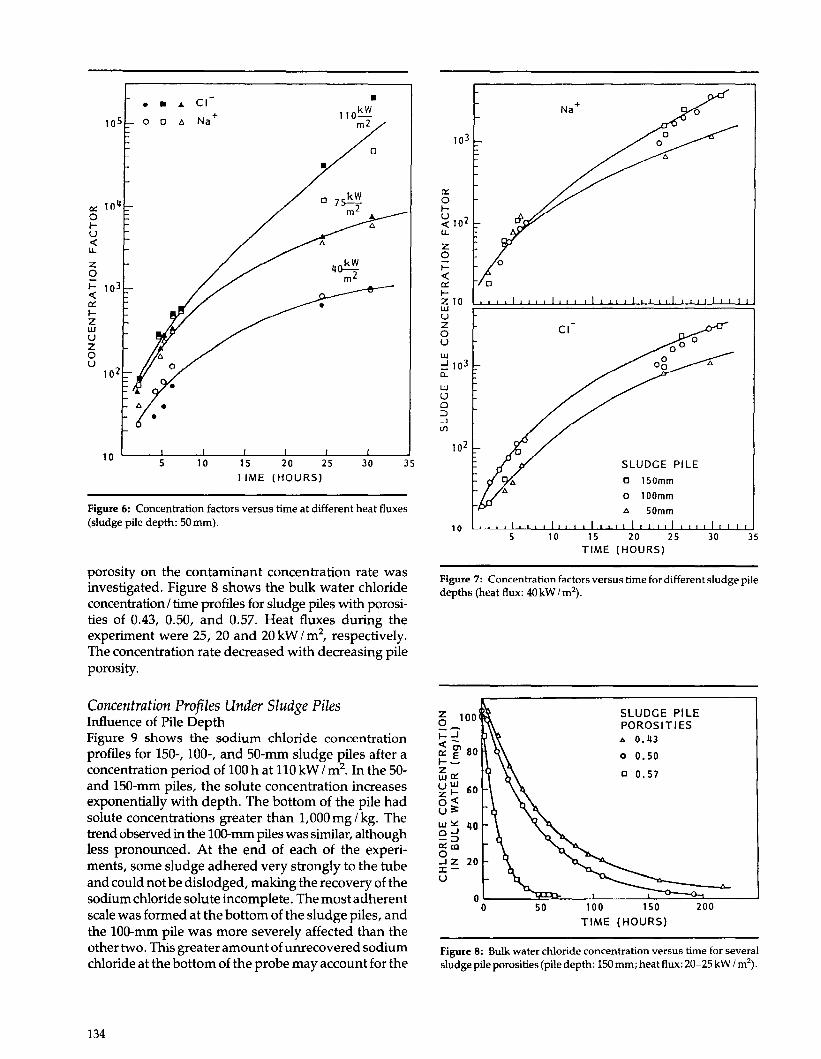
Concentration Profiles Under Sludge PilesInfluence of Pile DepthFigure 9 shows the sodium chloride concentrationprofiles for 150-, 100-, and 50-mm sludge piles after aconcentration period of 100 hat 110 kW I m2. In the 50and 150-mm piles, the solute concentration increasesexponentially with depth. The bottom of the pile hadsolute concentrations greater than 1,000 mg I kg. Thetrend observed in the 100-mm piles was similar, althoughless pronounced. At the end of each of the experiments, some sludge adhered very strongly to the tubeand could not be dislodged, making the recovery of thesodium chloride solute incomplete. The most adherentscale was formed at the bottom of the sludge piles, andthe 100-mm pile was more severely affected than theother two. This greater amount ofunrecovered sodiumchloride at the bottom of the probe may account for the
a 100
j::J«~
e:: en 80I--!ffie::U UJ 60zl--0<U~
e~ 40e::coo..J Z 20x-U
SLUDGE PILEPOROSITIESA 0.43
o 0.50
c 0.57
134
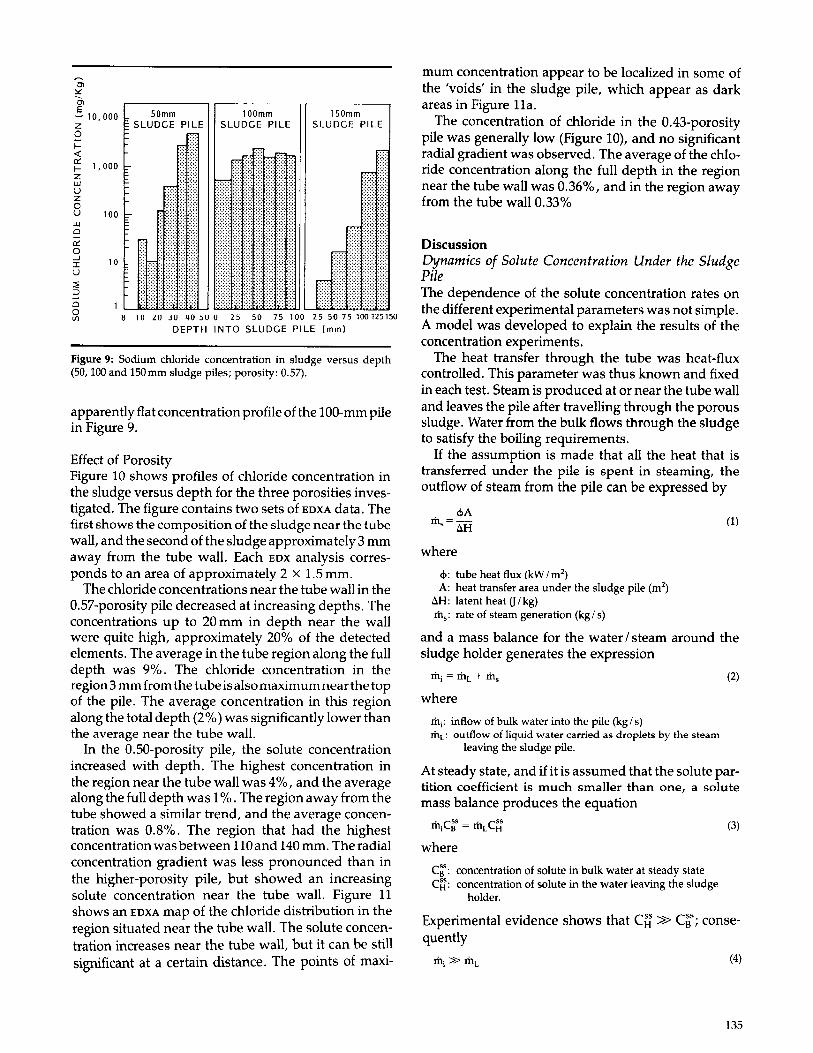
Figure 9: Sodium chloride concentration in sludge versus depth(50,100 and 150mm sludge piles; porosity: 0.57).
(4)
(3)
(2)
(1)
CBS: concentration of solute in bulk water at steady stateCH: concentration of solute in the water leaving the sludge
holder.
where
IDj: inflow of bulk water into the pile (kg I s)rilL: outflow of liquid water carried as droplets by the steam
leaving the sludge pile.
where
Experimental evidence shows that CH» CBs; consequently
DiscussionDynamics of Solute Concentration Under the SludgePileThe dependence of the solute concentration rates onthe different experimental parameters was not simple.A model was developed to explain the results of theconcentration experiments.
The heat transfer through the tube was heat-fluxcontrolled. This parameter was thus known and fixedin each test. Steam is produced at or near the tube walland leaves the pile after travelling through the poroussludge. Water from the bulk flows through the sludgeto satisfy the boiling requirements.
If the assumption is made that all the heat that istransferred under the pile is spent in steaming, theoutflow of steam from the pile can be expressed by
. 4>Am s = IlH
mum concentration appear to be localized in some ofthe 'voids' in the sludge pile, which appear as darkareas in Figure lla.
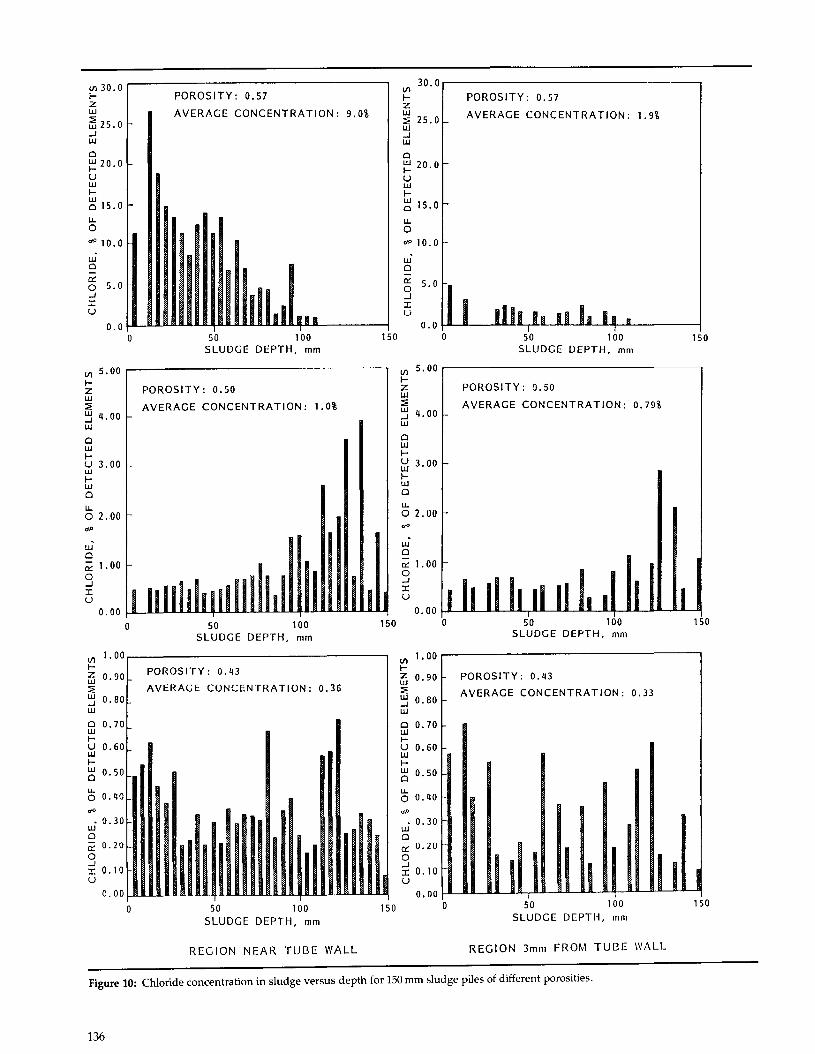
The concentration of chloride in the 0.43-porositypile was generally low (Figure 10), and no significantradial gradient was observed. The average of the chloride concentration along the full depth in the regionnear the tube wall was 0.36%, and in the region awayfrom the tube wall 0.33%
At steady state, and if it is assumed that the solute partition coefficient is much smaller than one, a solutemass balance produces the equation
where
4>: tube heat flux (kW1m2)
A: heat transfer area under the sludge pile (m2)
.iH: latentheatG/kg)IDs: rate of steam generation (kg I s)
and a mass balance for the water / steam around thesludge holder generates the expression
IS0mmSLUDGE PILE
100mmSLUDGE PILE
SOmmSLUDGE PILE
.....
H 102030 '10500 25 50 75100255075100125150
DEPTH INTO SLUDGE PILE (mm)
10
100
01x:01E~ 10,000zoI-<>::
~ 1,000zLlJUZoULlJocro~
::r:u::<:J
oo<11
apparently flat concentration profile of the 100-mm pilein Figure 9.
Effect of PorosityFigure 10 shows profiles of chloride concentration inthe sludge versus depth for the three porosities investigated. The figure contains two sets of EDXA data. Thefirst shows the composition of the sludge near the tubewall, and the second of the sludge approximately 3 mmaway from the tube wall. Each EDX analysis corresponds to an area of approximately 2 x 1.5 mm.
The chloride concentrations near the tube wall in the0,57-porosity pile decreased at increasing depths. Theconcentrations up to 20 mm in depth near the wallwere quite high, approximately 20% of the detectedelements. The average in the tube region along the fulldepth was 9%. The chloride concentration in theregion3mm from the tube is also maximum near the topof the pile. The average concentration in this regionalong the total depth (2%) was significantly lower thanthe average near the tube wall.
In the 0.50-porosity pile, the solute concentrationincreased with depth. The highest concentration inthe region near the tube wall was 4%, and the averagealong the full depth was 1%. The region away from thetube showed a similar trend, and the average concentration was 0.8%. The region that had the highestconcentration was between 110and 140 mm, The radialconcentration gradient was less pronounced than inthe higher-porosity pile, but showed an increasingsolute concentration near the tube wall. Figure 11shows an EDXA map of the chloride distribution in theregion situated near the tube wall. The solute concentration increases near the tube wall, but it can be stillsignificant at a certain distance. The points of maxi-
135
POROSITY: 0.57
AVERAGE CONCENTRATION: 9.0%
30. a,.-------------VI 30.0 .--------------------,Izw~ 25.0-lwCl~ 20.0Uwl-
i:: 15.0u.o<i<' 10.0
VII-zw::;;; 25.0w-lIU
Cl~ 20.0uwI-~ 15.0
u.oriP 10.0
POROSITY: 0.57
AVERAGE CONCENTRATION: 1. 9'J,
15050 100SLUDGE DEPTH. mm
wCl
gs 5.0-lIU
o.0 ra------IIULlUL.,JUL-IUl..-II.L-.LIl--.l:..--------1150 050 100
SLUDGE DEPTH. mm
111.1 n.o.0 ra---lUlUlJilULliULliUI\-liUL.iUI..IIUl.iUl........-+-...II--------j
o
wCl
c::o 5.0-lIU
POROSITY: 0.50
AVERAGE CONCENTRATION: 1.0%
POROSITY: 0.50
AVERAGE CONCENTRATION: 0.79%4.00
ClLUI-td 3.00I-wCl
u.o 2.00
VI 5. 00 r-------------------~IZw::;;;W-lW
VI 5.00 .......-----------I-Zw::;;;~ 4.00wClwI-U 3.00wI-wCl
u.o 2.00",0
15050 100SLUDGE DEPTH. mm
wCl
~ 1.00o...JIU
o.00 f-Jll--.II...L-.......L-JUL.,...a.ll-.......L...JLL-.II...II-..LIL...JLL-IL.II-...II\
150 050 100SLUDGE DEPTH. mm
o.00 f-Jll--.II...............LJLJLLp........LJlLJLLILB..JL..II..JII-IIL.LILLa..a..............L.III
o
wClc:: 1.00o-lIU
POROSITY: 0.43
AVERAGE CONCENTRATION: 0.33
0.90
0.80
VI 1. 00 .......-----------------.....,IZw::;;;W-lW
POROSITY: 0.43
AVERAGE CONCENTRATION: 0.360.80
0.90
VI 1. 00 r-------------------...,IZw::;;;W-lW
0.60
0.50
Cl 0.70w~
U 0.60wl-i:: 0.50
Cl 0.70LU~
ULUIwCl
u.o 0.40u.o 0.40
15050 100SLUDGE DEPTH, mm
I II II Io. 00 ~--II..JL...JLL-Jl.IL,JUL~...IL-Il.JIL....SiL.liL..JILIL--Il..D-..JLJL...-Ill
o
• 0.30wClX 0.20o-lI 0.10u
0\0
15050 100SLUDGE DEPTH. mm
o
REGION NEAR TUBE WALL REGION 3mm FROM TUBE WALL
Figure 10: Chloride concentration in sludge versus depth for 150 mm sludge piles of different porosities.
136

where
and substituting 7 and 8 into 6, the following expression is obtained:
(7)
(9)
(W)
(11)
The resulting expression is
C C" (C C") [ ril, rilL ]11= 11+ 1- II l'Xp- -+- t.IN, pVH
CI: initial concentration of solute in bulk water.
CIlV" + CIlVll = M
where
V,. VUIUIlH: of w~tl'r in vl'ssd (L)t (St.'t.' nOlI', p. 140)M: TOlal mass of solute in vessel (mg)
Derivating expression 7 with respect to time gives
V,dC8 _ v dCIl (8)'d'l- - It""""'d"t
This equation can be easily integrated with the following boundary conditions:
1= O. CB = CI and t - "', CII = Ci;'
The total mass of solute in the vessel can be expressed by
C:l should be zero if the assumption that rill >"'> rilL isrigorously followed; however, it was left in the expression since it could easily be estimated from the experimental data by the numerical technique used in thedata analysis. From equations 1 and 5, and ignoringthe term containing rhL because of equation 4, expression 10 becomes:
c ll = q'+ (CI - Ci;')exp - [~] t:lJ-lpV"
Figur£' II; SEM imagO' (a) and chloride EOXA map {b)or sludge regionnear the tubto wall (top right corner). Point density is proportional tochloride concentration. The sludge pile had a 0,50 poTOsity and Iheregion shown in the micrograph was al a depth of 125 mm.
where
and therefore
[n other words, virtually all the bulk water thatenters the sludge holder leaves it as steam.
A mass balance of the solute around the sludgeholder during the concentration process can be expressed as
This expression implies lhat the cunLelllrdtiun ufsolute in the bulk water decreases exponentially withtime, and that the rate of concentration change is alsoan pxpnnpnti.,l fllnction of the heat transfer area and ofthe heat flux,
A parameter K, called the 'concentration coefficient,'is required to relate expression 11 with the experimental data. K can be described as the fraction of heattransferred under the sludge pile that effectively contributes to the concentration of solute. This could beinterpreted as the fraction of the heat flux that is converted to steam Of, alternatively, the fraction of the heattransfer area under the pile that is actively generatingsteam. Revising expression 11 to include K gives
CIt"'C~+(CI-q')exp-L::~J t. (12)
The numerical technique used in the data reductionconsisted of an unweighted, least-squares regression,
(6)
(5)
CIl; concl'ntration of solute in bulk water (mg L)
ell: concentration of solute in the water in thl' sludge holder(mg L)
p: denslly of water (kg L)V1t" volume of water in sludge holder (L)
t: time (s).
137

Heat flux (kW 1m2)
Table 2: Sludge Pile Concentration Coefficients for150 mm Sludge Piles with Varying Porosities
Table 1: Sludge Pile Concentration Coefficientsfor Several Sludge Pile Depths and Heat Fluxes(Pile Porosity 0.57)
the critical depth of the 100-mm pile (100 x 0.80) at thesame heat flux (see Table 1).
The concentration profiles in Figure 9, which showthe highest chloride concentrations near the bottom ofthe sludge pile, are not necessarily inconsistent withthe finding that the bottoms of the deep sludge pilesare not fully active in the concentration process. Someresidual steam generation may occur even if there issteam-blanketing, since the surface is likely to be periodically rewetted. Water will flow through the sludgeto replace the steam. This water will become enrichedin solutes as it migrates through the regions of activeboiling near the top of the pile. In the series A experiments, the bulk water became depleted of solutes;therefore, when entering the sludge pile, it did notcontribute to the solute enrichment of the top of thesludge pile, but rather it leached the solute from thisarea and transported it to the deeper regions in thepile.
Effect of Sludge Pile Porosity on Pile ConcentrationCoefficientTable 2 shows the concentration coefficient for 150 mmhigh sludge piles with porosities of 0.43,0.50 and 0.57,respectively.
The 0.43-porosity pile had a coefficient of only 0.14,while that for the 0.57-porosity pile was 0.75. The lowconcentration coefficients fur the low-porosity pile canbe attributed to two factors: the lower permeability ofthe porous structure, which hinders the water flow,and an increased thermal conductivity of the sludgemedium due to the higher degree of compaction of theporous structure. The heat that is not invested ingenerating steam on the tube surface is conducted outinto the sludge.
The axial concentration profile for the 0.57-porositypile (Figure 10) appears to agree with the concept of'critical depth' proposed above. The top of the pile ismore active at concentrating the solute than the bot-
0.75
0.57
0.22
0.50
0.14
0.43
Pile height(mm) 40 75 110
50 1.08 1.04 1.01100 0.80 0.70 0.51150 0.59
Pile porosityConcentration
coefficient
fit to a function of the type
Y = P(2) + (P(l) - P(2)) exp [-P(3) Xl
in which P(l), P(2), and P(3) are unknown parametersthat are resolved by the regression analysis. Theseparameters corresponded to
55 KA<l>CI, CB , and --,
~HpVv
respectively, in expression 12.The regression analysis produced a satisfactory cor
relation between expression 12 and the experimentaldata. The calculated values for C j and C~swere almostidentical to the ones oqserved experimentally.
Effect of Heat Flux and Pile Depth on ConcentrationCoefficientThe concentration coefficient K obtained in each of theseries A tests is listed in Table 1. The K values for the50 mm pile are approximately unity, which indicatesthat all the heat transferred under the sludge pile iseffective in concentrating the solute. This implies thatthe other heat losses are not significant compared tothe heat transfer invested in steaming. The permeability of the pile is sufficiently high to satisfy the waterreplenishment requirements for steaming at all theheat fluxes investigated. Another implication of thisresult is that the assumption of negligible carry-over ofwater droplets by the steam leaving the pile is valid.
The K coefficients for the 100-mm pile are less thanunity and decrease when the heat flux increases. Sincethe physical characteristics of this pile are similar tothose in the 50-mm pile, the increase in height seems tobe the only cause for the reduced K factor. The increasein height may reduce the overall permeability of thepile, thus hindering the flow of water to the bottom. Asteam-blanketed region may develop there, and theefficiency of steam generation may be diminished. Alocal increase in temperature can make the heat lossesthrough conduction a significant portion of all the heattransferred. When the heat flux increases, the extentof the liquid-deficient region also increases, and thevalue for the K coefficient diminishes. For a given heatflux, the Kcoefficient will become less than unity whenthe pile depth is such that liquid-starved zones develop;this is not likely to occur abruptly, but rather in aprogressive manner. It will affect increasing portionsof the heat transfer surface with increasing depth.However, a 'critical depth' can be artificially definedbelow which the heat transferred is totally ineffectivein the concentration of solute, and above which steamis 100% efficiently generated. This critical depth can becalculated by multiplying the K coefficient by the totaldepth of the sludge pile. The critical depth shoulddepend only on the heat flux. Only one experiment atlow heat flux could be carried out with the 150 mm pile,but the critical depth obtained (150 x 0.59) is similar to
138

tom. However, the profiles for the lower-porosity pilesare quite different. This discrepancy may be due to thehigh permeability of the 0.57-porosity pile. This permeability was enhanced by channels that were formednear the top surface of the sludge during the tests. Thepresence of these channels, which generally extendedto the tube surface, and the higher concentrations nearthe tube wall, suggest that the boiling mainly tookplace near or at the tube surface, and that a wickboiling process was prevalent with high heat-transferrates. These rates were lower deeper into the pile, andconsequently the resulting solute concentrations werealso lower. Nevertheless, the full depth of the pile wasstill active at concentrating the solute.
The sludge piles with lower porosities did not showthe presence of channels. Their permeability, and hencethe boiling heat transfer were significantly smaller.This, in tum, would produce lower average solute concentrations in the lower-porosity piles, as observed inFigure 10. Boiling in these piles likely occurred withcomparable rates on the tube surface and in the sludgebody. This could explain why the radial concentrationgradients become flatter with decreasing porosities.
The difference in the axial concentration profilesbetween the piles of similar porosities (0.57) in theseries A and series B experiments (Figures 9 and 10,respectively) originates in the experimental procedureused in each case. In the first series, carried out instatic autoclaves, the bulk water became depleted ofsolute during the concentration process. As explainedabove, the movement of depleted water through thesludge transports the solute to the bottom of the pile.In the B series of tests, carried out in refreshed autoclaves, the bulk water always contained the samesolute concentration, and the concentration profilewould be expected to be fairly constant with time, withthe upper areas of the sludge pile becoming progressively enriched in the solute.
Hideout ReturnNo attempt was made to correlate the hideout returnrates to operating and physical parameters; however,it was consistently observed that the hideout returntook place at a much slower rate than the concentrationprocess. The lower rate of hideout return is not unexpected, since the solute mass transfer in this process isdriven by diffusion forces. The concentration process,on the other hand, depends on boiling, which is a veryefficient mass transfer phenomenon even when hindered by the presence of a porous body.
Concentration Processes in Operating UnitsIf concentration processes occurring in the tubesheetsludge pile of a recirculating steam generator are similar to those observed in these experiments, the rate ofconcentration of the bulk water solutes under the sludgeshould depend on the porosity / permeability proper-
ties of the sludge file. For high porosities / permeabilities, the concentration rate will be directly proportional to the local heat flux, and consequently will bemaximum in the hot leg. Deep sludge piles would tendto concentrate solutes at a higher rate, since there is alarger heat transfer area active in the concentrationprocess. High local solute concentrations may have animpact on changing the porosity of the pile if thesolubility product for some species is exceeded. Lowporosity / permeability piles will concentrate solutes ata reduced rate. If the bulk steam generator water has ahigh solute concentration for a limited period of time,the solute will concentrate under the pile at a ratedetermined by the heat transfer parameters of the pile.When the bulk concentration returns to a low value,the solute concentrated near the top of the pile will beslowly transferred deeper into the sludge pile. Theexperience accumulated in these experiments showsthat the sludge pile behaves as a solute trap as long asthe heat transfer process is active. The release of theconcentrated solute takes place slowly, and only whenthe heat transfer is fully stopped.
The controlling variable in the heat-transfer processin these experiments was the heat flux. This is differentfrom a recirculating steam generator in which the wallsuperheat is the controlling variable. However, theexperimental procedure, which emphasized obtainingwall superheats similar to those in a CANDU system(especially in the second series of tests) should makethe conclusions of this work valid for an actual operating system. Further experiments using a temperaturecontrolled heat transfer systemmore closely simulatingactual steam generator heat-transfer conditions arecurrently underway.
Conclusions
- Bulk water solutes concentrate under sludge piles at a rateproportional to the heat flux. The rate is also affected bythe physical characteristics of the sludge pile.
- For a given heat flux and sludge pile characteristics, theconcentration rate is proportional to the pile depth until acritical depth is reached. Piles that exceed the critical depthshowed a decreased concentration efficiency, which canbe represented by a concentration coefficient.
- Concentration coefficients are a direct function of theporosity of the sludge pile.
- High-porosity piles show a concentrating behaviour thatis most consistent with boiling near the tube surface andhigh heat-transfer rates. In less porous piles, heat may betransferred through conduction through the sludge, andboiling may take place in the sludge body. In all cases, thefull depth of the pile is active to some extent at concentrating the solute, since high concentrations of solute wereobserved even below the critical depth.
- Sludge piles behave as solute traps as long as the heattransfer is maintained. Solutes in the pile are transferred
139

towards the bottom of the pile during the heat transferprocess. Hideout return rates are slower than concentration rates.
Notest During a typical experiment, several samples were taken
from the vessel and the water volume in the vessel, Vv '
was not constant. This was included in calculations bycomputing a corrected concentration which took into account the sampled volume.
References1. Tatone as. Worldwide tube performance: Analysis of
the 1983-84 statistics. Nuclear Engineering International1986; 31(383): 81-3. June.
140
2. Gonzalez F, Raycheba JMT, Spekkens P. Examination ofcorrosion products deposits from CANDU steam generators. Presented at the Second International Symposiumon Environmental Degradation of Materials in NuclearPower Systems-Water Reactors, September 9-12,1985,Monterey, California.
3. Cohen P. Chemical thermal hydraulics of steam generating systems. Nucl Technol1981; 55: 105-16.
4. Baum A. The mechanics of concentration processes inrecirculating nuclear steam generators. Water Chemistryand Corrosion in Steam - Water Loops on NuclearPower Stations, Seillac, France, March 17-21, 1981.
5. Charlesworth DH. The deposition of corrosion productsin boiling water systems. Chern Eng Progr Symp 1970;66(104): 21-30.