concentrations of some heavy metals in nigerian … chiedozie chi… · the concentrations of some...
TRANSCRIPT

1
NNONAH CHIEDOZIE CHISOM
PG/M.SC/06/40885
CONCENTRATIONS OF SOME HEAVY METALS IN
NIGERIAN PORK SAMPLES
Pure and Industrial Chemistry
A DISSERTATION SUBMITTED IN PARTIAL FULFILMENT OF
THE REQUIREMENT FOR THE AWARD OF MASTER OF
SCIENCE DEGREE IN ANALYTICAL CHEMISTRY
Webmaster
Digitally Signed by Webmaster‟s Name
DN : CN = Webmaster‟s name O= University of Nigeria, Nsukka
OU = Innovation Centre
2009
UNIVERSITY OF NIGERIA

2
CONCENTRATIONS OF SOME HEAVY METALS IN
NIGERIAN PORK SAMPLES
A DISSERTATION SUBMITTED IN PARTIAL FULFILMENT OF THE
REQUIREMENT FOR THE AWARD OF MASTER OF SCIENCE
DEGREE IN ANALYTICAL CHEMISTRY
BY
NNONAH CHIEDOZIE CHISOM
PG/M.SC/06/40885
DEPARTMENT OF PURE AND INDUSTRIAL CHEMISTRY
UNIVERSITY OF NIGERIA
NSUKKA
MARCH, 2009

3
TITLE PAGE
CONCENTRATIONS OF SOME HEAVY METALS IN
NIGERIAN PORK SAMPLES
A DISSERTATION SUBMITTED IN PARTIAL FULFILMENT OF THE
REQUIREMENT FOR THE AWARD OF MASTER OF SCIENCE
DEGREE IN ANALYTICAL CHEMISTRY
BY
NNONAH CHIEDOZIE CHISOM
PG/M.SC/06/40885
DEPARTMENT OF PURE AND INDUSTRIAL CHEMISTRY
UNIVERSITY OF NIGERIA
NSUKKA
MARCH, 2009

4
CERTIFICATION
This is to certify that the researcher NNONAH CHIEDOZIE CHISOM has
fulfilled the requirements to be awarded with Master of Science (M.Sc.)
Degree in Analytical Chemistry in the Department of Pure and Industrial
Chemistry in Faculty of Physical Sciences.
Signed
…………………………. ……………………
DR. C. O. B. OKOYE DATE
(PROJECT SUPERVISOR)
…………………………… ……………………
DR. P. O.UKOHA DATE
(PROJECT SUPERVISOR)
………………………… ……………………….
DR. P. O.UKOHA DATE
(HEAD OF DEPARTMENT)
………………………… ………………………..
EXTERNAL EXAMINER DATE

5
DEDICATION
This project is dedicated to Almighty God
and the entire family of Nnonah

6
ACKNOWLDGEMENT
I must acknowledge the help I received in writing this project. First, I
must thank Dr. C. O. B. Okoye who guided my thought on this work, and who
is a man of great chemical insight.
My thanks must also go to Dr. P.O. Ukoha for his suggestions and
direction during the course of this work. I am also indebted to Mr. Obidegwu
of Crop Science Department (UNN)for his assistance during the course of my
work,
My unquantifiable gratitude goes to my entire family for their maximum
support.
Finally, my thanks goes to Arc. Engr. A. O. Nwagbara, Chikodili
Nwodo, Iboro Udofia, Louis Chukwuma and others who I have not mentioned
here but who played useful role in making this project a success.

7
ABSTRACT
The concentrations of some heavy metals namely; Zinc (Zn), Iron (Fe), Copper
(Cu), Chromium (Cr), Nickel (Ni), Lead (Pb) and Cadmium (Cd) were
determined in some Nigerian pork (muscles) samples namely pork muscles
from free ranger pigs and confined pigs. The determination was carried with
an atomic absorption spectrophotometer. Results obtained showed that all the
metals analysed for were present except lead and cadmium which were below
the detectable limits. However, the results showed significant difference
between the concentrations of metals found in free ranger pork (muscles) and
confined pork (muscles).
The mean concentrations for free ranger pork showed 82.80µg/g Zn;
135.61µg/g Fe; 2.24µg/g Cu, 1.52µg/g Cr, 0.79µg/g Ni, <0.004µg/g Pb, and
<0.002µg/g Cd while confined pork (muscles) showed 28.27µg/g Zn; 88.06 Fe,
2.01µg/g Cu; 1.40µg/g Cr; 0.67µg/g Ni; < 0.004µg/g Pb and < 0.002µg/g cd.

8
TABLE OF CONTENTS
Title page i
Certification ii
Dedication iii
Acknowledgement iv
Abstract v
Table of content vi
CHAPTER ONE: INTRODUCTION
1.1 Heavy metals 1
1.2 Heavy metal pollution 2
1.3 Essential trace metals 4
1.4 Toxic trace metals 4
1.5 Objectives 6
CHAPTER TWO: LITERATURE REVIEW
2.1 Origin and Domestication of Swine (pigs) 7
2.2 Breeds of pigs 9
2.2.1 Berkshire 9
2.2.2 Chester White 9
2.2.3 Duroc 10

9
2.2.4 Hampshire 10
2.2.5 Poland China 11
2.2.6 American Land Race 11
2.2.7 Tamworth 11
2.2.8 Yorkshire 12
2.2.9 Feeds for Pigs 12
2.3.0 Biological functions and health effects associated with a
deficiency or excess of heavy metals 12
2.3.1 Zinc (Zn) 13
2.3.2 Iron (Fe) 15
2.3.3 Copper (Cu) 16
2.3.4 Chromium (Cr) 17
2.3.5 Nickel (Ni) 18
2.3.6 Lead (Pb) 20
2.3.7 Cadmium (Cd) 21
2.4.0 Methods of Analysis 24
2.4.1 Atomic Absorption Spectroscopy (AAS) 25
2.4.2 Sample Digestion Methods 27

10
CHAPTER THREE: EXPERIMENTAL
3.1 Apparatus 31
3.2 Reagents and Reference Solutions 31
3.3 Sample Collection and Preservation 31
3.4 Determination of Moisture Content 32
3.5 Sample Digestion 32
CHAPTER FOUR
4.1 Results and Discussion 34
4.2 Conclusion 41
References 42
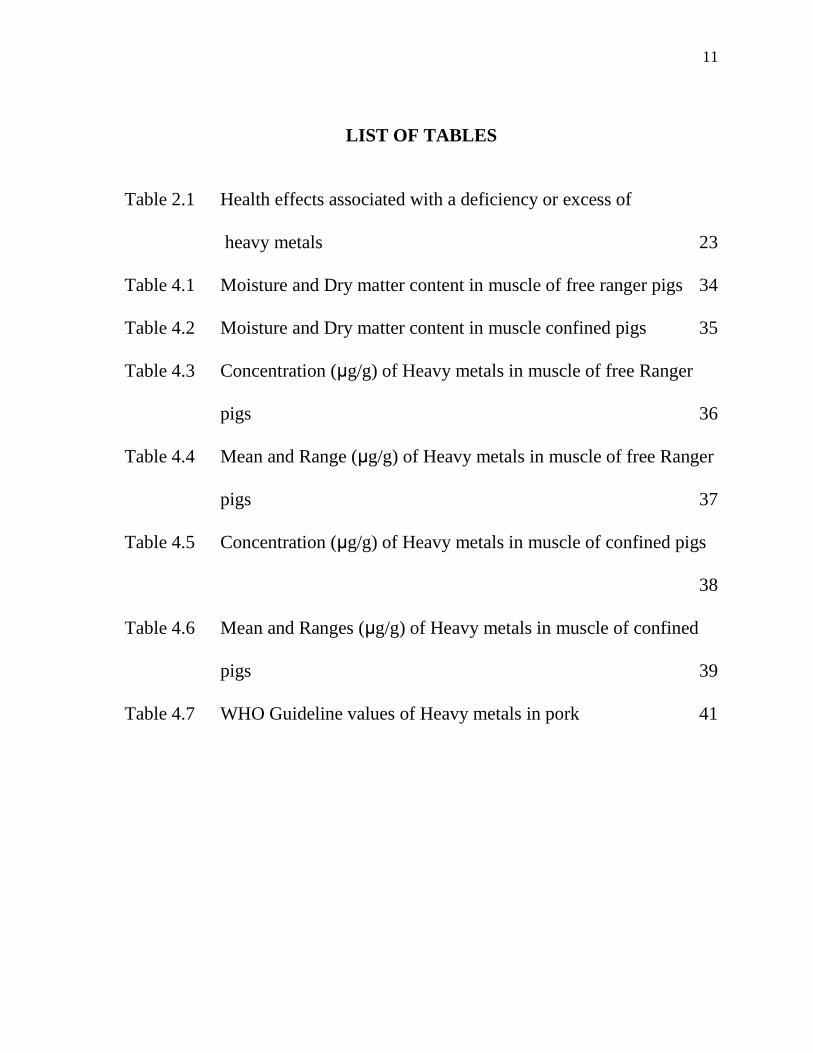
11
LIST OF TABLES
Table 2.1 Health effects associated with a deficiency or excess of
heavy metals 23
Table 4.1 Moisture and Dry matter content in muscle of free ranger pigs 34
Table 4.2 Moisture and Dry matter content in muscle confined pigs 35
Table 4.3 Concentration (µg/g) of Heavy metals in muscle of free Ranger
pigs 36
Table 4.4 Mean and Range (µg/g) of Heavy metals in muscle of free Ranger
pigs 37
Table 4.5 Concentration (µg/g) of Heavy metals in muscle of confined pigs
38
Table 4.6 Mean and Ranges (µg/g) of Heavy metals in muscle of confined
pigs 39
Table 4.7 WHO Guideline values of Heavy metals in pork 41
12
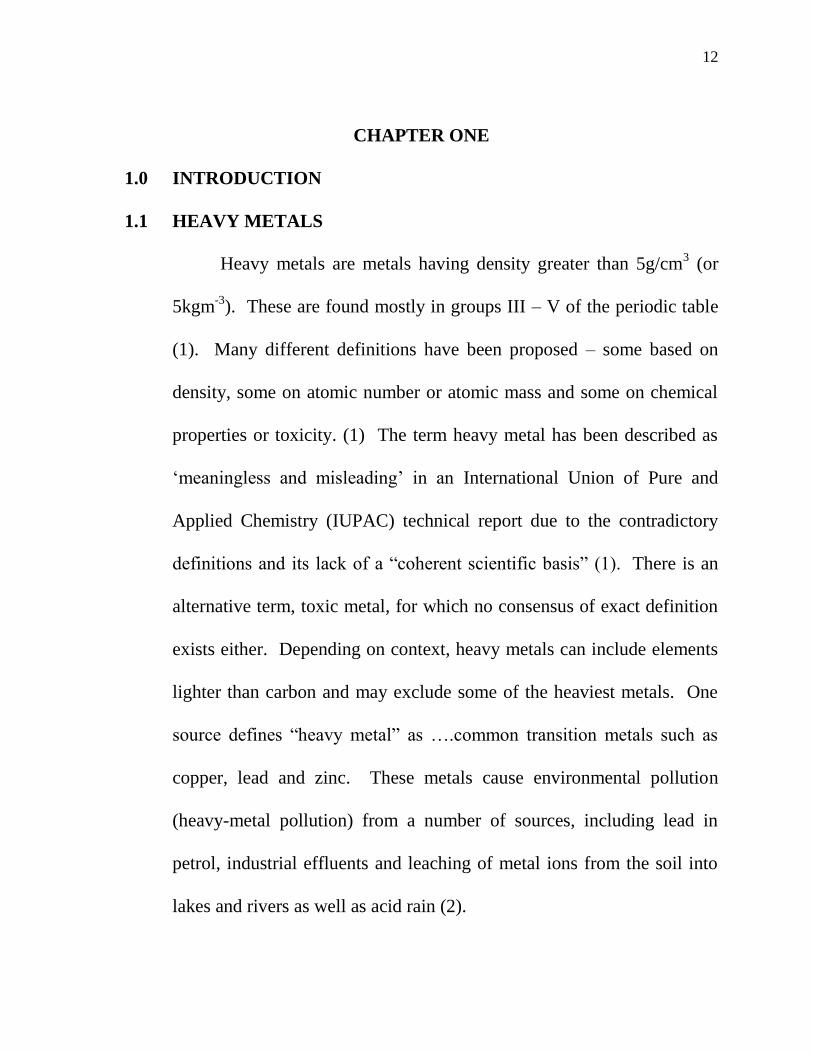
CHAPTER ONE
1.0 INTRODUCTION
1.1 HEAVY METALS
Heavy metals are metals having density greater than 5g/cm3 (or
5kgm-3
). These are found mostly in groups III – V of the periodic table
(1). Many different definitions have been proposed – some based on
density, some on atomic number or atomic mass and some on chemical
properties or toxicity. (1) The term heavy metal has been described as
„meaningless and misleading‟ in an International Union of Pure and
Applied Chemistry (IUPAC) technical report due to the contradictory
definitions and its lack of a “coherent scientific basis” (1). There is an
alternative term, toxic metal, for which no consensus of exact definition
exists either. Depending on context, heavy metals can include elements
lighter than carbon and may exclude some of the heaviest metals. One
source defines “heavy metal” as ….common transition metals such as
copper, lead and zinc. These metals cause environmental pollution
(heavy-metal pollution) from a number of sources, including lead in
petrol, industrial effluents and leaching of metal ions from the soil into
lakes and rivers as well as acid rain (2).

13
In medical usage, heavy metals are loosely defined (2) and include
all toxic metals irrespective of their atomic weight. “Heavy metal
poisoning” can possibly include excessive amount of iron, manganese,
aluminum or beryllium (the fourth lightest element) or such semimetal
as arsenic. This definition excludes bismuth, the heaviest of stable
element because of its low toxicity.
1.2 HEAVY METAL POLLUTION
Living organisms require varying amounts of some heavy metals”.
Such as iron, cobalt, copper, manganese, molybdenum and zinc (3).
Other heavy metals such as mercury, plutonium, and lead are toxic
metals that have no known vital or beneficial effect on organisms, and
their accumulation over time in the bodies of animals can cause serious
illness. Certain elements that are normally toxic are, for certain
organisms or under certain conditions, beneficial (4). Examples include
vanadium, tungsten, and even cadmium (3,4).
Analysis for trace heavy metals in food has become increasingly
important in medical, ecological and pollution studies due to the toxicity
of these metals. The environmental contamination from heavy metals is
of concern because they exhibit behaviour consistent with persistent

14
toxic chemicals unlike many organic contaminants that lose their toxicity
as a result of biodegradation. Metals cannot be degraded further and
their toxic effects can be long lasting (5). Whilst the concentrations in
biota can increase through bioaccumulation, heavy metals are also
known to have toxic effect at low concentration (6).
Heavy metal pollution can arise from many sources but most
commonly arises from the purification of metals, e.g. the smelting of
ores and the preparation of nuclear fuels. Electro plating is the primary
source of chromium and cadmium. Though precipitation of their
compounds or by ion exchange into soils and muds, heavy metals
pollutants can localize and lay dormant. Unlike organic pollutants,
heavy metals do not decay and thus pose a different kind of challenge for
remediation (5.6).
Advancement in technology has led to high levels of
industrialization leading to the discharge of effluents containing heavy
metals into out environment(7). Various activities by man in recent
years have increased the quantity and distribution of heavy metals in the
atmosphere, land and water bodies. The extent of this widespread, but
generally diffused contamination has caused concern about its possible
hazard on plants, animals and human beings.

15
The overall role of trace elements in living organisms is directly
related to the interactions within all environmental, geological,
biological, or marine systems. For example, the trace element
composition of soil may significantly influence the elemental
composition of the vegetation, which in turn influences that of animal or
human tissues or fluids via the food chain (8).
1.3 ESSENTIAL TRACE METALS
Some elements such as; copper, iron, nickel, chromium, zinc,
cobalt, iodine etc are essential in very low concentrations for the survival
of all forms of life, and are rather known as essential trace elements (9).
However, in higher concentrations, these essential trace elements can
also be quite toxic.
In addition to the essential elements, there are several others
which are always found in body tissues and fluids but for which no proof
of essentiality has been established. These elements are often referred to
as non-essential, e.g. lithium, boron, etc.
1.4 TOXIC TRACE METALS
Some elements such as cadmium, mercury and lead are
prominently classified as toxic. This is because of their detrimental

16
effect even at low levels (8,9). It should be noted, however that all trace
elements are predominantly toxic when their levels exceed the limits of
safe exposure. These limits vary widely from one element to another.
There is a range of normal background concentration of these elements
in soils, sediments, water and living organisms. Pollution therefore is
the addition of a substance by human activity to the environment which
can cause injury to human health or damage to natural ecosystems (20).
Ingestion of heavy metals in food stuff contributes a substantial
proportion to total contamination in humans. Heavy metals are ingested
through the food chain directly or indirectly by humans and partially
accumulate in the human body. Exceeding toxic threshold values can
affect heath. For example cadmium disturbs kidney functions and has
cancerous effect (10). High levels of lead in children blood have been
known to have an inhibiting effect on certain enzymes (11).
World Health Organization and Food and Agricultural
Organization (WHO/FAO) have set some standards for heavy metals in
food stuffs. Therefore, constant analysis / investigation of food stuffs is
necessary to evaluate the magnitude and impact of trace element
contamination of the environment and to ensure compliance with the set
standards.

17
1.5 OBJECTIVES
i. Determine the concentration of heavy metals in pork.
ii. Determine the safety of pork sold in Nsukka and Enugu for human
consumption by comparing the levels of heavy metals in the muscle
with the WHO/FAO heavy metals standard for meat.

18
CHAPTER TWO
2.0 LITERATURE REVIEW
2.1 ORIGIN AND DOMESTICATION OF SWINE (PIGS)
Nomadic people could not move swine about with them easily as
they could move cattle, sheep or horses. More over, close confinement
was invariable accompanied by the foul odors of the pig sty. For this
reason, the early keepers of swine were regarded with contempt. This
may have been the origin of the Hebrew and Moslem dislike of swine
later fortified by religious precept (12). As swine do not migrate great
distance under natural conditions and the early nomadic peoples could
not move them about easily, there developed in these animals, more than
in most livestock, a differentiation into local races that varied from place
to place. It also appears that swine were domesticated in several
different regions and that each region or country developed a
characteristic type of hog (12).
The present species of domesticated pigs are descendants of a
species group of wild pigs, of which the European representative is sus
scrofa and the Eastern Asiatic representative is sus vittatus, the banded
pig (12, 13). As in the case of cattle, pigs were not domesticated before
the permanent settlements of Neolithic Agriculture. There is definite

19
evidence for their domesticity by about 2500 B.C. in what is now
Hungary, and in Troy (12). Although pigs are represented on pottery
found in Jericho and in Egypt, dating from earlier periods, these were
wild varieties. The animal had become of considerable importance for
meat by Greco-Roman times, when harms were salted ad smoked and
sausages manufactured. About 150 years ago European pigs began to
change as they were crossed with imported Chinese animals drives from
the sus vittatus Species (13). These pigs had short, fine boned legs and a
drooping back. Then in 1830, Neopolitan pigs, which had better back,
and hams, were introduced (13). It was customary in the past to classify
British pigs by their color- white, brown and black.
The improvement of pigs has not been continuous in one
direction, but has been related to changing requirements at different
periods. Of the improved breeds of pig now in use in the world the
majority originated in British stock (14). The first breed to be brought to
a high standard was the Berkshire (14). It is said to produce more
desirably shaped and sized dors muscles than any other breed. Berkshire
pigs, crossed with the warren country breed of U.S.A, helped to establish
the Poland China in that country a century ago.

20
2.2 BREEDS OF PIGS
2.2.1 BERKSHIRE
The Berkshire is one of the oldest of the improved breeds of pigs
(15). The striking style of the carriage of the Berkshire has made it
known as the aristocrat among the breeds of swine. The native home of
the Berkshire is in South Central England, principally in the counties of
Berkshire and Wiltshire (15). The distinct peculiarity of the Berkshire is
the short up-turned nose. The face is dished, and the ears are erect but
inclined slightly forward. The color is black with six white points four
white feet, some white in face, and a white switch on the tail. The
typical Berkshire is long bodied, with a long deep side, moderately wide
across the black, smooth throughout, well balanced and medium in
length of legs. The meat is exceptionally fine in quality, well streaked
with lean, and has no heavy covering of fat (12).
2.2.2 CHESTER WHITE
The Chester White breed is very popular in northern part of the
United States. As the name indicates, the breed is white in color,
although small bluish spots, called freckles, are sometimes found on the
skin. Chester white sows are very prolific and exceptional mother. The

21
pigs are good feeders and grazers, they mature early and finished
barrows are very popular on the market (16).
2.2.3 DUROC
The Duroc is the leading breed of swine than any other breed.
The Duroc is red in color, with shades varying from light to dark (16).
Although a medium cherry red is preferred by the majority of breeders,
there is no particular discrimination against lighter or darker shades so
long as they are not too extreme.
2.2.4 HAMPSHIRE
The Hampshire is one of the youngest breeds of swine, but its rise
in popularity has been rapid. It is widely distributed throughout the Corn
Belt and the South of United State. The most striking characteristic of
the Hampshire is the white belt around the shoulders and the body. The
black color with the white belt constitutes a distinctive trade mark, the
jowl is trim and light, the head refined, the ears erect, the shoulders
smooth and well set, and the back well arched.

22
2.2.5 POLAND CHINA
No other breed of pig has been subjected to such radical shifts in
type as the Poland China. Likewise, no other breed has swung from
such heights of popularity or fallen so low in disrepute. Poland Chinis
are black in color with six white points – the feet, face, and tip of tail –
but prior to 1872, they were generally mixed black and white and spotted
(16).
2.2.6 AMERICAN LAND RACE
The land race breed is white in color, although black skin spots or
freckles are rather common. The breed is characterized by its long deep
side, square ham: relatively short legs, trim jowl; heavy lop ears;
sometimes low back and frequently weak pasterns (13).
2.2.7 TAMWORTH
The tamworth is one of the oldest and probably one of the purest
of all breeds of hogs (15). It is also recognized as the most extreme
bacon type than any breed. The color of the breed is red varying from
light to dark. The conformation may be described as that of extreme
bacon type. The individuals are rather long-legged, with long smooth
sides, and strong backs. The head is strikingly long and narrow with a

23
long snout and fairly large ears that are carried some what erect (15).
The Tamworth carcass produces bacon of the finest quality. The sows
are polific and careful mothers, and the pigs are excellent foragers.
2.2.8 YORKSHIRE
In its native home, England, the Yorkshire breed is known as the
large white. Yorkshire should be entirely white in color. Although black
pigment spots called freckles, do not constitute a defect, they are
frowned upon by breeders. Yorkshire sows are noted as good mothers.
They not only farrow and raise large litters, but they are great milkers
(15). The pigs are excellent foragers and compare favorably with those
of any other breed in economy of gain and the loins are large; but some
times the harms lack depth and plumpness.
2.3.0 FEEDS FOR PIGS
Through out the world, pigs are raised on a variety of feeds,
including numerous by-products. Except when on pasture or when
ground dry forage is incorporated in the ration, they eat relatively little
roughages (16). In Nigeria, corn, palm-kernel cake, and pig production
have always been closely associated. Normally more than one half of
the corn crop is fed to the pigs. The diet of the pig is readily adapted to

24
the feeds produced locally. Thus, in most section of the world, pigs are
fed predominantly on home-grown feeds (16).
2.3.0 BIOLOGICAL FUNCTIONS AND HEALTH EFFECTS
ASSOCIATED WITH A DEFICIENCY OR EXCESS OF HEAVY
METALS
2.3.1 ZINC
Zinc is an essential trace element for plants, animals and humans
as it is associated with many enzymes and with certain other proteins
(17). Zinc is relatively more abundant in the earth‟s crust than some
other metals (e.g. Copper); however, there are not many minerals that
contain zinc. There is only one common sulfide (ZnS). Clay minerals in
soils can adsorb some zinc. Anthropogenic sources of zinc in the
environment include printing processes, construction materials, metals
(iron, steel and brass coated with zinc), fertilizer, batteries, sewage
sludge, animal wastes in the form of manure (dairy, feedlot, swine or
chicken), zinc-containing pesticides (e.g zineb, mancozed and Ziram),
atmospheric deposition and coal combustion (17). The latter can
contribute to zinc input through deposition of atmospheric emission and
when the residue of coal combustion (furnace ash and fly ash) are

25
disposed of in landfills (20). The distribution of zinc in our food stuffs
has much in common with copper. It is an essential component of the
active sites of many enzymes, and it is therefore not surprising to find it
at high levels in animal tissues such as lean meat and liver (21). Zinc
concentration in soils typically range from 1 to 2000 mg kg-1
, (20) but at
some sites levels as high as 100,000mgkg-1
have been reported (20).
The major health concern of zinc in the general population is
marginal or deficient zinc intake rather than its toxicity. Zinc is
generally considered as being of low toxicity due to the wide margin
between usual environmental concentrations and toxic levels. However,
high levels of zinc are undesirable as it may lead to copper deficiency by
inhibiting copper absorption (18). Deficiency of zinc causes growth
retardation; hypogonadism, mental lethargy; poor appetite; skin lesions
(8,18,19). An excess intake of zinc causes Nausea, anaemia, and
neutropenia (19). The daily dietary allowances for zinc as recommended
in different countries and by the International Commission on
Radiological Protection (ICRP) are as follows (in mgd-1
): USA (adult
and growing children) 10, U.K,14.3, Japan, 14.4, India 16.1, Italy, 4.7 –
11.3; ICRP, 13.0 (20).

26
2.3.2 IRON
Iron constitute 5% of the earth‟s crust. It ranks fourth in
abundance after oxygen, silicon and aluminum. Of all the metals iron is
probably the one which the layman is most aware of as nutrient and also
the one which is potentially in short supply in the diet. One reason for
this is that most people are familiar with the need for iron in the blood
even though a rather smaller number of people will know what it is
doing there, in the myoglobin of muscle and in respiratory enzyme
systems generally (21). Iron is the most important transition metal in the
animal body, where it occurs almost entirely in elaborate co-ordination
compounds based on the porphyrin nucleus, notably the haem pigments,
which carry oxygen (22). A deficiency of iron is always manifested as
anemia i.e. abnormally low blood hemoglobin level.
Iron is generally abundant in most food stuffs, of plant as well as
animal origin. Lean meat contains between 2 and 4mg per 100g, (22)
mostly as myoglobin, so that the relative redness of different cuts is a
fair guide to the relative abundance of the metal. Liver has rather more;
around 9mg per 100g (20). Leafy green vegetables, legumes, nuts and
whole cereal grains all have between 2 and 4 mg per 100g (22). Most
fruits, potatoes, and white fish such as cod have between 0.3 and 1.2mg

27
per 100g (22). A deficiency of iron is manifested as anaemia, while
excess iron intake may lead to cirrhosis of liver and haemochromatosis
(8,9). The recommended daily dietary allowance for iron is 18mg for
adults and 10 – 15mg for children (23).
2.3.3 COPPER
Copper constitutes about 10-4%
of the earth‟s crust. It occurs in the
metallic state as uncombined metal as well as in compounds e.g. cuprous
oxide (Cu20), cupric oxide (CuO). The basic carbonates of copper are
malachite, (CuCO3, Cu(OH)2, and azurite (2CuCO3) Cu(OH)2. The
complex sulphide (CuFeS2) occurs as chalcopyrite (copper pyrites).
Copper is a component of many enzymes, e.g. cytochrome
oxidase, dopaminehydroxylase, superoxide dismutase and Lysol oxidase.
Iron metabolism is closely dependent on copper and in animals it is
difficult to distinguish between the anemia arising from deficiencies of
the two elements “Menkes” syndrome is a rare genetically determined, a
failure to keratinize hair, which becomes kinky, hypothermia, low
concentration of copper in plasma and liver, skeletal changes and
degenerative changes in aortic elastica (24). Excess ingested copper is
deposited in tissue, mainly in the liver and basal nuclei of the brain.

28
This leads to cirrhosis of the liver and brain disturbances e.g. coarse
tremor and personality changes (25). The recommended daily dietary
allowance for copper is 3mg for adults and 1-2mg for children (23).
2.3.4 CHROMIUM
Chromium is one of the less abundant metals of the earth‟s crust.
It‟s principal ore is the chromite (FeCr2O4). The major industrial sources
of chromium in the environment are from steel works, organic chemicals
and petrochemicals, paper and pulp production, petroleum refining,
power plants, textile mills, leather, electroplating, cement, fertilizers,
asbestors, paints, dyes, fungicides, etc. It is released into the
environment either directly during various manufacturing and treatment
processes, or when products containing chromium are disposed.
Naturally occurring chromium is ubiquitous in soils and
vegetation, although concentrations are generally very low. Chromium
is toxic to animals and humans, but less to plants. Inhalation and
ingestion are the main routes of human exposure to chromium.
Chromium deficiency leads to a reduction rate of removal of
ingested glucose due to a low sensitivity of peripheral tissues to insulin.
There are also impaired lipids metabolism, neuropathy and brain

29
disorders. In some patients with impaired glucose tolerance especially
children with protein energy malnutrition appears to be associated with
chromium deficiency (26,27).
Excessive amount of chromium leads to eczema and linked to
cancer. The recommended daily dietary allowance is 0.05-0.2mg for
adults and 0.02-0.12mg for children (23).
2.3.5 NICKEL
Nickel is a major constituent of the earth‟s crust. Nickel ores are
principally sulfide and silicates mixed with other metals. The principal
minerals are pentlandite and nickel ferrous pyrrohite (mixed sulfides of
iron and nickel) and garnierite (a mixed silicate of magnesium and
nickel).
Nickel emissions to the atmosphere are mostly anthropogenic,
industrial sources account for more than 80% of the total emission.
Nickel levels in soils are generally between <50 and 100mgkg-1
, but very
high levels may be found in some areas, particularly in soils over
serpentine deposits (20). Plants seem to be more sensitive to nickel
toxicity than animals, although both can be affected by nickel pollution.
Nickel carbonyl, Ni(CO4), is extremely toxic and any emission is

30
especially hazardous to mammals and human. Nickel pollution from
metals smelting has been reported in Canada, Russia, Australia, Cuba
and other countries (20).
Nickel is introduced into the territorial environment as solid waste
from metallurgical industries or as deposition of atmospheric emissions.
Although major source of Ni pollution is sewage sludge when applied to
land. In spite of Ni accumulation in soils, uptake by plants is not
sufficient to be of concern in the food chain. Application of phosphate
fertilizers to cultivated land is also a source of nickel and this could lead
to elevated concentrations since nickel, together with other heavy metals,
is found in phosphate minerals in variable amounts.
Nickel is present in trace amount in foods, human and animal
tissue (28). Ni is a component of the enzyme ureas present in a wide
range of species, functions as a redox metal in several types of enzymes
of aerobic hydrogen and anaerobic bacteria. Ni deprivation affects
growth, reproductive performance and plasma glucose concentration and
distribution and proper functioning of other nutrients including cobalt,
iron, zinc etc (29). Contact dermatitis is the most important clinical
effect of excessive nickel exposure (29). Nickel salts exert toxic action
by gastrointestinal irritation and not by inherent toxicity, an oral dose of

31
nickel as nickel sulfate as low as 0.6mg produces a positive skin
reaction in nickel sensitive individuals (30).
2.3.6 LEAD
Lead is undoubtedly the metal that springs to mind first when the
question of metal contamination of food is raised.
Average concentrations of Pb in soil are between 15 and 25mgkg-
1(20). Lead is naturally present in galena (PbS). The history of
elemental lead contamination began with the development of
metallurgical science over 5000 years ago (31).
The discovery of cupellation, a process of economic and industrial
changes that resulted in an exponential increase in the release of
anthropologenic lead into the environment. Environmental lead
contamination began with the first mining and smelting of lead ores (31).
The first person that developed the cupellation process was probably the
first individual to suffer from lead toxicity. Major anthropogenic source
of lead include the use of lead as a petrol additive, Pb mining and
smelting, printing, Pb paint flakes, sewage sludge and the use of
pesticide containing Pb compounds (e.g. Lead arsenate) (32).
32
Lead contamination of livestock and poultry is primarily derived
from atmospheric lead. Grazing animals take up lead from forage and
feed. Lead concentrations in forage are related to the atmospheric
deposition rate, as in food crops. Forage grown adjacent to heavily
utilized roads may contain more than 950µPb/g (31).
Lead is a well-known poison, but the effects of exposure to lower
levels have been contentious. There is growing evidence of sub-clinical”
Pb poisoning especially among young children who play in polluted
parks, gardens and street. Exposure to low lead levels can cause system
disorders, hyperactivity, hypertension, behavioural changes and learning
difficulties in children (33). Some have gone as far as to blame anti-
social behaviour and criminality on sub-clinical Pb poisoning, although
the evidence is tenuous.
2.3.7 CADMIUM
Cadmium is a very rare element, its average concentration of 0.1 –
0.2µg/g makes it the sixty-seventh element in the earth‟s crust in terms
of abundance (31). The baseline concentration of cadmium in most
environmental media are also notoriously low, some of the most
common-values being 2-20ng/1 dissolved in lakes, 5-15ng/1 dissolved in

33
rivers <5ng/m3 in the atmosphere, and 0.35 – 0.62ng/g in soils (31).
Therefore, the background reservoirs of cadmium in the different
segments of any ecosystem should be small; suggesting that the
biogeochemical cycling of cadmium can be altered significantly by small
contributions from anthropogenic sources (35).
The epidemic of cadmium poisoning (itai-itai disease) was a clear
manifestation of the wanton discharge of cadmium into the local
environment and its subsequent transfer to the local food chain (36).
There is now growing evidence to suggest that the levels of cadmium in
air, water and soils in many part of the world have increased several fold
as a result of emission from industrial activities and that the natural
biogeochemical cycle of cadmium has been overwhelmed. Cadmium
pollution is being transferred to human, resulting in elevated cadmium
levels in our diets. Long term exposure to the elevated levels of
cadmium in the environment has apparently increased the accumulation
of cadmium in certain body organs (notably the kidney and liver). The
transfer of cadmium into human foods is through air, water and soil.
Of all the toxic metals released in large quantities to the
environment, cadmium is generally regarded as the most likely to
accumulate in human food chain. The pollutant cadmium is selectively

34
concentrated by certain food crops, notably the root crops, leafy
vegetables, and tobacco plants.
Cadmium is extremely poisonous and toxic to humans. When
inhaled it causes acute bronchitis, pneumonitis and inflammation in the
liver (36). Cadmium toxicity causes a disease known as itai-itai (ouch-
ouch) resulting in death and physical deformities that sometimes extend
to children born by affected mothers. This occurred in Japan, to people
who ingested cadmium from eating rice grown in paddy fields flooded
by water from a contaminated river (37). High intake of cadmium also
leads to kidney failure (38).
Table 2.1
Health effects associated with a deficiency or excess of heavy metals (8).
Trace
Element
Health effect
Deficiency Excess Fe Anaemia Cirrhosis of liver,
haemochromatosis
Cu Anaemia and changes in
ossification
Wilson‟s disease
Zn Growth retardation, mental
lethargy, poor appetite
Neutropenia, anaemia
Cr Impaired glucose tolerance,
brain disorders
Eczema and linked to cancer
Ni Affects growth, reproductive
performance
Contact dermatitis
Cd - Hypertension, renal damage,
anosmia (no sense of smell)
Pb - Impaired mental activity,
reproductive and development
problems, headaches

35
2.4.0 METHODS OF ANALYSIS
The ideal analytical technique for measuring trace elements in
environmental samples must offer:
(a) Very low detection limits
(b) A wide linear dynamic range
(c) Simple interference-free data
(d) Qualitative, semi quantitative and quantitative analysis
(e) Possible simultaneous multi-element capability
(f) Simple sample preparation
(g) High through put and low cost per determination (8)
In practice, whilst manufactures or salesmen may claim that their
technique is superior and ideal for environmental analysis; in reality
there is no universal analytical technique for environmental analysis. All
the main contenders, including atomic absorption spectrometry (flame or
electro thermal) AAS, ETAAS); Atomic fluorescence spectrometry
(ATS), inductively coupled plasma (optical or atomic) emission
spectrometry (ICP-OES or ICP – AES), neutron activation analysis
(NAA), X-ray fluorescence (XRF), proton-induced X-ray emission

36
(PIXE); spark source or isotope dilution mass spectrometry (SSMS,
IDMS), electrochemical (anodic stripping voltammetry and
polarography) or inductively coupled plasma mass spectrometry (ICP-
MS) have their advantages and disadvantages (8).
The main limitations for most of these analytical methods are
sensitivity or precision problems due to interferences and sample matrix
effects. In some cases these problems have been reduced or eliminated
by the use of pre-analysis separation schemes, matrix matching of
reagent blanks, calibration standards and samples, the inclusion of
instrument background correction (AAS) or the coupling of hydride
generation (HG), electro thermal vaporization ETV, cold vapor (CV),
flow injection (FI), ultrasonic nebulisation (US) or laser ablation (LA)
devices to the trace element detector (8).
2.4.1 SAMPLE DIGESTION METHODS
The majority of trace element analytical techniques require the
sample to be in solution. There is no universal procedure for all types of
sample. The most desirable features of such procedures are:
1. The ability to dissolve the sample completely (no insoluble residue)
2. Reasonably quick and always safe

37
3. No possible sources of sample loss through volatility, adsorption into
the wall of the vessel,
4. Elimination of sample contamination from the reagent used in the
dissolution processes.
The majority of dissolution procedures involve dry ashing or wet
digestion using one or a combination of concentrated mineral acids (8).
Muffle ashing at 500-5500C will decompose most organic matter,
although problems can occur through volatilization of Hg, As, Sn, Se,
Pb, Ni, and Cr. Wet digestion is often the preferred method for oils,
sediments, biological tissues and blood (8). For trace and ultra trace
element analysis the reagent blank is very important. The mineral acids
used in wet digestion. Procedures can be sources of many elements,
especially Al, As, Mn, Cr, Ni and Zn. Only ultra pure or Artista grade
purity acids should be used. For ultra trace element analysis distillation
of acids in a quartz sub-boiling still is necessary. Soil, sediment, and
sludges can be readily digested using perchloric acid, or nitric-
hydroflouric acid mixtures (1:1 HNO3/HF), with 0.1-0.5g of sample
attacked by 10ml concentrated acid solution in a polypropylene squat
beaker, heated by water or sand bath placed in a special fume cupboard.
Care must be taken for elements that form volatile chlorides or fluorides

38
and unstable nitrate complexes. Aqua regia (3:1 HCl/HCO3) is often
used for solid digestion. Biological tissues and fluids (0.25-1.0g or 1-
5ml) can be digested in micro kjeldahl digestion vessels, with controlled
temperature heating mantles using nitric acid and H2O2 (8). However,
wet digestion using an open vessel always is subjected to possible
element volatility problems. Pressurized decomposition with nitric acid
in Teflon digestion bombs eliminates this problem and has the added
feature of increased digestion efficiency through smaller aid volumes
and pressure digestion.
Microwave digestion provides both a closed system method and
shorter digestion times optimal conditions depend on the sample
(weight, composition, volume of digestion reagents, reaction
temperature, pressure and time), and the digestion system (especially
power ratings).
Both bomb and microwave digestion systems require strict
attention to general safety rules in order to prevent explosive type
reactions. In particular:
1. Digestion of very fine powder samples must be restricted to less than
500mg (ideally 100-200mg) of sample, add only a maximum of 2ml

39
HNO3 and start with the minimum amount of power and the shortest
possible time (microwave) (8,39).
2. Avoid the digestion of biological material containing more than 20%
fat content,
3. Digestion of organic material generates a large amount of vapour, so
after digestion, be careful and never open a warm vessel (8).
2.4.2 ATOMIC ABSORPTION SPECTROSCOPY (AAS)
This has become one of the most improved techniques in the
qualitative determination of metals in foodstuffs. It has gained favour
with analysts because it is both specific and sensitive. The principle of
atomic absorption is by no means new. In 1860, Kirchhoff concluded
that black lines in the spectrum of the sun were due to absorption by
elements in its outer atmosphere. Little practical application was made
of Kinchhoff‟ work until mid 1950s when Alan Walsh, the Australian
Physicist developed the first practical atomic absorption spectrometer
(39).
In principle, the technique is relatively simple. When a beam of
light of specific wavelength is passed through a population of atoms of
metals of interest, a proportion of this light is absorbed by the atoms and

40
the absorption is proportional to the number of atoms present. The
source of light is usually a hollow cathode lamp (39, 40). The sample
solution of the element in question are nebulised into a flame which has
only sufficient energy to produce groundstake atoms and not to excite
them to higher energy levels where they will emit light. The light
emerging from the flame is selected, detected and amplified so that it can
be measured (41,42).
In practice, the foodstuff under examination is digested or asked to
remove organic matter. The remaining mineral matter is dissolved and
the resultant solution is aspirated into the flame of the instrument. The
metal‟s hollow cathode lamp is fitted and the requisite beam of light is
passed through the population of the atoms. For e.g. if lead hollow
cathode lamp is fixed only lead atoms will absorb the light emitted by it.
Part of the energy will be absorbed by the specific atoms, which absorb
at that wavelength e.g. 283.3 for lead. The absorption is compared to
that obtained when standard solutions of the metal in question are
aspirated so as to determine the concentration (42). This is done by
preparing a series of standard solutions and successively aspirating them
into the flame. The absorbances are then obtained. The absorbance
values are plotted against concentration. As with other spectroscopic

41
techniques, the Beer-Lambert‟s law is obeyed in that absorbance is
proportional to the concentration of atoms in the flame and hence to the
concentration of the element in the aspirated solution. If a linear
calibration curve results, the slope of the calibration curve can be
obtained and use made of equation A=mc, where A, is absorbance and
C, is concentration, to calculate the concentration of the unknown
solution (42). It is important to remember that at high absorbance levels,
the relationship between absorbance and concentration may depart from
linearity. Additions should be of approximately the same concentration
as that anticipated for the dilute sample solutions (39).

42
CHAPTER THREE
EXPERIMENTAL
3.1 APPARATUS
A GBC Avanta Version 2.02 atomic absorption spectrophotometer
equipped with deuterium background corrector. Single-element
intensitron hollow cathode lamps were employed throughout this study.
A premix design, 10cm, titanium, single-slot burner head was used. The
fuel was acetylene and the oxidant air. The instrument settings were
those recommended by the manufacturer.
A block digestor system was used for the digestion of the samples.
3.2 REAGENTS AND STANDARD SOLUTIONS
Pechloric acid 72% and Nitric acid 70% were used for the
digestion of pork muscles. Stock solution of each element (1,000 ppm)
were used to prepare dilute standard solutions of various concentrations.
All solutions were prepared with deionized water.
3.3 SAMPLE COLLECTION AND PRESERVATION
Lumps of pork muscles were purchased from the meat of 30
different pigs during various sampling trips to Nsukka Central Market.
15 of the 30 samples were free ranger pigs and the other 15 from

43
confined pigs. The pork samples were labeled pi-p30. The free ranger
was identified with F marked on the sample bottles. The samples were
carefully cut using a plastic knife. They were later oven dried,
comminuted and preserved in polythene containers and stored in a
desicator.
3.4 DETERMINATION OF MOISTURE CONTENT
Each lump of muscle sample was placed in preweighed clean and
dry porcelain dish. The dish together with the content were weighed
again and then oven dried at 1050C. They were weighed at intervals
until a constant weight was obtained. The loss in weight was noted as
the moisture content. The moisture content was calculated and
expressed in percentage (%).
Moisture content (%) = Weight loss x 100
Sample weight 1
Dry matter (%) = 100 - % moisture content
3.5 SAMPLE DIGESTION
The outer portions of the dried lumps of pork muscles were cut off
using a plastic knife in order to avoid probable contamination by heavy

44
metals from the butchers knife. The inner portion was ground in a
porcelain mortar and stored for trace metal analysis.
About 1g of each oven dried sample was placed in a 25ml kjeldahl
digestion flask. 5ml HNO3 (concentrated) was carefully added and left
for a while before addition of 2ml concentrated perchloric acid (HCIO4),
to avoid explosion (39,40,42). The mixture was swirled gently and
digested at moderate heat. The mixture was digested for about 15
minutes after the appearance of white fumes. The flask was left to cool
and the flask was made up of the 25ml mark with de-ionized water (42).
The blank was prepared in the same manner but the pork muscle was
omitted. All the digestion were performed in a fume cupboard.

45
CHAPTER FOUR
4.1 RESULTS AND DISCUSSION
TABLE 1: MOISTURE AND DRY MATTER CONTENT IN
MUSCLE OF FREE RANGER PIGS
SAMPLE MOISTURE
CONTENT (%)
DRY MATTER
CONTENT (%)
1 74.42 25.58
2 78.02 21.98
3 76.09 23.91
4 77.35 22.65
5 76.12 23.88
6 72.33 23.67
7 67.05 32.95
8 68.16 31.84
9 75.90 24.96
10 74.21 25.79
11 74.05 25.95
12 75.65 24.35
13 75.85 24.15
14 75.94 24.06
15 80.93 19.07

46
TABLE 2: MOISTURE AND DRY MATTER CONTENT IN
MUSCLE OF CONFINED PIGS
SAMPLE MOISTURE
CONTENT %
DRY MATTER
CONTENT (%)
1 75.68 24.32
2 75.30 24.70
3 78.95 21.05
4 76.26 23.74
5 74.65 25.35
6 76.22 23.78
7 72.81 27.19
8 75.75 24.25
9 71.04 28.96
10 80.92 19.08
11 70.08 29.92
12 59.51 40.49
13 75.88 24.12
14 79.10 20.09
15 77.39 22.61

47
TABLE 3: CONCENTRATIONS (µg/g) OF HEAVY METALS IN
MUSCLE OF FREE RANGER PIGS
Sample Zn Fe Cu Cr Ni Pb Cd
1 231.08 40.60 1.65 0.98 1.37 < 0.01 < 0.01
2 93.58 173.10 3.00 5.00 0.72 < 0.01 < 0.01
3 116.08 135.60 0.89 2.60 0.45 < 0.01 < 0.01
4 98.58 108.10 1.67 1.87 1.02 < 0.01 < 0.01
5 38.30 103.10 3.46 0.75 0.65 < 0.01 < 0.01
6 77.00 97.55 2.28 3.02 0.50 < 0.01 < 0.01
7 46.79 137.05 2.13 1.60 0.57 < 0.01 < 0.01
8 56.41 37.80 1.23 1.10 0.33 < 0.01 < 0.01
9 42.22 250.05 2.85 0.82 0.92 < 0.01 < 0.01
10 72.20 117.05 1.48 1.00 0.95 < 0.01 < 0.01
11 34.64 130.05 2.03 0.40 0.20 < 0.01 < 0.01
12 112.04 205.80 4.23 1.20 0.87 < 0.01 < 0.01
13 91.44 233.05 1.83 1.82 0.85 < 0.01 < 0.01
14 60.31 76.05 1.63 0.55 1.35 < 0.01 < 0.01
15 71.43 189.30 3.35 0.15 1.10 < 0.01 < 0.01

48
TABLE 4: MEAN AND RANGES (µg/g) OF HEAVY METALS IN
MUSCLE OF FREE RANGER PIGS
Zn Fe Cu Cr Ni Pb Cd
Mean 82.80+48.63 135.61+64.13 2.24+0.93 1.52+1.24 0.79+0.34 <0.01 <0.01
Range 34.64-231.08 37.80-250.05 0.89-4.23 0.15-5.00 0.20-1.37 <0.01 <0.01

49
TABLE 5: CONCENTRATIONS (µg/g) OF HEAVY METALS IN
MUSCLE OF CONFINED PIGS
Sample Zn Fe Cu Cr Ni Pb Cd
1 19.15 42.10 3.66 0.09 1.07 < 0.01 < 0.01
2 19.85 30.88 2.33 1.80 0.82 < 0.01 < 0.01
3 42.50 46.00 2.42 4.13 1.32 < 0.01 < 0.01
4 24.98 68.10 4.12 1.93 1.62 < 0.01 < 0.01
5 31.68 105.10 0.82 2.23 0.60 < 0.01 < 0.01
6 20.16 122.30 2.35 2.85 1.27 < 0.01 < 0.01
7 22.24 195.30 4.65 0.95 0.75 < 0.01 < 0.01
8 38.46 54.80 0.60 1.37 0.05 < 0.01 < 0.01
9 28.30 106.30 3.83 1.92 0.50 < 0.01 < 0.01
10 19.28 95.05 1.58 0.72 0.12 < 0.01 < 0.01
11 28.48 133.80 2.63 0.60 0.95 < 0.01 < 0.01
12 30.47 86.05 1.03 0.12 0.35 < 0.01 < 0.01
13 22.33 116.05 1.75 0.17 0.10 < 0.01 < 0.01
14 29.53 56.05 0.78 0.70 0.32 < 0.01 < 0.01
15 46.45 75.05 1.08 1.47 0.27 < 0.01 < 0.01

50
TABLE 6: MEAN AND RANGES (µg/g) OF HEAVY METALS IN
MUSCLE OF CONFINED PIGS
Zn Fe Cu Cr Ni Pb Cd
Mean 28.27+8.64 88.06+43.16 2.01+1.13 1.40+1.12 0.67+0.47 <0.01 <0.01
Range 19.15-46.45 30.88-195.30 0.60-4.65 0.09-4.30 0.05-1.62 <0.01 <0.01

51
Table 1 and 2 shows the moisture and Dry matter content in muscles of free
ranger pigs and confined pigs respectively. All the samples have moisture
content above 50% and the Dry matter content was below 40%. This result
shows that these pigs are not malnourished. Also that the rate of hydration in
these pigs is greater than the rate of dehydration.
Table 3 and 4 show the concentrations, mean and ranges (µg/g) of heavy
metals in free ranger pig muscles. Zinc had a mean value of 82.80ug/g and
range of 34.68 to 231.08µg/g. Iron had he highest mean concentration of
135.6µg/g with range of 37.80 – 250.05µg/g. The mean value of copper was
2.25µg/g and range was 0.89-4.23µg/g. Chromium was detected in all the
samples with a mean value of 1.52µg/g and range of 0.15 – 5.00µg/g. Nickel
had a mean concentration value of 0.79µg/g and range of 0.20-1.37µg/g Lead
and Cadmium were below their detection limits of 0.004µg/g and 0.002µg/g
respectively in all samples.
However, table 5 and 6 illustrate the concentration; mean and ranges
(µg/g) of heavy metals in confined pigs (muscles). From the tables, zinc had a
mean value 28.27µg/g and a range of 19.15-46.45µg/g. More so, Iron had the
highest mean concentration of 88.06µg/g and range was 30.88-195.30µg/g.
Copper, chromium and nickel had mean values of 2.24µg/g, 1.40µg/g and

52
0.67µg/g respectively. The ranges were 0.60 – 4.65µg/g for copper, 0.09-
4.13µg/g for chromium and nickel had 0.05-1.62µg/g.
These results from table 3,4,5, and 6 show that free ranger pigs
(muscles) tend to accumulate slightly higher concentrations of the various
heavy metals than the confined pig (muscles). This might be due to their
feeding habits and their free movement.
The results fell in line with reports of F. Fagioli and S. Landi (43). Finally,
the results are within the permissible limits as proposed by Food and
Agricultural Organization (FAO) and most countries standards.
Guideline values for Zn, Fe, Cu, Cr, Ni, Pb, and Cd in Pork recommended
by World Health Organization (WHO) in (µg/g) (44)
Zn Fe Cu Cr Ni Pb Cd
150 320 14 2.6 12 0.25 0.1
Source: E Merian (1991)

53
4.2 CONCLUSION
The levels of heavy metals found in the muscles of the pigs do not
pose problems for human consumption. More so, the data baseline
procured are useful for future studies on pollution and bio accumulation
in pigs.

54
REFERENCES
1. John H. Duffus (2002); “Heavy Metals” A Meaningless Term (IUPAC
Technical Report)” Pure and Applied Chemistry.
http://dx.doi.org/10.1351/pac200274050793 (Accessed 24 June
2008)
2. A Dictionary of Chemistry. Oxford University Press (2000); Oxford
Reference Online. Oxford University Press (Accessed 24 June
2008)
3. Clark R. B (1992); Marine Pollution. Clarendo Press Oxford U. K pp 61-
79
4. Gomagaiya P. I Tabudrava T. R., Suth R and Sotheesrraran Initials
(2001); Heavy Metals Contamination of Lani Coastal
Environment, Fiji Southern Pacific. Journal of Natural Sciencies,
19, 24-29
5. Lane TW, Morel FM (2000); “A Biological Function for Cadmium in
Marine Diatoms.
(http://www.pnas.org/cgi/pmidlookup/view=long&pmid=1078106
8)”. Proc.natl:Acad.sciU.S.A.97(9):4627-
31.doi:10.1073/pnas.090091379). PMID 10781068
(http://www/ncbi- nlm.nih.gov/pubmed/10781068). (Accesses 14
May 2008)
6. Lane T.W, Saito MA, George GN, Pickering IJ, Prince RC, Morel FM
(2005). “Biochemisty:a cadmium enzyme from a marine diatom:.
Nature 435 (7038):42.doi:10.1038/43502a
(http://www.ncbi.nlm.nih.gov/pubmed/15875011) (Accessed 28
April 2008)
7. Warren, L. J. (1981); Contamination of Sediments by lead, cadmium and
zinc, A Review: Environmental Pollution (Series B); 2,401-436

55
8. Fifield F. W and Haines P. J (1995); Environmental Analytical
Chemistry. Kingston Polytechnic Guat Yarmouth International
Textbook Company Limited. Printed in Great Britain by
Galliand Printers Limited. Pp 320-350
9. Wikipedia, the free encyclopedia “Trace Metals”.
(http://en.wikipedia.org/wiki/Trace_metals). (Accessed 3 July
2008)
10. Elson, Haas M. “Cadmium Excerpted from Staying Healthy with
Nutrition. The Complete guide to diet and nutritional medicine.
Published by Celestial Arts. (http/www.health.net)
11. Jones, R. R. (1989); The Continuing Hazard of Lead in Drinking Water,
Lancet 16:669-670
12. Cole H. H (1966); Introduction to livestock production. Second edition.
Springer, New York pp 156-165
13. Zeller J. H (1958); Breeds of Swine. Farmers Bul. No. 1263 US
Department of Agriculture pp 108-112
14. Smith W. W and Hutchings L. M (1952); Pork Production. The
Macmillan Company, New York pp 10-51
15. Bundy C. E, and Diggins R.V (1956); Prentice Hall, Eaglewood Cliffs,
pp 90-120
16. Briggs H. M (1958) Modern Breeds of Swine. The Macmillan Company
New York pp 70-150
17. Solomon N. (1982); Biological Availability of Zinc in Humans. Am J.
Clmi Nutr. 35, 104-105
18. Burnet, F.M (1981); A possible role of zinc in the Pathology of
Dementia. Lancet 1:187-188
19. Moynahan, E. U (1974); Acrodermatitis Enterohepatica: A Lethal
inherited Human Zinc Disorder: Lancet 2:399-400

56
20. Miroslav Radojevic and Vladimir Bashkin (1988); Practical
Environmental Analysis. He Royal Society of Chemistry, U.K
pp 102
21. Underwood E. J (1977); Trace Elements in Human and Animal
Nutrition. Academic Press London Academic Press London pp
307-319
22. Coultate T. P (1992); Food, the Chemistry of its components. Third
edition. Longman Group, Ltd U.K pp 108
23. Food and Nutrition Board (1980; Recommended Dietary Allowance 9th
Edition. National Academy of Sciences – National Research
Council, Washington, D. C pp 125 – 133
24. Danks, D. D. Stevens B. J.; Campbell P. E (1972). Menkess‟ Kinky-hair
Syndrome. Lancet 1:1100-1102
25. Tanner M. S; Kantarjam A. H; Behave S.A; Pandit A.N. (1983) Early
Introduction of Copper Contaminated Animal Milk. Feeds as a
possible cause of India Childhood Cirrhosis. Lancet 2:992-995
26. Anderson, R. A (1989); Essentiality of Chromium in Humans. Science
of the Total Environment 86; 75-81
27. Mossop, R. T (1983); Effects of Chromium (III) on fasting Glucose;
Cholesterol and Cholesterol HDL Levels in Diabetics. Central
African Journal of Medicine 29; 80-82
28. Arnold, E. B. (1982); Dictionary of Nutrition and Food Technology 5th
Edition. Butterworts and Co-publishers Ltd pp 179
29. McGrath S. P Smith (1990); Chromium and Nickel In Heavy Metals in
Soils. Alloway B. Jed Halsted Press, J. Wileys and Sons Ny pp
16- 149

57
30. Cronin, E; Michael D; Brown S. S (1980); Oral Challenges in Nickel
Sensitive Women with Hand Eczema. In Brown, S. S.
Sunderman, F. W. Jr. ed. Nickel toxicology. Academic Press,
New York pp 149-152
31. Jerome O. Nriagu and Milagros S. Simimons (1983); Food
Contamination from Environmental Sources. Springer Verlag;
Berlin pp 60-108
32. Turner D. (1980); “Lead in Petrol, part 2” Environmental Health Chem.
16; 312-314
33. ATSDR Toxicological Profile of Lead (1991); US Department of Health
and Human Service, Public Health Services 205-1999-00024
34. Bowen; H.J.M (1979); Environmental Chemistry of the Elements.
Academic Press, New York, pp 20-102
35. Asami, T. (1984); “Pollution of soils by Cadmium” in J. O.Nriagu, ed
Changing Metal Cycles and Human Health Springer-Verlag,
Berlin pp 98-111
36. Anonymous (1971); Cadmium Pollution and Itai-Itai Disease (Editorial)
Lancet 1:382-383
37. Groten, J.P.; Van Bladeven, P. J (1994): Cadmium Bioavailability and
Health Risk in Food Trends in Food Science and Technology
5:50-55
38. Galas-gorcjey, H (1991); Dietray Intake of Pesticide Residues:
Cadmium, Mercury and Lead Food Ad and Cont 8:793-806
39. Larry G. Hangis (1988); Analytical Chemistry “Principal and
Techniques” Prentice Hill Inc, A Division of Simeon and Schuster
Englewood Cliffs, New Jersey pp 18-40
40. Okoye, C. O.B (2005); Understanding Analytical Chemistry. Jolyn
Publishers Nsukka 114p

58
41. Ademordi, C. M. A (1996); Standard Methods for Water and Effluents
Analysis. March Prints and Consultancy Foudex Press Ltd. Ibadan
pp 111-112
42. Cowley, K. M (1976); Atomic Absorption Spectroscopy in Food
Analysis. The Letter Head Food Research Association,
Randalls Roads, Leather Head Survey. United Kingdom 293p
43. Fagiolo F. and Landi S. (1983); Analytical Letters, 16 (A17 & 18) 1435-
1447).
44. E. Merian (ed), (1991) Metals and their Compounds in the Environment-
Occurrence, Analysis and Biological Relevance”, VCH,
Weinheim, p.704