concept mapping as evaluation tool in mathematics george...
TRANSCRIPT

CONCEPT MAPPING AS EVALUATION TOOL IN MATHEMATICS
George BARALOS
Centre for Educational Research Greece
ABSTRACT In this study we initially discuss in brief some theoretical issues related to the notion of concept
mapping, a scoring rubric for concept mapping assessment and a rationale for its design. Then, we examine two groups of eleventh grade students from a public school, who were taught the same textbook of mathematics, although they were targeting the entrance to different university schools and we investigate whether :
1.There is a difference on performance between these two groups of students in conventional written tests.
2. There is a difference between the cognitive structures of these groups concerning PMI. 3. Students’ misconceptions in maths are clarified by the process of concept mapping. 4. There is a correlation between concept mapping ability of students and their performance in
mathematical achievement test exists. Finally we present the outcomes of our research which provide evidence that concept mapping is an
essential supplementary tool for the evaluation in mathematics. Keywords : Concept maps, evaluation, scoring rubric system, PMI.

Introduction The teaching of mathematics must contribute to the development of both procedural and the
conceptual knowledge. On the other hand, good learning of mathematics requires not only the knowledge of the different procedures and concepts of the subject matter, but also of the adequate relations among such concepts which lead to the construction of the right mathematical meaning.
In order to achieve a teaching that conduces to the desired learning we seek for a didactic methodology and a theoretical setting provided by educational psychology.
Behaviorism learning theory (Thorndike,1922; Watson,1970; Skinner,1974; Wittrock,1984) was focused on the presentation of the information and its transfer from the teacher to the learner with the latter seen as an empty vessel to be filled with Knowledge. However, the transfer of knowledge in the bipolar model teacher – learner did not work and the problem of inadequate learning remained.
Facing this situation cognitive scientists focused on the learners’ side and formulated the contemporary Constructivism theory (Piaget,1959 ; Vygotsky, 1978 ; Classersfeld,1995 ; Cobb &Yackel,1998) whose main assumption is that Knowledge does not exist in an objective reality and is actively constructed from within by the learner.
The Constructivist model has been widely accepted aiming at the conceptual understanding for which Kinnear(1994) says : “Conceptual understanding is influenced by the prior knowledge brought by students to learning situations. This prior knowledge is labeled as preconceptions, naive theories, alternative frameworks or misconceptions ” (p.6)
For constructivism, goals of instruction are, deep understanding and concept development and not behaviors or skills (Fosnot,1996). Accordingly teachers must aim to “establish explicit linkages for students between new information taught in class and students’ past and future experiences… summarize, review and link main concepts at critical points through and at the conclusion of units and lessons’’ (Ennis,1994,p.167).
Within this framework , it is very important that teachers know in the beginning and after a course cycle, whose dimensions are laid down by the curriculum, their students’ conceptions about the subject matter of the instruction in order to design the appropriate activities for a conceptual change. The usual practice for students’ knowledge assessment are conventional tests. These tests are perhaps suitable for the assessment of behaviorist skills, such as rules, formulas and algorithms, which concern the procedural knowledge(*) but they are not functional for the students’ conceptual structure detection on a certain topic. Conceptual knowledge, generally called declarative knowledge, is the knowledge of facts, the meanings of symbols and the concepts and principles (Posner,1978) of a particular field of mathematics. It demands a conscious effort from both students and teachers and in this direction Steffe(1990) points out the need for a curriculum design as a network of mathematical concepts and operations that could deepen, unify and extend conceptions of mathematics.
Research suggests that understanding can be viewed as a connection between two pieces of information (Ginsburg,1977) and the degree of a student’s understanding is determined by the number, accuracy and strength of connections (Hiebert & Carpender,1992)
A very useful tool for explicitly stressing mathematical connections is concept mapping. Concept mapping (Novak & Gowin,1984 ; Novak,1990) is a visual representation of an individual’s knowledge structure on a particular topic. This representation takes the form of a finite graph with nodes that depict the mathematical concepts and links (lines or arcs) which in turn represent the relationships among them. Crosslinks are links that merge subnodes. Nodes, subnodes, links and cross links are labelled and arrows can be placed on the linking lines to
indicate the direction of the relationship between concepts. Two nodes with the labeled link in a concept map are called propositions. Basic attributes of concept mapping according to Novak (Novak & Gowin, 1984) are: Hierarchy, Progressive Differentiation and Integrative Reconciliation. In sum “concepts maps are two-dimensional representations of cognitive structures showing the hierarchies and the interconnections of concepts involved in a discipline” (Martin,1994,p.11).
Concept maps are used to evaluate how students organize their knowledge and give an observable record of their understanding. Several researchers like Ausubel(1968), Novak & Gowin(1984),
Malone & Deckers (1984), Markham and Mintzes(1994), McClure et al(1999) have recognized the advantages of this form of information presentation and have used concept mapping strategies in order to see how the individuals structure their knowledge as the subject matter.
Theoretical background The theoretical background of concept mapping refers to constructivist epistemology which
was briefly mentioned above and in Ausubel’s theory of meaningful learning that involves the assimilation of new concepts and propositions into existing cognitive structures. The cognitive scientist Ausubel(1966) distinguished meaningful vs rote learning and developed the Meaningful
(*) This definition of procedural knowledge refers to Cohen(1983) Learning or assimilation theory. Meaningful Learning occurs when : • New knowledge is integrated into the existing network of concepts and propositions in the
cognitive structure. • New knowledge incorporates into specifically relevant existing concepts or propositions • There is the ability of explicit delineation of similarities and differences between related ideas On the contrary, Rote Learning occurs with the arbitrary verbatim incorporation of new
information into cognitive structures. According to the meaningful learning theory, students obtain successful learning by
establishing relations between the new concepts to be learned and the ones they already grasp. Prior knowledge is of great importance and Ausubel(1978) underlines that : ‘‘If I had to reduce all of educational psychology to just one principle ,I would say this : The most important single factor influencing learning is what the learner already knows’’ (p.163).
Another support of concept mapping originates from systemic theory which asserts that meanings and concepts are not sums but organised physical systems of behaviours ( Paritsis,1986 ; Dekleris,1986 ) and similarly confirmed by the association memory theory (Deese,1995).
Finally, neurobiologists’ researches into the function of human brain, emphasize the important part of links and the connection with the conceptions, images and meanings (Changeaux,1988 ; Posner & Raichle,1994)
The use of concept maps has been founded in the suggestion that their structure parallels the human cognitive structure, as they show how learners organize concepts. Since we can not have a direct view of our cognitive structure, we use indirect methods as their indicators. One of these indicators is concept maps which researchers interpret as measures of this cognitive structure (Novak & Gowin,1984 ; Fisher et al,1990 ; Wandersee,1990 ; Lederman & Latz ,1995).The more meaningful connections an individual can put on a map ,the better understands the subject matter.
Objectives of the study To my knowledge, there is little published work on concept mapping in mathematics, less in
formal concepts and especially in Greek publications rather none. Thus, this study was organized on the basis of the following objectives :
1. To investigate whether a difference on students’ performance exists in conventional written tests between two groups of students who attend the same advanced mathematical eleventh grade school program but they are targeting the entrance to different university schools.
2.To investigate whether a difference between the cognitive structures of groups concerning PMI exists.
3. To investigate whether students’ misconceptions in maths are clarified by the process of concept mapping.
4. To investigate whether a correlation between concept mapping ability of students and their performance in mathematical achievement test exists.
Methodology In this study the subject matter “Principle of Mathematical Induction” (PMI) was chosen. This
concept constitutes a part of teaching material both in eleventh grade secondary school and in mathematics oriented courses in universities. Two eleventh grade classes which attended the unit for PMI from the same textbook were picked out for a week. The students received a training on how to construct a concept map in order to become familiar with this technique. In a week’s period, one hour per day, a series of concept mapping examples were presented to the students and they constructed their own paper and pencil based maps.
The sample
Classification
10 1121
13 14
2723 25
48
0102030405060
School A School B Total
Pos. Tech. Total
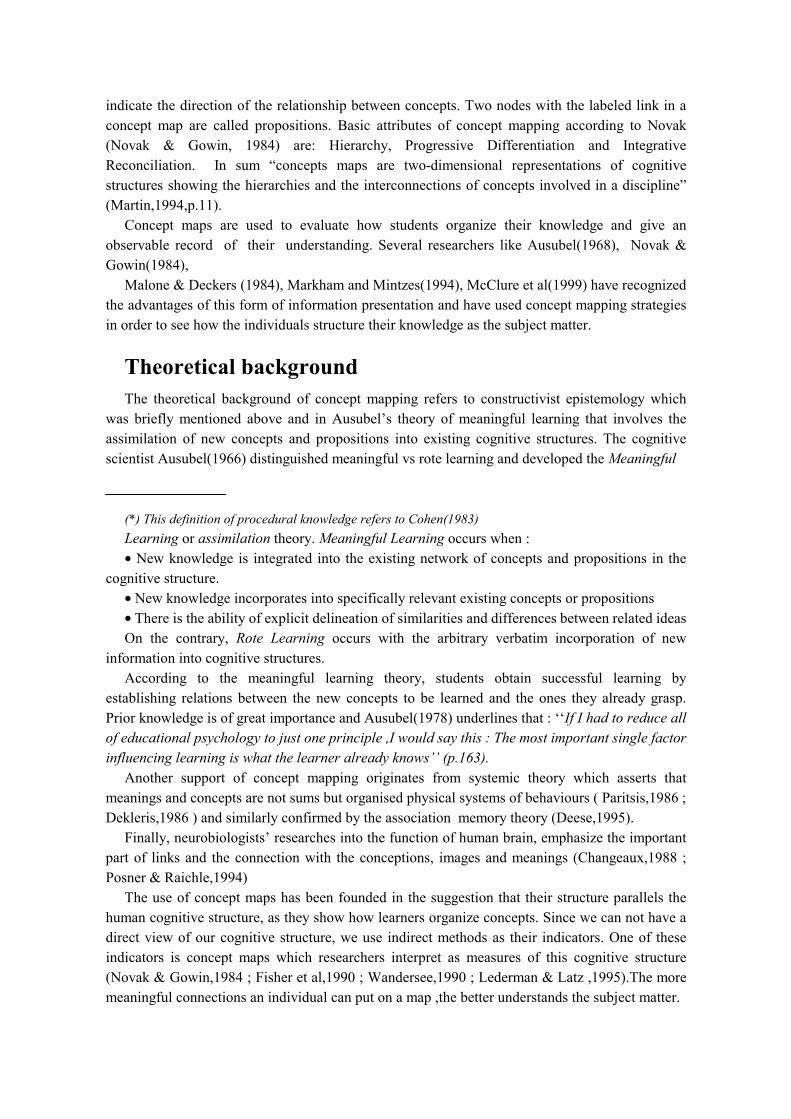
The sample for this study was comprised by forty eight secondary eleventh grade students from two different public schools. (Figure 1) Twenty one of them were targeting the entrance to university departments with advanced courses of mathematics (Positive group) and twenty seven of them were targeting the entrance to polytechnic schools (Technological group).
Figure 1
Instrumentation • After instruction in PMI, data were gathered with the following assessment tools :
1. The conventional written tests. 2. The concept maps that students constructed with the Key-Concept List method.
• Concept map scoring rubric The evaluation of the concept maps has been carried out by using both quantitative and
qualitative methods. For the quantitative assessment, a scoring rubric (S.R) was constructed

attempting a synthesis of three concept map scoring systems. Essentially, the Relational Scoring System (R.S.S) or scoring system for a concept network (McClure & Bell,1990 ; McClure et al.,1999) was employed (Appendix I). With this method, three parts of the proposition are scored :
a) The existence of a relation between the concepts b) The accuracy of the label c) The direction of the arrow indicating either a hierarchical or causal relation between the concepts. In this method raters score individual maps by evaluating the separate propositions identified
on the map. The score for each proposition ranges from zero to three in accordance with a scoring protocol (Appendix.I) that considers the correctness of the proposition.
This scoring system was modified as follows : 1. More points were assigned for branchings (Markham et al, 1994). One point was
assigned to the first branching and one to three points for each successive branching depending on the differentiation level.
2. According to structural scoring system (S.S.S) (Novak & Gowin,1984 ; Novak,1990), more points were assigned in this way :
One point for each valid concept. Zero to three points to each cross link as proposition (R.S.S) and two to five more points depending on the significance of linked domains. Two more points were assigned for each valid example and up to two examples were used.
The total score for each map is the sum of the above scores. In addition taking into consideration the comparison rule (Novak & Gowin,1984) :
1. The ‘master’ or criterion map for PMI was rated with the above rules. 2. The student’s map score was divided by the master map score in order to give a
percentage for comparison. • Rationale in designing the rubric Typically, the Novakian S.S.S. is used to evaluate maps. However, this system coming from
biology is limited to hierarchical maps. Mathematics in eleventh and twelfth grades as well as, in mathematics oriented university departments, deal with formal concepts which are identified by their connections with other already known concepts like a network. There is no ‘hands on’ familiarity with these concepts resulting in a laborious effort in concept mapping. Besides, as Primo & Shavelson (1996) point out, imposing a hierarchical structure regardless of the content domain, is inadequate because an accurate concept map representation of hierarchical domain will be hierarchical itself.
Thus, we gave priority in propositions like R.S.S, which emphasizes networks and takes into consideration the hierarchy, as it appears in propositions.
The epistemological background for S.R. system and specifically the differentiation and integration of concepts, are founded in the Ausebelian Meaningful Learning and the Constructivist epistemology as previously noted.
Procedure In order to avoid the influence of teacher’s parameter the classes were taught by the same
teacher. After the instruction of PMI was completed the subsequent procedure was followed :
Students, with a consensus level about 0.9, generated the following list for the most important elements in PMI concept :
PMI, MMI (Method of Mathematical Induction), Simple induction, P(1), P(n)⇒P(n+1),One step, Two steps, Three steps, Infinite steps, Least element, Natural numbers (N*),Ordering, Axiom, Theorem.
The following day, a university professor, a secondary school advisor in mathematics and two experienced secondary school teachers of mathematics, taking into consideration the textbook in the domain of PMI and students’ above list, created the Key-Concept List and the master – criterion map for PMI. (Appendix.II). The consensus level of the Key-Concept List was about 0.95 and comprised one more concept concerning the students’ list : The M.Ponens.
A day after, students took a two hour conventional closed type written test which is the usual practice in Greek school examinations and generated in one more hour a concept map with the above Key-Concept List. The validity of the tests is ensured because of the analysis of PMI as the subject matter
Results and discussion The four developers of the Key-Concept List and the criterion map, rated the written tests and
the concept maps. The data were analysed separately with SPSS using t-test, ANOVA test and Pearson correlation coefficients.
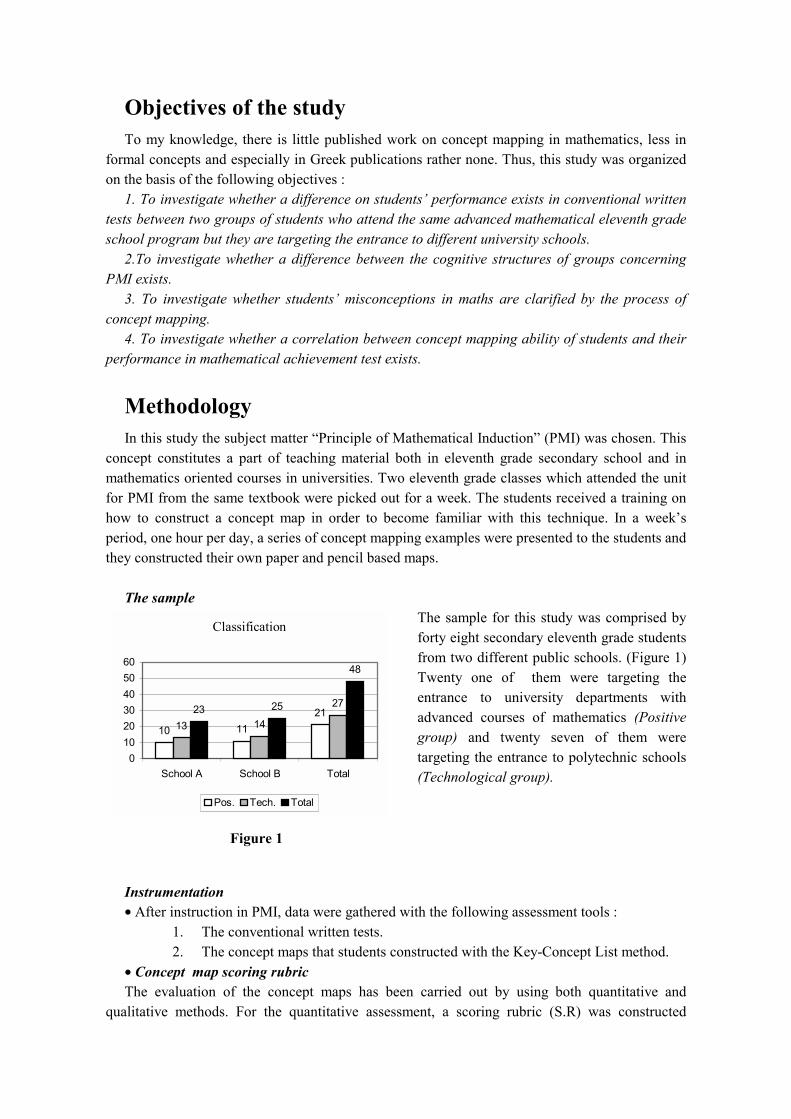
A. Conventional tests The Pos.Group was more homogeneous than Tech.Group since the range of scores in written
tests were 9 vs 15. The average score for the Pos.Group was 13,52 vs 11,66 of the Tech.Group which means that the Pos.Group scored better than the Tech.Group ( Figure 2 ). However, the Pos.Group’s performance was not significantly better, since the t-test resulted in the comparison of means t-value = -1,905, which was not significant at 0.05 level ( P-value = 0,063 ).
��������������������������������������������������
Pos.Group (Raters)
14,14
12,76
14,19
13
1212,5
1313,5
1414,5
Prof. Adv. T.1. T.2.
The secondary school teachers (T1,T2) rated higher than the professor and the advisor, but the differences between the raters were not significant at 0,05 level. For example, the ANOVA test results for the rating of the Pos.Group, were : F =1,55, P-value=0,209.
Figure 2
B. Concept mapping The maps were rated according to the designed scoring rubric system, separately for the five
different attributes of the concept maps ( Concepts, Propositions, Cross links, Branching , Examples ).Then, total scores were assigned which were obtained by summing the weighted partial scores and finally percentages were computed for comparisons, taking into consideration the total score of the criterion map on PMI. The secondary school teachers rated lower than the professor and the advisor, but again the differences between the raters were not significant at 0,05 level.
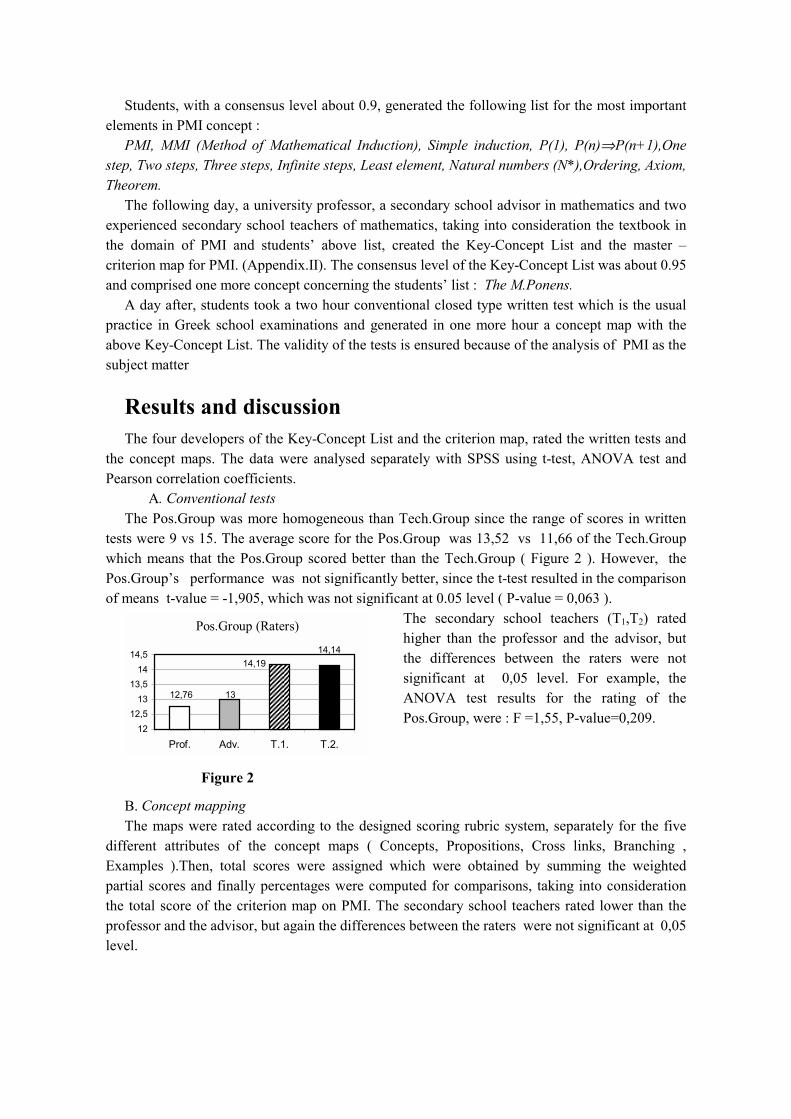
1. Attributes’ scores The Pos.Group scored higher than the Tech.Group. The presentation of the groups’ learning
profile in a graphical format (Figure 3) which depicts the scores of the various attributes, reveals that :
The Pos.group uses more concepts from the Key-List and makes more valid connections within these concepts than the Tech.group Thus insertion provides an indication that the Tech.group had a greater difficulty than the Pos.group in :
ATTRIBUTES
7,33
2,140,81
1,43
8,43
0,33 1,29 0,96
5,926,59
0
2
4
6
8
10
Conc. Prop. Cr.Lin. Branc. Exam.
Pos.Group Tech.Group
Figure 3
• Recognizing the important terms connected with PMI • Recognizing, denoting and signifying the relations – links within concepts of PMI. This difficulty is interpreted as a lower ability of the Tech.group to differentiate component concepts of PMI. Further more, the lower score for branchings and crosslinks indicate a lower progressive differentiation and a lower knowledge integration in PMI as for the
Tech.group in comparison with the Pos.group. The qualitative analysis of students’ concept maps confirms this indication, since students tend to identify PMI as MMI and similarly the Simple Induction.
2.Total scores The average in concept mapping scoring was 41,43 for the Pos.group vs 29,3 the Tech.group
which means that the Pos.group performs better than the Tech.group in the task of concept mapping in PMI. This is indicated by the t-test which resulted in t=4,633 which is significant at 0,01 level (P-value = 0,000). Consequently the Pos.group has a significantly better understanding of PMI. The Professor and the Advisor rated higher than the secondary school teachers but differences between the raters, as in the conventional tests assessment, were not significant at 0,05 level. It can be suggested that these differences are related to the concept mapping scoring familiarity.
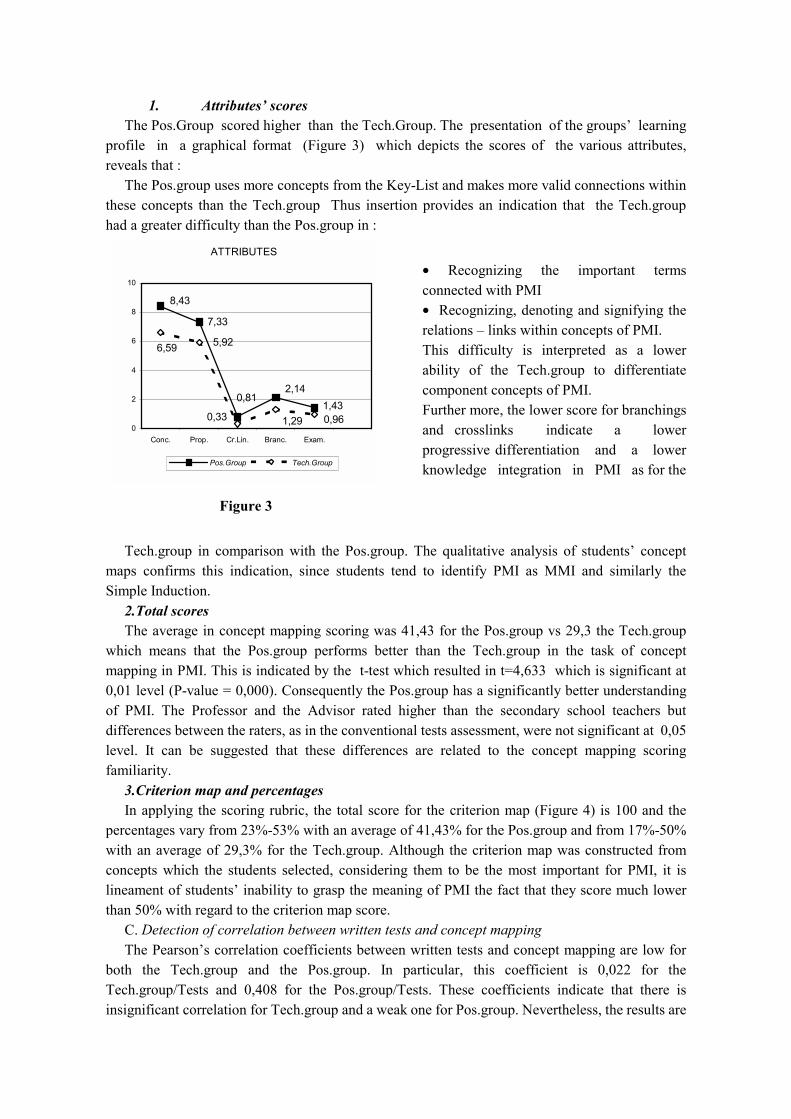
3.Criterion map and percentages In applying the scoring rubric, the total score for the criterion map (Figure 4) is 100 and the
percentages vary from 23%-53% with an average of 41,43% for the Pos.group and from 17%-50% with an average of 29,3% for the Tech.group. Although the criterion map was constructed from concepts which the students selected, considering them to be the most important for PMI, it is lineament of students’ inability to grasp the meaning of PMI the fact that they score much lower than 50% with regard to the criterion map score.
C. Detection of correlation between written tests and concept mapping The Pearson’s correlation coefficients between written tests and concept mapping are low for
both the Tech.group and the Pos.group. In particular, this coefficient is 0,022 for the Tech.group/Tests and 0,408 for the Pos.group/Tests. These coefficients indicate that there is insignificant correlation for Tech.group and a weak one for Pos.group. Nevertheless, the results are

consistent with studies which examined a similar correlation. For example, McClure and Bell(1990) reported correlations about 0,50 between concept map scores and the final examination score (Science) and Novak, Gowin and Johansen(1983) found that relative correlation was 0.02 (Maths).
Generally, the students had great difficulty with the PMI concept as it was revealed by their concept maps. The written conventional tests provided evidence that the students :
1. Identified PMI as MMI 2. Believed that MMI was identical with the simple induction 3. Could not differentiate that P(n)⇒P(n+1) is one proposition This evidence was confirmed by the concept mapping procedure.
Conclusions and implications From the above results and in relation to the research questions we set, it could be concluded
that : 1.The students of the Pos.group performed better than the ones in the Tech.group in
conventional tests but were not significantly better (a=0,05). Both groups scored in average above 50% of the scoring scale. Although the exercises in written tests regarding PMI were in the type “Show that” and required the mechanical implementation of mathematical’s induction steps, the students did not score high. This is an indication of the difficulties they faced with the PMI concept.
2. The usual written tests detect mainly the procedural knowledge. Involving the concept mapping tool in the assessment tasks revealed, that :
• Both groups scored below 50%. However, the Pos.group performed better than the Tech.group in concept mapping and the difference was significant in favour of the Pos.group (0,05). Specifically the range of differences between the groups was greater when the students used the concept maps than when they used the conventional written tests.
• The students had great difficulty in making connections among the PMI concept components. • The majority of the students failed to differentiate well the Key-List concepts, as there were
indicative findings like :
PMI is MMI or PMI is Simple Induction
• The majority exhibited the misconception that P(n) ⇒ P(n+1) is not a single proposition. This was indicated in their concept maps by shapes like :
PMI
Consists of three steps
P(1) P(n) P(n+1)
3. There was no substantial correlation between written tests and concept maps. This was interpreted as evidence that :
• Conventional tests can not differentiate well between procedural and conceptual knowledge

• Concept mapping is an essential supplement of conventional tests which reveals a different view of students’ cognitive structures
Our sample of course, is small to generalize under a quantitative approach. However the outcomes encourage the use of the concept mapping technique and provide evidence that it is not only a useful but also a necessary supplementary tool for the evaluation in mathematics. Besides, although the designed scoring rubric (S.R) for concept mapping in mathematics must be further tested for reliability and validity, it seems that S.R. is effective as for concept mapping in secondary mathematics education and we strongly suggest its implementation in undergraduate mathematics courses.
REFERENCES Ennis,C.D.(1994).Knowledge and beliefs underlying curricular expertise. Quest, 46,pp.164-175 Ausebel.D.P.( 1966 ). Meaningful reception learning and the acquisition of concepts. In Klausmeier.H.J. & Harris. C.W. (Eds). Analysis of concept learning (157-175).Academic Press. New York & London Ausubel,D; NovakJ & Hanesian,H.(1978). Educational Psychology: A cognitive view. Holt, Rinehart and Winston. New York. Changeaux.J.P.(1988). How works the human brain. Reedition. Athens. Cohen,G.(1983). The psychology of cognition. London – New York: Academic Press. Cobb,P and Yackel,E. (1998).A constructivist perspective on the culture of the mathematics classroom. In F.Seeger et al (Eds): The culture of the mathematics classroom, Cambridge University Press. Dekleris.M. (1986). Systemic theory. Athens. Sakkoulas Eds. Deese,J.(1965). The structure of associations in language and thought. Baltimore: Johns Hopkins Press. Fosnot,C.t.(1996). Constructivism: A psychological theory of learning. In C.T.Fosnot(Ed), Constructivism:Theory,perspectives and practice.New York: Teachers College Press. Fisher,K.M,Faletti,J.,Patterson,H.,Thomton,R.,Lipson,J.&Spring,C.(1990). Computer-based concept mapping-SemNet software : A tool for describing knoeledge networks.Journal of College Science and Technology,19,pp.347-352. Ginsburg,H,P.(1977). Children;sArithmetic.New York : D.Van Nostrand Co. Hiebert,J and Carpender,T.(1992). Learning and teaching with understanding. In: Handbook of research on mathematics teaching and learning.Grouws,D.(Ed),pp.65-97.New York:McMillan. Kinnear,J.(1994).What science education really says about communication of science concepts.Paper presented at the International Communication Association Conference.Sydney, Australia. (Eric Doc. No ED 390 353). Lederman,N,G.&Latz,M,S.(1995). Knowledge structures in the preservice teacher:Sources, development,interactions and relationships to teaching.Journal of science teacher education,6(1),1-19. Markham,K,M & Mintzes,J,J.& Jones,M,G.(1994).The concept map as a research and evaluation tool:Further evidence of validity. In J.R.S.T.,V(31),No.1,pp.1-101. Martin,D,J.(1994).Concept mapping as an aid to lesson planning: A longitudinal study. In J.E.S.E. V6(2).pp.11-30 McClure, J.R. & Bell, P.E. (1990). Effects of an environmental education related STS approach instruction on cognitive structures of pre-service science teachers. University Park, PA: Pennsylvania State University. (ERIC Document Reproduction Services No.ED 341 582) McClure,J,R & Sonak,B & Suen,H,K.(1999). Concept map assessment of classroom learning:Reliability, Validity and Logistical practicality. In J.R.S.T.,V(36), No.4, pp.475-492. Novak,J,D. & Gowin,D.B.(1984). Learning how to learn. New York: Cambridge University Press. Novak,J,D.(1990). Concept mapping :A useful tool for science education. J.R.S.T. 27, 937-949. Novak,J,D.& Gowin,D,R.& Johansen,G,T.(1983). The use of concept mapping and knowledge vee mapping with junior high school science students. Science Education,67,pp.627-645. Piajet,J.(1959). The Language ant the Thought of the Child. : Routledge and Kegan Paul Ltd , London Paritsis.N. (1986). Behaviour systems. pp.144 -179. Athens. Sakkoulas. Posner,G.M.(1978). Cognitive science: Implications for curriculum research and development. Paper presented at the AERA conference,Toronto. Posner.M. & Raichle.M. (1994). Images of mind. Scientific American Library. New York Primo,M,R. & Shavelson,R,J.(1996). Problems and issues in the use of concept maps in science assessment.In J.R.S.T.,V(3),No.6,pp.569-600. Skinner,B.F.(1974).About Behaviorism. Vintage Books: New York.

Steffe,L.P.(1990).Mathematics curriculum design: a constructivist’s perspective. In L.P.Steffe & T.Wood(Ed’s).Transforming Children’s Mathematical Education.Hillsdale.NJ:Erlbaum. Von Glasersfeld,E.(1995). Radical Constructivism : A way of Knowing and Learning. The Falmer Press, London. Vygotsky,L.(1978). Mind in Society : The development of higher psychological processes. MA: Harvard University Press. Watson,J.(1970). Behaviorism. Reedition (1924).The Nortion Liberary :New York. Wandersee,J,H.(1990). Concept mapping and the cartography of cognition. Journal of research in science teaching. 27(10),pp.923-936. Wittrock,M.(1984). Handbook of research on teaching. 3rd Ed.MacMillan.New York.

Appendix.I. Proposition to be scored Is there any relationship No between the subject and Assign a value of 0 the object ? Yes
Does the label indicate No a possible relationship Assign a value of 1 between the words ? Yes Does the direction of the arrow indicates a hierarchical, causal or sequential No Assign a value of 2 relationship between words which is compatible with the label ? Yes Assign a value of 3
Protocol for the Relational Scoring System (R.S.S)

Appendix.II
PMI Is Is not Do not Axiom Can be Consists of Capture Simple Induction Consists of Is not Do not capture Theorem Three Steps Infinite steps ( p(1), p(n), p(n+1)) Is not Two Steps Supports Apply in Which are MMI p(1) p(n) ⇒ p(n+1) N* ∀ n ≥ 1 Which Consists of has Proof Least element Ordering Use Proove Use M.Ponens Example 1 P(n), ∀ n ∈N* Example 2
Master-criterion map (Total score: 100)