concept of operations for integrating commercial
TRANSCRIPT

December 2017
NASA/TP–2017-219796
Concept of Operations for Integrating Commercial Supersonic Transport Aircraft into the National Airspace System Matthew C. Underwood Langley Research Center, Hampton, Virginia
NASA STI Program . . . in Profile
Since its founding, NASA has been dedicated to the advancement of aeronautics and space science. The NASA scientific and technical information (STI) program plays a key part in helping NASA maintain this important role.
The NASA STI program operates under the auspices of the Agency Chief Information Officer. It collects, organizes, provides for archiving, and disseminates NASA’s STI. The NASA STI program provides access to the NTRS Registered and its public interface, the NASA Technical Reports Server, thus providing one of the largest collections of aeronautical and space science STI in the world. Results are published in both non-NASA channels and by NASA in the NASA STI Report Series, which includes the following report types:
TECHNICAL PUBLICATION. Reports of
completed research or a major significant phase of research that present the results of NASA Programs and include extensive data or theoretical analysis. Includes compilations of significant scientific and technical data and information deemed to be of continuing reference value. NASA counter-part of peer-reviewed formal professional papers but has less stringent limitations on manuscript length and extent of graphic presentations.
TECHNICAL MEMORANDUM. Scientific and technical findings that are preliminary or of specialized interest, e.g., quick release reports, working papers, and bibliographies that contain minimal annotation. Does not contain extensive analysis.
CONTRACTOR REPORT. Scientific and technical findings by NASA-sponsored contractors and grantees.
CONFERENCE PUBLICATION. Collected papers from scientific and technical conferences, symposia, seminars, or other meetings sponsored or co-sponsored by NASA.
SPECIAL PUBLICATION. Scientific, technical, or historical information from NASA programs, projects, and missions, often concerned with subjects having substantial public interest.
TECHNICAL TRANSLATION. English-language translations of foreign scientific and technical material pertinent to NASA’s mission.
Specialized services also include organizing and publishing research results, distributing specialized research announcements and feeds, providing information desk and personal search support, and enabling data exchange services.
For more information about the NASA STI program, see the following:
Access the NASA STI program home page at
http://www.sti.nasa.gov
E-mail your question to [email protected]
Phone the NASA STI Information Desk at 757-864-9658
Write to: NASA STI Information Desk Mail Stop 148 NASA Langley Research Center Hampton, VA 23681-2199
National Aeronautics and Space Administration Langley Research Center Hampton, Virginia 23681-2199
December 2017
NASA/TP–2017-219796
Concept of Operations for Integrating Commercial Supersonic Transport Aircraft into the National Airspac System Matthew C. Underwood Langley Research Center, Hampton, Virginia
Available from:
NASA STI Program / Mail Stop 148 NASA Langley Research Center
Hampton, VA 23681-2199 Fax: 757-864-6500
Acknowledgments
This work was conducted under the NASA Fundamental Aeronautics Program, High Speed Project and the NASA Advanced Air Vehicles Program, Commercial Supersonic Transport Project. The support of the Advanced Air Vehicles Program, and specifically, the Commercial Supersonic Transport Project manager, Mr. Peter Coen, is gratefully appreciated.
The author would like to thank the members of the Air Traffic Operations Software development team and the Air Traffic Operations Laboratory operations staff who invested countless hours of hard work for the STONE study and the development of the Supersonic ASTOR model. The experiment discussed in this paper would not be possible without their dedication.
The use of trademarks or names of manufacturers in this report is for accurate reporting and does not constitute an official endorsement, either expressed or implied, of such products or manufacturers by the National Aeronautics and Space Administration.
i
Table of Contents 1 Background ............................................................................................................................. 1
2 Purpose..................................................................................................................................... 3
3 CST Design, Equipage, and Operational Assumptions ....................................................... 4
3.1 CST Design .......................................................................................................................... 4
3.1.1 Sonic Boom ................................................................................................................. 4
3.1.2 Aircraft Noise .............................................................................................................. 7
3.2 CST Aircraft......................................................................................................................... 8
3.3 CST Equipage ...................................................................................................................... 8
3.3.1 Vision System Technology Discussion and Assumptions .......................................... 8
3.3.2 Flight Management System Assumptions ................................................................. 11
3.3.3 CNS Systems Assumptions ....................................................................................... 11
3.4 Initial Operational Environment Assumptions .................................................................. 12
3.4.1 CNS Infrastructure Assumptions ............................................................................... 13
3.4.2 Airport and City Pair Assumptions ........................................................................... 13
3.4.3 Airspace Assumptions ............................................................................................... 13
4 Supersonic Transport Operations in the NAS Experiment .............................................. 14
4.1 Experiment Design............................................................................................................. 14
4.1.1 Simulation Environment ............................................................................................ 14
4.1.2 Scenario Description ................................................................................................. 15
4.1.3 Independent Variables ............................................................................................... 16
4.2 Results and Discussion ...................................................................................................... 18
4.2.1 Dependent Measures ................................................................................................. 19
4.2.2 Encounter Results and Discussion ............................................................................ 19
4.2.3 Flight Time Results and Discussion .......................................................................... 25
4.3 Experiment Notes and Further Development .................................................................... 29
4.4 Summary of STONE .......................................................................................................... 31
5 Operational Scenarios .......................................................................................................... 32
5.1 Pre-Departure Operations .................................................................................................. 32
5.1.1 Concorde Procedures and Operations ....................................................................... 32
5.1.2 Future CST Procedures and Operations .................................................................... 33
5.2 Taxi Operations .................................................................................................................. 33
ii
5.2.1 Concorde Procedures and Operations ....................................................................... 33
5.2.2 Future CST Procedures and Operations .................................................................... 33
5.3 Take-off and Departure Operations ................................................................................... 33
5.3.1 Concorde Procedures and Operations ....................................................................... 33
5.3.2 Future CST Procedures and Operations .................................................................... 34
5.4 Subsonic Cruise Operations ............................................................................................... 34
5.4.1 Concorde Procedures and Operations ....................................................................... 34
5.4.2 Future CST Procedures and Operations .................................................................... 34
5.5 Supersonic Acceleration and Climb Operations ................................................................ 35
5.5.1 Concorde Procedures and Operations ....................................................................... 35
5.5.2 Future CST Procedures and Operations .................................................................... 35
5.6 Supersonic Cruise Operations ............................................................................................ 36
5.6.1 Concorde Procedures and Operations ....................................................................... 36
5.6.2 Future CST Procedures and Operations .................................................................... 36
5.7 Deceleration and Initial Descent Operations ..................................................................... 36
5.7.1 Concorde Procedures and Operations ....................................................................... 36
5.7.2 Future CST Procedures and Operations .................................................................... 37
5.8 Arrival, Approach, and Landing Operations ...................................................................... 37
5.8.1 Concorde Procedures and Operations ....................................................................... 37
5.8.2 Future CST Procedures and Operations .................................................................... 38
6 Technology Needs.................................................................................................................. 39
6.1 Technology Addressing the Need for Corridor Clear of Traffic ....................................... 39
6.2 Real-time Flight-Deck Based Sonic Boom Mapping Tool ................................................ 40
6.3 En-route Flight Optimization and De-confliction .............................................................. 40
6.4 Efficient Operations during Arrival and Approach ........................................................... 40
7 Conclusion ............................................................................................................................. 41
References .................................................................................................................................... 42
List of Figures Figure 1: Concorde ......................................................................................................................... 1
Figure 2: NASA Shaped Sonic Boom Demonstrator Aircraft ........................................................ 6
Figure 3: Gulfstream Quiet Spike™ on NASA F-15 Testbed Aircraft .......................................... 6
Figure 4: Proposed NASA N+2 Commercial Supersonic Transport Vehicle ................................ 8
iii
Figure 5: Conceptual Supersonic Aircraft Configuration ............................................................... 9
Figure 6: Concorde Droop Nose ................................................................................................... 10
Figure 7: Triple Display System Used in XVS Proof-of-Concept Flight Test ............................. 11
Figure 8: Schematic of Commercial Supersonic Aircraft Trajectory ........................................... 16
Figure 9: Percent of Encounters by Phase of Flight ..................................................................... 20
Figure 10: Percent of Encounters by Phase of Flight (Level-Off Segment Removed) ................ 21
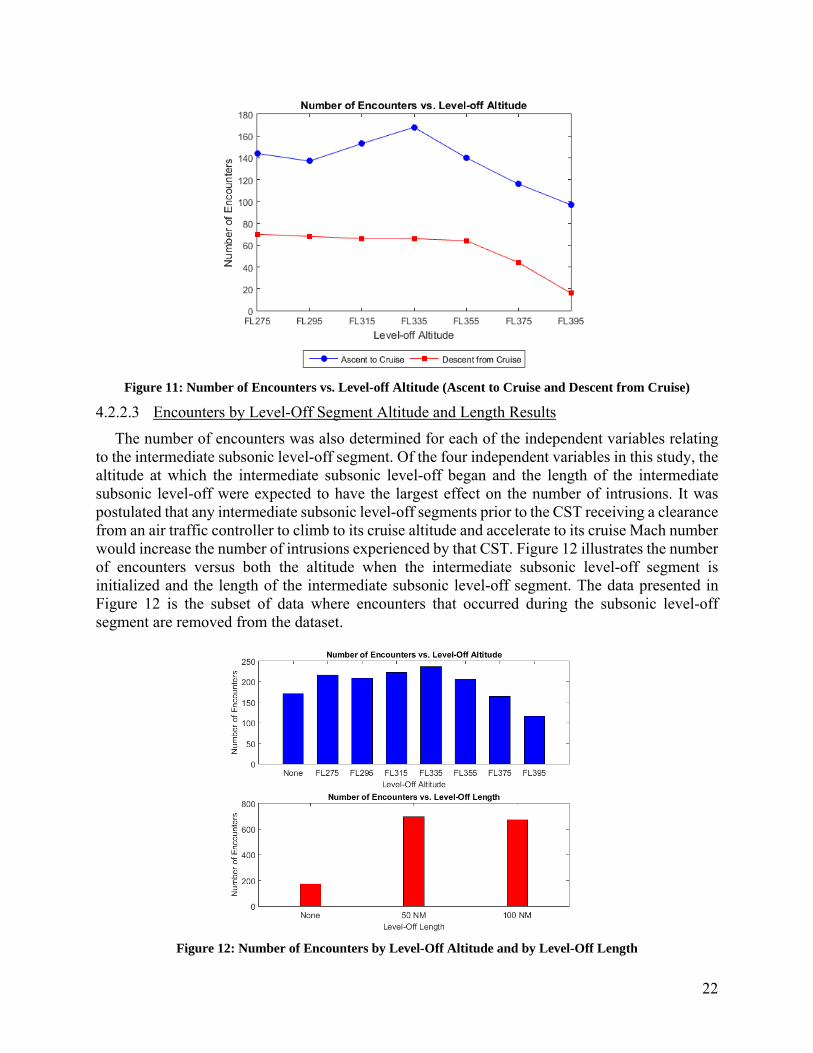
Figure 11: Number of Encounters vs. Level-off Altitude (Ascent to Cruise and Descent from Cruise) ........................................................................................................................................... 22
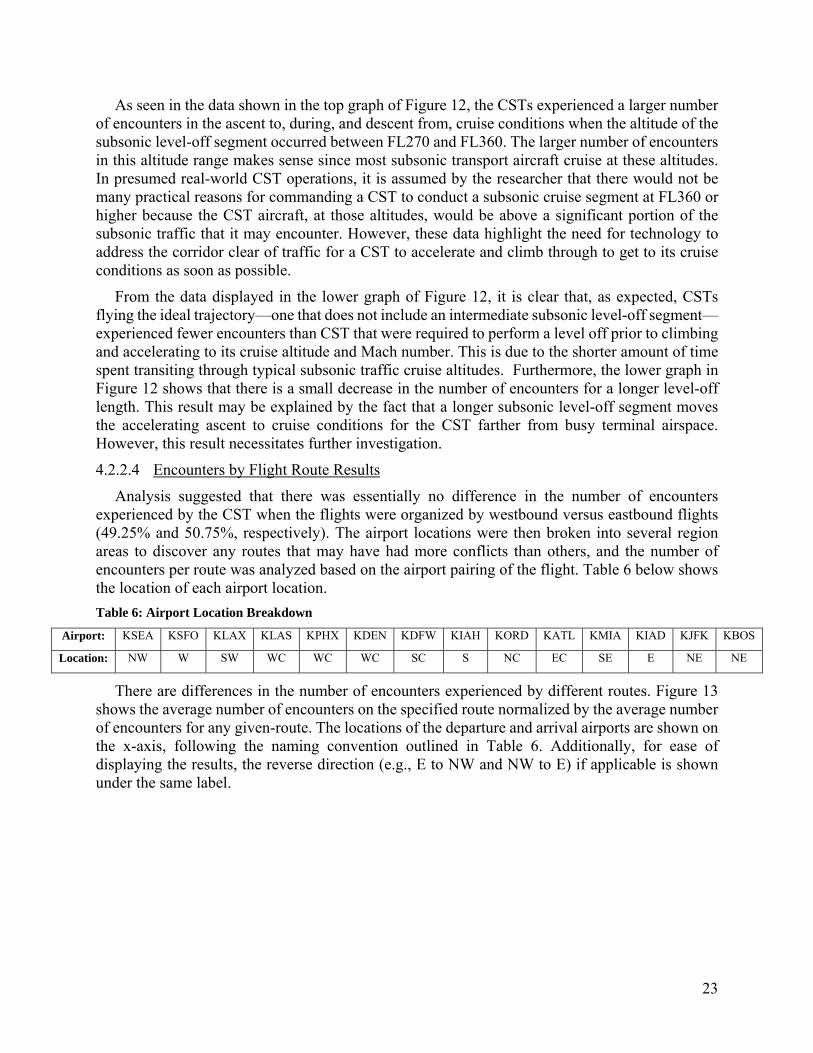
Figure 12: Number of Encounters by Level-Off Altitude and by Level-Off Length ................... 22
Figure 13: Encounters by Location of Departure and Arrival Airport ......................................... 24
Figure 14: Percent of Each Type of Planar Encounter Recorded ................................................. 24
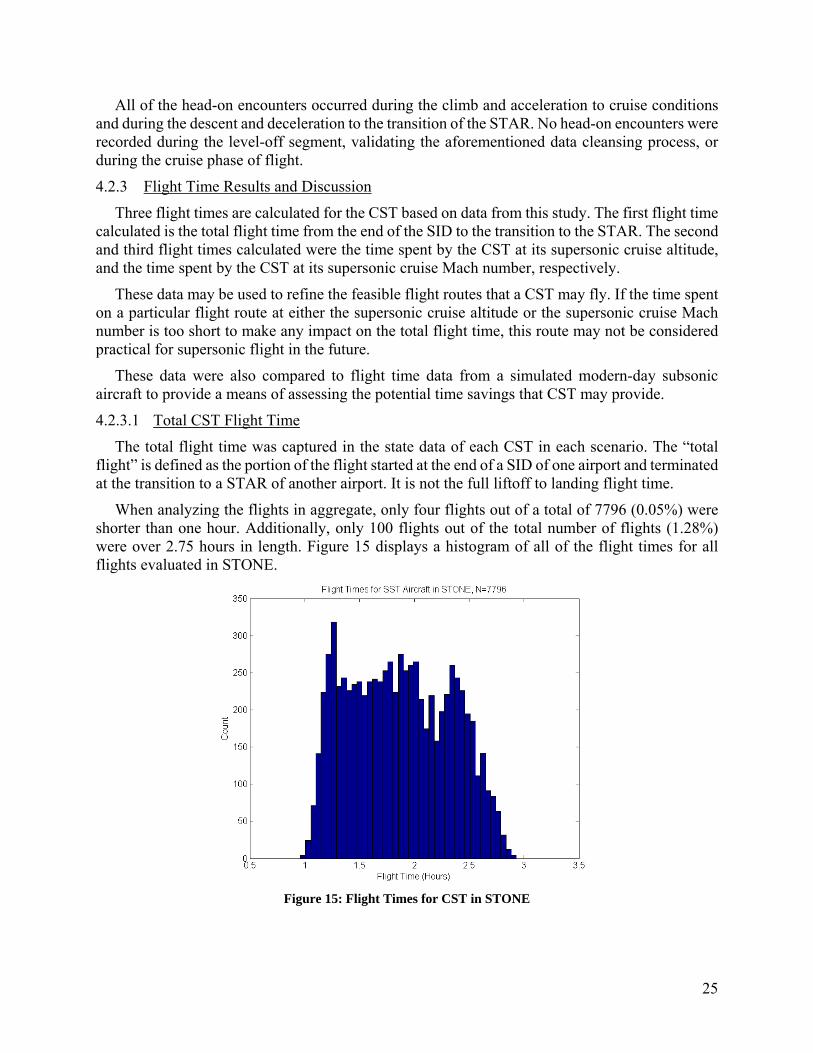
Figure 15: Flight Times for CST in STONE ................................................................................ 25
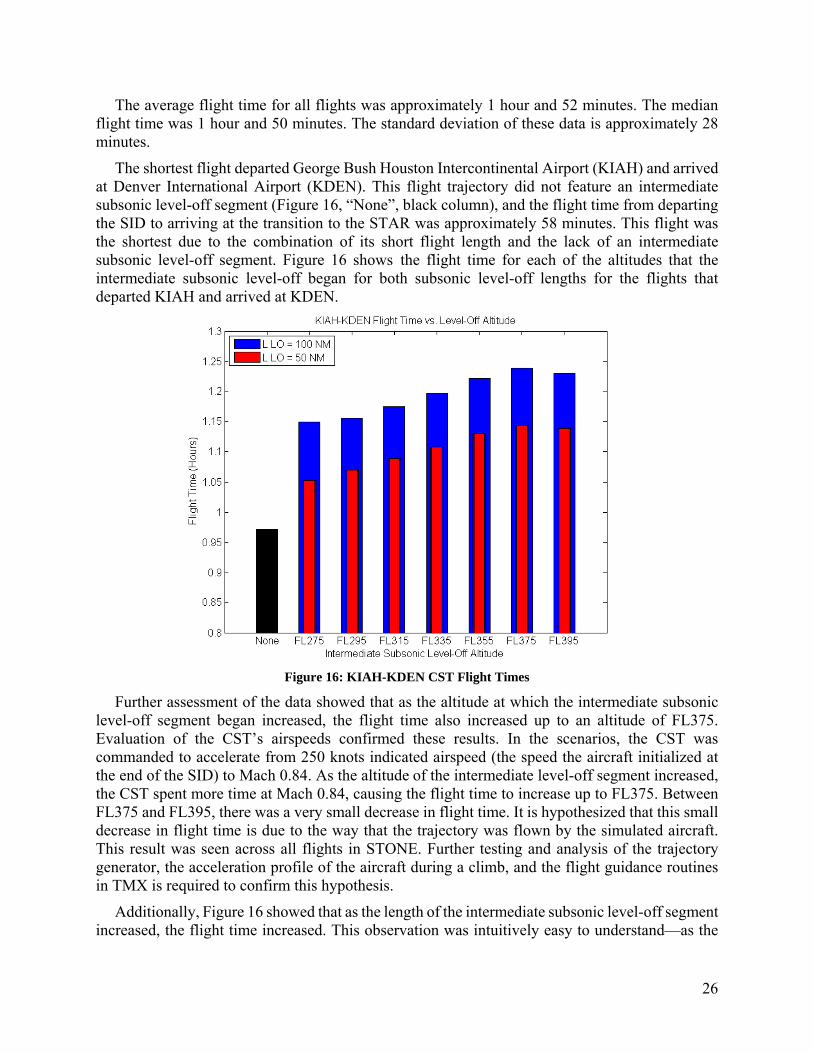
Figure 16: KIAH-KDEN CST Flight Times ................................................................................. 26
Figure 17: KSFO-KBOS CST Flight Times ................................................................................. 27
Figure 18: Time Spent by CST at Cruise Altitude ........................................................................ 28
Figure 19: Time Spent by CST at Cruise Mach Number .............................................................. 28
Figure 20: Example Trajectory Profile ......................................................................................... 30
List of Tables Table 1: Candidate Airports for STONE ...................................................................................... 16
Table 2: City Pairs used in STONE .............................................................................................. 17
Table 3: Departure Times for CST in STONE Scenarios ............................................................. 17
Table 4: Intermediate Subsonic Level-Off Lengths used in STONE ........................................... 18
Table 5: Intermediate Subsonic Level-Off Altitudes used in STONE ......................................... 18
Table 6: Airport Location Breakdown .......................................................................................... 23
iv
Nomenclature ACARS = Aircraft Communication Addressing and Reporting System
ADS-B = Automatic Dependent Surveillance—Broadcast
AFR = Autonomous Flight Rules
AGL = Above Ground Level
ASTOR = Aircraft Simulation for Traffic Operations Research
ATC = Air Traffic Controller
ATOS = Air Traffic Operations Simulation
CAS = Calibrated Air Speed
CG = Center of Gravity
CMS = Controller Managed Spacing
CNS = Communication, Navigation, and Surveillance
ConOps = Concept of Operations
CST = Commercial Supersonic Transport
DataComm = Data Communication
EFB = Electronic Flight Bag
FAA = Federal Aviation Administration
FIM = Flight-deck Interval Management
FL = Flight Level
FMS = Flight Management System
FOC = Flight Operations Center
GPS = Global Positioning System
HSCT = High-Speed Civil Transport
HSR = High Speed Research
ICAO = International Civil Aviation Organization
ILS = Instrument Landing System
KIAD = Dulles International Airport
KIAS = Knots Indicated Airspeed
KJFK = John F. Kennedy International Airport
LNAV = Lateral Navigation
NAS = National Airspace System
NASA = National Aeronautics and Space Administration
NATOTS = North Atlantic Organized Track System
NextGen = Next Generation Air Transportation System
NMI = Nautical Miles
RNAV = Area Navigation
RNP = Required Navigation Performance
SID = Standard Instrument Departure
v
SOP = Standard Operating Procedure
SSBD = Shaped Sonic Boom Demonstrator
STAR = Standard Terminal Arrival Route
STONE = Supersonic Transport Operations in the NAS Experiment
SWIM = System-wide Information Management
TCA = Technology Concept Aircraft
TOAC = Time of Arrival Control
TMX = Traffic Management eXecutable
USAF = United States Air Force
VMO = Maximum Operating Velocity
VNAV = Vertical Navigation
WAAS = Wide-area Augmentation System
XVS = eXternal Vision System
1
1 Background
ver since Charles “Chuck” Yeager broke the sound barrier in his Bell X-1 rocket-propelled aircraft, aircraft designers and airlines have sought to move scores of passengers to and from
destinations around the world at speeds faster than the speed of sound.
In the late 1950s, the rapid pace of aeronautical progress—with new turbojet-powered airliners flying twice as fast and twice as high as the propeller-driven transports they were replacing—promised even higher speeds in coming years. Concurrently, the perceived challenge to America’s technological superiority implied by the Soviet Union’s early space triumphs inspired a willingness to pursue ambitious new aerospace ventures. One of these ventures was the National Aeronautics and Space Administration (NASA) Supersonic Commercial Air Transport program. The NASA program was further motivated by proposals being made in the Soviet Union, Britain, and France to build a supersonic airliner [1]. The U.S. program was brought to a halt before an aircraft was built, but the Soviet effort and a joint venture between Britain and France continued. These two efforts resulted in the only two aircraft in the history of aviation that have ever realized the vision of a commercial supersonic aircraft. The Soviet Union’s Tupolev Tu-144 and the joint Anglo-French Concorde were both Mach 2.0 aircraft that could cruise at altitudes of up to 60,000 feet. Of these two, only the Concorde regularly operated at sustained speeds greater than Mach 1 [2].
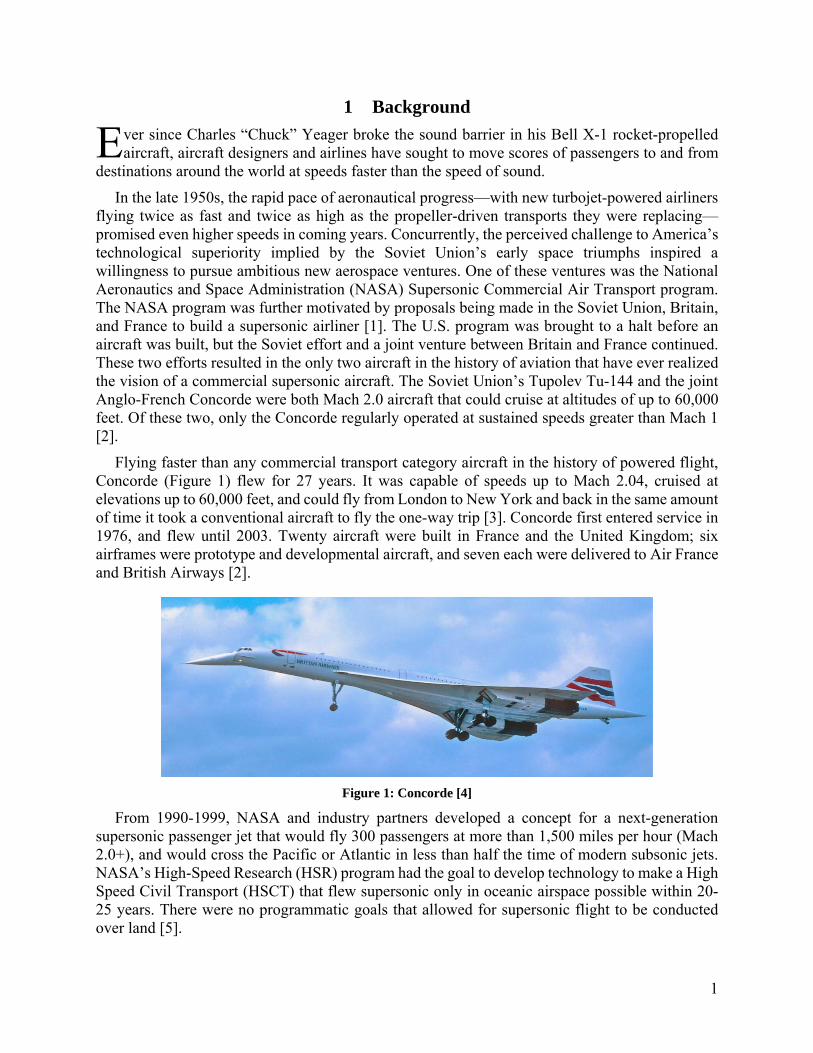
Flying faster than any commercial transport category aircraft in the history of powered flight, Concorde (Figure 1) flew for 27 years. It was capable of speeds up to Mach 2.04, cruised at elevations up to 60,000 feet, and could fly from London to New York and back in the same amount of time it took a conventional aircraft to fly the one-way trip [3]. Concorde first entered service in 1976, and flew until 2003. Twenty aircraft were built in France and the United Kingdom; six airframes were prototype and developmental aircraft, and seven each were delivered to Air France and British Airways [2].
Figure 1: Concorde [4]
From 1990-1999, NASA and industry partners developed a concept for a next-generation supersonic passenger jet that would fly 300 passengers at more than 1,500 miles per hour (Mach 2.0+), and would cross the Pacific or Atlantic in less than half the time of modern subsonic jets. NASA’s High-Speed Research (HSR) program had the goal to develop technology to make a High Speed Civil Transport (HSCT) that flew supersonic only in oceanic airspace possible within 20-25 years. There were no programmatic goals that allowed for supersonic flight to be conducted over land [5].
E
2
The NASA Advanced Air Vehicles Program Commercial Supersonic Transport (CST) Project, previously known as the Fundamental Aeronautics Program High Speed Project, is currently conducting research and development on key technical challenges to realize commercially viable supersonic flight, including lowering the sonic boom signature of future CSTs, meeting community noise requirements, and minimizing or eliminating the impact of high altitude engine emissions, all while improving the efficiency of the airframe and design process from previous NASA Supersonic Commercial Transport Vehicle project instantiations [6]. The research under these aircraft design and environmental technology challenge areas is critical to the eventual development of CSTs that are capable of flying supersonic over land.
The introduction of CSTs has the potential to bring revolutionary changes to U.S. competitiveness as well as to provide broad economic benefits to the global economy [7] [8]. As the world is becoming “flatter” and air travel more common, the availability of significantly faster air travel could become a catalyst of growth. The step to supersonic speeds offers the potential of a dramatic decrease in travel time. For example, a passenger could depart New York City at 7:00 AM local time on a quiet supersonic jet that flies at Mach 1.8 and has a range of 4,500 nautical miles, do two hours of business in a city such as London, Moscow, Rio de Janeiro, Los Angeles, Honolulu, or Anchorage, and be home at 7:00 PM local time [8]. Beyond the benefit of reduced travel time for business purposes, the reduction in travel time for CSTs compared to modern-day subsonic aircraft provides passenger comfort benefits and faster delivery of time-critical goods.
If supersonic travel becomes available at a reasonable cost, the effect could be as great as that experienced by society when subsonic passenger jets were first introduced. According to the National Research Council Committee on Breakthrough Technology for Commercial Supersonic Aircraft, economic benefits to the country and companies “first to market” with supersonic passenger jets fully justify the development cost [9].
3
2 Purpose
As previously mentioned, the CST project has laid out several technical challenges that must be overcome to achieve commercial supersonic flight. The NASA Aeronautics Research Mission Directorate Strategic Implementation Plan Thrust 2, “Innovation in Commercial Supersonic Aircraft,” outlines several barriers that preclude the development of an initial CST aircraft. However, once these challenges are met and a prototype is built and tested, the manner in which this class of aircraft is integrated in the National Airspace System (NAS) will become a potential constraint due to the significant operational, environmental, and economic repercussions that their integration may cause. Thrust 2 states that “Successful supersonic commercial aircraft must overcome the current prohibition against supersonic overland flight imposed to prevent public annoyance from sonic boom, and they must contend with or avoid operationally inefficient subsonic flight segments required for integration with existing air traffic [10].” This document begins the effort to solve the second barrier—integration with existing air traffic. NASA envisions that in the 2025-2035 timeframe affordable, low-boom, low-noise, and low-emission CSTs will be introduced into the NAS.
To prepare for that introduction, both flight deck and controller procedures must be designed and tested. To present these new procedures in the context of operational flights, background research on historical CST operations was conducted. Furthermore, background research was also conducted on commercial subsonic aircraft operations in, and enabling technologies for, the current-day NAS and in the envisioned Next Generation Air Transportation System (NextGen), as well as on known or postulated issues that will arise due to the fundamental differences between supersonic aircraft and subsonic aircraft, both physically and operationally.
This background research provided the following:
1. a starting point from which to build the procedures for integrating this class of vehicles into the airspace,
2. operational and equipage assumptions based on historic CST operations as well as current and expected future aviation operations,
3. an understanding of some of the technical barriers that must be overcome to realize commercial over-land supersonic flight,
4. an understanding of technology in the research and development stage that may be utilized to overcome those technical barriers, and
5. initial research questions that must be answered to realize the seamless integration of these vehicles.
This document was developed to create a path for research and development that exposes the benefits and barriers to integrating a class of CSTs into the NAS seamlessly, while also serving as a Concept of Operations (ConOps). This ConOps document posits a mid- to far-term solution (2025-2035) concept for best integrating CST into the NAS, and it is organized into four major sections: Assumptions, Study Results, Operational Scenarios, and Technology Needs.
4
3 CST Design, Equipage, and Operational Assumptions
Supersonic aircraft are fundamentally different from their subsonic counterparts, and several technological barriers exist with supersonic aircraft that do not exist with subsonic aircraft. These differences emerge because the vehicles are optimized for flight in completely different operating regimes (e.g., subsonic vs. supersonic cruise altitudes), they operate at vastly different speeds (e.g., subsonic vs. supersonic cruise speeds), and often, they are flown with different operational objectives (e.g., subsonic being with economy of operation and supersonic being reduced flight time with an acceptable overland sonic boom signature).
A specific illustration is how the difference in wing design between subsonic and supersonic aircraft operationally affects the flight crew. The wing of a subsonic aircraft is designed for subsonic cruise and, with a traditional flap design, can approach the runway with pitch attitudes that provide the pilots with an acceptable view of the runway during the descent. On the contrary, the highly swept wing needed for good supersonic cruise performance is inefficient for low speed flight and flap designs are only marginally effective. As such, a supersonic aircraft uses a much higher angle of attack to produce adequate lift at low speeds, approximately 12 degrees for Concorde [11]. For both Concorde and the TU-144, a drooped nose system was employed during final approach, provided the pilots with a satisfactory view of the runway, and allowed the aircraft to maintain its high angle of attack.
The following sections discuss aircraft design, equipage, and operational issues and introduces the underlying assumptions that were made to realize commercial supersonic over-land flight. Procedures and certain technologies presented in Sections 5 and 6 of this document, respectively, are predicated upon several assumptions regarding the future air transportation system and aircraft equipage.
3.1 CST Design
This section of the document discusses issues related to the design of the airframe of a CST when taking into account sonic boom propagation effects and airframe noise. These issues are fairly well understood and have been recognized since the Concorde first entered service.
3.1.1 Sonic Boom
When an aircraft flies faster than the speed of sound it produces shock waves that can reach the surface of the Earth, creating an often startling and annoying noise called a sonic boom [1]. Noise pollution during cruise conditions via the sonic boom phenomenon is a concern for supersonic aircraft—especially those that operate over land.
3.1.1.1 Early Sonic Boom Research
From July 1961 through January 1962, NASA, the Federal Aviation Administration (FAA), and the United States Air Force (USAF) carried out a series of tests in St. Louis, Missouri to determine the community response to sonic booms. The Air Force sent B-58 bombers on 76 supersonic training flights over the city at altitudes from 31,000 to 41,000 feet, announcing them as routine radar bomb-scoring missions. F-106 interceptors flew 11 additional flights at 41,000 feet. NASA Langley Research Center personnel installed sensors on the ground, which measured overpressures up to 3.1 pounds per square foot. Investigators who were confederates in the study responded to damage claims, finding some possibly legitimate minor damage in about 20 percent of the cases. Repeated interviews with more than 1,000 residents found 90 percent were at least
5
somewhat affected by the booms and about 35 percent were annoyed. The Air Force eventually approved restitution for over eight hundred damage claims. These results served as a warning that repeated sonic booms could indeed pose an issue for CST operations [1].
The St. Louis survey left many questions about public opinion unanswered. To learn more, the FAA, NASA Langley, and the USAF conducted the Oklahoma City Public Reaction Study from February through July of 1964. This was a much more intensive and systematic test, where B-58s, F-101s, F-104s, and F-106s were called upon to deliver sonic booms eight times per day, seven days a week for 26 weeks, with another 13 weeks of follow-up activities. The aircraft flew a total of 1,253 supersonic flights at Mach 1.2 to Mach 2.0 and altitudes between 21,000 feet and 50,000 feet. The FAA instrumented nine control houses scattered throughout the metropolitan area with various sensors to measure structural effects while experts from Langley instrumented three houses and set up additional sensors throughout the area to record overpressures, wave patterns, and meteorological conditions [1].
The National Opinion Research Center at the University of Chicago interviewed a sample of 3,000 adults three times during the study. By the end of the test, 73 percent of those surveyed felt that they could live with the number and strength of the booms experienced, but 40 percent believed they caused some structural damage (even though the control houses showed no significant effects), and 27 percent would not accept indefinite booms at the level tested. Analysis of the shock wave patterns by NASA Langley showed that a small number of overpressure measurements were significantly higher than expected, indicating probable atmospheric influences, including heat rising from urban landscapes. The Oklahoma City study added to the growing knowledge of sonic booms and their acceptance or non-acceptance by the public. However, due to the public and political reactions to the St. Louis and Oklahoma City tests, plans for another extended sonic boom test over a different city, including flights at night, never materialized [1].
3.1.1.2 FAA Ban on Supersonic Flight
On April 27, 1973, the FAA banned civilian supersonic flight over the United States [12] due to concerns about the effects of sonic booms. The ban was, in part, due to several intense protests from people on the ground who experienced sonic booms.
3.1.1.3 Aircraft Design for Sonic Boom
Early studies had found ways to redesign supersonic aircraft to minimize sonic booms to demonstrate to the FAA that overland supersonic flight could occur with minimal public annoyance. However, these methods seriously compromised the aerodynamic performance of the aircraft [5]. More modern methods using computational fluid dynamics have produced aircraft configurations that will create opportunities for overland supersonic flight, without adversely impacting the aerodynamic characteristics of the aircraft [13]. NASA has developed methods to design an aircraft with minimized sonic boom overpressure based on an extended nose and the shape and placement of the wings and tail.
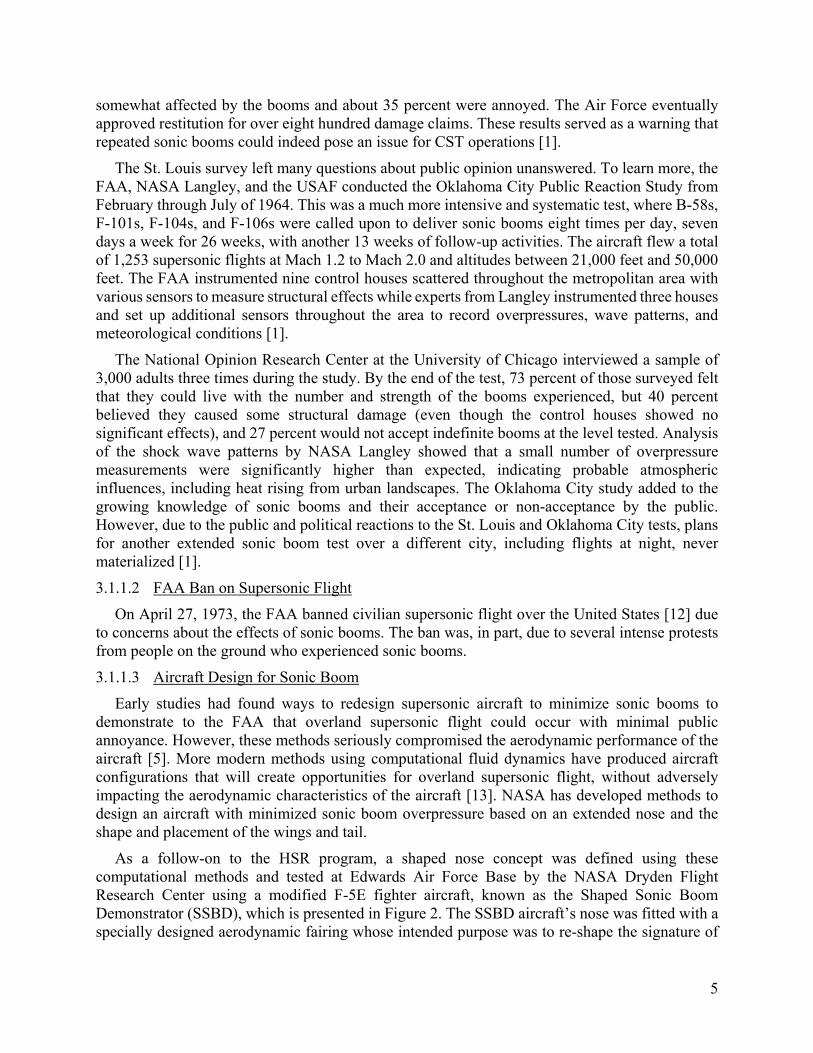
As a follow-on to the HSR program, a shaped nose concept was defined using these computational methods and tested at Edwards Air Force Base by the NASA Dryden Flight Research Center using a modified F-5E fighter aircraft, known as the Shaped Sonic Boom Demonstrator (SSBD), which is presented in Figure 2. The SSBD aircraft’s nose was fitted with a specially designed aerodynamic fairing whose intended purpose was to re-shape the signature of
6
the sonic boom produced by the aircraft from an “N-wave” to a waveform that more closely resembled a square wave. Noise measurements were taken as the aircraft flew over an array of microphones. These measurements showed that by modifying the forebody, the overpressure of the sonic boom was lowered from 1.2 pounds-per-square-foot for an unmodified F-5E to 0.9 pounds-per-square-foot for the F-5 SSBD, which equates to a reduction of approximately 2.5 decibels in perceived loudness. Further analysis showed that sonic booms produced by the F-5 SSBD actually averaged 4.7 decibels quieter than those produced by the F-5E [14].
Figure 2: NASA Shaped Sonic Boom Demonstrator Aircraft [15]
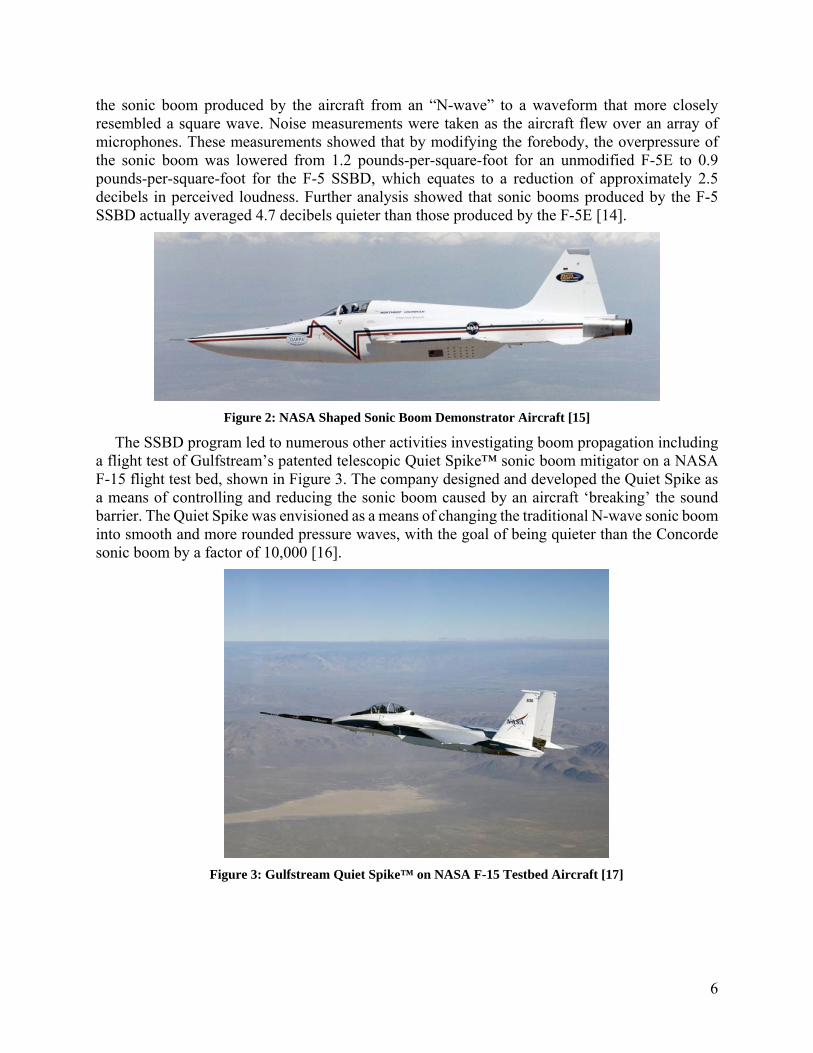
The SSBD program led to numerous other activities investigating boom propagation including a flight test of Gulfstream’s patented telescopic Quiet Spike™ sonic boom mitigator on a NASA F-15 flight test bed, shown in Figure 3. The company designed and developed the Quiet Spike as a means of controlling and reducing the sonic boom caused by an aircraft ‘breaking’ the sound barrier. The Quiet Spike was envisioned as a means of changing the traditional N-wave sonic boom into smooth and more rounded pressure waves, with the goal of being quieter than the Concorde sonic boom by a factor of 10,000 [16].
Figure 3: Gulfstream Quiet Spike™ on NASA F-15 Testbed Aircraft [17]
7
3.1.1.4 Assumptions Regarding Sonic Boom Issues
The major assumption throughout the remainder of this document is that sonic boom issues have been resolved through the design and configuration of the aircraft and that the current FAA restriction on overland supersonic flight has been lifted.
3.1.1.5 Research Issues Regarding Sonic Boom
Although the sonic boom may be mitigated by vehicle shaping, research is still needed to address operational issues. First, during turns, the pressure wave is focused on a single location and sonic boom effects will still be an issue. Further, the overpressure, while not necessarily creating a bothersome audible effect, will still create effects on the surface. Research is needed to identify how overpressure and focused boom effects can be taken into account during the flight planning and execution process.
3.1.2 Aircraft Noise
Noise associated with the propulsion and airframe of an aircraft has been an issue since jet aircraft entered service in the 1950’s. During the departure and approach phases of flight, when the CST is close to the ground, the noise pollution from the engines and airframe will continue to be a concern for communities surrounding airports.
3.1.2.1 Concorde Noise Complaints
In 1976, the Concorde entered trial services into and out of Washington Dulles International Airport (ICAO: KIAD) and John F. Kennedy International Airport (ICAO: KJFK) in New York City. The United States Secretary of Transportation permitted these operations for a period not to exceed 16 months. Additionally, due to public outcry over noise, Congress authorized a study to measure the effects of the noise produced by Concorde as it landed and took off. In 1977, the comptroller general in charge of the study found that the public opinion surveys conducted at Dulles International Airport were unreliable due to the survey’s sampling plan, questionnaire design, application, and coding and processing of responses. However, voluntary complaints were a significant indication of the public’s acceptance of Concorde operations at Dulles. Although Concorde operations accounted for less than one percent of all take-off and landing operations conducted at Dulles, they accounted for over 79% of the total noise complaints—the greatest of which concerned take-offs [18].
Due to the noise pollution and amendment to the Code of Federal Regulations, Title 14, Part 36 that states “It must be shown, in accordance with the provisions of this part in effect on October 13, 1977, that the noise levels of the airplane are reduced to the lowest levels that are economically reasonable, technologically practicable, and appropriate for the Concorde type design” [19], Concorde pilots were forced to use noise-abatement takeoff and landing procedures at both KIAD and KJFK, which are described later in this document.
3.1.2.2 Assumptions Regarding Future CST Noise
Like all modern subsonic commercial aircraft, future CSTs will have to comply with federal aircraft noise regulations. For this paper, it is assumed that the design of the airframe and the configuration of the engines will solve this issue, especially regarding the noise generated during take-offs, departures, approaches, and landings.
8
3.2 CST Aircraft
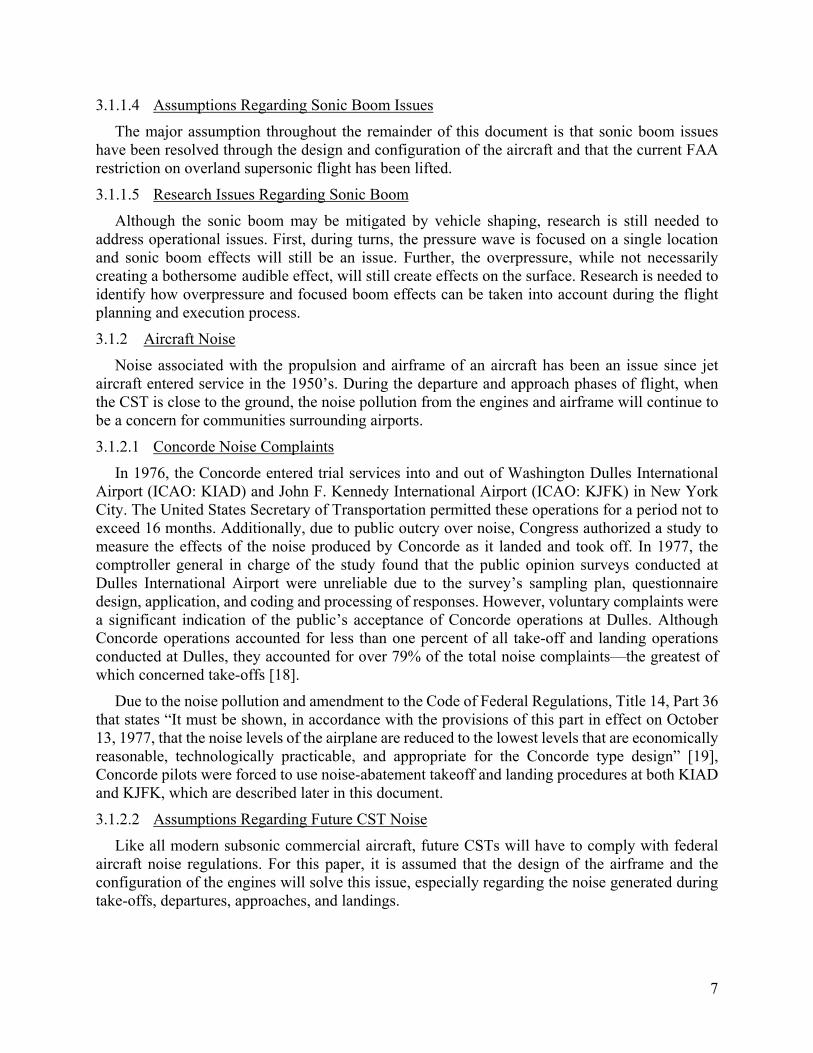
The aircraft assumed in this document is the NASA N+2 CST. The NASA N+2 aircraft is a small supersonic airliner accommodating up to 90 passengers. It has a range of 4000 nmi with a cruise speed between Mach 1.6 and 1.8 and a cruise altitude of 47,000 feet. Figure 4 provides a conceptual illustration of the NASA N+2 aircraft.
Figure 4: Proposed NASA N+2 Commercial Supersonic Transport Vehicle [20]
This assumption leads to other assumptions in this document, including assumptions made regarding the initial operational environment, aircraft equipage, and flight profile. However, the aviation community expects that the first instances of overland supersonic flight will be performed by business jets (6-20 passengers) and not airliners. The assumptions made for this document that are dependent on the vehicle type should be revisited in the future for their accuracy.
3.3 CST Equipage
This section of the paper discusses the assumptions made regarding aircraft vision system technologies, avionics, and communication, navigation, and surveillance (CNS) systems that are expected to be installed on a CST. This minimum equipage is required to realize the concepts and technology needs defined in Section 6 that will fulfill the example procedures outlined in Section 5 of this document.
3.3.1 Vision System Technology Discussion and Assumptions
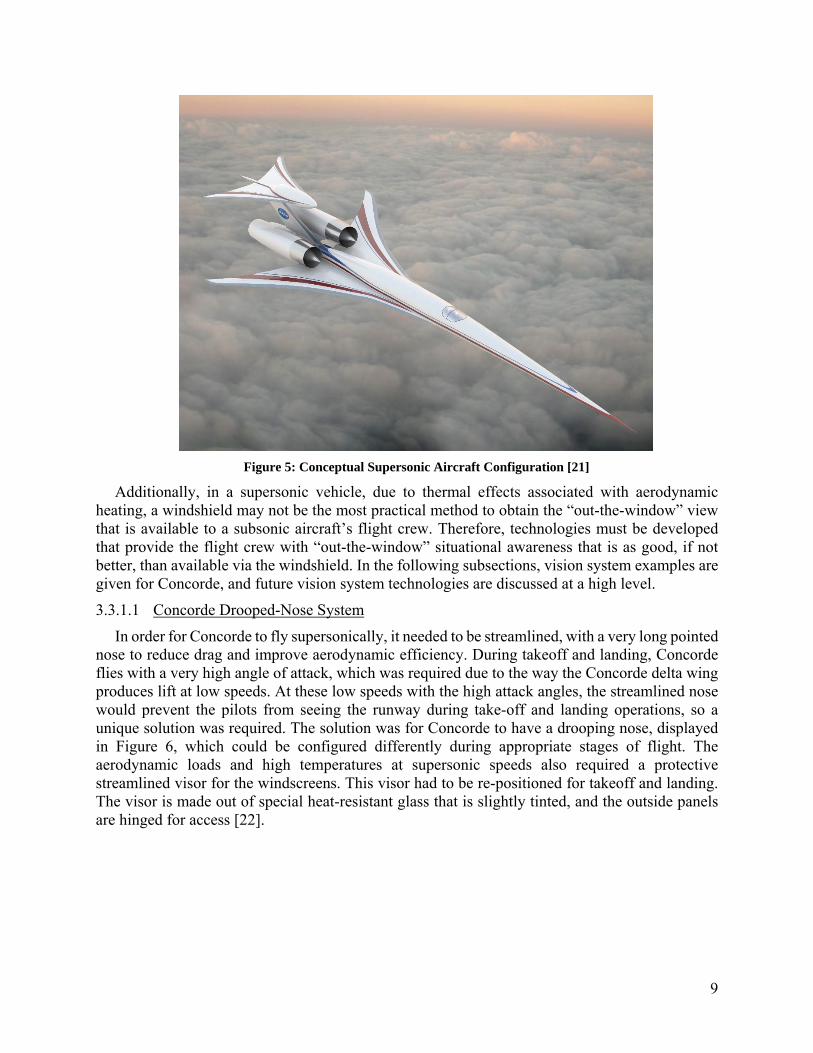
As the SSBD and Quiet Spike test aircraft suggest, a successful low boom supersonic aircraft design drives the shaping and configuration of the vehicle. One such conceptual configuration is shown in Figure 5. As evident in this figure, the “out the window” view for the flight crew is severely compromised as a result of the vehicle shaping.
9
Figure 5: Conceptual Supersonic Aircraft Configuration [21]
Additionally, in a supersonic vehicle, due to thermal effects associated with aerodynamic heating, a windshield may not be the most practical method to obtain the “out-the-window” view that is available to a subsonic aircraft’s flight crew. Therefore, technologies must be developed that provide the flight crew with “out-the-window” situational awareness that is as good, if not better, than available via the windshield. In the following subsections, vision system examples are given for Concorde, and future vision system technologies are discussed at a high level.
3.3.1.1 Concorde Drooped-Nose System
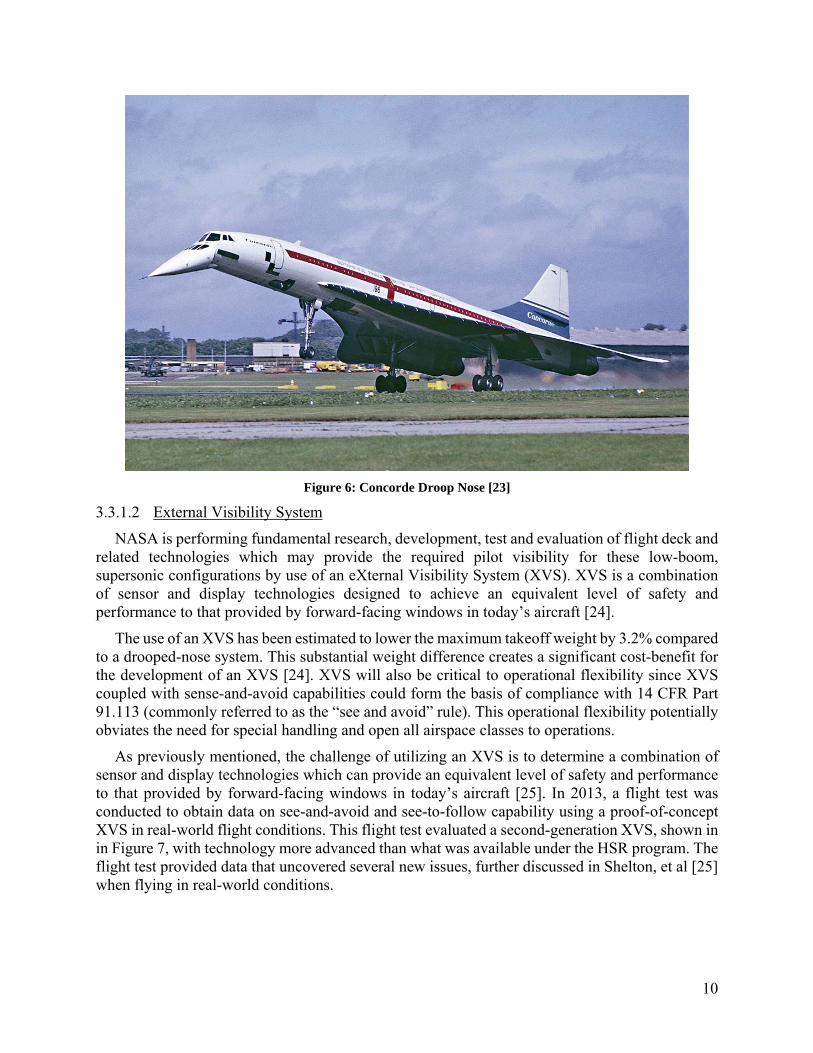
In order for Concorde to fly supersonically, it needed to be streamlined, with a very long pointed nose to reduce drag and improve aerodynamic efficiency. During takeoff and landing, Concorde flies with a very high angle of attack, which was required due to the way the Concorde delta wing produces lift at low speeds. At these low speeds with the high attack angles, the streamlined nose would prevent the pilots from seeing the runway during take-off and landing operations, so a unique solution was required. The solution was for Concorde to have a drooping nose, displayed in Figure 6, which could be configured differently during appropriate stages of flight. The aerodynamic loads and high temperatures at supersonic speeds also required a protective streamlined visor for the windscreens. This visor had to be re-positioned for takeoff and landing. The visor is made out of special heat-resistant glass that is slightly tinted, and the outside panels are hinged for access [22].
10
Figure 6: Concorde Droop Nose [23]
3.3.1.2 External Visibility System
NASA is performing fundamental research, development, test and evaluation of flight deck and related technologies which may provide the required pilot visibility for these low-boom, supersonic configurations by use of an eXternal Visibility System (XVS). XVS is a combination of sensor and display technologies designed to achieve an equivalent level of safety and performance to that provided by forward-facing windows in today’s aircraft [24].
The use of an XVS has been estimated to lower the maximum takeoff weight by 3.2% compared to a drooped-nose system. This substantial weight difference creates a significant cost-benefit for the development of an XVS [24]. XVS will also be critical to operational flexibility since XVS coupled with sense-and-avoid capabilities could form the basis of compliance with 14 CFR Part 91.113 (commonly referred to as the “see and avoid” rule). This operational flexibility potentially obviates the need for special handling and open all airspace classes to operations.
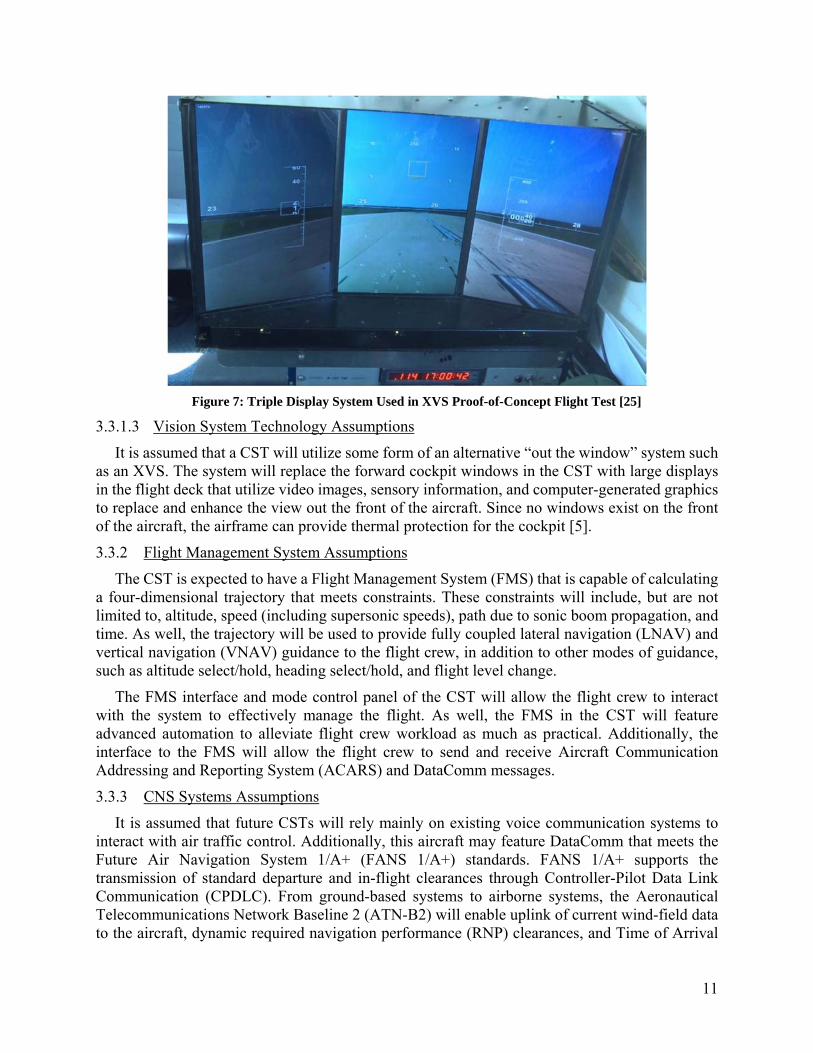
As previously mentioned, the challenge of utilizing an XVS is to determine a combination of sensor and display technologies which can provide an equivalent level of safety and performance to that provided by forward-facing windows in today’s aircraft [25]. In 2013, a flight test was conducted to obtain data on see-and-avoid and see-to-follow capability using a proof-of-concept XVS in real-world flight conditions. This flight test evaluated a second-generation XVS, shown in in Figure 7, with technology more advanced than what was available under the HSR program. The flight test provided data that uncovered several new issues, further discussed in Shelton, et al [25] when flying in real-world conditions.
11
Figure 7: Triple Display System Used in XVS Proof-of-Concept Flight Test [25]
3.3.1.3 Vision System Technology Assumptions
It is assumed that a CST will utilize some form of an alternative “out the window” system such as an XVS. The system will replace the forward cockpit windows in the CST with large displays in the flight deck that utilize video images, sensory information, and computer-generated graphics to replace and enhance the view out the front of the aircraft. Since no windows exist on the front of the aircraft, the airframe can provide thermal protection for the cockpit [5].
3.3.2 Flight Management System Assumptions
The CST is expected to have a Flight Management System (FMS) that is capable of calculating a four-dimensional trajectory that meets constraints. These constraints will include, but are not limited to, altitude, speed (including supersonic speeds), path due to sonic boom propagation, and time. As well, the trajectory will be used to provide fully coupled lateral navigation (LNAV) and vertical navigation (VNAV) guidance to the flight crew, in addition to other modes of guidance, such as altitude select/hold, heading select/hold, and flight level change.
The FMS interface and mode control panel of the CST will allow the flight crew to interact with the system to effectively manage the flight. As well, the FMS in the CST will feature advanced automation to alleviate flight crew workload as much as practical. Additionally, the interface to the FMS will allow the flight crew to send and receive Aircraft Communication Addressing and Reporting System (ACARS) and DataComm messages.
3.3.3 CNS Systems Assumptions
It is assumed that future CSTs will rely mainly on existing voice communication systems to interact with air traffic control. Additionally, this aircraft may feature DataComm that meets the Future Air Navigation System 1/A+ (FANS 1/A+) standards. FANS 1/A+ supports the transmission of standard departure and in-flight clearances through Controller-Pilot Data Link Communication (CPDLC). From ground-based systems to airborne systems, the Aeronautical Telecommunications Network Baseline 2 (ATN-B2) will enable uplink of current wind-field data to the aircraft, dynamic required navigation performance (RNP) clearances, and Time of Arrival
12
Control (TOAC) clearances. From the aircraft to entities on the ground, ATN-B2 will enable downlink of Automatic Dependent Surveillance Contract (ADS-C) Extended Projected Profile (EPP) messages that includes trajectory intent information, conformance to TOAC clearances, and sensed weather information [26].
It is also assumed that future CSTs will utilize ACARS as the primary datalink between the flight crew/aircraft and the Flight Operations Center (FOC). ACARS utilizes a router to connect to a network of radio transceivers controlled by a third party service provider and transmits small amounts of text reliably to an en-route aircraft [27]. Typical transmissions include weather information, navigation information, aircraft positioning, and take-off/landing confirmations. However, trajectory data, including predicted times of arrival at key points throughout the flight, can also be sent to the FOC to inform dispatchers of aircraft progress.
It is presumed that CSTs will utilize both Area Navigation (RNAV) and RNP systems. RNAV and RNP will enable the CST to fly more direct routes with lateral path conformance. The CST is expected to feature ADS-B In and Out, as well as a Mode C transponder that will be used for identification and altitude information when radar is used. ADS-B will report the aircraft’s position, as well as several other data. A full description of the characteristics of ADS-B and the message content can be found in [28].
3.4 Initial Operational Environment Assumptions
It is envisioned that CST operations in the NAS will occur in a NextGen environment. The NextGen environment should allow for easier integration of CST into the NAS, rather than segregating its operations from subsonic traffic.
NextGen will have a number of characteristics and capabilities relevant to all air transportation and to supersonic transportation in particular [7] [29]. These include network-enabled information access; position, navigation and timing services; aircraft trajectory based operations; super density arrival/departure operations; equivalent visual operations; weather assimilated into decision making; and layered, adaptive security. Predictive modeling technologies for air traffic control systems will play a critical role given greater air traffic density as well as the greater speed of supersonic aircraft.
Special air traffic control handling as was done for the Concorde is not an acceptable economic or practical solution. Concorde cruise flight was conducted at altitudes significantly higher than commercial subsonic traffic and, because there was a minimal number of vehicles, special air traffic controller handling could be applied without significant interruption of subsonic operations. Because of this uniquely limited nature of operations, this was a feasible approach for the Concorde. This likely will not be a practical approach for overland CST operations.
CST cruise operations are envisioned between FL400 and FL500. Maximum cruise efficiency is obtained using a continuous cruise-climb; this capability should be provided as part of the airspace integration concept.
Certain NextGen concepts and technologies have been developed that can be adapted to work with CSTs. These are discussed in further detail in section 6. Additionally, two components of the operating environment are discussed in this section—airports that may service CSTs, and examples of flight routes that the CST may fly.
13
3.4.1 CNS Infrastructure Assumptions
With regards to airspace communication, navigation, and surveillance infrastructure, it is assumed that the full NextGen system will be in place when CSTs are prominent in the NAS. Communication methods are expected to include voice and DataComm between radar controllers and the flight crew, ACARS between the flight crew and the airline dispatchers, and System Wide Information Management (SWIM) between the ATC traffic management controller and the airlines. Additionally, net-centric capabilities and in-flight Internet may augment DataComm, ACARS, and SWIM to facilitate collaborative decision making between the radar controller, traffic management controller, airline dispatcher, and flight crew. Navigation will be predominantly based on global positioning system (GPS) and the wide area augmentation system (WAAS). VHF Omnidirectional Range (VOR) with Distance Measuring Equipment (DME) may be used as well. Finally, regarding surveillance, ADS-B may provide the primary means of surveillance, with primary and secondary radar used for contingency.
3.4.2 Airport and City Pair Assumptions
Based upon low-fidelity modeling of CST flight characteristics, an analysis determined that the minimum practical flight distance between cities was 800 nautical miles. This analysis is further discussed in Section 4.1.3.1. Further constraining this, an arbitrary criterion was created that focused on airports that have at least two runways that are 10,000 feet long. Working within these constraints, several representative city pairs were selected for an initial study.
3.4.3 Airspace Assumptions
There should be no need for significant changes to airspace required for CSTs to operate in the NAS in the timeframe of this document. During the en-route phase of flight, CSTs will operate in Class A airspace, and the must meet the current standards for operating in Class A airspace. The cruise phase of flight will occur in super high sectors, but will remain under FL600, thus obviating the need for any special ATC re-sectorization or reclassification of airspace boundaries. During the transition to and from terminal airspace, CSTs will fly through Class E airspace, similar to current subsonic transport aircraft.
Applying the assumption of the NASA N+2 aircraft type, CSTs will operate in Class B or C airspace in the terminal area. The CSTs are expected to utilize existing airspace structure in the terminal area. Examples include standard instrument departure (SID) procedures during the departure phase of flight, standard terminal arrival route (STAR) procedures during the arrival phase of flight, and standard instrument approach procedures into a given airport. It is also assumed that CSTs will not have geographically separate routing procedures (i.e., they will be inserted into existing traffic flows into a given airport). Further research must be conducted to evaluate these assumptions.
14
4 Supersonic Transport Operations in the NAS Experiment
An experiment was conducted at NASA Langley to provide an initial investigation evaluating the integration of commercial overland supersonic aircraft operations into the NextGen NAS in September 2014. This primary study did not investigate any new flight deck or systematic concepts; it investigated, at an air traffic management level rather than an aircraft-centric level, how a commercial supersonic transport aircraft may interact with subsonic traffic. The resultant data identified areas where issues may arise, and will subsequently drive the development of tools, technologies, and procedures that will enable the safe, efficient, and seamless integration of CST into a NextGen NAS. Additionally, this data has been used in following sections of this document to formulate initial draft procedures that still require several iterations of testing for both air traffic controllers and flight crews that will allow for CST integration without an objectionable increase to either flight crew or controller workload.
4.1 Experiment Design
The experiment - entitled Supersonic Transport Operations in the National Airspace System Experiment (STONE) - was a full factorial batch simulation. Each of the scenarios was deterministic, meaning that only one replicate was required to obtain sufficient statistical power for the analysis. Additionally, in accordance with the full factorial design of the experiment, all of the independent variables were discrete.
The study was formed to find solutions to three research questions:
1) What possible encounter characteristics (geometry, relative speed, and altitude) may be faced if CSTs flew with current-day levels of traffic?
2) What are the relative impacts of various assumed climb and descent profiles on flight time for a CST?
3) What is the approximate time savings for a supersonic transport aircraft compared to a modern-day subsonic transport aircraft flying the same route?
4.1.1 Simulation Environment
A joint NASA-NLR simulation tool called the Traffic Manager eXecutable (TMX) hosted in the NASA Langley Research Center Air Traffic Operations Laboratory served as the simulation platform for this study. TMX was chosen due to its ability to execute in a fast-time mode and its ability to simulate aircraft that are capable of supersonic speeds.
For this initial study, to minimize the development effort required to collect this data, a generic fighter aircraft model that is capable of supersonic flight in the speed regimes was used. This generic fighter aircraft model (BADA Model: FGTN) was used as a surrogate for the NASA N+2 supersonic vehicle. This model was used for convenience and is not necessarily representative of a future CST. The impact of this assumption was not considered to be significant, but may be tested in future experiments.
A conflict detection (CD) algorithm was used to record encounters with subsonic aircraft during the flight. This algorithm recorded an encounter if a traffic aircraft encroached any space within a volume around the CST. The volume was defined to be a cylinder with radius of 5 nautical miles and height of ±1000 feet from the CST’s present position, which is standard IFR separation [30]. The TMX-inherent conflict detection algorithm was used (i.e., it was turned on for each of the CSTs in the scenario). It is important to note that the resolution portion of the algorithm was not
15
turned on for this experiment, which means that the aircraft, if in conflict, did not react to the conflict. In the operational world, a controller would take preventive measures to minimize the number of conflicts between aircraft.
4.1.2 Scenario Description
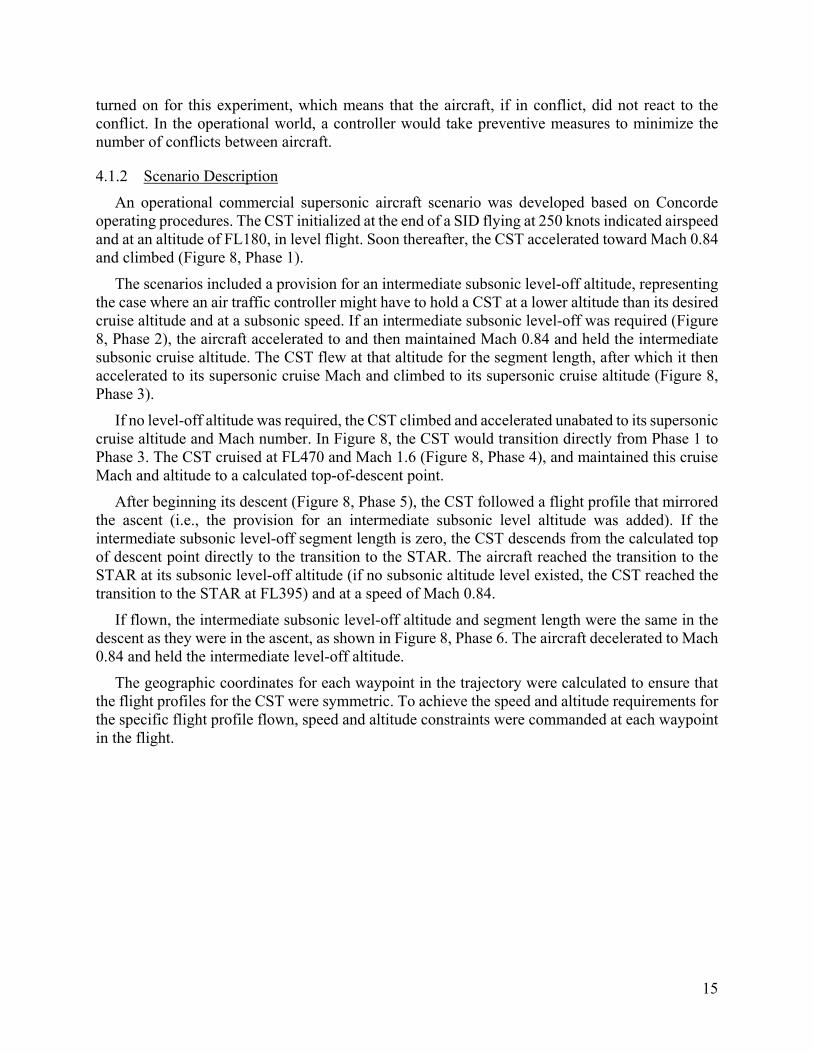
An operational commercial supersonic aircraft scenario was developed based on Concorde operating procedures. The CST initialized at the end of a SID flying at 250 knots indicated airspeed and at an altitude of FL180, in level flight. Soon thereafter, the CST accelerated toward Mach 0.84 and climbed (Figure 8, Phase 1).
The scenarios included a provision for an intermediate subsonic level-off altitude, representing the case where an air traffic controller might have to hold a CST at a lower altitude than its desired cruise altitude and at a subsonic speed. If an intermediate subsonic level-off was required (Figure 8, Phase 2), the aircraft accelerated to and then maintained Mach 0.84 and held the intermediate subsonic cruise altitude. The CST flew at that altitude for the segment length, after which it then accelerated to its supersonic cruise Mach and climbed to its supersonic cruise altitude (Figure 8, Phase 3).
If no level-off altitude was required, the CST climbed and accelerated unabated to its supersonic cruise altitude and Mach number. In Figure 8, the CST would transition directly from Phase 1 to Phase 3. The CST cruised at FL470 and Mach 1.6 (Figure 8, Phase 4), and maintained this cruise Mach and altitude to a calculated top-of-descent point.
After beginning its descent (Figure 8, Phase 5), the CST followed a flight profile that mirrored the ascent (i.e., the provision for an intermediate subsonic level altitude was added). If the intermediate subsonic level-off segment length is zero, the CST descends from the calculated top of descent point directly to the transition to the STAR. The aircraft reached the transition to the STAR at its subsonic level-off altitude (if no subsonic altitude level existed, the CST reached the transition to the STAR at FL395) and at a speed of Mach 0.84.
If flown, the intermediate subsonic level-off altitude and segment length were the same in the descent as they were in the ascent, as shown in Figure 8, Phase 6. The aircraft decelerated to Mach 0.84 and held the intermediate level-off altitude.
The geographic coordinates for each waypoint in the trajectory were calculated to ensure that the flight profiles for the CST were symmetric. To achieve the speed and altitude requirements for the specific flight profile flown, speed and altitude constraints were commanded at each waypoint in the flight.
16
Figure 8: Schematic of Commercial Supersonic Aircraft Trajectory
4.1.3 Independent Variables
The independent variables in this study were: 1) the aircraft route; 2) the departure time; 3) the length of the intermediate subsonic level-off segment before the CST is cleared to climb to its cruise altitude and accelerate to its cruise Mach number; and, 4) the altitude at which that level off occurs.
4.1.3.1 Aircraft route
The batch experiment used existing subsonic NAS traffic with supersonic traffic operations added between selected US hub airports. The airports were chosen using the criteria discussed in section 3.3.2 of this document. Table 1 displays the list of candidate airports.
Table 1: Candidate Airports for STONE
Candidate Airports for STONE
KSEA KSFO KLAX KLAS KPHX KDEN KDFW KIAH KORD KATL KMIA KIAD KJFK KBOS
As mentioned in section 3.4.2 of this document, an analysis was performed to choose practical supersonic city pairs. The practicality of a flight route was determined by the time spent at a supersonic Mach number. Based upon the modeled aircraft flight characteristics, it was determined that a minimum distance between the end of the SID at one city and the transition to a STAR at another was approximately 700 nautical miles. This assumption was invoked because the simulated aircraft model could not reach the desired cruise Mach number of Mach 1.6 and the desired cruise altitude of FL470 before it had to begin its descent into the transition to the arrival with less than 700 nautical miles between city pairs, meaning that the effective time that the CST spent at its cruise Mach number and cruise altitude was nil. For practicality, a 100 nautical mile
17
buffer was added to the minimum to ensure that the CST aircraft would spend some time at a supersonic cruise altitude and Mach number.
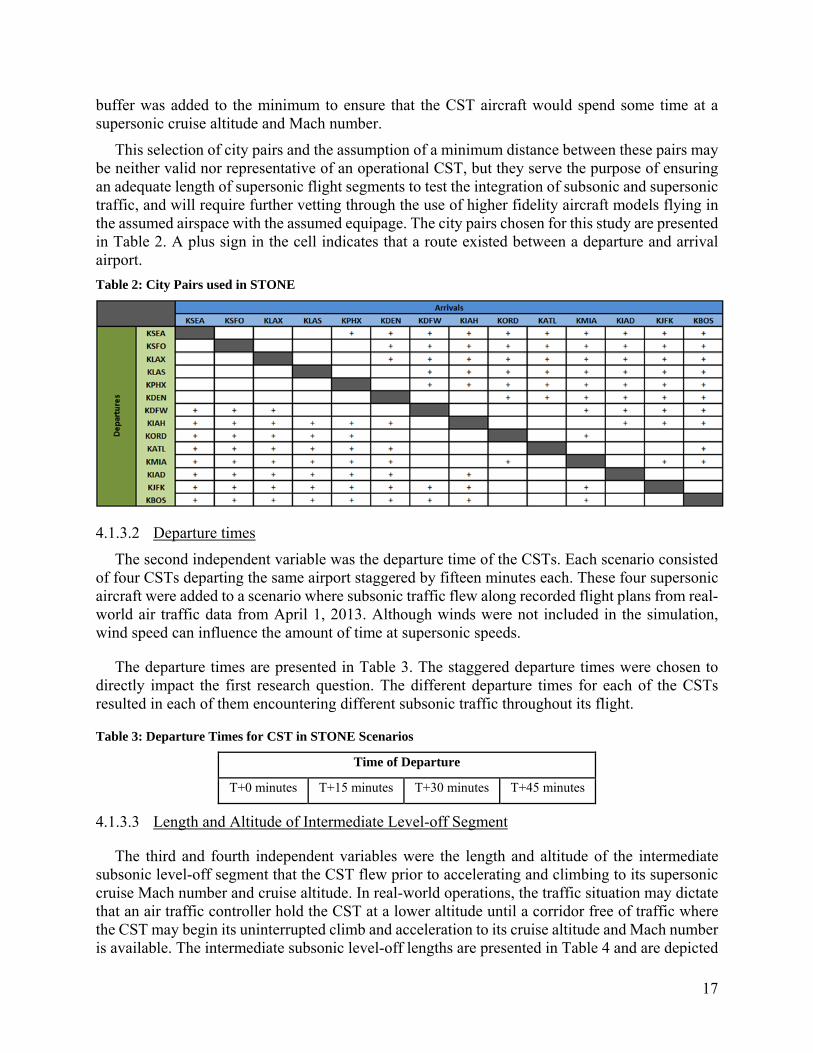
This selection of city pairs and the assumption of a minimum distance between these pairs may be neither valid nor representative of an operational CST, but they serve the purpose of ensuring an adequate length of supersonic flight segments to test the integration of subsonic and supersonic traffic, and will require further vetting through the use of higher fidelity aircraft models flying in the assumed airspace with the assumed equipage. The city pairs chosen for this study are presented in Table 2. A plus sign in the cell indicates that a route existed between a departure and arrival airport.
Table 2: City Pairs used in STONE
4.1.3.2 Departure times
The second independent variable was the departure time of the CSTs. Each scenario consisted of four CSTs departing the same airport staggered by fifteen minutes each. These four supersonic aircraft were added to a scenario where subsonic traffic flew along recorded flight plans from real-world air traffic data from April 1, 2013. Although winds were not included in the simulation, wind speed can influence the amount of time at supersonic speeds.
The departure times are presented in Table 3. The staggered departure times were chosen to directly impact the first research question. The different departure times for each of the CSTs resulted in each of them encountering different subsonic traffic throughout its flight.
Table 3: Departure Times for CST in STONE Scenarios
Time of Departure
T+0 minutes T+15 minutes T+30 minutes T+45 minutes
4.1.3.3 Length and Altitude of Intermediate Level-off Segment
The third and fourth independent variables were the length and altitude of the intermediate subsonic level-off segment that the CST flew prior to accelerating and climbing to its supersonic cruise Mach number and cruise altitude. In real-world operations, the traffic situation may dictate that an air traffic controller hold the CST at a lower altitude until a corridor free of traffic where the CST may begin its uninterrupted climb and acceleration to its cruise altitude and Mach number is available. The intermediate subsonic level-off lengths are presented in Table 4 and are depicted

18
in Figure 8 as llevel_off, and the intermediate subsonic level-off altitudes are presented in Table 5 and displayed graphically in Figure 8 as Zlevel_off.
Table 4: Intermediate Subsonic Level-Off Lengths used in STONE
Level-off Segment Length (NM)
0 NM 50 NM 100 NM
Table 5: Intermediate Subsonic Level-Off Altitudes used in STONE
Level-off Segment Altitude (FL)
None FL275 FL295 FL315 FL335 FL355 FL375 FL395
The intermediate subsonic level-off was scripted into the scenario, and was the most practical way to simulate the influence of the air traffic controller on the flight, since no human or simulated air traffic controller was used in this study. For ease of scenario creation and to minimize the number of scenarios, the trajectory for the CST was symmetric, meaning that if the CST had an intermediate subsonic level-off segment with a length of 50 nautical miles during its ascent, it also had an intermediate subsonic level off segment with a length of 50 nautical miles after it descended from its cruise altitude.
The values of the intermediate subsonic level-off altitudes were set at altitudes which ended in 500 ft (FL275, FL295, etc.). These non-IFR cruise altitudes were deliberately chosen to examine interactions with traffic in a large altitude block while minimizing the total number of scenarios. For example, instead of having two scenarios that had intermediate subsonic level-off segments at FL350 and FL360, one scenario was created with an intermediate subsonic level-off segment of FL355. The conflict detection (CD) algorithm onboard a CST in the scenario with an intermediate subsonic level-off segment of FL355 would record intrusions at both FL350 and FL360. The results were then post-processed to ensure that conflicts that would not have happened due to procedural altitude separation were not counted in the data set.
A special “best-case” scenario was examined for each city pair where the intermediate subsonic level-off segment length was zero and the altitude was “None”. This implies that the CST was cleared to climb and accelerate from the end of the SID to its cruise altitude and cruise Mach number without the need to level-off for traffic concerns. Additionally, since, as previously mentioned, the trajectory of the CST was symmetric, when the intermediate subsonic level-off segment length was zero and the altitude was “None”, the CST would descend and decelerate continuously from its calculated top-of-descent point to the transition to the STAR at the arrival airport.
The different lengths and altitudes for the intermediate subsonic level-off segment directly impacted each of the three research questions. These different lengths resulted in the CST encountering different subsonic traffic aircraft during the flight and also affected the duration of the flight.
4.2 Results and Discussion
Using 4 CST (one aircraft departing at each of the four departure times), with 113 city pairs, 2 intermediate altitude lengths and 7 intermediate subsonic cruise altitudes, as well as the special
19
condition where there was no intermediate subsonic level-off, resulted in 1,695 scenarios and approximately 95 hours of TMX simulation time to compute the subsonic and supersonic traffic encounters, as well as to get flight times for the CST.
4.2.1 Dependent Measures
This study used several dependent variables:
1) Horizontal encounter geometry of a detected conflict between the CST and subsonic traffic;
2) Number of detected conflicts/encounters;
3) Location along the trajectory of the encounters; and,
4) Three calculated flight times: a) the total flight time from the end of the SID to the transition to the STAR; b) the time spent by the CST at its cruise altitude; and, c) the time spent by the CST at its cruise Mach number.
Each of the dependent variables maps directly to the three research questions stated in section 4.1.
4.2.2 Encounter Results and Discussion
The encounter geometry between the CST and subsonic traffic is calculated using data output from the conflict detection algorithm running in the simulation environment. These data include information about the heading of each aircraft when the intrusion occurred, the closest distance between the two aircraft during the intrusion, the altitude of each aircraft when the intrusion occurred, and both the horizontal and vertical speed of each aircraft when the intrusion occurred. Using these data, the angle and the relative closure speeds of the encounter relative to the CST can be calculated. Additionally, the data include information about the point at which the encounter occurred along the CST’s trajectory.
4.2.2.1 Data Cleansing
Since the level-off altitudes for the simulated CST are between the nominally flown flight levels, the conflict detection algorithm will detect conflicts in both the flight level altitude above the CST and the flight level below. As previously mentioned, this was done by design to minimize the number of scenarios in the experiment. Air traffic controllers procedurally set altitudes at different values depending on the direction of flight to avoid co-altitude head-on collisions. For flights going east to west, the FAA requires that the cruise altitude be an even flight level (FL280, FL300, FL320, etc.) and for flights going from west to east, the cruise altitude must be an odd flight level (FL290, FL310, FL330, etc.).
Before any analysis was performed, the data were scrubbed to eliminate any encounter that was a simulation artifact, in other words, one that would not have occurred in real life due to the procedural altitude separation. For example, consider a CST in one of the scenarios that flew from Dulles International Airport in Washington, D.C. to Los Angeles International Airport in Los Angeles, California and leveled off at a subsonic speed at FL355 prior to climbing and accelerating to its cruise altitude and Mach number. If an encounter was reported with a traffic aircraft that was flying straight and level at FL350, this encounter was discarded since the actual level-off altitude for the CST would be FL360, and the two aircraft would be procedurally separated by 1000 feet in a real-world operation. However, in the same scenario, if an encounter was reported with a
20
traffic aircraft that was flying straight and level at FL360, this encounter was recorded since the CST and the traffic aircraft would be at the same altitude. This prevented skewing of the results due to artifacts of the batch simulation.
Additionally, a simulation issue was uncovered where TMX could only support a fixed number of aircraft (approximately 1000 aircraft operating simultaneously in the simulated airspace) in each scenario. To accommodate the simulation environment, some of the scenarios were split into two smaller scenarios in which the CSTs flew identical trajectories, but the traffic was split between the scenarios. For scenarios where this occurred, the data was checked to ensure that no duplicate encounters were recorded.
4.2.2.2 Encounters by Flight Regime Results
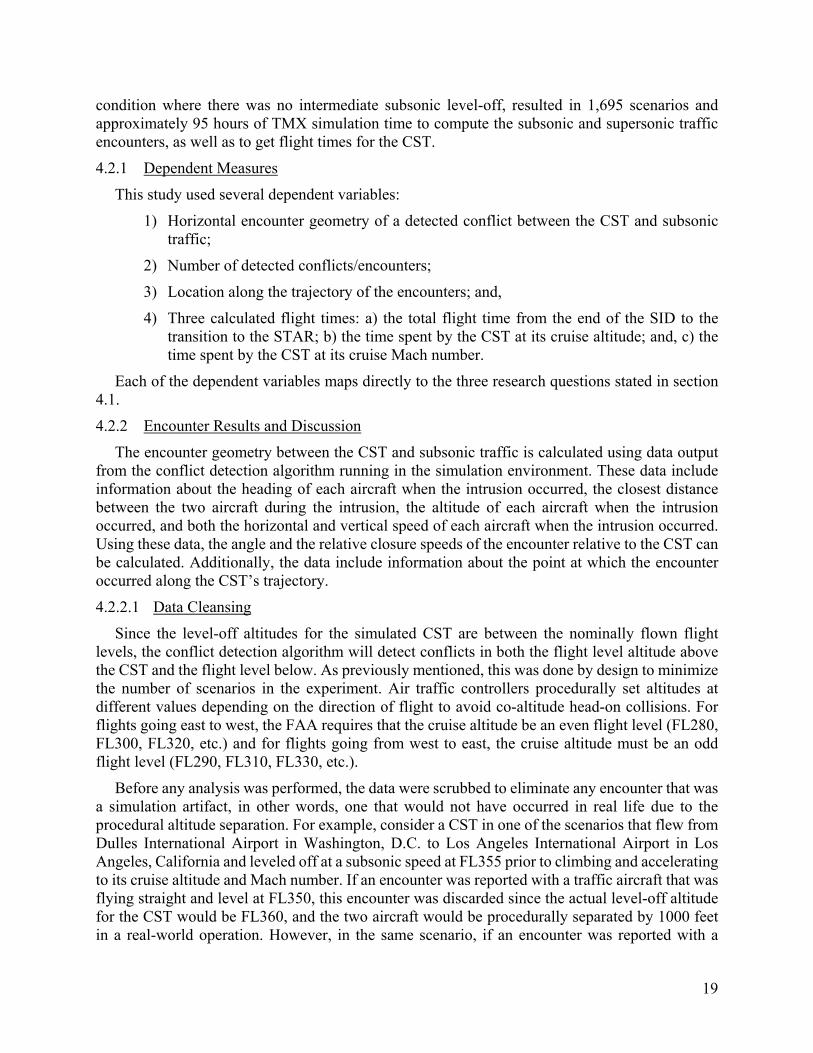
The phase of flight, or flight regime, where each encounter occurred was determined based on data output by the conflict detection algorithm. This data was binned into four phases of the trajectory described in Error! Reference source not found.—the ascent to supersonic cruise conditions, supersonic cruise conditions, the descent to subsonic conditions, and the intermediate subsonic level-off segment. Figure 9 displays the percentage of encounters that occurred during each of these phases of the trajectory.
Figure 9: Percent of Encounters by Phase of Flight
The data indicate that encounters were most likely to occur during the intermediate subsonic level-off segment. Future research may investigate this result, but since the commercial supersonic aircraft was subsonic at this point in the flight, coordinating and maintaining separation is not a problem that is unique to CSTs. The result may be a batch simulation peculiarity—especially since no human or simulated air traffic controllers were used in the study. This scenario is one that air traffic control should be able to handle. Therefore, the data was analyzed again without the encounters that occurred at the intermediate subsonic level-off segment. Figure 10 displays this data. All encounter data presented throughout the remainder of the paper uses this subset of encounter data.
21
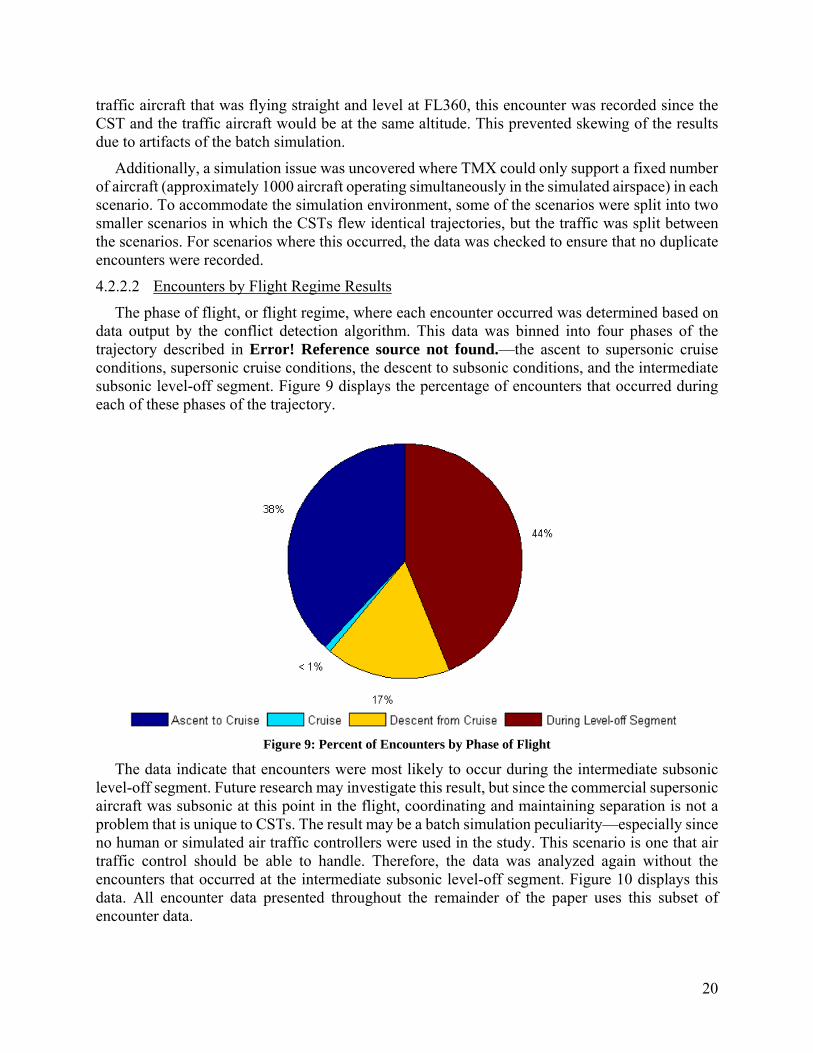
Figure 10: Percent of Encounters by Phase of Flight (Level-Off Segment Removed)
Re-analyzing the data, the most likely flight phase that an encounter occurred is during the ascent from the intermediate subsonic level-off segment to the CST’s cruise altitude, followed by the descent from cruise. Interestingly, there were encounters recorded when the CST was at cruise altitude. After examining the data, these encounters were caused by high-end business jets that were flying at FL470 on the recorded traffic day.
Further analysis presented in Figure 11 shows that, for level-off altitudes greater that FL335, as the level-off altitude increases, the number of encounters experienced during the ascent to cruise altitude from the intermediate subsonic level-off segment phase of the CST’s trajectory decreases. This result is expected, since the amount of congested airspace that the CST must climb through to reach its cruise altitude from the intermediate subsonic level-off segment is smaller.
Additionally, Figure 11 expresses that as the level-off altitude increases, the number of encounters experienced during the descent from cruise altitude to the intermediate subsonic level-off segment phase of the CST’s trajectory decreases. Again, this result is expected, since the amount of congested airspace that the CST must descend through to reach its intermediate subsonic level-off segment from its cruise altitude is smaller.
22
Figure 11: Number of Encounters vs. Level-off Altitude (Ascent to Cruise and Descent from Cruise)
4.2.2.3 Encounters by Level-Off Segment Altitude and Length Results
The number of encounters was also determined for each of the independent variables relating to the intermediate subsonic level-off segment. Of the four independent variables in this study, the altitude at which the intermediate subsonic level-off began and the length of the intermediate subsonic level-off were expected to have the largest effect on the number of intrusions. It was postulated that any intermediate subsonic level-off segments prior to the CST receiving a clearance from an air traffic controller to climb to its cruise altitude and accelerate to its cruise Mach number would increase the number of intrusions experienced by that CST. Figure 12 illustrates the number of encounters versus both the altitude when the intermediate subsonic level-off segment is initialized and the length of the intermediate subsonic level-off segment. The data presented in Figure 12 is the subset of data where encounters that occurred during the subsonic level-off segment are removed from the dataset.
Figure 12: Number of Encounters by Level-Off Altitude and by Level-Off Length
23
As seen in the data shown in the top graph of Figure 12, the CSTs experienced a larger number of encounters in the ascent to, during, and descent from, cruise conditions when the altitude of the subsonic level-off segment occurred between FL270 and FL360. The larger number of encounters in this altitude range makes sense since most subsonic transport aircraft cruise at these altitudes. In presumed real-world CST operations, it is assumed by the researcher that there would not be many practical reasons for commanding a CST to conduct a subsonic cruise segment at FL360 or higher because the CST aircraft, at those altitudes, would be above a significant portion of the subsonic traffic that it may encounter. However, these data highlight the need for technology to address the corridor clear of traffic for a CST to accelerate and climb through to get to its cruise conditions as soon as possible.
From the data displayed in the lower graph of Figure 12, it is clear that, as expected, CSTs flying the ideal trajectory—one that does not include an intermediate subsonic level-off segment—experienced fewer encounters than CST that were required to perform a level off prior to climbing and accelerating to its cruise altitude and Mach number. This is due to the shorter amount of time spent transiting through typical subsonic traffic cruise altitudes. Furthermore, the lower graph in Figure 12 shows that there is a small decrease in the number of encounters for a longer level-off length. This result may be explained by the fact that a longer subsonic level-off segment moves the accelerating ascent to cruise conditions for the CST farther from busy terminal airspace. However, this result necessitates further investigation.
4.2.2.4 Encounters by Flight Route Results
Analysis suggested that there was essentially no difference in the number of encounters experienced by the CST when the flights were organized by westbound versus eastbound flights (49.25% and 50.75%, respectively). The airport locations were then broken into several region areas to discover any routes that may have had more conflicts than others, and the number of encounters per route was analyzed based on the airport pairing of the flight. Table 6 below shows the location of each airport location.
Table 6: Airport Location Breakdown
Airport: KSEA KSFO KLAX KLAS KPHX KDEN KDFW KIAH KORD KATL KMIA KIAD KJFK KBOS
Location: NW W SW WC WC WC SC S NC EC SE E NE NE
There are differences in the number of encounters experienced by different routes. Figure 13 shows the average number of encounters on the specified route normalized by the average number of encounters for any given-route. The locations of the departure and arrival airports are shown on the x-axis, following the naming convention outlined in Table 6. Additionally, for ease of displaying the results, the reverse direction (e.g., E to NW and NW to E) if applicable is shown under the same label.

24
Figure 13: Encounters by Location of Departure and Arrival Airport
The results from the study suggest that flights departing from the south central area (SC) of the country (KDFW) going to the south east (SE, KMIA) and vice versa experienced encounters almost 3 times more than the average number of encounters on a given-route. This is explained by the fact that those aircraft traversed more highly congested traffic areas during that particular traffic day.
4.2.2.5 Planar Encounter Results and Discussion
Using the angle of the encounter relative to the CST, the type of planar encounter was determined. The data was binned into three categories—head-on, side, and overtake. A head-on encounter occurred when the absolute value of the angle of the encounter relative to the CST was less than 45°. A side encounter occurred when the absolute value of the angle of encounter was between 45° and 135°. Finally, an overtake encounter occurred when the absolute value of angle of the encounter relative to the CST was greater than 135°. Figure 14 illustrates the percentage of each type of planar encounter. The data suggest that head-on encounters and encounters from the side of the CST were the most prevalent.
Figure 14: Percent of Each Type of Planar Encounter Recorded
25
All of the head-on encounters occurred during the climb and acceleration to cruise conditions and during the descent and deceleration to the transition of the STAR. No head-on encounters were recorded during the level-off segment, validating the aforementioned data cleansing process, or during the cruise phase of flight.
4.2.3 Flight Time Results and Discussion
Three flight times are calculated for the CST based on data from this study. The first flight time calculated is the total flight time from the end of the SID to the transition to the STAR. The second and third flight times calculated were the time spent by the CST at its supersonic cruise altitude, and the time spent by the CST at its supersonic cruise Mach number, respectively.
These data may be used to refine the feasible flight routes that a CST may fly. If the time spent on a particular flight route at either the supersonic cruise altitude or the supersonic cruise Mach number is too short to make any impact on the total flight time, this route may not be considered practical for supersonic flight in the future.
These data were also compared to flight time data from a simulated modern-day subsonic aircraft to provide a means of assessing the potential time savings that CST may provide.
4.2.3.1 Total CST Flight Time
The total flight time was captured in the state data of each CST in each scenario. The “total flight” is defined as the portion of the flight started at the end of a SID of one airport and terminated at the transition to a STAR of another airport. It is not the full liftoff to landing flight time.
When analyzing the flights in aggregate, only four flights out of a total of 7796 (0.05%) were shorter than one hour. Additionally, only 100 flights out of the total number of flights (1.28%) were over 2.75 hours in length. Figure 15 displays a histogram of all of the flight times for all flights evaluated in STONE.
Figure 15: Flight Times for CST in STONE
26
The average flight time for all flights was approximately 1 hour and 52 minutes. The median flight time was 1 hour and 50 minutes. The standard deviation of these data is approximately 28 minutes.
The shortest flight departed George Bush Houston Intercontinental Airport (KIAH) and arrived at Denver International Airport (KDEN). This flight trajectory did not feature an intermediate subsonic level-off segment (Figure 16, “None”, black column), and the flight time from departing the SID to arriving at the transition to the STAR was approximately 58 minutes. This flight was the shortest due to the combination of its short flight length and the lack of an intermediate subsonic level-off segment. Figure 16 shows the flight time for each of the altitudes that the intermediate subsonic level-off began for both subsonic level-off lengths for the flights that departed KIAH and arrived at KDEN.
Figure 16: KIAH-KDEN CST Flight Times
Further assessment of the data showed that as the altitude at which the intermediate subsonic level-off segment began increased, the flight time also increased up to an altitude of FL375. Evaluation of the CST’s airspeeds confirmed these results. In the scenarios, the CST was commanded to accelerate from 250 knots indicated airspeed (the speed the aircraft initialized at the end of the SID) to Mach 0.84. As the altitude of the intermediate level-off segment increased, the CST spent more time at Mach 0.84, causing the flight time to increase up to FL375. Between FL375 and FL395, there was a very small decrease in flight time. It is hypothesized that this small decrease in flight time is due to the way that the trajectory was flown by the simulated aircraft. This result was seen across all flights in STONE. Further testing and analysis of the trajectory generator, the acceleration profile of the aircraft during a climb, and the flight guidance routines in TMX is required to confirm this hypothesis.
Additionally, Figure 16 showed that as the length of the intermediate subsonic level-off segment increased, the flight time increased. This observation was intuitively easy to understand—as the
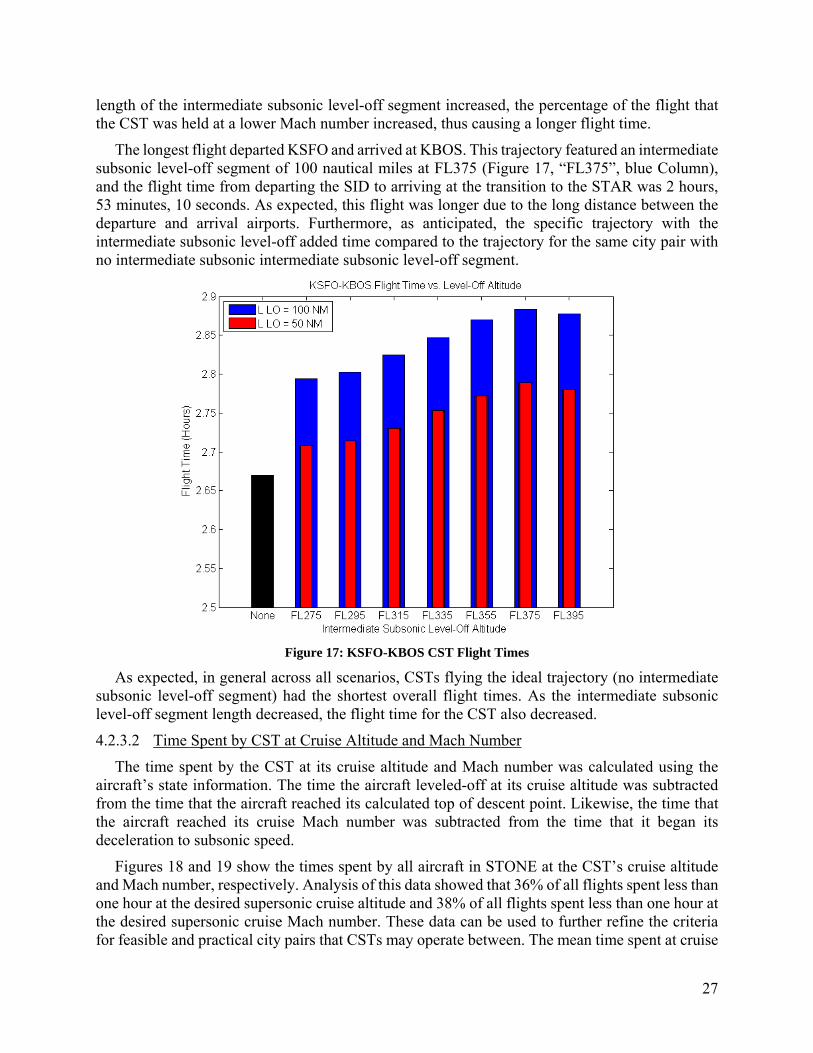
27
length of the intermediate subsonic level-off segment increased, the percentage of the flight that the CST was held at a lower Mach number increased, thus causing a longer flight time.
The longest flight departed KSFO and arrived at KBOS. This trajectory featured an intermediate subsonic level-off segment of 100 nautical miles at FL375 (Figure 17, “FL375”, blue Column), and the flight time from departing the SID to arriving at the transition to the STAR was 2 hours, 53 minutes, 10 seconds. As expected, this flight was longer due to the long distance between the departure and arrival airports. Furthermore, as anticipated, the specific trajectory with the intermediate subsonic level-off added time compared to the trajectory for the same city pair with no intermediate subsonic intermediate subsonic level-off segment.
Figure 17: KSFO-KBOS CST Flight Times
As expected, in general across all scenarios, CSTs flying the ideal trajectory (no intermediate subsonic level-off segment) had the shortest overall flight times. As the intermediate subsonic level-off segment length decreased, the flight time for the CST also decreased.
4.2.3.2 Time Spent by CST at Cruise Altitude and Mach Number
The time spent by the CST at its cruise altitude and Mach number was calculated using the aircraft’s state information. The time the aircraft leveled-off at its cruise altitude was subtracted from the time that the aircraft reached its calculated top of descent point. Likewise, the time that the aircraft reached its cruise Mach number was subtracted from the time that it began its deceleration to subsonic speed.
Figures 18 and 19 show the times spent by all aircraft in STONE at the CST’s cruise altitude and Mach number, respectively. Analysis of this data showed that 36% of all flights spent less than one hour at the desired supersonic cruise altitude and 38% of all flights spent less than one hour at the desired supersonic cruise Mach number. These data can be used to further refine the criteria for feasible and practical city pairs that CSTs may operate between. The mean time spent at cruise
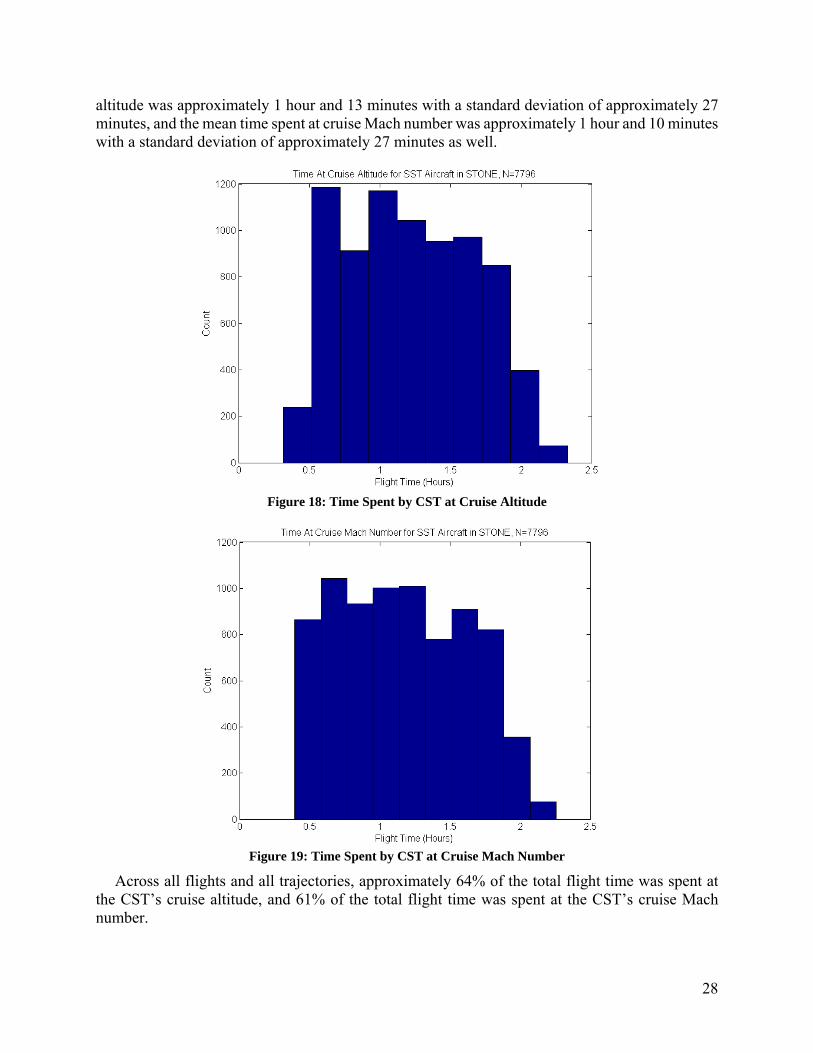
28
altitude was approximately 1 hour and 13 minutes with a standard deviation of approximately 27 minutes, and the mean time spent at cruise Mach number was approximately 1 hour and 10 minutes with a standard deviation of approximately 27 minutes as well.
Figure 18: Time Spent by CST at Cruise Altitude
Figure 19: Time Spent by CST at Cruise Mach Number
Across all flights and all trajectories, approximately 64% of the total flight time was spent at the CST’s cruise altitude, and 61% of the total flight time was spent at the CST’s cruise Mach number.
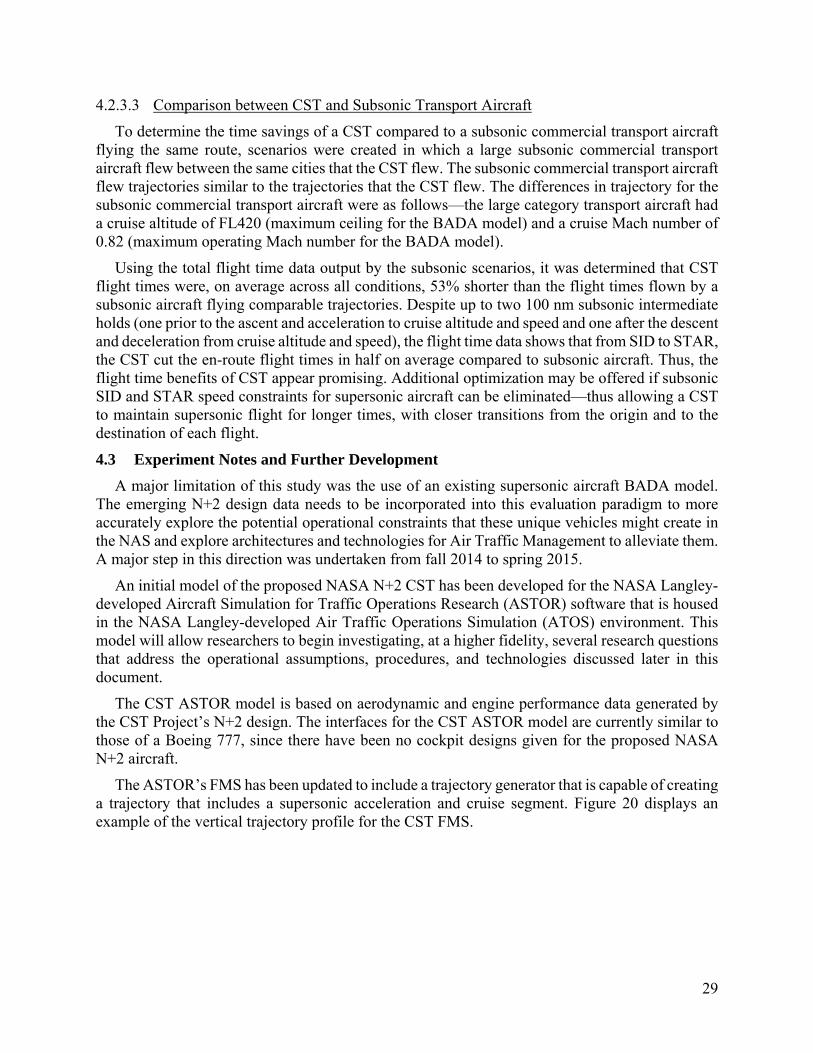
29
4.2.3.3 Comparison between CST and Subsonic Transport Aircraft
To determine the time savings of a CST compared to a subsonic commercial transport aircraft flying the same route, scenarios were created in which a large subsonic commercial transport aircraft flew between the same cities that the CST flew. The subsonic commercial transport aircraft flew trajectories similar to the trajectories that the CST flew. The differences in trajectory for the subsonic commercial transport aircraft were as follows—the large category transport aircraft had a cruise altitude of FL420 (maximum ceiling for the BADA model) and a cruise Mach number of 0.82 (maximum operating Mach number for the BADA model).
Using the total flight time data output by the subsonic scenarios, it was determined that CST flight times were, on average across all conditions, 53% shorter than the flight times flown by a subsonic aircraft flying comparable trajectories. Despite up to two 100 nm subsonic intermediate holds (one prior to the ascent and acceleration to cruise altitude and speed and one after the descent and deceleration from cruise altitude and speed), the flight time data shows that from SID to STAR, the CST cut the en-route flight times in half on average compared to subsonic aircraft. Thus, the flight time benefits of CST appear promising. Additional optimization may be offered if subsonic SID and STAR speed constraints for supersonic aircraft can be eliminated—thus allowing a CST to maintain supersonic flight for longer times, with closer transitions from the origin and to the destination of each flight.
4.3 Experiment Notes and Further Development
A major limitation of this study was the use of an existing supersonic aircraft BADA model. The emerging N+2 design data needs to be incorporated into this evaluation paradigm to more accurately explore the potential operational constraints that these unique vehicles might create in the NAS and explore architectures and technologies for Air Traffic Management to alleviate them. A major step in this direction was undertaken from fall 2014 to spring 2015.
An initial model of the proposed NASA N+2 CST has been developed for the NASA Langley-developed Aircraft Simulation for Traffic Operations Research (ASTOR) software that is housed in the NASA Langley-developed Air Traffic Operations Simulation (ATOS) environment. This model will allow researchers to begin investigating, at a higher fidelity, several research questions that address the operational assumptions, procedures, and technologies discussed later in this document.
The CST ASTOR model is based on aerodynamic and engine performance data generated by the CST Project’s N+2 design. The interfaces for the CST ASTOR model are currently similar to those of a Boeing 777, since there have been no cockpit designs given for the proposed NASA N+2 aircraft.
The ASTOR’s FMS has been updated to include a trajectory generator that is capable of creating a trajectory that includes a supersonic acceleration and cruise segment. Figure 20 displays an example of the vertical trajectory profile for the CST FMS.
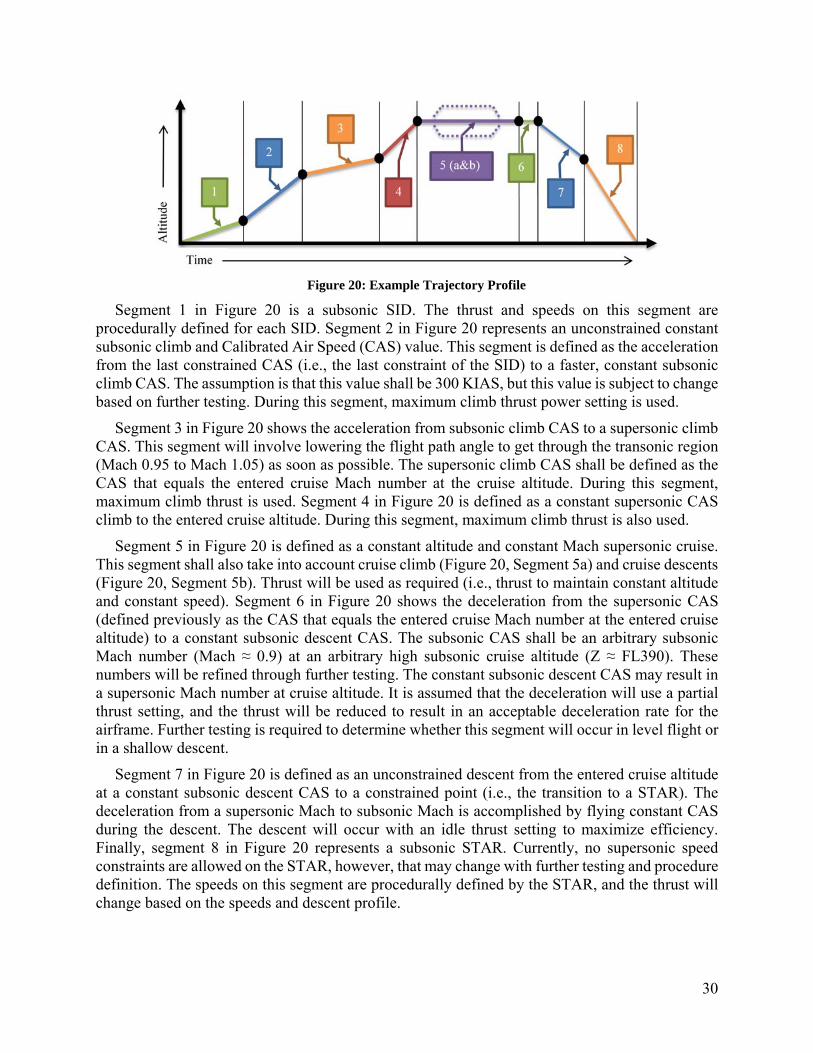
30
Figure 20: Example Trajectory Profile
Segment 1 in Figure 20 is a subsonic SID. The thrust and speeds on this segment are procedurally defined for each SID. Segment 2 in Figure 20 represents an unconstrained constant subsonic climb and Calibrated Air Speed (CAS) value. This segment is defined as the acceleration from the last constrained CAS (i.e., the last constraint of the SID) to a faster, constant subsonic climb CAS. The assumption is that this value shall be 300 KIAS, but this value is subject to change based on further testing. During this segment, maximum climb thrust power setting is used.
Segment 3 in Figure 20 shows the acceleration from subsonic climb CAS to a supersonic climb CAS. This segment will involve lowering the flight path angle to get through the transonic region (Mach 0.95 to Mach 1.05) as soon as possible. The supersonic climb CAS shall be defined as the CAS that equals the entered cruise Mach number at the cruise altitude. During this segment, maximum climb thrust is used. Segment 4 in Figure 20 is defined as a constant supersonic CAS climb to the entered cruise altitude. During this segment, maximum climb thrust is also used.
Segment 5 in Figure 20 is defined as a constant altitude and constant Mach supersonic cruise. This segment shall also take into account cruise climb (Figure 20, Segment 5a) and cruise descents (Figure 20, Segment 5b). Thrust will be used as required (i.e., thrust to maintain constant altitude and constant speed). Segment 6 in Figure 20 shows the deceleration from the supersonic CAS (defined previously as the CAS that equals the entered cruise Mach number at the entered cruise altitude) to a constant subsonic descent CAS. The subsonic CAS shall be an arbitrary subsonic Mach number (Mach ≈ 0.9) at an arbitrary high subsonic cruise altitude (Z ≈ FL390). These numbers will be refined through further testing. The constant subsonic descent CAS may result in a supersonic Mach number at cruise altitude. It is assumed that the deceleration will use a partial thrust setting, and the thrust will be reduced to result in an acceptable deceleration rate for the airframe. Further testing is required to determine whether this segment will occur in level flight or in a shallow descent.
Segment 7 in Figure 20 is defined as an unconstrained descent from the entered cruise altitude at a constant subsonic descent CAS to a constrained point (i.e., the transition to a STAR). The deceleration from a supersonic Mach to subsonic Mach is accomplished by flying constant CAS during the descent. The descent will occur with an idle thrust setting to maximize efficiency. Finally, segment 8 in Figure 20 represents a subsonic STAR. Currently, no supersonic speed constraints are allowed on the STAR, however, that may change with further testing and procedure definition. The speeds on this segment are procedurally defined by the STAR, and the thrust will change based on the speeds and descent profile.
31
4.4 Summary of STONE
This study provided key data that relates to both the operations and procedures for operating a class of CST in the National Airspace System as well as providing high-level justification for the economic benefits that operating these vehicles may bring.
The data suggest, as expected, that there is a negative impact on the flight time if a controller keeps a CST at an intermediate subsonic cruise altitude for an extended period of time. This situation may reduce the economic benefit of operating these vehicles, and may potentially cause significant efficiency losses for the CST.
The data also suggest that there is a potential for encounters with other aircraft as the CST accelerates and climbs to supersonic cruise, and to a lesser extent, as it decelerates and descends from supersonic cruise. This, coupled with the negative impact on flight time from extended intermediate subsonic cruise segments mentioned in the previous paragraph, highlights a need to allow the CST to reach its cruise altitude and Mach number quickly and safely by ascending and descending through a corridor clear of traffic. The procedures discussed in sections 5.5.2 and 5.7.2 in this document assume that the technologies to address this need, discussed in Section 6.1, or similar technologies are in place.
The traffic density is expected to be low at CST cruise conditions. However, the flight plan for the aircraft will most likely need to avoid certain areas of the country due to sonic boom considerations. Section 5.6.2 postulates procedures that would be made more efficient with the technologies discussed in Sections 6.2 and 6.3.
Although not investigated in this study, the initial descent, arrival, and approach segments may present a challenge for air traffic controllers. Procedures and technologies to address these flight regimes are discussed further in Sections 5.8 and 6.4, respectively.
32
5 Operational Scenarios
This section of the document discusses historical CST operating procedures—specifically, Concorde’s—and extends them to future CSTs.
This ConOps is primarily associated with flight deck technologies, functions, operational procedures, and the role of the flight crew and ATC. It is also assumed for this ConOps that the CST is operated under Part 121. Other entities that participate in the NAS, including Airline Operations Center (including dispatchers and flight operations managers) must also be considered and reconciled with any new flight deck or ATC technology or procedure. It is assumed that the roles of these participants will be conceived separately (e.g., by airline partners); as such, coordination is necessary throughout but not discussed herein.
5.1 Pre-Departure Operations
5.1.1 Concorde Procedures and Operations
The crew scheduled to fly Concorde would arrive approximately 1.5 hours prior to pushback from the gate [11]. The crew received a typical pre-flight briefing, which included weather, winds aloft, departure procedures, noise abatement requirements, transition altitudes, and abnormal conditions [31] .
The flight charts for the flight crew were handed out during the pre-flight briefing [11]. Concorde flew special, fixed east-west oceanic tracks across the North Atlantic, which differed from the routes that subsonic aircraft flew. Subsonic aircraft fly along the North Atlantic Organized Track System (NATOTS), which are routes used by aircraft flying between North America and Europe between FL310 and FL410, inclusive. These routes are aligned to provide the best service to the bulk of the traffic, since the airspace becomes congested at peak hours. These tracks are seldom identical from day-to-day due to convective weather avoidance and utilizing or avoiding the jet stream, depending on the direction of travel, [32] and are generated twice a day [33]. Concorde flew on fixed tracks across the North Atlantic because, at the altitudes that Concorde was flying (FL500-FL600), the variations of weather were so minor and the jet stream had such a minimal impact that the tracks had no need to change. Typically, the only tracks used were “Sierra Mike” (Westbound flights) and “Sierra November” (Eastbound flights). Tracks “Sierra Oscar” and “Sierra Papa” existed, but were seldom used [11].
Although Concorde did not use the subsonic North Atlantic Organized Track System, the flight crew typically plotted the most current operational tracks on their flight charts to maintain situation awareness. In case of an emergency that required a descent, such as a loss of pressurization, the crew was typically forced to ensure that they were clear of other traffic, due to the inherent latencies in high frequency (HF) radio communication across the ocean. Additionally, the flight crew would plot “points of no return” on the flight charts. The points of no return were calculated for three-engine and two-engine operations. Finally, several alternate airports were plotted on the flight routes for use in the rare event of an en-route issue that would require diversion to an alternate airfield. Typically, fuel burn and transfer times were pre-calculated by the flight engineer during the pre-flight briefing [11].
After the pre-flight briefing, the flight engineer would perform the physical pre-flight walk-around check, and the captain and first officer would enter the flight deck and perform system checks. Approximately 30 minutes prior to pushback, the crew would gather on the flight deck to perform the formal pre-flight checklists and cockpit preparations [11].
33
5.1.2 Future CST Procedures and Operations
For the proposed CST, the preflight procedures should be extremely similar to the preflight procedures for a typical subsonic commercial aircraft. Modern pre-flight routing for aircraft is performed by a dispatch entity using decision support tools that automate many of the functions that Concorde flight crew members completed. The flight crew will receive their routing from dispatch, which will look very similar to the routing of a commercial subsonic aircraft other than the cruise altitude and almost exclusive use of direct routing (although indirect routing at the time of introducing CST operations will be much more frequent). The flight plan will be heavily based on the winds and temperature profile data available. Although winds are certainly considered in today’s operations, these data are critical for boom and overpressure mitigation. The combination of atmospheric conditions and initial path definition will determine where overpressure and focus boom locations will occur, and thus, will be used to refine the final flight plan.
5.2 Taxi Operations
5.2.1 Concorde Procedures and Operations
Taxiing speed for the Concorde was recommended to be limited to 20 knots on a straight segment, and no more than 10 knots during a sharp turn. However, speed should not be allowed to become so slow that large amounts of thrust were required to get the aircraft moving. This was due to jet blast considerations in the confined spaces of an airport [31].
5.2.2 Future CST Procedures and Operations
The proposed CST should have no restrictions when taxiing, other than those that would normally be imposed on large subsonic commercial airliners. Modifications to existing taxiways should not be required, since the CST will be lighter than the heaviest aircraft that these major hub airports currently support. Also, the CST will not have a large wingspan, and the length of the airframe of the proposed NASA N+2 CST (see Figure 2) is similar to that of a Boeing 777 aircraft or an Airbus A340 aircraft.
Regarding taxi speeds, until a vehicle is designed, it is very difficult to provide estimated ground taxi speeds. Large subsonic aircraft (Boeing 757/767) are typically limited to 25 knots for straight ahead segments and turns up to 45 degrees, and 10 knots for turns greater than 45 degrees [34]. Since these speeds are close to those that were used by Concorde, it is assumed that the taxi speeds for a future CST should be in the 20-25 knot range for straight segments and 10 knots for turns greater than 45 degrees.
5.3 Take-off and Departure Operations
5.3.1 Concorde Procedures and Operations
Concorde required afterburners to accelerate to a speed where it could rotate and lift off, and to accelerate to the high speeds that it required for supersonic flight. The noise produced by the afterburners sometimes caused an opposite direction takeoff at JFK airport, since a community sat at the end of one runway. This presented air traffic controllers with a challenge while utilizing the noise abatement procedure, because the opposite direction takeoff would result in the loss of both arrival and departure slots in the regular traffic flow [35].
If the aircraft was cleared to climb to supersonic speeds, the aircraft would maintain VMO through the climb all the way to its cruise altitude. Otherwise, Concorde would climb at VMO and then Mach 0.93 if the climb was to a subsonic cruise altitude [31].
34
5.3.2 Future CST Procedures and Operations
The proposed CST will be required to conform to the same community noise requirements that all modern subsonic transport airliners follow in current-day operations. The aircraft must not require afterburners to achieve the thrust necessary for high speed flight, or for takeoff. Engine and airframes will be designed to obviate the need for a special noise-abatement takeoff procedure and the CST should never be put in a position where it will require an opposite takeoff flow for noise purposes.
In the operating environment that the CST is anticipated to operate in (NextGen with trajectory-based operations), automation may determine a release time based on integration with the en-route flow, obviating unique problematic issues. Nominally, the CST will follow existing Standard Instrument Departure (SID) routes out of the airport, and from the terminus of the SID, continue on its filed flight plan. The CST may have on-board automation to give the flight crew speed guidance to perform an efficient and rapid ascent to the CST’s cruise conditions. The departure speeds are unknown at this point, yet research should be conducted to determine the effects of higher departure speeds. Based on this research, airspace regulations should be potentially modified to allow higher speeds than are currently allowed today (i.e., greater than 250 KIAS below 10,000 feet).
5.4 Subsonic Cruise Operations
5.4.1 Concorde Procedures and Operations
Concorde leveled-off at a subsonic cruise altitude, which was typically given by an air traffic controller. The autothrottle system of Concorde was engaged, and thrust was provided to maintain a constant Mach number of 0.95. Likewise, the pilot flying would engage an altitude hold mode. The aircraft would then fly at this altitude until it was cleared to begin its supersonic acceleration and climb to cruise altitude [11]. The optimum flight level for subsonic cruise varied considerably with weight. Any increase in subsonic cruise flight level above the optimum will have an adverse effect on the aircraft’s specific range. This is due to the indicated airspeed at Mach 0.95 falling below the minimum drag speed for the weight, which presents drag penalties [31].
New York Center controllers vectored Concorde out over the ocean as quickly as possible at approximately FL300 before clearing the aircraft to climb and accelerate to its cruise altitude and Mach number. This was done so that Concorde was out of the way of subsonic traffic as quickly as feasible for both intrusion avoidance and for noise abatement purposes [35].
5.4.2 Future CST Procedures and Operations
The proposed CST may also be required to fly a subsonic cruise phase where it will level off at an intermediate altitude at high subsonic speed. Ideally, however, air traffic controllers should allow the CST to execute a continuous climb from the ground to its cruise altitude. Flight deck automation and controller decision support tools will need to be researched and developed to ensure that the climb path is optimized for the CST with minimal impact to surrounding traffic. Examples of tools that can be modified to support this operation are discussed in Section 6 of this document.
However, if a corridor clear of traffic does not exist for the CST to perform a continuous climb, an intermediate subsonic cruise altitude may be required. The altitude and airspace block will be determined by an air traffic controller and will depend on traffic in the area of the CST and the direction of the flight. The altitude chosen for the subsonic cruise altitude should be the highest
35
altitude that may be climbed to without conflict, i.e., if the CST can climb to both FL360 and FL380 without conflict, FL380 should be chosen. This procedure is proposed because the CST can operate more efficiently at the higher altitude, and there is less altitude remaining to traverse to get to an altitude where the CST can fly at its supersonic cruise conditions.
Since the CST will be at subsonic speeds during this segment, ATC should be able to provide separation for the CST in the same manner as for subsonic traffic. The results discussed in Section 4.2.3.1 confirmed that there will be a time penalty for staying subsonic at an altitude below the cruise altitude for an extended period of time. It is also postulated that there will be a fuel penalty associated with a subsonic cruise.
5.5 Supersonic Acceleration and Climb Operations
5.5.1 Concorde Procedures and Operations
The climb and acceleration from the subsonic to supersonic cruise altitude and maximum operating Mach number or maximum operating skin temperature was the most crucial phase of flight for Concorde. The flight crew had to understand that it was acceptable to incur penalties (e.g., fuel, time) for staying subsonic at a less-than-ideal cruise altitude rather than interrupt the supersonic acceleration during the climb to cruise altitude. According to one Concorde pilot, it was “very bad news” if Concorde had to level off during the supersonic climb [11].
Concorde required a clear corridor to accelerate and climb between the points where the afterburners were turned on (beginning of climb) to the point where they were turned off. The point where the afterburners were turned off occurred either when the aircraft reached Mach 1.7 or 15 minutes after they were turned on, whichever came first [31]. According to the Concorde pilot, “In a perfect world, the flight crew would fly Concorde on the limits of its flight envelope up to its supersonic cruise altitude [11].”
Like the pilots, ATC had to understand that the Concorde needed a clear corridor to accelerate and climb to its cruise conditions. For Concorde, this was usually not an issue for NAS operations, since the controllers, as previously mentioned, would vector the aircraft out to the ocean as soon as feasible. There were few enough aircraft in a sector that a controller could manage the workload and provide a corridor clear of traffic for Concorde to accelerate and climb.
5.5.2 Future CST Procedures and Operations
Following the operational concepts that were mentioned previously for Concorde, it is assumed that CSTs will require an uninterrupted supersonic acceleration and climb to cruise altitude, which implies that no level-off clearances from ATC may occur during this segment. Therefore, like Concorde, a corridor clear of traffic is required for CST to climb and accelerate to cruise altitude and speed.
Due to the fundamentally different operating environment envisioned for future CST as opposed to Concorde (over-land versus oceanic operations), it is postulated that the workload for a controller to ensure a corridor clear of traffic for the CST to climb and accelerate will be higher if no automated decision support tools are used. The requirement for a clear corridor of traffic will require coordination between multiple sectors and multiple controllers, which may be facilitated easier through the use of envisioned NextGen systems, advanced trajectory-based operations, and the assumed communication, navigation, and surveillance concepts and environment discussed in Section 3.3. Furthermore, the task of creating or maintaining a corridor clear of traffic may not be a human-centric operation. In Section 6 of this paper, several technologies that utilize projected
36
NextGen capabilities and flight-deck based or ground-based automation are introduced to solve this technical barrier.
5.6 Supersonic Cruise Operations
5.6.1 Concorde Procedures and Operations
To achieve maximum efficiency during a flight, the Concorde required a block of altitude to cruise in. Concorde would ideally be at its cruise Mach number at FL500, and would perform a continuous cruise climb to its maximum operating ceiling of FL600 [11]. A block of altitude was required because Concorde flew a parabolic arc during the cruise, rather than holding a level, non-varying cruise altitude. This arc was flown due to the high temperatures caused by the friction created by the supersonic air acting on the skin of the aircraft. When the aircraft skin temperature reached 127° Celsius, the autopilot of the Concorde would command the aircraft to fly a temperature-dependent altitude profile rather than a Mach-dependent altitude profile. The autopilot played a large role in the supersonic cruise phase of flight to alleviate flight crew workload [31].
5.6.2 Future CST Procedures and Operations
For cruise, CSTs are expected to be immediately cleared for an altitude that is the most economical for the aircraft and mission. The cruise altitude of a CST is anticipated to be in the range of FL450-FL500. During cruise, it is postulated that the CST will adjust its thrust as required to hold both the altitude and the Mach number constant. The modeled trajectory allows for cruise climbs and cruise descents, similar to how those types of climbs and descents are performed for commercial subsonic aircraft. As the aircraft burns fuel, it may be more efficient for it to perform a continuous cruise climb.
At this supersonic cruise altitude, the CST should be free from most other traffic, and should not present a significant challenge to air traffic controllers. In the STONE study, a minimal number of intrusions were detected at the CST’s proposed cruise altitude. These intrusions involved high-end business jets, and the minimal number of intrusions suggests that it is unlikely that controller workload will be impacted in a significant way. Furthermore, as discussed in Section 6 of the paper, automated conflict detection and resolution technologies may be used during the cruise phase of flight.
5.7 Deceleration and Initial Descent Operations
5.7.1 Concorde Procedures and Operations
During descents into the NAS, the procedure required a manual calculation of the point where the aircraft had to be subsonic, and considered aircraft state variables as well as winds and temperatures. The flight crew would then plan the descent accordingly.
Similar to the cruise climb to the supersonic cruise altitude, a corridor clear of traffic was required for Concorde to perform an uninterrupted descent. Concorde could hold its altitude at FL410+, but had to remain supersonic to do so in order to avoid serious performance, fuel, and sonic boom penalties [31]. This intermediate level-off would affect the point at which Concorde would become subsonic, and would possibly cause a sonic boom to reach populated land [11].
In the summer months, New York Center controllers typically would descend and slow down Concorde further out to sea to prevent sonic boom from affecting the residents of Long Island [35]. It is postulated by the author that this procedure decreased the efficiency of the descent operation.
37
5.7.2 Future CST Procedures and Operations
As with Concorde, it is important that there be an uninterrupted supersonic deceleration and descent from cruise altitude. Ideally, there will be a traffic-free corridor where the CST can conduct a constant deceleration and descent with flight deck automation providing guidance to the flight crew on gear and flap deployment to minimize noise, fuel burn, and time to the runway. Some trajectory-based operations, such as Required Time of Arrival and Interval Management may be used to effectively and efficiently integrate the CST into the arrival flow. The CST should become subsonic at some point in the descent that is high enough to ensure that the effects of the sonic boom propagation are not undesirable on the ground. Further research is required to determine what point this is, and how this point is calculated dynamically and incorporated in with the configuration guidance.
However, similar to the ascent, if no clear corridor of traffic exists to perform a continuous descent, a descent to an intermediate subsonic cruise altitude may be required. The altitude would ideally be the altitude at which the CST reaches the transition to the arrival. This altitude will be determined by an air traffic controller and will depend on traffic in the area of the CST and the direction of the flight. The altitude should be the highest altitude that may be descended to without conflict. Again, this is because the CST can operate more efficiently at the higher altitude.
Currently, the deceleration is modeled in the trajectory as a constant altitude deceleration to a constant subsonic descent CAS. The subsonic CAS will be the CAS value at a high subsonic Mach number (Mach ≈ 0.9) at the CST’s subsonic descent cruise altitude. The constant subsonic descent CAS may result in a supersonic Mach number at cruise altitude, but will become subsonic as the aircraft descends. This segment, instead of occurring at a constant altitude, may also occur during a shallow descent segment. The configuration guidance, time-of-arrival control, and interval management concepts need to be adapted and further refined for use by CSTs. More research is required regarding this segment.
Since the deceleration is anticipated as occurring at the CST’s cruise altitude, by the time that the aircraft is intermingled with other subsonic traffic at the subsonic cruise altitude, it should be at a speed that air traffic controllers will be able to manage. If the deceleration occurs during a shallow descent, this implies that no level-off clearances may be commanded by ATC until the CST reaches high-subsonic speeds.
5.8 Arrival, Approach, and Landing Operations
5.8.1 Concorde Procedures and Operations
Prior to performing the approach, the crew received an approach briefing that included airport weather, winds aloft, approach procedures, radio aids and minima, the type of approach and speeds (reduced-noise, all weather), the transition level, the go-around procedures, and abnormal conditions with either the aircraft or the airfield [31].
On the standard approach, Instrument Landing System (ILS) glide slope guidance was required to perform the approach, and the headwind and crosswind limits were both 25 knots. Further, there had to be a high chance of at least 500 feet runway visual range [31]. The approach began with Concorde flying at 250 KIAS on downwind [11]. The pilot would then turn to the base leg, and reduce the speed to 210 KIAS. One the pilot turned final and the glideslope was captured, the flight crew would decelerate further to 190 KIAS. Once stabilized on the glideslope, the pilot would retract the visor, bring the nose down to its landing position (12.5° down), lower the gear, and set
38
the final approach speed in the mode control panel. The final approach speed for Concorde was usually calculated as [VRef + 7 KIAS], or approximately 165 KIAS [31]. Once Concorde touched down, the pilot, if using the auto-land system, would disconnect the autopilot and autothrottle systems. The minimum runway length for landing Concorde was 6000 feet [11]. The brakes were engaged fully as soon as the nose wheel touched down [31].
Typically, during its descent, ATC gave Concorde the right of way, cleared other subsonic traffic out of its way, and often inserted other commercial traffic into the arrival flow behind Concorde due to its speed in descent. This eliminated the potential for Concorde overrunning other traffic. The aircraft could perform a hold, although holds that lasted longer than 10 minutes often required a diversion to an alternate field for fuel considerations. Due to these fuel considerations, New York Center controllers typically gave Concorde priority for landing ahead of other traffic in the event of holding [35].
According to ATC at KJFK, there were no unusual problems in handling the Concorde during these phases of flight. The main difference between handling Concorde and subsonic aircraft was the final approach speed of the Concorde, which was, on average, 10 to 20 KIAS faster than most subsonic aircraft. The Concorde was classified as a heavy for wake vortex concerns, which required more separation on approach [35].
5.8.2 Future CST Procedures and Operations
During the arrival and approach segments, the CST should operate within the current mix of subsonic aircraft without disruption or special handling of any kind. Controller and flight deck tools will enable seamless integration using advanced flight deck or ground-based interval management automation. The trajectory would nominally use an unconstrained descent from the cruise altitude at a constant subsonic descent CAS to a constrained point, such as the transition to a Standard Terminal Arrival Route (STAR).
When the CST reaches the transition to the STAR, it will behave like other subsonic traffic on the STAR. It will follow the procedures of the STAR and meet both the published speed and altitude constraints. However, it is postulated that there are time savings benefits available if the CST is allowed to descend at faster speeds. Further research is required to determine the air traffic management and aircraft performance and efficiency effects of having the CST stay at supersonic speeds during the descent and into the STAR.
The approach is hypothesized to be conducted similarly to that of a subsonic commercial airliner. However, final approach speeds and the wake category classification, both of which will dictate how the CST is handled by controllers on final approach, are as yet undefined.
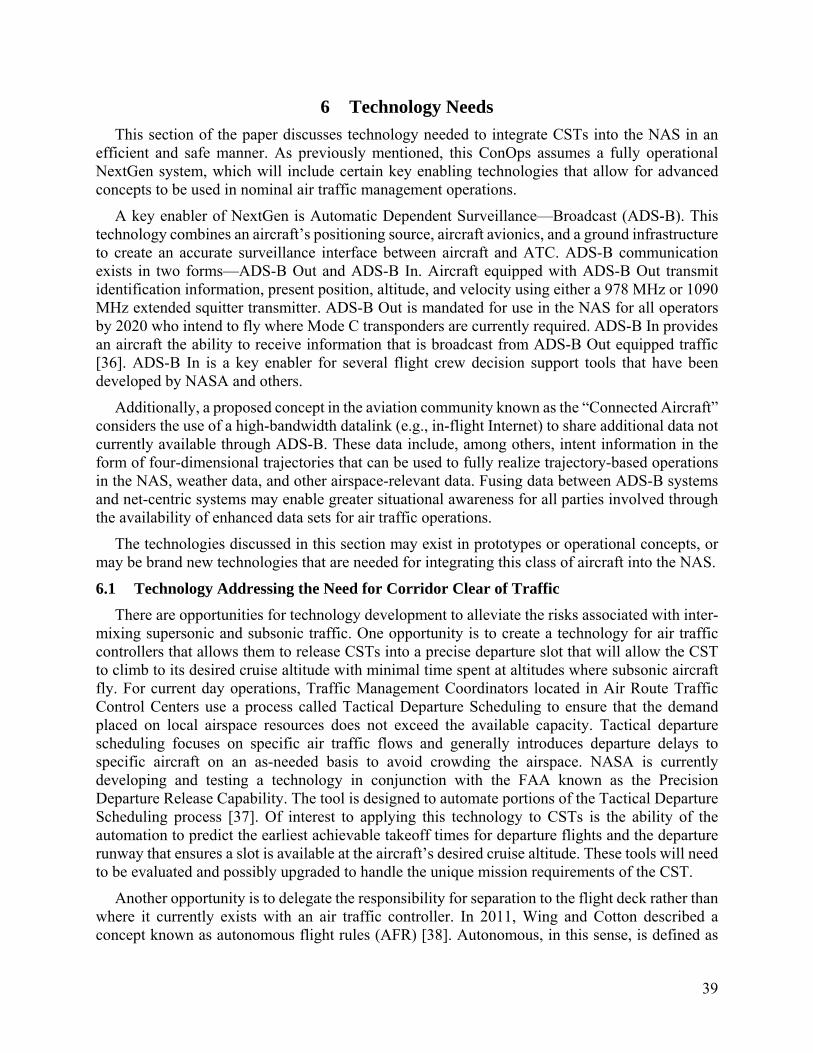
39
6 Technology Needs
This section of the paper discusses technology needed to integrate CSTs into the NAS in an efficient and safe manner. As previously mentioned, this ConOps assumes a fully operational NextGen system, which will include certain key enabling technologies that allow for advanced concepts to be used in nominal air traffic management operations.
A key enabler of NextGen is Automatic Dependent Surveillance—Broadcast (ADS-B). This technology combines an aircraft’s positioning source, aircraft avionics, and a ground infrastructure to create an accurate surveillance interface between aircraft and ATC. ADS-B communication exists in two forms—ADS-B Out and ADS-B In. Aircraft equipped with ADS-B Out transmit identification information, present position, altitude, and velocity using either a 978 MHz or 1090 MHz extended squitter transmitter. ADS-B Out is mandated for use in the NAS for all operators by 2020 who intend to fly where Mode C transponders are currently required. ADS-B In provides an aircraft the ability to receive information that is broadcast from ADS-B Out equipped traffic [36]. ADS-B In is a key enabler for several flight crew decision support tools that have been developed by NASA and others.
Additionally, a proposed concept in the aviation community known as the “Connected Aircraft” considers the use of a high-bandwidth datalink (e.g., in-flight Internet) to share additional data not currently available through ADS-B. These data include, among others, intent information in the form of four-dimensional trajectories that can be used to fully realize trajectory-based operations in the NAS, weather data, and other airspace-relevant data. Fusing data between ADS-B systems and net-centric systems may enable greater situational awareness for all parties involved through the availability of enhanced data sets for air traffic operations.
The technologies discussed in this section may exist in prototypes or operational concepts, or may be brand new technologies that are needed for integrating this class of aircraft into the NAS.
6.1 Technology Addressing the Need for Corridor Clear of Traffic
There are opportunities for technology development to alleviate the risks associated with inter-mixing supersonic and subsonic traffic. One opportunity is to create a technology for air traffic controllers that allows them to release CSTs into a precise departure slot that will allow the CST to climb to its desired cruise altitude with minimal time spent at altitudes where subsonic aircraft fly. For current day operations, Traffic Management Coordinators located in Air Route Traffic Control Centers use a process called Tactical Departure Scheduling to ensure that the demand placed on local airspace resources does not exceed the available capacity. Tactical departure scheduling focuses on specific air traffic flows and generally introduces departure delays to specific aircraft on an as-needed basis to avoid crowding the airspace. NASA is currently developing and testing a technology in conjunction with the FAA known as the Precision Departure Release Capability. The tool is designed to automate portions of the Tactical Departure Scheduling process [37]. Of interest to applying this technology to CSTs is the ability of the automation to predict the earliest achievable takeoff times for departure flights and the departure runway that ensures a slot is available at the aircraft’s desired cruise altitude. These tools will need to be evaluated and possibly upgraded to handle the unique mission requirements of the CST.
Another opportunity is to delegate the responsibility for separation to the flight deck rather than where it currently exists with an air traffic controller. In 2011, Wing and Cotton described a concept known as autonomous flight rules (AFR) [38]. Autonomous, in this sense, is defined as
40
“not subject to control from outside.” This term was chosen specifically to promote two of the central elements of AFR—the level of authority that the operator has to decide their aircraft’s trajectory, and the level of responsibility that is delegated to the flight operator. Wing and Cotton described the anticipated benefits that may be realized by subsonic commercial aircraft flying under AFR. However, the benefits to CSTs may be greater. The self-separation capability that must exist for the AFR concept to be realized will allow the operator of the CST to manage his or her trajectory while avoiding other aircraft. This capability will allow for safe and efficient operations to occur with minimal workload to either the flight deck or the air traffic controller. Research into both this concept and the precision departure release capability should be undertaken to investigate whether either of these concepts may be used advantageously for CSTs.
Furthermore, the use of trajectory-based operations will enable automation to plan and schedule a corridor that is clear of traffic to allow a CST to climb and accelerate to cruise altitude and speed. Using concepts such as AFR and tools such as the Precision Departure Release Capability along with other ground-based and airborne scheduling, sequencing, and spacing automation will allow for CSTs to efficiently integrate into the en-route stream of traffic and eventually climb continuously to its cruise altitude.
6.2 Real-time Flight-Deck Based Sonic Boom Mapping Tool
The flight plan for a CST will most likely need to avoid certain areas of the country due to sonic boom considerations. NASA has developed a tool that provides the flight crew of a CST with a real-time display of how the aircraft’s sonic boom propagates through the atmosphere and the level of the overpressure when the boom reaches the ground [39]. This tool may be incorporated with a CST’s flight management system or automation such as the Autonomous Operations Planner to provide an optimal trajectory for the CST to fly that minimizes the noise pollution levels felt on the ground in certain areas, including big cities and sensitive locations. Research is needed into how sonic boom overpressure and focus boom effects can be taken into account during both flight planning and trajectory management on the flight deck and on the ground.
6.3 En-route Flight Optimization and De-confliction
As previously mentioned, it is anticipated that traffic density will be low at cruise conditions for the CST. This provides an excellent environment for CSTs to be first adopters of automation tools that allow the flight crew to re-route their flight to make it more efficient. By combining a self-separation capability and the real-time sonic boom mapping tool, an automation tool may be developed that provides the CST with an optimized safe, efficient, and quiet trajectory.
6.4 Efficient Operations during Arrival and Approach
The initial descent, arrival, and approach segments may present a challenge for air traffic controllers. Future research should investigate the use of concepts such as interval management [40] [41] and/or controller managed spacing [42] for use with CSTs. These tools enable seamless merging of aircraft on separate arrival routes, either through air traffic controller commanded speeds, or automation on the flight deck that presents speeds for flight crews to fly to maintain a controller-issued spacing interval. Through the use of these tools, and with the addition of trajectory-based operations in the NAS, CSTs may be more easily and efficiently integrated into arrival flows, and may be allowed to descend on an aircraft-specific efficient descent profile.
41
7 Conclusion
This document was developed to create a path for research and development that exposes the benefits and barriers to integrating a class of CSTs into the NAS seamlessly. CST design issues, including sonic boom and airframe noise, and underlying assumptions about how future CST may be used are discussed. Assumptions made regarding aircraft system equipage, including vision system technologies, avionics, and CNS systems define a minimum set of equipage that outlines the scope in which example procedures and technologies can be defined. Next, assumptions regarding CNS infrastructure that is consistent with the vision of the NextGen NAS, potential airports, and city pairs between which CST flights may operate are presented.
The STONE study is introduced, and results that dictated technological and procedural needs are discussed. The development of a model of the proposed NASA N+2 CST for use in the NASA Langley-developed ATOS software is discussed. This model will allow researchers to begin investigating, at a higher fidelity, research questions that address the operational assumptions, procedures, and technologies discussed in this document.
Furthermore, historical procedures for Concorde are presented, and potential procedures for future CST operations are introduced. These procedures set a baseline from which new procedures and operations can be created, tested, and validated.
Finally, technology needs identified from the STONE study and required to fulfill the example procedures are discussed. Examples of decision support tools and flight deck automation that may be modified to solve the technological challenges are presented.
In conclusion, this document provides a baseline for creating discipline-specific and foundational research in the area of CST operations in the NAS. This research should lead to the development and evaluation activities that will resolve the issues and needs identified in this document, and uncover issues that arise when using these hypothesized technologies and procedures.
42
References
[1] L. R. Benson, Quieting the Boom: The Shaped Sonic Boom Demonstrator and the Quest for Quiet Supersonic Flight, Washington, D.C.: National Aeronautics and Space Administration, 2013.
[2] British Airways, "Celebrating Concorde," 2014. [Online]. Available: http://www.britishairways.com/en-gb/information/about-ba/history-and-heritage/celebrating-concorde. [Accessed 20 May 2014].
[3] The Museum of Flight, "Concorde," 2013. [Online]. Available: http://www.museumofflight.org/aircraft/concorde. [Accessed 20 May 2014].
[4] A. Icarus, "Concorde Aircraft Histories," 15 May 2003. [Online]. Available: https://en.wikipedia.org/wiki/Concorde_aircraft_histories#/media/File:235ac_-_British_Airways_Concorde;_G-BOAD@LHR;15.05.2003_(8056002570).jpg. [Accessed 23 August 2015].
[5] NASA, "NASA's High-Speed Research (HSR) Program - Developing Tomorrow's Supersonic Passenger Jet," 22 04 2008. [Online]. Available: http://www.nasa.gov/centers/langley/news/factsheets/HSR-Overview2.html. [Accessed 28 05 2014].
[6] National Aeronautics and Space Adminstration, "The High Speed Project," 18 April 2013. [Online]. Available: http://www.aeronautics.nasa.gov/fap/high_speed.html. [Accessed 26 September 2014].
[7] "NASA and the Next Generation Air Transportation System (NextGen)," National Aeronautics and Space Administration, Washington, D.C., 2007.
[8] P. A. Henne, "Case for Small Supersonic Aircraft," Journal of Aircraft, vol. 42, no. 3, pp. 765-774, 2005.
[9] Committee on Breakthrough Technology for Commercial Supersonic Aircraft, National Research Council, Division on Engineering and Physical Sciences, Aeronautics and Space Engineering Board, "Commercial Supersonic Technology: The Way Ahead," National Academies Press, Washington D.C., 2002.
[10] National Aeronautics and Space Administration, "ARMD Strategic Implementation Plan," 2015. [Online]. Available: http://www.aeronautics.nasa.gov/pdf/armd-strategic-implementation-plan.pdf. [Accessed 2 December 2015].
[11] J. Hutchinson, Interviewee, Concorde Operations. [Interview]. 15 02 1995.
[12] Federal Aviation Adminstration, "Civil Supersonic Airplane Noise Type Certification Standards and Operating," US Department of Transportation, Washington, D.C., 2008.
43
[13] NASA, "The High Speed Project," 18 04 2013. [Online]. Available: http://www.aeronautics.nasa.gov/fap/high_speed.html. [Accessed 28 05 2014].
[14] B. M. Sullivan, "Sonic Boom Loudness Results for Shaped," in SSBE Closeout Workshop, Hampton, 2004.
[15] C. Thomas, "Quiet Spike," 26 September 2006. [Online]. Available: https://en.wikipedia.org/wiki/Quiet_Spike#/media/File:NASA_F-15B_836_with_Quiet_Spike.jpg. [Accessed 29 June 2016].
[16] T. Malik, "NASA Jet Bears Nose that Grows for Sonic Boom Tests," Space.com, 11 October 2006. [Online]. Available: http://www.space.com/2995-nasa-jet-bears-nose-grows-sonic-boom-tests.html. [Accessed 30 November 2015].
[17] C. Thomas, "Shaped Sonic Boom Demonstration," 2 August 2003. [Online]. Available: https://en.wikipedia.org/wiki/Shaped_Sonic_Boom_Demonstration#/media/File:F-5E_Shaped_Sonic_Boom_Demonstration_aircraft.jpg. [Accessed 29 June 2016].
[18] United States Government Accounting Office, "The Concorde Supersonic Aircraft Trial Entry into Dulles International Airport," United States Government Accounting Office, Washington, 1977.
[19] United States Government, "ELECTRONIC CODE OF FEDERAL REGULATIONS; Title 14, Chapter 1, Subchapter 3, Part 36," 9 April 2015. [Online]. Available: http://www.ecfr.gov/cgi-bin/text-idx?SID=0f550bd038e359b415c5a7cc2475b800&mc=true&node=pt14.1.36&rgn=div5#sp14.1.36.d. [Accessed 13 April 2015].
[20] L. Gipson, "An Iconic Idea," 2 July 2010. [Online]. Available: https://www.nasa.gov/content/an-iconic-idea. [Accessed 29 June 2016].
[21] L. Gipson, "NASA's Low-Boom Supersonic Test Case," 14 February 2013. [Online]. Available: http://www.nasa.gov/content/nasas-low-boom-supersonic-test-case. [Accessed 29 June 2016].
[22] G. Roxburgh, "Concorde SST," 2004. [Online]. Available: http://www.concordesst.com/accomodation.html. [Accessed 21 05 2014].
[23] S. Fitzgerald, "Droop-nose," 7 September 1974. [Online]. Available: https://en.wikipedia.org/wiki/Droop-nose#/media/File:Concorde_landing_Farnborough_Fitzgerald.jpg. [Accessed 29 June 2016].
[24] D. N. Andrastek, "External Vision System - Initial "No Droop" Cost/Economic Benefit- Trade Studies Report," Boeing Contractor Report No. CR #29-A13, 1999.
[25] K. J. Shelton, S. P. Williams, L. J. Kramer, J. J. Arthur, L. Prinzel and R. E. Bailey, "External Vision Systems (XVS) Proof-of-Concept Flight Test Evaluation," in SPIE (DSS 2014) Defense and Security Symposium, Baltimore, 2014.
44
[26] Federal Aviation Administration, "4D Trajectory Based Operations Concept of Operations," Federal Aviation Administration, Washington, 2014.
[27] Rockwell Collins, "ACARS," 2015. [Online]. Available: http://rockwellcollins.com/services_and_support/information_management/arinc_aviation/globalink-air-ground/acars.aspx. [Accessed 28 April 2015].
[28] Special Committee 186 (SC-186), "RTCA/DO-260B: Minimum Operational Performance Standards for 1090MHz Extended Squitter for Automated Dependent Surveillance-Broadcast (ADS-B) and Traffic Information Services-Broadcast (TIS-B)," RTCA, Washington, D.C., 2009.
[29] Federal Aviation Administration, "FAA's NextGen Implementation Plan," US Department of Transportation, Washington, D.C., 2014.
[30] Federal Aviation Administration, "IFR Separation Standards," in Aeronautical Information Manual, Washington, 2014, pp. 4-4-11.
[31] British Airways, Concorde Flying Manual, Procedures and Techniques, Harmondsworth: British Airways, 1994.
[32] North Atlantic Systems Planning Group, "Guidance Concerning Air Navigation in and above the North Atlantic MNPS Airspace," Eurpoean and North Atlantic Office of ICAO, Paris, 2010.
[33] IVAO, "Concorde Controller Procedures," 2014. [Online]. Available: http://occ.ivao.aero/index.php?site=concordeatc. [Accessed 15 05 2014].
[34] M. Ray, 757/767 Pilot Handbook for Simulator and Check Ride Procedures, Murrieta: University of Temecula Press, 2012.
[35] P. Galligan, Interviewee, ATC Handling of Concorde at ZNY. [Interview]. 14 December 2012.
[36] Federal Aviation Administration, "Automatic Dependent Surveillance—Broadcast Out Performance Requirements to Support Air Traffic Control Service; Final Rule," GPO, Washington, 2010.
[37] National Aeronautics and Space Administration, "Precision Departure Release Capability," 2013. [Online]. Available: http://www.aviationsystemsdivision.arc.nasa.gov/research/tactical/PDRC_Factsheet_Final_20130411.pdf. [Accessed 12 February 2015].
[38] D. J. Wing and W. B. Cotton, "For Spacious Skies: Self-Separation with “Autonomous Flight Rules” in US Domestic Airspace," in 11th AIAA Aviation Technology, Integration, and Operations (ATIO) Conference, Virginia Beach, 2011.
[39] National Aeronautics and Space Administration, "Interactive Display Provides Pilots with Real-Time Sonic Boom Information," 2011. [Online]. Available:
45
http://www.nasa.gov/sites/default/files/files/DRC-008-001_DR-0007-LST_sonic-boom_3-27-14_ONLINE.pdf. [Accessed 13 February 2015].
[40] B. Barmore, "Airborne Precision Spacing: A Trajectory-based Approach to Improve Terminal Area Operations," in DASC 06, 2006.
[41] K. A. Swieringa and M. C. Underwood, "An Evaluation of a Flight Deck Interval Management Algorithm including Delayed Target Trajectories," in 14th AIAA Aviation Technology, Integration, and Operations Conference , Atlanta, 2014.
[42] M. Kupfer, T. Callantine, L. Martin, J. Mercer and E. Palmer, "Controller Support Tools for Schedule-based Terminal-area Operations," in Ninth USA/Europe Air Traffic Management Research and Development Seminar, Berlin, 2011.
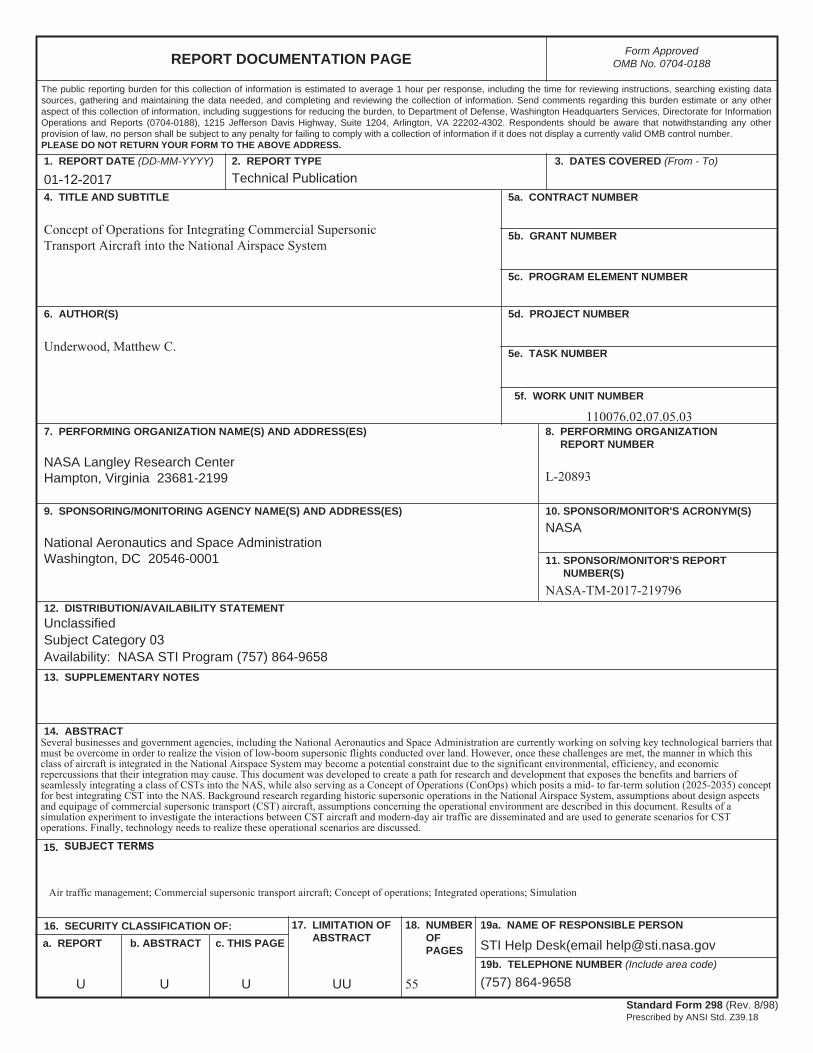
REPORT DOCUMENTATION PAGE
Standard Form 298 (Rev. 8/98) Prescribed by ANSI Std. Z39.18
Form Approved OMB No. 0704-0188
The public reporting burden for this collection of information is estimated to average 1 hour per response, including the time for reviewing instructions, searching existing data sources, gathering and maintaining the data needed, and completing and reviewing the collection of information. Send comments regarding this burden estimate or any other aspect of this collection of information, including suggestions for reducing the burden, to Department of Defense, Washington Headquarters Services, Directorate for Information Operations and Reports (0704-0188), 1215 Jefferson Davis Highway, Suite 1204, Arlington, VA 22202-4302. Respondents should be aware that notwithstanding any other provision of law, no person shall be subject to any penalty for failing to comply with a collection of information if it does not display a currently valid OMB control number. PLEASE DO NOT RETURN YOUR FORM TO THE ABOVE ADDRESS.
3. DATES COVERED (From - To)
5a. CONTRACT NUMBER
5b. GRANT NUMBER
5c. PROGRAM ELEMENT NUMBER
5d. PROJECT NUMBER
5e. TASK NUMBER
7. PERFORMING ORGANIZATION NAME(S) AND ADDRESS(ES) 8. PERFORMING ORGANIZATIONREPORT NUMBER
10. SPONSOR/MONITOR'S ACRONYM(S)
11. SPONSOR/MONITOR'S REPORTNUMBER(S)
9. SPONSORING/MONITORING AGENCY NAME(S) AND ADDRESS(ES)
13. SUPPLEMENTARY NOTES
16. SECURITY CLASSIFICATION OF:
a. REPORT b. ABSTRACT c. THIS PAGE
17. LIMITATION OFABSTRACT
18. NUMBEROFPAGES
19a. NAME OF RESPONSIBLE PERSON
19b. TELEPHONE NUMBER (Include area code)
1. REPORT DATE (DD-MM-YYYY)
01-12-2017
2. REPORT TYPE
Technical Publication4. TITLE AND SUBTITLE
Concept of Operations for Integrating Commercial Supersonic Transport Aircraft into the National Airspace System
6. AUTHOR(S)
Underwood, Matthew C.
NASA Langley Research Center Hampton, Virginia 23681-2199 L-20893
National Aeronautics and Space Administration Washington, DC 20546-0001
5f. WORK UNIT NUMBER
NASA
NASA-TM-2017-21979612. DISTRIBUTION/AVAILABILITY STATEMENT
UnclassifiedSubject Category 03Availability: NASA STI Program (757) 864-9658
U U U UU 55
STI Help Desk(email [email protected]
(757) 864-9658
110076.02.07.05.03
14. ABSTRACT
15. SUBJECT TERMS
Several businesses and government agencies, including the National Aeronautics and Space Administration are currently working on solving key technological barriers that must be overcome in order to realize the vision of low-boom supersonic flights conducted over land. However, once these challenges are met, the manner in which this class of aircraft is integrated in the National Airspace System may become a potential constraint due to the significant environmental, efficiency, and economic repercussions that their integration may cause. This document was developed to create a path for research and development that exposes the benefits and barriers of seamlessly integrating a class of CSTs into the NAS, while also serving as a Concept of Operations (ConOps) which posits a mid- to far-term solution (2025-2035) concept for best integrating CST into the NAS. Background research regarding historic supersonic operations in the National Airspace System, assumptions about design aspects and equipage of commercial supersonic transport (CST) aircraft, assumptions concerning the operational environment are described in this document. Results of a simulation experiment to investigate the interactions between CST aircraft and modern-day air traffic are disseminated and are used to generate scenarios for CST operations. Finally, technology needs to realize these operational scenarios are discussed.
Air traffic management; Commercial supersonic transport aircraft; Concept of operations; Integrated operations; Simulation