conceptual design of oxygen-based pc boiler library/research/coal/ewr/co2/41736... · conceptual...
TRANSCRIPT

Conceptual Design of Oxygen-Based PC Boiler
Final Report
Andrew Seltzer Zhen Fan
September 2005
DE-FC26-03NT41736
Foster Wheeler Power Group, Inc. 12 Peach Tree Hill Road
Livingston, New Jersey 07039

DISCLAIMER
This report was prepared as an account of work sponsored by an agency of the United States Government. Neither the United States Government nor any agency thereof, nor any of their employees, makes any warranty, express or implied, or assumes any legal liability or responsibility for the accuracy, completeness, or usefulness of any information, apparatus, product, or process disclosed, or represents that its use would not infringe privately owned rights. Reference herein to any specific commercial product, process, or service by trade name, trademark, manufacturer, or otherwise does not necessarily constitute or imply its endorsement, recommendation, or favoring by the United States Government or any agency thereof. The views and opinions of authors expressed herein do not necessarily state or reflect those of the United States Government or any agency thereof.
2
ABSTRACT Coal is presently the world’s primary fuel for generating electrical power and, being more abundant and less expensive than oil or natural gas, is expected to continue its dominance into the future. Coal, however, is more carbon intensive than natural gas and oil and consequently coal-fired power plants are large point source emitters of carbon dioxide (CO2). Since CO2 is a greenhouse gas, which may have an adverse impact on the world’s climate/weather patterns, studies have been conducted to determine the feasibility and economic impact of capturing power plant CO2 emissions for pipeline transport to a sequestration/storage site. The stack gas that exhausts from a modern coal-fired power plant typically contains about 15 per cent CO2 on a dry volume basis. Although there are numerous processes available for removing CO2 from gas streams, gas scrubbing with amine solvent is best suited for this application because of the large gas volumes and low CO2 concentrations involved. Unfortunately the energy required to regenerate the solvent for continued use as a capturing agent is large and imposes a severe energy penalty on the plant. In addition this “back end” or post combustion cleanup requires the addition of large vessels, which, in retrofit applications, are difficult to accommodate. As an alternative to post combustion scrubbing, Foster Wheeler (FW) has proposed that the combustion process be accomplished with oxygen rather than air. With all air nitrogen eliminated, a CO2-water vapor rich flue gas will be generated. After condensation of the water vapor, a portion of the flue gas will be recirculated back to the boiler to control the combustion temperature and the balance of the CO2 will be processed for pipeline transport. This proposed oxygen-carbon dioxide (O2/CO2) combustion process eliminates the need for CO2 removal/separation and reduces the cost of supplying a CO2 rich stream for sequestration. Under DOE Contract No DE-FC26-03NT41736 FW has developed a conceptual design of an O2 fired boiler to determine overall plant performance and economics. Five subtasks were conducted: 1) a literature review, 2) a system design and analysis, 3) a low NOx burner design and analysis, 4) a furnace and heat recovery area design analysis, and 5) an economic analysis. The objective of the literature search is to locate any data/information relevant to the Oxygen-Based PC Boiler conceptual design. The objective of the system design and analysis task is to optimize the PC boiler plant by maximizing system efficiency within practical considerations. Simulations of the oxygen-fired plant with CO2 sequestration were conducted using Aspen Plus and were compared to a reference air-fired 460 MW plant. Flue gas recycle is used in the O2-fired PC to control the flame temperature. Parametric runs were made to determine the effect of flame temperature on system efficiency and required waterwall material and thickness. The degree of improvement on system efficiency of various modifications including hot gas recycle, purge gas recycle, flue gas feedwater recuperation, and
3

recycle purge gas expansion were investigated. The selected O2-fired design case has a system efficiency of 30.6% compared to the air-fired system efficiency of 36.7%. The design O2-fired case requires T91 waterwall material and has a waterwall surface area of only 65% of the air-fired reference case. The objective of the low NOx burner design and analysis task is to optimize the burner design to ensure stable ignition, to provide safe operation, and to minimize pollutant formation. The burners were designed and analyzed using the Fluent CFD computer program. Four burner designs were developed: 1) with no OFG and 65% flue gas recycle, 2) with 20% OFG and 65% flue gas recycle, 3) with no OFG and 56% flue gas recycle and 4) with 20% OFG and 56% flue gas recycle. A 3-D Fluent simulation was made of a single wall-fired burner and horizontal portion of the furnace from the wall to the center. Without primary gas swirl, coal burnout was relatively small, due to the low oxygen content of the primary gas. Consequently, the burners were modified to include primary gas swirl to bring the coal particles in contact with the secondary gas. An optimal primary gas swirl was chosen to achieve sufficient burnout. The objective of the furnace and heat recovery area design and analysis task is to optimize the location and design of the furnace, burners, over-fire gas ports, and internal radiant surfaces. The furnace is designed with opposed wall-firing burners and over-fire air ports. Water is circulated in the furnace by natural circulation to the waterwalls and divisional wall panels. Compared to the air-fired furnace, the oxygen-fired furnace requires only 65% of the surface area and 45% of the volume. Two oxygen-fired designs were simulated: 1) without over-fire air and 2) with 20% over-fire air. The maximum wall heat flux in the oxygen-fired furnace is more than double that of the air-fired furnace due to the higher flame temperature and higher H2O and CO2 concentrations. The coal burnout for the oxygen-fired case is 100% due to a 500°F higher furnace temperature and higher concentration of O2. Because of the higher furnace wall temperature of the oxygen-fired case compared to the air-fired case, furnace water wall material was upgraded from carbon steel to T91. The total heat transfer surface required in the oxygen-fired heat recovery area is 25% less than the air-fired HRA due to more heat being absorbed in the oxygen-fired furnace and the greater molecular weight of the oxygen-fired flue gas. The objective of the economic analysis is to prepare a budgetary estimate of capital and operating costs of the O2-fired PC power plant as well as for the equivalent conventional PC-fired power plant. Capital and operating costs of conventional steam generation, steam heating, and power generation equipment are estimated based on Foster Wheeler’s experience and database. Capital and operating costs of equipment, such as oxygen separation and CO2 liquefaction, are based on vendor supplied data and FW process plant experience. The levelized cost of electricity is determined for both the air-fired and O2-fired power plants as well as the CO2 mitigation cost. An economic comparison between the O2-fired PC and other alternate technologies is presented. The levelized COE was calculated to be 4.61 ¢/kWh for the reference air-fired plant and 6.41¢/kWh for the O2 PC plant. The CO2 mitigation cost of the O2-PC plant was calculated at 21.4 $/tonne.
4

Table of Contents ABSTRACT ..................................................................................................................... 3 1.0 Introduction......................................................................................................... 11 2.0 Executive Summary............................................................................................ 14 3.0 Experimental....................................................................................................... 21 4.0 Results and Discussion ...................................................................................... 22
4.1 Literature Review ............................................................................................ 22 4.1.1 Combustion With Partial Oxygen Enhancement ...................................... 22 4.1.2 O2/CO2 Combustion................................................................................. 25 4.1.3 Impact of CO2 Removal on New Plants.................................................... 32 4.1.3.1 International Energy Agency Study ...................................................... 32 4.1.3.2 Parsons Study...................................................................................... 35 4.1.3.3 American Air Liquide Study .................................................................. 40 4.1.3.4 Summary of New Plant Studies............................................................ 42 4.1.4 Impact of CO2 Removal On Existing Plants ............................................. 44 4.1.5 Oxygen Supply Systems.......................................................................... 45
4.2 System Design and Analysis........................................................................... 47 4.2.1 Reference Site and Fuel Conditions ........................................................ 47 4.2.2 Air-Fired Reference Case ........................................................................ 47 4.2.3 Oxygen-Based PC Plant .......................................................................... 49 4.2.3.1 Boiler Plant Modifications ..................................................................... 49 4.2.3.2 Air Separation Unit ............................................................................... 49 4.2.4 Parametric Cases .................................................................................... 50 4.2.5 Hot Recycle ............................................................................................. 51 4.2.6 CO2 Compression .................................................................................... 52 4.2.7 Vent Gas Recycle .................................................................................... 53 4.2.8 Case 12 ................................................................................................... 54 4.2.9 Design Case: Case 13............................................................................. 55 4.2.10 Furnace Waterwall Temperature ............................................................. 55 4.2.11 Comparison With Post CO2 Capture........................................................ 57
4.3 Low NOx Burner Design and Analysis ............................................................ 93 4.3.1 Model Geometry ...................................................................................... 93 4.3.2 Sub Models.............................................................................................. 93 4.3.3 Boundary Conditions ............................................................................... 93 4.3.4 65% Recycle Case With No OFG ............................................................ 94 4.3.4.1 No Primary Gas Swirl ........................................................................... 94 4.3.4.2 Primary Gas Swirl Ratio = 0.5 .............................................................. 94 4.3.5 65% Recycle Case With 20% OFG ......................................................... 94 4.3.5.1 No Primary Gas Swirl ........................................................................... 95 4.3.5.2 Primary Gas Swirl Ratio = 0.5 .............................................................. 95 4.3.6 56% Recycle Case With No OFG ............................................................ 95 4.3.6.1 No Primary Gas Swirl ........................................................................... 95 4.3.6.2 Primary Gas Swirl Ratio = 0.5 .............................................................. 95 4.3.7 56% Recycle Case With 20% OFG ......................................................... 96 4.3.7.1 No Primary Gas Swirl ........................................................................... 96
5

4.3.7.2 Primary Gas Swirl Ratio = 0.5 .............................................................. 96 4.4 Furnace and HRA Design and Analysis ........................................................ 144
4.4.1 Furnace Design and Analysis ................................................................ 144 4.4.1.1 FW-FIRE Computer Program Description .......................................... 144 4.4.1.2 Model Geometry................................................................................. 145 4.4.1.3 Boundary Conditions .......................................................................... 146 4.4.1.4 Air-Fired Reference Case................................................................... 146 4.4.1.5 Oxygen-Fired Design Case ................................................................ 147 4.4.1.5.1 No OFG Case .................................................................................... 148 4.4.1.5.2 20% OFG Case.................................................................................. 149 4.4.2 Heat Recovery Area Design and Analysis ............................................. 150 4.4.2.1 HEATEX Program Description ........................................................... 150 4.4.2.2 Air-Fired Reference Case................................................................... 150 4.4.2.3 Oxygen-Fired Case ............................................................................ 150
4.5 Economic Analysis........................................................................................ 190 4.5.1 Main Assumptions ................................................................................. 190 4.5.2 Plant Cost Basis .................................................................................... 190 4.5.3 Total Plant Investment (TPI) .................................................................. 193 4.5.4 Total Capital Requirement (TCR) .......................................................... 193 4.5.5 Operating Costs And Expenses............................................................. 194 4.5.6 Cost Of Electricity (COE) ....................................................................... 195 4.5.7 Comparison with Other Technologies.................................................... 196
5.0 Conclusion........................................................................................................ 205 6.0 References ....................................................................................................... 209 7.0 Bibliography...................................................................................................... 212 8.0 List of Acronyms and Abbreviations ................................................................. 213
6

LIST OF GRAPHICAL MATERIALS
Tables Table 4.1.1 CANMET Burner Operating Conditions...................................................... 28 Table 4.1.2 CANMET Burner Test Flow Rates.............................................................. 28 Table 4.1.3 CANMET Burner Performance ................................................................... 29 Table 4.1.4 Performance of Nominal 500 MWe Power Generating Technologies ........ 34 Table 4.1.5 Effect of CO2 Capture Technologies on a Nominal 500 MWe PC Fired Plant
............................................................................................................................... 35 Table 4.1.6 Effect of CO2 Absorption on Alternative Power Generating Technologies.. 35 Table 4.1.7 Illinois No 6 Coal Analysis .......................................................................... 36 Table 4.1.8 Natural Gas Analysis.................................................................................. 37 Table 4.1.9 NGCC and Illinois No 6 PC Plants Without CO2 Capture ........................... 38 Table 4.1.10 NGCC and Illinois No 6 PC Plants with 90 Per Cent CO2 Capture........... 39 Table 4.1.11 PRB Fueled PC Plant Performance With and Without CO2 Capture........ 41 Table 4.1.12 Summary of Plant CO2 Removal Studies ................................................. 43 Table 4.1.13 CO2 Removal Incorporated Into An Existing PC Plant.............................. 45 Table 4.2.1 – Site Conditions and Coal Properties........................................................ 59 Table 4.2.2 – Case 1 (Air-Fired Reference) Boundary Conditions and Results ............ 61 Table 4.2.3 – Auxiliary Power Requirements for Case 1............................................... 62 Table 4.2.4 – Parametric Cases Summary (Without CO2 Compression) ...................... 71 Table 4.2.5 – Parametric Cases Summary (With CO2 Compression) ........................... 82 Table 4.2.6 – Radiation Heat Flux and Water Wall Temperature .................................. 86 Table 4.3.1 – Coal Properties........................................................................................ 99 Table 4.3.2 –Model Boundary Conditions ................................................................... 100 Table 4.3.3 – Summary of Fluent Burner Modeling Results ........................................ 101 Table 4.4.1 – Air-Fired Boundary Conditions .............................................................. 155 Table 4.4.2 – Oxygen-Fired Boundary Conditions ...................................................... 156 Table 4.4.3 – Summary of FW-FIRE Furnace Modeling Results................................. 158 Table 4.4.4 – HRA Tube Bank Design ........................................................................ 188 Table 4.4.5 – HRA Tube Bank Performance ............................................................... 189 Table 4.5.1 – Oxygen-Fired PC Plant Capital Cost Estimate ...................................... 192 Table 4.5.2 - Operating, Maintenance and Fuel Costs for the O2 PC and the Air-fired
Reference ............................................................................................................ 198 Table 4.5.3 - Estimate Basis/Financial Criteria for Revenue Requirement Calculations:
Air-fired Reference Plant...................................................................................... 199 Table 4.5.4 - Estimate Basis/Financial Criteria for Revenue Requirement Calculations:
O2-fired Reference Plant ...................................................................................... 200 Table 4.5.5 - Capital Investment and Revenue Requirement Summary: Air-fired
Reference Plant ................................................................................................... 201 Table 4.5.6 - Capital Investment and Revenue Requirement Summary: O2-fired Plant
............................................................................................................................. 202
7

Figures Figure 4.1.1 Effect of OEC on Class C Bituminous Coal NOx Emissions ..................... 24 Figure 4.1.2 Effect of OEC on Class A Bituminous Coal NOx Emissions...................... 24 Figure 4.1.3 Effect of Oxygen Ratio on Burner Combustion Efficiency ......................... 26 Figure 4.1.4 Effect of Primary to Secondary O2 Ratio on Burner Combustion Efficiency
............................................................................................................................... 26 Figure 4.1.5 CANMET Burner ....................................................................................... 27 Figure 4.1.6 Centerline Temperatures Downstream of Burner...................................... 30 Figure 4.1.7 Centerline NOx Emission Rates................................................................ 30 Figure 4.1.8 Centerline SO2 Emission Rates ................................................................ 31 Figure 4.1.9 PRB Fired PC Plant Capital Costs With and Without CO2 Capture........... 42 Figure 4.1.10 PRB Fired PC Plant COE and CO2 Avoided Costs ................................. 42 Figure 4.2.1 – Cycle Analysis of Case 1 (Air-Fired Reference Case)............................ 60 Figure 4.2.2 – Air Separation Unit ................................................................................. 63 Figure 4.2.3 – ASPEN ASU Model ................................................................................ 64 Figure 4.2.4 – Case 2 Cycle Diagram ........................................................................... 65 Figure 4.2.5 – Case 3 Cycle Diagram ........................................................................... 66 Figure 4.2.6 – Case 4 Cycle Diagram ........................................................................... 67 Figure 4.2.7 – Case 5 Cycle Diagram ........................................................................... 68 Figure 4.2.8 – Case 6 Cycle Diagram ........................................................................... 69 Figure 4.2.9 – Case 7 Cycle Diagram ........................................................................... 70 Figure 4.2.10 – Net Efficiency (without CO2 compression) Versus Adiabatic
Temperature .......................................................................................................... 72 Figure 4.2.11 - ASU and Auxiliary Power Requirements Versus Adiabatic Temperature
............................................................................................................................... 73Figure 4.2.12 – Recycled Gas Mass Flow Rate Versus Adiabatic Temperature ........... 74 Figure 4.2.13 – Recycled Gas Volumetric Flow Rate Versus Adiabatic Temperature... 75 Figure 4.2.14 – Flue Gas Cooling Curve ....................................................................... 76 Figure 4.2.15 – Case 8 Cycle Diagram ......................................................................... 77 Figure 4.2.16 – Case 9 Cycle Diagram ......................................................................... 78 Figure 4.2.17 – Net Cycle Efficiency Vs. Flue Gas Recycle Flow ................................. 79 Figure 4.2.18 – Case 10 Cycle Diagram ....................................................................... 80 Figure 4.2.19 – Case 11 Cycle Diagram ....................................................................... 81 Figure 4.2.20 – Vapor Pressure of CO2......................................................................... 83 Figure 4.2.21 – Equilibrium CO and CO2 Versus Flue Gas Recycle Flow .................... 84 Figure 4.2.22 – Adiabatic and Equilibrium Temperatures Versus Flue Gas Recycle Flow
............................................................................................................................... 85Figure 4.2.23 – Case 12 Cycle Diagram ....................................................................... 87 Figure 4.2.24 – Wet End Economizer Temperature Vs. Heat Duty ............................... 88 Figure 4.2.25 – Case 13 Cycle Diagram ....................................................................... 89 Figure 4.2.26 – Efficiency of Saved Extraction Steam Versus Stage ............................ 90 Figure 4.2.27 – Comparison of Power Consumption of CO2 Removal of Different
Technologies.......................................................................................................... 91 Figure 4.2.28 – Comparison of Overall Cycle Efficiency Point of CO2 Removal of
Different Technologies ........................................................................................... 92
8

Figure 4.3.1 – Oxygen-Fired Burner Geometry ............................................................. 97 Figure 4.3.2 – Computational Model of Oxygen-Fired Burner ....................................... 98 Figure 4.3.3 – Burnout and NOx/burnout vs. Primary gas Swirl for 65% Recycle, No
OFG ..................................................................................................................... 102 Figure 4.3.4 – Gas Velocity for 65% Recycle, No OFG, 0.0 PG Swirl ......................... 103 Figure 4.3.5 – Gas Temperature for 65% Recycle, No OFG, 0.0 PG Swirl ................. 104 Figure 4.3.6 – O2 Mole Fraction for 65% Recycle, No OFG, 0.0 PG Swirl .................. 105 Figure 4.3.7 – Burnout of 69µ Particles for 65% Recycle, No OFG, 0.0 PG Swirl....... 106 Figure 4.3.8 – Burnout of 169µ Particles for 65% Recycle, No OFG, 0 PG Swirl........ 107 Figure 4.3.9 – Gas Velocity for 65% Recycle, No OFG, 0.5 PG Swirl ......................... 108 Figure 4.3.10 – Gas Temperature for 65% Recycle, No OFG, 0.5 PG Swirl ............... 109 Figure 4.3.11 – O2 Mole Fraction for 65% Recycle, No OFG, 0.5 PG Swirl ................ 110 Figure 4.3.12 – Velocity Vectors Colored by Axial Velocity (ft/sec) for 65% Recycle, No
OFG, 0.5 PG Swirl ............................................................................................... 111 Figure 4.3.13 – Burnout of 69µ Particles for 65% Recycle, No OFG, 0.0 PG Swirl..... 112 Figure 4.3.14 – Burnout of 169µ Particles for 65% Recycle, No OFG, 0 PG Swirl...... 113 Figure 4.3.15 – Gas Velocity for 65% Recycle, 20% OFG, 0.0 PG Swirl .................... 114 Figure 4.3.16 – Gas Temperature for 65% Recycle, 20% OFG, 0.0 PG Swirl ............ 115 Figure 4.3.17 – O2 Mole Fraction for 65% Recycle, 20% OFG, 0.0PG Swirl .............. 116 Figure 4.3.18 – Burnout of 69µ Particles for 65% Recycle, 20% OFG, 0 PG Swirl ..... 117 Figure 4.3.19 – Burnout of 169µ Particles for 65% Recycle, 20% OFG, 0 PG Swirl ... 118 Figure 4.3.20 – Gas Velocity for 65% Recycle, 20% OFG, 0.5 PG Swirl .................... 119 Figure 4.3.21 – Gas Temperature for 65% Recycle, 20% OFG, 0.5 PG Swirl ............ 120 Figure 4.3.22 – O2 Mole Fraction for 65% Recycle, 20% OFG, 0.5 PG Swirl ............. 121 Figure 4.3.23 – Burnout of 69µ Particles for 65% Recycle, 20% OFG, 0.5 PG Swirl .. 122 Figure 4.3.24 – Burnout of 169µ Particles for 65% Recycle, 20% OFG, 0.5 PG Swirl 123 Figure 4.3.25 – Gas Velocity for 56% Recycle, 0% OFG, 0.0 PG Swirl ...................... 124 Figure 4.3.26 – Gas Temperature for 56% Recycle, 0% OFG, 0.0 PG Swirl .............. 125 Figure 4.3.27 – O2 Mole Fraction for 56% Recycle, 0% OFG, 0.0 PG Swirl ............... 126 Figure 4.3.28 – Burnout of 69µ Particles for 56% Recycle, 0% OFG, 0 PG Swirl ....... 127 Figure 4.3.29 – Burnout of 169µ Particles for 56% Recycle, 0% OFG, 0 PG Swirl ..... 128 Figure 4.3.30 – Gas Velocity for 56% Recycle, 0% OFG, 0.5 PG Swirl ...................... 129 Figure 4.3.31 – Gas Temperature for 56% Recycle, 0% OFG, 0.5 PG Swirl .............. 130 Figure 4.3.32 – O2 Mole Fraction for 56% Recycle, 0% OFG, 0.5 PG Swirl ............... 131 Figure 4.3.33 – Burnout of 69µ Particles for 56% Recycle, 0% OFG, 0.5 PG Swirl .... 132 Figure 4.3.34 – Burnout of 169µ Particles for 56% Recycle, 0% OFG, 0.5 PG Swirl .. 133 Figure 4.3.35 – Gas Velocity for 56% Recycle, 20% OFG, 0. PG Swirl ...................... 134 Figure 4.3.36 – Gas Temperature for 56% Recycle, 20% OFG, 0. PG Swirl .............. 135 Figure 4.3.37 – O2 Mole Fraction for 56% Recycle, 20% OFG, 0. PG Swirl ............... 136 Figure 4.3.38 – Burnout of 69µ Particles for 56% Recycle, 20% OFG, 0. PG Swirl .... 137 Figure 4.3.39 – Burnout of 169µ Particles for 56% Recycle, 20% OFG, 0. PG Swirl .. 138 Figure 4.3.40 – Gas Velocity for 56% Recycle, 20% OFG, 0.5 PG Swirl .................... 139 Figure 4.3.41 – Gas Temperature for 56% Recycle, 20% OFG, 0.5 PG Swirl ............ 140 Figure 4.3.42 – O2 Mole Fraction for 56% Recycle, 20% OFG, 0.5 PG Swirl ............. 141 Figure 4.3.43 – Burnout of 69µ Particles for 56% Recycle, 20% OFG, 0.5 PG Swirl .. 142 Figure 4.3.44 – Burnout of 169µ Particles for 56% Recycle, 20% OFG, 0.5 PG Swirl 143
9
Figure 4.4.1– Computational Model of Air-Fired Furnace (with right side wall removed)............................................................................................................................. 152
Figure 4.4.2 – Computational Model of Oxygen-Fired Furnace Without OFG............. 153 Figure 4.4.3 – Computational Model of Oxygen-Fired Furnace With OFG.................. 154 Figure 4.4.4 – Air-Fired Boiler Design ......................................................................... 157 Figure 4.4.5 – Gas Velocity for Air-Fired Case............................................................ 159 Figure 4.4.6 – Gas Temperature for Air-Fired Case.................................................... 160 Figure 4.4.7 – O2 Mole Fraction for Air-Fired Case ..................................................... 161 Figure 4.4.8 – Wall Heat Flux for Air-Fired Case......................................................... 162 Figure 4.4.9 – Wall Temperature for Air-Fired Case.................................................... 163 Figure 4.4.10 – Wall CO for Air-Fired Case................................................................. 164 Figure 4.4.11 – Char Mass Fraction (72 microns) for Air-Fired Case.......................... 165 Figure 4.4.12 – Char Mass Fraction (176 microns) for Air-Fired Case........................ 166 Figure 4.4.13 – Outlet NOx Versus OFA Flow Rate for Air-Fired Furnace .................. 167 Figure 4.4.14 – Coal Burnout Versus OFA Flow Rate for Air-Fired Furnace............... 167 Figure 4.4.15 – Air-Fired and Oxygen-Fired Boiler Outlines........................................ 168 Figure 4.4.16 – Oxygen-Fired Boiler Design ............................................................... 169 Figure 4.4.17 – Gas Velocity for O2-Fired Case Without OFG .................................... 170 Figure 4.4.18 – Gas Temperature for O2-Fired Case Without OFG ............................ 171 Figure 4.4.19 – O2 Mole Fraction for O2-Fired Case Without OFG.............................. 172 Figure 4.4.20 – Wall Heat Flux for O2-Fired Case Without OFG ................................. 173 Figure 4.4.21 – Wall Temperature for O2-Fired Case Without OFG............................ 174 Figure 4.4.22 – Wall CO for O2-Fired Case Without OFG ........................................... 175 Figure 4.4.23 – Char Mass Fraction (69 micron) for O2-Fired Case, No OFG............. 176 Figure 4.4.24 – Char Mass Fraction (169 micron) for O2-Fired Case, No OFG........... 177 Figure 4.4.25 – Char Mass Fraction (169 micron) for O2-Fired Case, No OFG, Without
Primary gas Swirl ................................................................................................. 178 Figure 4.4.26 – Gas Velocity for O2-Fired Case With 20% OFG ................................. 179 Figure 4.4.27 – Gas Temperature for O2-Fired Case With 20% OFG ......................... 180 Figure 4.4.28 – O2 Mole Fraction for O2-Fired Case With 20% OFG .......................... 181 Figure 4.4.29 – Wall Heat Flux for O2-Fired Case With 20% OFG.............................. 182 Figure 4.4.30 – Wall Temperature for O2-Fired Case With 20% OFG......................... 183 Figure 4.4.31 – Wall CO for O2-Fired Case With 20% OFG........................................ 184 Figure 4.4.32 – Char Mass Fraction (69 micron) for O2-Fired Case, 20% OFG .......... 185 Figure 4.4.33 – Char Mass Fraction (169 micron) for O2-Fired Case, 20% OFG ........ 186 Figure 4.4.34 – Char Mass Fraction (169 micron) for O2-Fired Case, 20% OFG, Without
Primary gas Swirl ................................................................................................. 187 Figure 4.5.1- Comparison of Levelized Cost of Electricity Among Alternative
Technologies (O2 PC with 65% CF) ..................................................................... 203 Figure 4.5.2 - Comparison of Mitigation Costs Among Alternative Technologies (O2 PC
with 65% CF)........................................................................................................ 203 Figure 4.5.3 - Comparison of Levelized Cost of Electricity Among Alternative
Technologies (O2 PC with 85% CF) ..................................................................... 204 Figure 4.5.4 - Comparison of Mitigation Costs Among Alternative Technologies (O2 PC
with 85% CF)........................................................................................................ 204
10

1.0 Introduction The carbon dioxide (CO2) content of the earth’s atmosphere has increased by approximately 35 per cent since the early 1800s [1]. In the last 50 years, however, the rate of accumulation of CO2 has increased relatively rapidly going from about 310 ppmv in 1950 to about 370 ppmv in 2000. Since CO2 is a greenhouse gas, there is increasing concern that its accumulation in the atmosphere will adversely impact the world’s climate/weather patterns. Desiring that actions be taken, representatives from more than 160 countries met in Kyoto Japan in December 1997 and established goals for reducing greenhouse gas emissions. Coal is presently the world’s primary fuel for generating electrical power. In 2001 coal generated approximately 39 per cent of the world’s electricity compared with 18 and 8 per cent for natural gas and oil, respectively [2]. Compared with natural gas and oil, coal also represents the world’s largest reserve of energy and those reserves are more widely distributed throughout the world. Unfortunately coal is also the more carbon intensive fuel releasing roughly 70 and 30 per cent more CO2 per unit of heat release than natural gas and oil respectively. In the United States (U.S.) coal generates more than half of the nation’s electric power (approximately 55 per cent in 2002 [3]); it is much less expensive than oil or natural gas and domestic reserves are large enough to meet the nation’s energy needs for the next 300 years. Because of its relatively low cost and strategic security, coal is expected to continue to be a major source of future U.S. electric power generation; it is estimated that it will also generate approximately 55 per cent of the nation’s power in 2025 [3]. To address growing CO2 greenhouse gas concerns several states have passed legislation requiring their electric utilities to reduce CO2 emissions; New Hampshire is requiring generators to reduce their CO2 emissions to 1990 values by 2010, Massachusetts is requiring their six largest generators to reduce CO2 emission rates to 1,800 lbs/MWh by 2006, etc. [4]. As a result advanced concepts are being proposed and studies undertaken to determine the performance and economic impacts of capturing power plant CO2 emissions for sequestration/storage. The captured CO2 could be transported by pipeline to a variety of sites for alternative uses some of which are:
1.) Injection into depleted oil fields for enhanced oil recovery (EOR) 2.) Injection into old coal mines to release/produce methane 3.) Injection into underground geologic formations and aquifers for storage 4.) Injection into the ocean for storage
Since coal-fired power plants are large point source emitters of CO2, their centralized location and “economy of scale” make them a focal point for controlling CO2 emissions. There are numerous, commercially proven processes for removing CO2 from gas streams. Some are best suited for streams containing relatively low CO2 concentrations whereas others require high CO2 partial pressures (>75 psig). The stack gas that exhausts from coal-fired power plants is typically at atmospheric pressure, has a temperature of less than 300°F, and contains approximately 15 per cent CO2 on a dry
11
volume basis. The low concentration of CO2 in the flue gas is best suited for chemical absorption. The chemical absorption process occurs in a conventional packed bed tower wherein the gas, after being cooled to approximately 100°F, is admitted at the bottom, flows vertically up to the exit at the top, while it is contacted/scrubbed by a counter flowing liquid solvent such as monoethanolamine (MEA). The solvent chemically reacts (chemical absorption) with the CO2 and, after exiting the absorption tower, is fed to the stripping tower, and heated with steam to approximately 250°F to drive off the CO2 (steam stripping); the steam stripped or regenerated solvent is then, after cooling, recirculated back to the absorption tower for CO2 capture. The released CO2 is cooled, dried, and compressed to about 1200 psig or higher for pipeline transport. Unfortunately the energy required to break the CO2-solvent chemical bond and to strip out the CO2 is large (typically 2,000 Btu/lbCO2). As a result a large amount of steam must be extracted from the steam turbine to the stripping tower thereby causing a significant loss in steam turbine power output. In addition the flue gas contains impurities, i.e. SOx, NOx, O2, hydrocarbons, etc. that can dissolve in the solvent and cause a reduction in the solvent absorption capability, lead to operating difficulties (corrosion, deposits, etc.), and require the addition of “inhibitors”, cleaning steps, and continuous feed of fresh solvent. Although this “back end” or post combustion CO2 removal approach requires no modifications to the boiler, it requires the addition of adsorption-regeneration system with large vessels and imposes harsh performance and economic penalties. Aside from compression to pipeline pressure, the bulk of the penalties associated with CO2 sequestration are due to selectively removing CO2 from the nitrogen rich flue gas and releasing it by steam stripping. As an alternative, Foster Wheeler (FW) has proposed that the coal be burned with oxygen rather than air. With air nitrogen eliminated, a CO2 rich flue gas is generated that does not require CO2 capture and stripping. Instead, the flue gas can be fed directly to the CO2 processing unit for cooling/water condensation, drying, and compression. Elimination of air nitrogen from the coal combustion zone can result in excessively high flame temperatures that can be detrimental to a conventional boiler. To limit flame temperatures and thereby enable commercial boiler design practices to be used, a portion of the CO2 rich flue gas is recirculated back to the boiler yielding an O2/CO2 combustion medium. It is anticipated that the oxygen required by the O2/CO2 combustion process would be supplied by a conventional cryogenic air separation unit (ASU). Although ASU system costs and power requirements are significant, they are expected to be less than those associated with chemical absorption and stripping. Under DOE Contract Number, DE-FC26-03NT41736, FW is:
1.) Preparing a conceptual design of a pulverized coal (PC) fired O2 boiler 2.) Determining the performance and economics of the O2 power plant 3.) Evaluating the commercial viability of the plant by comparison to similar sized
plants incorporating other CO2 sequestration technologies
12

As part of the above, FW has conducted a review of published literature to locate data that is relevant to the conceptual design of the O2-fired PC power plant. Included in this review is identification of the performance and economics of plants incorporating other CO2 sequestering technologies. The system design and analysis task, which was performed using the Aspen Plus computer program, is aimed at optimizing the PC boiler plant operating parameters to minimize the overall power plant heat rate. The flow rates and other properties of individual streams of the power plant were calculated as the results of the Aspen Plus simulations. The required performance characteristics of such operating components as pulverized coal-fired furnace, heat recovery area, flue gas recuperator, and economizer were determined. Two plant configurations were simulated: 1) a conventional air-fired PC power plant and 2) the proposed oxygen-based PC plant. In order to compare the performance of the oxygen-based plant with that of the conventional plant, the power output of the steam turbine in both plants was kept constant. The low NOx burner design and analysis, which was performed using the Fluent CFD computer program, is aimed at optimizing the burner design to ensure stable ignition, to provide safe operation, and to minimize pollutant formation. Design conditions were based on the results of the system analysis and design task. Four burner designs were developed: 1) with no OFG and 65% flue gas recycle, 2) with 20% OFG and 65% flue gas recycle, 3) with no OFG and 56% flue gas recycle, and 4) with 20% OFG and 56% flue gas recycle. The furnace and heat recovery area design and analysis task, which was performed using the FW-FIRE and HEATEX computer programs, is aimed at optimizing the location and design of the furnace, burners, over-fire gas ports, and internal radiant surfaces. Design conditions were based on the results of the system analysis and design task. Burner design was based on the burner design task. Two furnace and HRA designs were developed: 1) a conventional air-fired PC power plant and 2) the proposed oxygen-based PC plant. The economic analysis is based on the results of the system analysis and design task and the furnace design and analysis task. The basis of the economic analysis is a conventional air-fired power plant that Foster Wheeler is currently designing and constructing.
13

2.0 Executive Summary Coal is presently the primary fuel for generating electrical power in the U.S. and the world. Even though coal is relatively inexpensive and abundant in the U.S. there is growing concern over its continued use. Compared with oil and natural gas, coal is carbon intensive, releasing roughly 70 and 30 per cent more CO2 per unit of heat release. Since CO2 is a greenhouse gas, there is increasing concern that its accumulation in the atmosphere will adversely impact the world’s climate/weather patterns. Coal-fired power plants are large point source emitters of CO2 and studies have been conducted to determine the impact of capturing their CO2 for pipeline transport to a sequestration/storage site. Although there are numerous processes available for removing CO2 from gas streams, the large gas volumes and dilute CO2 concentrations involved are best suited for a liquid-gas scrubbing process. In this process the gas is scrubbed with a liquid solvent designed to remove a specific gaseous component. Some solvents are best suited for streams containing relatively low CO2 concentrations (chemical absorption) whereas others (physical absorption) require high CO2 partial pressures (>75 psig). Since power plant flue gas CO2 concentrations are relatively low, a chemical absorption type solvent is best suited for this application. After being cooled to about 100°F, the flue gas enters the bottom of a conventional packed bed tower, flows vertically up to exit from the top, while it is contacted by a counter flowing liquid solvent such as monoethanolamine (MEA). The solvent chemically reacts with/absorbs the CO2 in the absorption tower, and, after exiting, the solvent is fed to stripping tower, and heated with steam to approximately 250°F; this heating releases the CO2 (steam stripping) and allows the regenerated solvent to be returned, after cooling, to the absorber tower for CO2 capture. The CO2 released from the solvent is cooled, dried, and compressed for pipeline transport. Unfortunately the energy required to break the CO2-solvent chemical bond and to strip out the CO2 is large (typically 2,000 Btu/lbCO2). As a result a large amount of steam must be extracted from the steam turbine to the stripping tower thereby causing a significant loss in steam turbine power output. In addition, the flue gas contains impurities, i.e. SOx, NOx, O2, hydrocarbons, etc. that can dissolve in the solvent and cause a reduction in the solvent absorption capability, lead to operating difficulties (corrosion, deposits, etc.), and require the addition of “inhibitors”, cleaning steps, and continuous feed of fresh solvent. Although this “back end” or post combustion CO2 removal approach requires no modifications to the boiler, it requires the addition of large vessels and imposes harsh performance and economic penalties; CO2 capture by chemical absorption, excluding CO2 cooling, drying, and compression to pipeline pressure, has been estimated to decrease the plant efficiency by approximately 8 percentage points and increase the cost of electricity by 59 per cent [9]. As an alternative to post combustion scrubbing, FW has proposed that the combustion process be accomplished with oxygen rather than air. With air nitrogen eliminated, a
14
CO2-water vapor rich flue gas will be generated. After partial removal of the water vapor, a portion of the flue gas is recirculated back to the boiler to control the combustion temperature and the balance of the CO2 is processed for pipeline transport. This proposed oxygen-carbon dioxide (O2/CO2) combustion process eliminates the need for the CO2 removal/separation process and, despite the expense and power consumption of cryogenic air separation, reduces the cost of CO2 capture. Excluding CO2 cooling, drying, and compression to pipeline pressure, the O2/CO2 process increases the cost of electricity of a PC plant by 27 per cent but yields a value that is 20 per cent less than that of a plant incorporating amine scrubbing [9]. Under DOE Contract No DE-FC26-03NT41736, FW is developing a conceptual design of an O2 fired boiler to determine overall plant performance and economics. In support of this effort a literature search was undertaken to locate any data/information relevant to this effort. This search has revealed that:
1.) Pilot scale O2/CO2 combustion tests have been conducted by two different investigators/teams. One used eastern bituminous coal in a 0.2 MWt test unit whereas the other used subbituminous coal in a 1.5 MWt unit. Both test programs showed that by the use of O2 with flue gas/CO2 recirculation:
a. Flame temperatures can be kept within safe limits. b. Flue gas can be produced with a 90 to 95 per cent CO2 content. c. Air-fired boiler temperature profiles and flow patterns can be maintained. d. Flame stability and combustion efficiency can be enhanced. e. NOx emissions can be reduced significantly.
2.) Several studies have been conducted on pulverized coal-fired plants to
determine the performance and economic impact of capturing 90 per cent of their CO2 for pipeline transport to a sequestration site. An International Energy Agency (IEA) study analyzed several different technologies for this separation/providing a CO2 rich gas for pipeline transport and found the two most cost effective approaches to be: a) scrubbing post combustion flue gas with an amine solvent and b) using O2 combustion. For a new plant, scrubbing with Monoethanolamine (MEA) to supply an uncompressed, concentrated CO2 stream can reduce the plant efficiency by 8 to 11 percentage points and increase its cost of electricity by about 50 to 60 per cent. O2 combustion, in contrast, has a smaller effect in that it is projected to reduce the plant efficiency by 6 to 7 percentage points and increase its cost of electricity by 27 to 58 per cent. Furthermore, for application to an existing plant, O2 combustion retrofit also offers a lower loss in plant efficiency.
Based on the published literature it is possible to design a pulverized coal burner to operate with an oxygen-carbon dioxide gas mixture rather than air; a properly designed O2/CO2 burner can yield flame temperatures and thermal profiles similar to those of an air–fired boiler while also providing improved flame stability, increased combustion efficiency, and reduced NOx emissions. Plant conceptual designs and cost estimates,
15
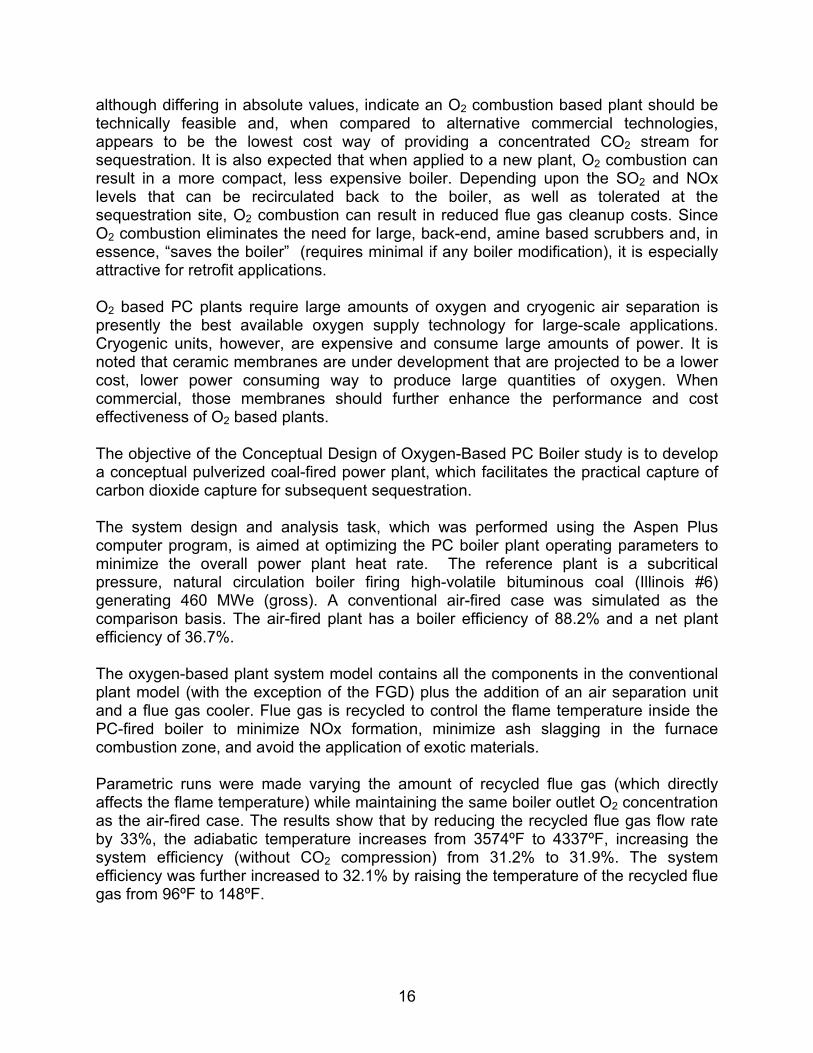
although differing in absolute values, indicate an O2 combustion based plant should be technically feasible and, when compared to alternative commercial technologies, appears to be the lowest cost way of providing a concentrated CO2 stream for sequestration. It is also expected that when applied to a new plant, O2 combustion can result in a more compact, less expensive boiler. Depending upon the SO2 and NOx levels that can be recirculated back to the boiler, as well as tolerated at the sequestration site, O2 combustion can result in reduced flue gas cleanup costs. Since O2 combustion eliminates the need for large, back-end, amine based scrubbers and, in essence, “saves the boiler” (requires minimal if any boiler modification), it is especially attractive for retrofit applications. O2 based PC plants require large amounts of oxygen and cryogenic air separation is presently the best available oxygen supply technology for large-scale applications. Cryogenic units, however, are expensive and consume large amounts of power. It is noted that ceramic membranes are under development that are projected to be a lower cost, lower power consuming way to produce large quantities of oxygen. When commercial, those membranes should further enhance the performance and cost effectiveness of O2 based plants. The objective of the Conceptual Design of Oxygen-Based PC Boiler study is to develop a conceptual pulverized coal-fired power plant, which facilitates the practical capture of carbon dioxide capture for subsequent sequestration. The system design and analysis task, which was performed using the Aspen Plus computer program, is aimed at optimizing the PC boiler plant operating parameters to minimize the overall power plant heat rate. The reference plant is a subcritical pressure, natural circulation boiler firing high-volatile bituminous coal (Illinois #6) generating 460 MWe (gross). A conventional air-fired case was simulated as the comparison basis. The air-fired plant has a boiler efficiency of 88.2% and a net plant efficiency of 36.7%. The oxygen-based plant system model contains all the components in the conventional plant model (with the exception of the FGD) plus the addition of an air separation unit and a flue gas cooler. Flue gas is recycled to control the flame temperature inside the PC-fired boiler to minimize NOx formation, minimize ash slagging in the furnace combustion zone, and avoid the application of exotic materials. Parametric runs were made varying the amount of recycled flue gas (which directly affects the flame temperature) while maintaining the same boiler outlet O2 concentration as the air-fired case. The results show that by reducing the recycled flue gas flow rate by 33%, the adiabatic temperature increases from 3574ºF to 4337ºF, increasing the system efficiency (without CO2 compression) from 31.2% to 31.9%. The system efficiency was further increased to 32.1% by raising the temperature of the recycled flue gas from 96ºF to 148ºF.
16

Equipment to compress and liquefy the CO2 effluent to 2000 psia and to reduce the moisture to 50 ppm (to avoid transport pipe corrosion) was added to the system model. This equipment reduces the system efficiency of the 3574ºF adiabatic temperature case from 31.2% to 27.9%. Recycling the residual O2 before CO2 compression increases the system efficiency with CO2 compression to 28.3%. For the high temperature case (3574ºF) recycling of the purge gases results in a system efficiency of 29.5%. A further enhancement of this high adiabatic temperature case was simulated by adding a flue gas feedwater heater prior to CO2 separation and a turbine expander to recover power from the recycled purge gas pressure reduction. The addition of this equipment raised the system efficiency to 29.8% with a conservative 1% unburned carbon loss and an efficiency of 30.1% with negligible unburned carbon loss. To further reduce the required furnace surface area while increase the net cycle efficiency the flue gas recycle flow rate was reduced from 65% to 56% raising the net cycle efficiency to 30.6%. Calculations were made using the computer program, EMISS, to determine the furnace waterwall temperature and required material and tube wall thickness for the various cases run. For the air-fired reference case, the waterwalls are carbon steel with a 0.285” wall thickness. For the maximum temperature O2-fired case, the maximum wall temperature is 961ºF for which 0.24” thick T91 material is required. Furthermore, due to the greater temperature and greater concentrations of radiating gas species (H2O and CO2), the required waterwall surface area is only 65% of the air-fired reference case. The efficiency of carbon sequestration in oxygen-firing boilers even can rival competing gasification plants. The power consumption of CO2 removal for O2-fired PC plants is about one-third of natural gas combined cycles, about one-half of post CO2 removal PCs and slightly less than integrated gasification combined cycles. The reduction in power plant efficiency of CO2 removal for O2-fired PC plants is nearly half of either natural gas combined cycles or post CO2 removal PCs and nearly the same as integrated gasification combined cycles. The oxygen-based PC boiler incorporates cryogenic O2 separation, which can produce very pure oxygen; but it requires substantial capital and operating costs. Membrane separation of O2 has been demonstrated at small scale employing very thin membrane fibers, which preferentially allow O2 to permeate, but not N2. Although the purity of O2 from membranes may not be as high as in the cryogenic separation, lower purity oxygen may be sufficient for the oxygen-based PC boiler power cycle. Membrane separation has the potential to use less power at a lower capital cost. The low NOx burner design and analysis, which was performed using the 3-D Fluent computer program, is aimed at optimizing the burner design to ensure stable ignition, to provide safe operation, and to minimize pollutant formation. Four burner designs were developed: 1) with no OFG and 65% flue gas recycle, 2) with 20% OFG and 65% flue gas recycle, 3) with no OFG and 56% flue gas recycle, and 4) with 20% OFG and 56% flue gas recycle. Boundary conditions are based on ASPEN simulations of the power plant. A 3-D Fluent simulation was made of a single wall-fired
17

burner and horizontal portion of the furnace from the wall to the center. Burner geometry is based upon FW low NOx burner experience adapted for O2 firing. Without primary gas swirl, coal burnout was relatively small, due to the low oxygen content of the primary gas. Consequently, the burners were modified to include primary gas swirl to bring the coal particles in contact with the secondary gas. An optimal primary gas swirl was chosen to achieve sufficient burnout (>70% by the center of the furnace), but not to produce substantial NOx. The wall-fired burner design conditions selected were as follows:
1. 100 ft/sec primary gas exit axial velocity with a tangential swirl ratio of 0.5. 2. 60-70 ft/sec inner secondary gas exit velocity for combustion air staging to
minimize NOx formation.
3. 120-135 ft/sec outer secondary gas exit axial velocity with a tangential swirl ratio of 1.0 to induce hot flue gas recirculation to the flame ignition point.
The furnace and heat recovery area design and analysis task, which was performed using the FW-FIRE and HEATEX computer programs, is aimed at optimizing the location and design of the furnace, burners, over-fire gas ports, and internal radiant surfaces. A simulation was made for both the reference air-fired case and for the oxygen-fired case. Two oxygen-fired models were constructed: one with no OFA ports and the second with OFA ports. Boundary conditions are based on ASPEN simulations of the power plant. The furnace is designed with opposed wall-firing burners and over-fire ports located at one burner pitch above the top burner row. Water is circulated in the furnace by natural circulation to the waterwalls at the periphery and divisional wall panels within the furnace. For the air-fired furnace simulation, the maximum flue gas temperature is approximately 3300oF. The maximum heat flux is approximately 70,000 Btu/hr-ft2 and is located on the side wall at the top of the burner zone. The total heat absorbed by the furnace walls before the furnace exit is 1880 MM Btu/hr. The maximum temperature of the waterwalls is approximately 800oF and of the division walls is approximately 875oF. Total burnout of all particle sizes is 99.7%. Average NOx concentration at the furnace outlet is 227 ppmvw (0.34 lb/MMBtu). Compared to the air-fired furnace, the oxygen furnace requires only 65% of the surface area and 45% of the volume. Two oxygen-fired designs were simulated: 1) without over-fire air and 2) with 20% over-fire air. The mixed primary/secondary gas O2 content (before combustion) is 42%.
18

In the oxygen-fired furnace, the maximum flue gas temperature is approximately 3900oF for 0% OFG and 3750oF for 20% OFG. The maximum heat flux is 175,000 Btu/hr-ft2 (top of the burner zone on the side wall) for 0% OFG and 165,000 Btu/hr-ft2 (above the over-fire ports on the side wall) for 20% OFG. The maximum wall heat flux in the oxygen-fired furnace is more than double that of the air-fired furnace due to the higher flame temperature and higher H2O and CO2 concentrations. The total heat absorbed by the furnace walls before the furnace exit is approximately 2200 MM Btu/hr. The coal burnout for the oxygen-fired case is 100% due to the high furnace temperature and high concentration of O2. NOx concentration at the furnace outlet is 333 ppmvw for the 0% OFG case and 257 ppmvw for the 20% OFG case. Although the average NOx concentration at the furnace outlet is similar on a volume basis for both air-fired and O2-fired PC, it is substantially less on a mass basis for the O2-fired PC due to the substantially lower volumetric flue gas flow rate of the O2-fired PC. The maximum temperature of the oxygen-fired furnace waterwalls is approximately 935oF and of the division walls is approximately 945oF. Because of the higher temperature of the oxygen-fired case compared to the air-fired case, furnace water wall material was upgraded from carbon steel to T91. HEATEX was used to determine the heat recovery area (HRA) design of the convective tube banks between the furnace exit and the SCR/air heater. These tube banks include the finishing superheater, finishing reheater, primary superheater, primary reheater, upper economizer, and lower economizer. For the air-fired design, total surface area of all convective banks is 294,111 ft2. The total heat transferred to the water/steam is 1354 MM Btu/hr as 3.88 MM lb/hr of flue gas is cooled from 2135ºF to 720ºF. For the oxygen-fired design, total surface area of all convective banks is 215,700 ft2. The total heat transferred to the water/steam is 1096 MM Btu/hr as 2.20 MM lb/hr of flue gas is cooled from 2350ºF to 650ºF. The total heat transfer surface required in the oxygen-fired HRA is 25% less than the air-fired HRA due to more heat being absorbed in the oxygen-fired furnace, the greater molecular weight of the oxygen-fired flue gas, and lower flue gas mass flow rate in the HRA. The HRA tube materials and wall thickness are practically the same for the air-fired and oxygen-fired design since the flue gas and water/steam temperature profiles encountered by the heat transfer banks are very similar. The objective of the economic analysis is to prepare a budgetary estimate of capital and operating costs of the O2-fired PC power plant as well as for the equivalent conventional PC-fired power plant.
19

The reference plant is a subcritical pressure, natural circulation boiler firing high-volatile bituminous coal generating 450 MWe. A conventional air-fired case was simulated as the comparison basis. The economic analysis was performed based on the EPRI Technical Assessment Guide (TAG) methodology. Plant capital costs were compiled under the Code of Accounts developed by EPRI. The estimate basis is 2004 dollars, 20-year life, and 85% capacity factor. The major changes to the reference plant were boiler redesign, SCR system removal, FGD removal, ASU addition, and CO2 compression addition. The estimated cost of the reference plant is $585,000,000 (1300 $/kW) and of the O2-fired plant is $668,673,700 (2106 $/kW). A substantial part of this cost increase is caused by CO2 compression equipment, which must be included for any CO2 removal systems. Note that he energy stored in the compressed CO2 fluid is a net loss of energy to the power plant, which is about 8% of gross power, or 3.0 points in efficiency percentage. The levelized cost of electricity (COE) was calculated for both the reference plant and the O2-fired plant. The COE value is made up of contributions from the capital cost, operating and maintenance costs, consumables, and fuel costs. The levelized COE was calculated to be 4.61 ¢/kWh for the reference plant and 6.41¢/kWh for the O2 PC plant. The CO2 mitigation cost (MC) of the O2-PC plant was calculated at 21.4 $/tonne. Compared to the COE of the O2 PC, the COE for the other technologies is 45% higher for Air PC, 40% higher for NGCC, and 6% higher for IGCC. Compared to the MC of the O2 PC, the MC for the other technologies is 250% higher for NGCC, 160% higher for Air PC, and 17% higher for IGCC.
20

3.0 Experimental This work performed for this report was performed utilizing computer program simulations. No experimental equipment was used.
21
4.0 Results and Discussion
4.1 Literature Review A review was conducted of published literature to locate data/information relevant to the design and cost estimating of O2 based coal-fired power generating plants. The collected material has been divided into four sections and leads to the conclusion that O2 combustion should be feasible and should have a CO2 avoided cost that is lower than that of competing commercially available systems. The four sections are:
a.) coal combustion with air-oxygen mixtures (oxygen enhanced combustion) b.) coal combustion with pure oxygen or oxygen-CO2 mixtures c.) impact of CO2 removal on new coal-fired plant performance and economics d.) impact of CO2 removal on existing coal-fired plant performance e.) oxygen supply systems
Sections 4.1.1 to 4.1.5 identify/summarize the findings of the literature on each of the above topics.
4.1.1 Combustion With Partial Oxygen Enhancement Nitrous oxides (NOx) are nitrogen-containing compounds that react in the atmosphere to cause acid rain and smog (ground level ozone). Since acid rain and smog can damage the environment and public health, environmental regulations have been established at both the Federal and state level that limit, among other things, power plant NOx emissions. In a typical pulverized coal-fired boiler approximately 70 to 80 per cent of the NOx emitted comes from the fuel itself (from the nitrogen species contained in the volatile matter released during the heating of the fuel and from the remaining char residue that is eventually combusted). The conversion of fuel bound nitrogen (especially volatiles) to NOx involves numerous reactions and intermediate species that compete to form either NOx or nitrogen (N2). Reducing or fuel rich conditions favor the transformation of fuel bound nitrogen to N2, whereas, oxidizing or fuel lean conditions favor transformations to NOx. Numerous techniques have been developed to reduce the NOx emissions from coal-fired boilers. One of them is the use of low NOx burners that stage the introduction and mixing of the combustion air with the coal. By limiting the amount of air (primary air) that first contacts the coal, a fuel rich zone is created close to the burner. Coal exiting the burner, enters this region, undergoes devolatilization and, because of the reducing conditions, the conversion of volatile nitrogen species to N2 is favored. The balance of the combustion air can be admitted via an outer concentric annulus and the streams mix to form a downstream oxidizing zone wherein the combustion process is completed. By staging the introduction and mixing of the air and coal, the flame can be stretched out, a lower flame temperature can be achieved, and the formation of both fuel bound and
22

thermal NOx can be minimized. However, there are limits to combustion staging. If the flame temperature is too low, devolatilization may continue into the oxidizing zone and the combustion process may not go to completion, thus resulting in higher levels of NOx and higher levels of unburned carbon in the coal ash. Experience has shown that an optimized low NOx burner can reduce NOx emissions to approximately 30 to 50 per cent of the “unstaged” values. Another method of NOx reduction that is a generally less expensive than low NOx burners, is to divert air flow from the burner to an over-fire air (OFA) port above it. Typically flame stability considerations limit the burner stoichiometry to a minimum of about 0.8 resulting in an over fire arrangement which produces about a 10 to 30 per cent reduction in NOx emissions from “unstaged” values. A recent approach to improving the performance of low NOx burners is to enrich the combustion air with a small amount of oxygen. This approach, named oxygen enhanced combustion (OEC), typically introduces less than 10 per cent of the stoichiometric oxygen requirement and raises the overall combustion air oxygen level from 21 per cent to 22 to 23 per cent. By replacing a portion of the primary air with this oxygen, less nitrogen is present and the flame temperature can be increased without changing the combustion stoichiometry. The higher temperature increases the coal devolatilization rate and yield and drives transformations/reactions to produce N2 rather than NOx. With devolatilization increased, less carbon is left in the char, and unburned carbon levels are reduced. This approach can also be applied to the burners of an over fire air arrangement or even a combined low NOx burner-over fire air arrangement. Praxair Inc. has taken OEC from bench scale to commercial scale demonstrations [5]. Their first demonstration of OEC was performed in a 44 MWe wall fired boiler at City Utilities in Springfield, Missouri. The demonstration successfully reduced NOx emissions by up to 40 per cent and work proceeded to a larger scale at the 125 MWe Mt. Tom Generation Station in Holyoke, Massachusetts. The latter possesses 16 burners in a 4 by 4 wall arrangement and 6 over fire air ports are provided in a single row above the topmost row of burners. Although oxygen was injected into each of the burners, the authors do not reveal the actual amount used or the unit operating condition; they do indicate, however, that the maximum operating load was 24 per cent over the name plate rating and that the resulting higher gas temperatures and reduced gas residence times limited the potential of the demonstration. Tests were conducted with three different bituminous coals: two were Class C the other was Class A. The NOx data presented in Figure 4.1.1 and Figure 4.1.2 show that the reductions provided by OEC varied with load; the reduction was about 17 per cent at maximum load versus about 35 per cent at minimum load. With the load points not being identified, the inference is made that the minimum load test points are more representative of a normal boiler and that OEC can reduce NOx emissions to less than 0.15 lbs/MMBtu. In addition flame stability was improved and unburned carbon losses were reduced.
23
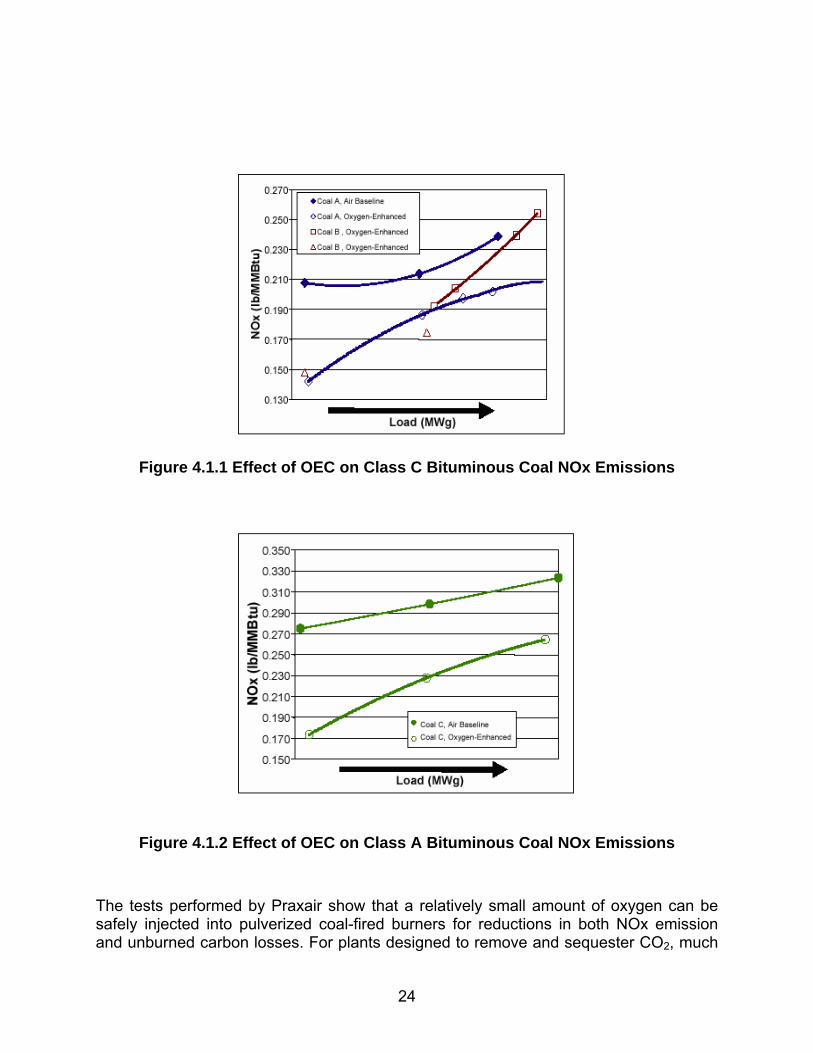
Figure 4.1.1 Effect of OEC on Class C Bituminous Coal NOx Emissions
Figure 4.1.2 Effect of OEC on Class A Bituminous Coal NOx Emissions The tests performed by Praxair show that a relatively small amount of oxygen can be safely injected into pulverized coal-fired burners for reductions in both NOx emission and unburned carbon losses. For plants designed to remove and sequester CO2, much
24
higher levels of oxygen injection are envisioned and Section 4.1.2 reports on experimental work in this area.
4.1.2 O2/CO2 Combustion The electric utility tests discussed in Section 4.1.1 indicate that the addition of small amounts of oxygen to the combustion air can improve plant performance, i.e. reduce NOx emissions, reduce unburned carbon, increase ash utilization, and may also improve economics. Further increases in oxygen injection can reach the extreme at which all air flow can be eliminated. At this condition the flue gas is virtually nitrogen-free and it can be cooled, dried, and compressed for pipeline transport to a sequestering site without the need for CO2 capture or stripping. Since the nitrogen in the combustion air absorbs heat, flame temperatures will increase causing concern that metal temperatures may reach unacceptably high levels and slagging problems may develop. Two teams of experimenters have conducted pulverized coal combustion tests using oxygen instead of air. In [6] the tests were conducted in a bench scale, down-fired, cylindrical, 145 KW furnace. The furnace roof and walls were water cooled and covered by a 50 mm thick layer of refractory that yielded a 100 mm diameter and a 2300 mm length. A total of five burner configurations were tested with Indonesian subbituminous coal pulverized to a minus 63 micron size. To protect the unit from high temperature flame impingement, testing began without any swirl; the coal and oxygen were admitted as a downward flowing mixture on the centerline. Three different configurations were tested and despite high flame temperatures, combustion efficiencies were less than expected; with Reynolds Numbers being low it was hypothesized that a CO2 layer was forming on the surface of the coal particles that was preventing oxygen from reaching the coal surface. In the fourth and fifth burner configurations a portion of the oxygen was moved to an outer annulus that surrounded the central primary stream and CO2 was added to the latter. Vanes located in the annulus imparted 60 degree and 75 degree swirl angles respectively. The authors report the fifth or strong swirl burner did not achieve a stable flame and the fourth burner with its weaker level of swirl was selected for more extensive testing over the following conditions: Coal Flow Rate, kg/h 6.7 Primary O2 Flow Rate, m3/h 3.6 Secondary O2 Flow Rate, m3/h 4.8-7.2 Diluting CO2 Flow Rate, m3/h 1.5 Figure 4.1.3 shows that a peak combustion efficiency of 99.5 per cent was achieved at an excess oxygen level of 12.5 per cent. The ratio of primary oxygen (O2-1) to secondary oxygen (O2-2) was also varied and the referenced peak efficiency was achieved at a ratio of 0.63 (see Figure 4.1.4) along with a furnace exit CO2 concentration of 90.4 per cent.
25

Figure 4.1.3 Effect of Oxygen Ratio on Burner Combustion Efficiency
Figure 4.1.4 Effect of Primary to Secondary O2 Ratio on Burner Combustion Efficiency
26

Oxygen combustion tests were also conducted at the CANMET Vertical Combustor Research Facility in an 8.3 m tall, down-fired unit possessing a 0.3 MWt maximum heat input rating [7]. The unit was refractory lined to a 600 mm diameter and, together with water-cooled panels, provided a realistic time-temperature history for burning coal particles. A single register, swirl stabilized burner developed by CANMET was located on the centerline of the unit. As shown in Figure 4.1.5 the burner possessed a centrally located natural gas-fired igniter surrounded by four concentric flow annuli. During the tests a variety of secondary gases, e.g. air, oxygen, CO2, N2, and recycled flue gas, were admitted through the swirl inducing outermost annulus. This outermost annulus enclosed the primary coal-air-oxygen stream annulus, which in turn enclosed an annulus that injected oxygen into the primary stream via radial holes. The oxygen annulus in turn enclosed a small tertiary stream that admitted air, N2, and/or O2 for the natural gas igniter and also served as a buffer that protected the burner front from excessive flame temperatures.
Figure 4.1.5 CANMET Burner Table 4.1.1 and Table 4.1.2 summarize the burner test conditions. Each test was conducted with pulverized subbituminous coal using a target value of 2 per cent excess oxygen (dry volume basis) and secondary swirl set at 8 for a calculated swirl number of approximately 1.05. Test WS-1 was conducted with air to establish a performance baseline, WS-4 added oxygen to the secondary stream to demonstrate oxygen enriched combustion, and in WS-5, 7, and 3 the air was gradually backed out and replaced with CO2 and recycled flue gas that had been cooled in a condensing heat exchanger. By using the CO2 and recycled flue gas the flame temperature was controlled (approximated the air baseline value -- see Table 4.1.3) and a CO2 rich flue gas was produced that was amenable, after moisture removal, for sequestration. As expected,
27
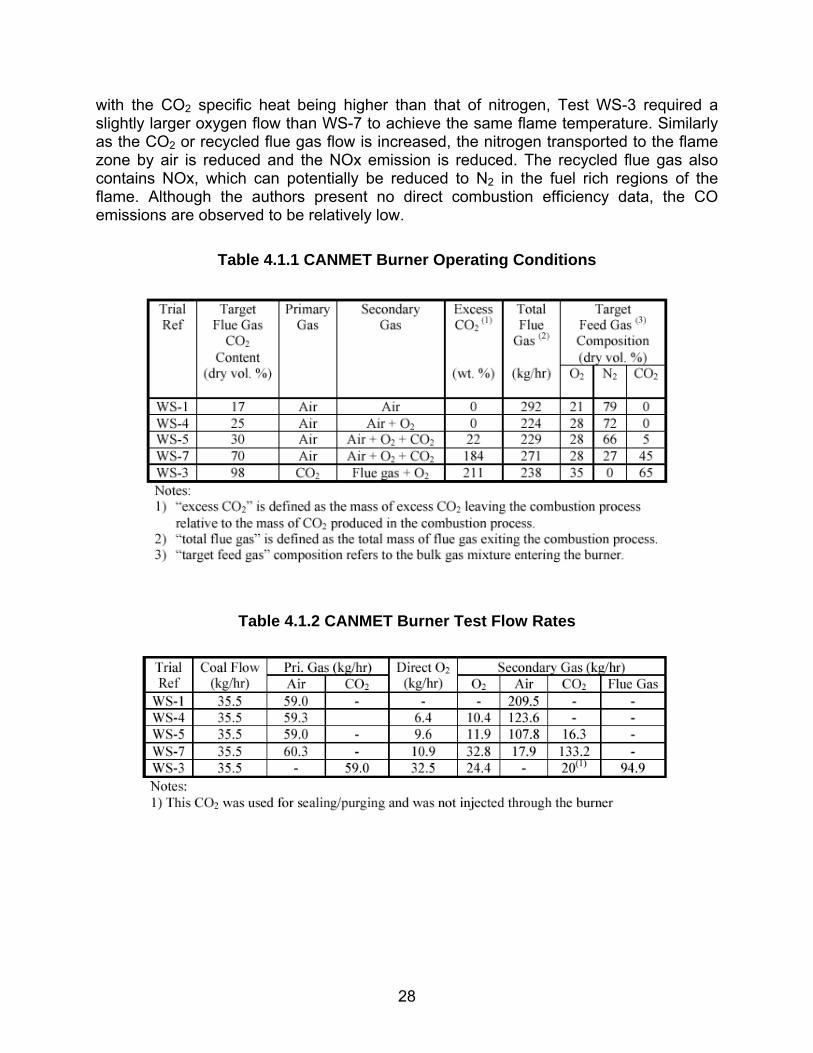
with the CO2 specific heat being higher than that of nitrogen, Test WS-3 required a slightly larger oxygen flow than WS-7 to achieve the same flame temperature. Similarly as the CO2 or recycled flue gas flow is increased, the nitrogen transported to the flame zone by air is reduced and the NOx emission is reduced. The recycled flue gas also contains NOx, which can potentially be reduced to N2 in the fuel rich regions of the flame. Although the authors present no direct combustion efficiency data, the CO emissions are observed to be relatively low.
Table 4.1.1 CANMET Burner Operating Conditions
Table 4.1.2 CANMET Burner Test Flow Rates
28

Table 4.1.3 CANMET Burner Performance
The CANMET Vertical Combustor was also tested with an eastern bituminous coal [8]. The tests were conducted at a 0.2 MWt firing rate with 5 per cent excess oxygen (5 per cent dry volume basis O2 in the flue gas). During these tests the combustion air was enriched to 28 and 35 per cent oxygen by varying amounts of oxygen and or recycled dry flue gas. Flame temperatures were measured starting from about 75 cm from the burner and, as expected, they increased (see Figure 4.1.6) when the oxygen concentration in the feed gas increased both with and without flue gas recycle. Since the specific heat of CO2 is greater than that of N2, the gas temperatures observed with dry flue gas recycle were lower than those observed with air at equivalent oxygen concentrations. NOx measurements were also taken and, as shown in Figure 4.1.7, oxygen enrichment reduced the NOx emission and values observed with dry flue gas recycle were lower than those observed without recycle at the same equivalent oxygen concentrations; the lower values were possibly caused by part of the recycled NOx reducing to N2 in the flame zone and or part of the NOx dissolving in the water condensed out of the recycled flue gas. Figure 4.1.8 shows no effect of O2 or CO2 concentration on SO2 emissions over the range tested but dry flue gas recycle yields lower values, again, possibly caused by SO2 dissolving in the water condensed out of the recycle flue gas.
29

Figure 4.1.6 Centerline Temperatures Downstream of Burner
Figure 4.1.7 Centerline NOx Emission Rates
30
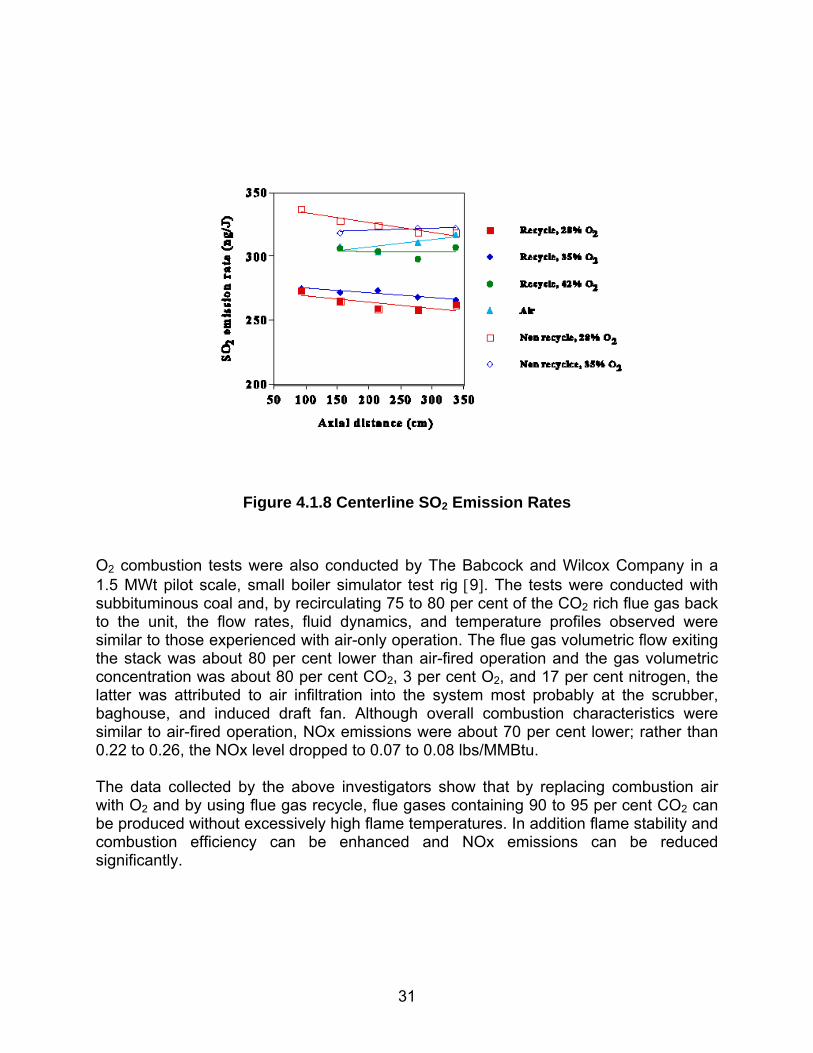
Figure 4.1.8 Centerline SO2 Emission Rates O2 combustion tests were also conducted by The Babcock and Wilcox Company in a 1.5 MWt pilot scale, small boiler simulator test rig [9]. The tests were conducted with subbituminous coal and, by recirculating 75 to 80 per cent of the CO2 rich flue gas back to the unit, the flow rates, fluid dynamics, and temperature profiles observed were similar to those experienced with air-only operation. The flue gas volumetric flow exiting the stack was about 80 per cent lower than air-fired operation and the gas volumetric concentration was about 80 per cent CO2, 3 per cent O2, and 17 per cent nitrogen, the latter was attributed to air infiltration into the system most probably at the scrubber, baghouse, and induced draft fan. Although overall combustion characteristics were similar to air-fired operation, NOx emissions were about 70 per cent lower; rather than 0.22 to 0.26, the NOx level dropped to 0.07 to 0.08 lbs/MMBtu. The data collected by the above investigators show that by replacing combustion air with O2 and by using flue gas recycle, flue gases containing 90 to 95 per cent CO2 can be produced without excessively high flame temperatures. In addition flame stability and combustion efficiency can be enhanced and NOx emissions can be reduced significantly.
31
4.1.3 Impact of CO2 Removal on New Plants
4.1.3.1 International Energy Agency Study Under the IEA Greenhouse Gas R&D Program the performance and cost impacts of incorporating CO2 removal on four different power generation options was studied. The options covered the spectrum of fossil fueled power generation and for each plant attempts were made to apply the following four different technologies to remove/separate their CO2 for eventual sequestration:
a.) absorption b.) adsorption c.) cryogenics d.) membranes
The study was conducted in two phases. In the first phase [10] a baseline plant configuration/conceptual design was established for each power generation option to identify performance, emissions, and economics, and then limited sensitivity studies were performed. In the second phase [11] the four CO2 capturing options were applied separately to each baseline plant. The studies involved the participation of four different organizations in Phase 1 (each developed one of the baseline plant designs) and seven different organizations in Phase 2. Since the objective of the studies was to provide a relative ranking of technologies, attempts were made to design the plants for the same conditions and to estimate their costs using a consistent set of criteria. The plants were assumed to be located at a coastal western European site where 59°F (15°C) sea water cooling was available. Each plant was designed for a 500 MWe net output and a 35 year operating life, and costs were determined in 1992 U.S. dollars. Although attempts were made to apply a consistent set of design and economic criteria, because so many different organizations were involved, it is suggested that results be viewed on a relative basis rather than based on absolute values. The fuels used were 0.86 per cent sulfur (as received) Australian bituminous coal or North Sea “Brent” natural gas. The four different power generation options studied, together with identification of their designer and a brief description of their base line plant, are as follows: Pulverized Coal-Fired Boiler with Wet Flue Gas Desulfurization (PC+FGD) This plant was conceptually designed by the Coal Research Establishment of British Coal Corporation. The plant utilized a conventional subcritical pressure steam cycle and a natural circulation boiler with conventional burners, an electrostatic precipitator, and wet flue gas desulfurization for 90 per cent SO2 capture.
Natural Gas-Fired Combined Cycle (NGCC) This plant was conceptually designed by the Norwegian Institute of Technology. The plant was conventional in configuration and used conventional components, i.e. two combustion turbines, two heat recovery steam generators (HRSGs), one steam turbine,
32
etc. The combustion turbines utilized pre-mix/hybrid burners to achieve a NOx level of 25 ppmv.
Integrated Gasification Combined Cycle (IGCC) This plant was conceptually designed by the Netherlands Research Foundation. The plant incorporated two high pressure Texaco gasifiers with syngas cooling, two expanders, two combustion turbines (Siemens Model V94.2), one heat recovery steam generator, one steam turbine, and two elevated pressure air separation units with their nitrogen being used for combustion turbine NOx control. Selexol cold gas cleanup, together with tail gas incineration, enabled the plant to operate with 99 per cent sulfur capture efficiency.
Oxygen Fired PC with CO2 recycle (O2 Combustion) This plant was conceptually designed by the Centre for Energy Research in Northern Ireland. The plant incorporated cryogenic air separation, a pulverized coal-fired boiler with low NOx burners, an electrostatic precipitator, and an air heater; the plant was not provided with an FGD or selective catalytic reduction (SCR) system to minimize flue gas SO2 and NOx levels. Oxygen from the air separation unit served as the boiler oxidant and produced a CO2 rich flue gas. After particulate removal and cooling, a portion of the CO2 flue gas was recycled back to the furnace for temperature control and the balance was exhausted to atmosphere. According to the authors the beneficial feature of this plant is that, compared to a normal air fired plant, the CO2 content of the flue gas is increased from 14 to 63 mole per cent (the majority of the balance is moisture) and the stack gas flow rate is reduced by approximately 67 per cent. Hence this plant is more amenable to sequestration.
Table 4.1.4 summarizes the performance, economics, and CO2 emissions of the four plants. The NGCC plant is the most efficient and, with natural gas being primarily a hydrogen-based fuel, it has the lowest CO2 emission per unit of power output—hence, the reason for interest in fuel switching. The NGCC plant, however, operates with high excess air and, as a result, it has one of the highest flue gas flow rates and the lowest CO2 volume contents (4 per cent versus 14 per cent for the PC plant, on a dry volume basis); high volume flows and low CO2 contents increase the cost of CO2 removal. The O2 PC plant, in contrast, has the lowest flue gas flow rate and, with its CO2 content already at 91 per cent on a dry volume basis, does not require a CO2 capture step. Depending upon the amount of SO2 and NOx that can be tolerated by the sequestration site and the transport pipeline, the CO2 rich flue gas may need further cleanup before it is dried and compressed to pipeline pressure.
In [11] a team of seven organizations conducted analyses to determine the impact of applying the above CO2 capturing options to each baseline plant to remove/capture 90 per cent of its CO2. Each of the processes had an associated parasitic power loss that reduced the plant output and, after integration into the plant, each plant was scaled up in size to maintain a 500 MWe net output. Table 4.1.5 shows the effects of the different
33

CO2 separation technologies on the conventional PC plant with FGD. Of the technologies shown, absorption/amine stack gas scrubbing resulted in both the lowest power cost and the lowest CO2 avoided cost. The plant efficiency, however, reduced from 40 per cent (LHV basis) to 29 per cent and the cost of power increased by approximately 50 per cent. Since amine scrubbing is commercially proven and is the technology most frequently used for large-scale applications, only the absorption results are presented in Table 4.1.6 for the other plants; for information on the alternative processes the reader is referred to [11]. In the CO2 absorption process the gas is washed with a liquid solvent whose selection depends, among other things, on the CO2 concentration level. When CO2 levels are relatively low, chemical absorption type solvents are used (CO2 chemically reacts with the solvent) and steam stripping is employed to release the CO2/regenerate the solvent. When CO2 concentrations are relatively high, physical absorption type solvents are used (CO2 dissolves in the solvent) and depressuring/flashing is employed to release the CO2/regenerate the solvent. The air based plants (PC+FGD and NGCC) used chemical absorption applied after combustion, whereas the oxygen-blown IGCC pressurized plant used physical absorption. In the O2/CO2 PC plant the CO2 removal occurred after combustion and raised the CO2 removal level to 99 per cent. For the IGCC plant its coal-derived syngas was water gas shifted and the CO2 was removed prior to combustion (the combustion turbine, in essence, became fueled with hydrogen).
Recognizing that the data presented in Table 4.1.4 through Table 4.1.6 were prepared by several different organizations and, even though attempts were made to assure a consistent set of design and economic assumptions (costing accuracy is estimated to be plus or minus 30 per cent), it is suggested the data only be used for relative comparison. It is noted the O2/CO2 PC plant with scrubbing added to it can provide up to 99 per cent CO2 removal and when designed for 91 per cent removal (no scrubbing) its cost of electricity is similar to that of a PC plant with 90 per cent CO2 removal via amine scrubbing (78 versus 74 mills/kWh).
Table 4.1.4 Performance of Nominal 500 MWe Power Generating Technologies
PC+FGD NGCC IGCC PC with O2/CO2
Plant Efficiency, % (LHV) 40 52 42 33Specific Plant Cost, $/KW 1058 702 1561 2044COE, mills/kWh 49 35 53 78CO2
kg/sec/MWh 0.23 0.11 0.21 0.28mole % wet 13 3 7mole % dry 14 4 7 91
63
34

Table 4.1.5 Effect of CO2 Capture Technologies on a Nominal 500 MWe PC Fired Plant
Plant Efficiency Power Cost CO2 Avoided Cost CO2 Emission Rate% (LHV basis) mills/kWh $/tonne g/kWh
Baseline Plant 40 49 829
Plant with CO2 Capture by:Absorption 29 74 35 116
Adsorption with PSA 28 114 84 57Adsorption with TSA 29 179 264 335
Membrane 31 83 47 194Membrane with MEA 30 81 45 222
Table 4.1.6 Effect of CO2 Absorption on Alternative Power Generating
Technologies
PC+FGD NGCC IGCC PC with O2/CO2Baseline Plant Plant Efficiency, % (LHV) 40 52 42 33 Specific Plant Cost, $/KW 1058 702 1561 2044 COE, mills/kWh 49 35 53 78 CO2
kg/sec/MWh 0.23 0.11 0.21 0.28mole % wet 13 3 7mole % dry 14 4 7
Plant with Absorption CO2 Removal CO2 Capture Efficiency, % 90 85 82 99 Plant Efficiency, % (LHV) 29 42 36 30 Specific Plant Cost, $/KW 1842 1367 2400 3102 COE, mills/kWh 74 53 63 94 CO2 Avoided Cost, $/tonne 35 55 23 16
6391
4.1.3.2 Parsons Study Parsons Energy and Chemical Group Inc. [12], working under a contract jointly funded by the Electric Power Research Institute and the U.S. DOE, determined the performance and cost impacts of applying CO2 removal via amine scrubbing on three different power generation technologies. The power plants studied were:
1.) Pulverized Coal-Fired with Wet Flue Gas Desulfurization 2.) Natural Gas Combined Cycle 3.) Integrated Coal Gasification Combined Cycle
35

In the PC and NGCC cases CO2 removal was performed after combustion at the back end of the plant where gas temperatures are a minimum. Since these cycles use air as their oxidant their flue gas CO2 concentration is relatively low and a chemical absorption type solvent (MEA) was used. In the IGCC plant oxygen is used as the oxidant and the syngas is cooled to approximately 100°F to allow acid gas removal prior to combustion. With the syngas at elevated pressure at this point and CO2 partial pressures relatively high, physical absorption was utilized. The plants were fueled with either Illinois No 6 coal costing $1.26/MMBtu or natural gas costing $2.70/MMBtu (both on HHV basis); the compositions of these fuels are given in Table 4.1.7 and Table 4.1.8. A mid-western site with a 63°F (dry bulb) and 14.4 psia ambient was assumed and each plant separated and compressed their CO2 to 1200 psig for pipeline transport to a sequestering site. The CO2 specification called for a -40°F dew point, a hydrogen limit of 1.25 per cent, and sulfur limits of 100 and 50 ppm for SO2 and H2S respectively. All plants operated with a 1 psia steam condenser back pressure and utilized mechanical draft evaporative cooling towers. The following is a brief description of the plants (more detailed information is presented in [12]):
Table 4.1.7 Illinois No 6 Coal Analysis
Per Cent by Weight (As Received)
Ultimate Analysis Moisture 11.12 Carbon 63.75 Hydrogen 4.5 Nitrogen 1.25 Chlorine 0.29 Sulfur 2.52 Ash 9.7 Oxygen (by difference) 6.88
Total 100.00
Higher Heating ValueBtu/lb 11,666MJ/kg 27.12
36

Table 4.1.8 Natural Gas Analysis
Component Per Cent by Volume CH4 90 C2H6 5 Inerts/N2 5
Total 100
Higher Heating ValueBtu/lb 21,824
Btu/SCF 1,002MJ/kg 50.75
Pulverized Coal-Fired Plant The PC plant was conventional in configuration incorporating a PC fired boiler with low NOx burners, air staging, and SCR to minimize NOx emissions. An electrostatic precipitator was provided for particulate control and a wet limestone flue gas desulfurization system controlled SO2 emissions. A regenerative feedwater heating system was utilized and two different steam pressures were investigated. The first utilized a supercritical pressure (SC) double reheat steam cycle with steam turbine conditions of 3500psig/1050°F/1050°F/1050°F. In the second case ultra super critical pressure, double reheat steam conditions of 5000 psig/1200°F/1200°F/1200°F were utilized and both cases were investigated with and without CO2 capture. For CO2 capture inhibited aqueous MEA was used for chemical absorption. Natural Gas Combined Cycle Plant Two NGCC plant configurations were investigated. The first utilized two General Electric (GE) Company 7FA combustion turbines, each with its own heat recovery steam generator (HRSG) that supplied steam to a single steam turbine, whereas, the second case utilized a single GE H Class combustion turbine with one HRSG and one steam turbine. Both cases utilized a triple pressure HRSG, an 1800 psig/1050°F/1050°F steam turbine, a 1 psia steam condenser back pressure, dry low NOx burners, and were investigated with and without CO2 capture. For CO2 capture, inhibited aqueous MEA was used for chemical absorption and only the H Class data is presented herein. Integrated Coal Gasification Combined Cycle Plant The IGCC plant utilized E-GasTM type gasification technology to produce a syngas that was cooled in a fire-tube type boiler and cleaned of particulate via a porous metal candle filter. When operated without CO2 capture, gasification occurred at approximately 500 psig and the filtered syngas underwent further cooling, water scrubbing, reheating, COS hydrolysis, cooling, removal of H2S in absorption tower using Selexol solvent, reheating, and humidification for delivery to the combustion turbine burners. When designed for CO2 capture, gasification occurred at approximately 800 psig (increases CO2 partial pressure) and the filtered syngas underwent two stages of sour gas shifting, cooling, removal of H2S in a first absorption stage tower, removal of CO2 in a second
37

absorption stage tower, reheating, humidification, and expansion to 385 psia in a turbine expander. The gas was then reheated and delivered to the combustion turbine burners. Selexol solvent was used in both absorption stages. H2S was stripped from the first stage solvent by flashing and processed by a Claus Plant with a tail gas treating unit for recovery of elemental sulfur. CO2 was stripped from the second stage solvent by flashing and was cooled, dried, and compressed to 1200 psig yielding a virtually moisture-free, supercritical pressure CO2 stream for pipeline transport. Both the F and H Class plants utilized two 50 per cent capacity, cryogenic air separation units, and three 50 per cent capacity, 65 per cent coal/35 per cent water slurry preparation/feeding systems that fed their gasifiers with oxygen and fuel. The F Class plant incorporated two 50 per cent capacity gasifier equipment trains with each delivering syngas to its dedicated combustion turbine. The H Class plant incorporated three 33 per cent capacity gasifier equipment trains that delivered their syngas to the plant’s single expander and single combustion turbine. Table 4.1.9 presents the performance, economics, and emissions of the plants operating without CO2 capture and assuming an 80 per cent plant capacity factor. The plant net power outputs ranged from 384 MWe for the NGCC to 506 MWe for the USC PC plant. With the H Class NGCC plant fueled with natural gas (essentially a hydrogen based fuel) and operating with a 53.6 per cent efficiency (HHV basis), it has the lowest total plant cost (TPC), the lowest cost of electricity (COE), and the lowest CO2 emission rate of 0.75 lbs/kWh. The IGCC and USC PC plants both have efficiencies of about 43 per cent and CO2 emissions of about 1.6 lbs/kWh, a value more than double that of the NGCC plant.
Table 4.1.9 NGCC and Illinois No 6 PC Plants Without CO2 Capture
Plant Type NGCC-H IGCC-H SC-PC USC-PCParsons Case Number 1D 3B 7C 7DFuel Nat. Gas Illinois No 6 Illinois No 6 Illinois No 6Fuel Cost, $/MMBtu (HHV) 2.7 1.26 1.26 1.26Plant Net Output, MWe 384.4 424.5 462.1 506.2Plant Efficiency, % (HHV) 53.6 43.1 40.5 42.7Total Plant Cost, $/KW* 496 1263 1143 1161COE, mills/kWh** 30.7 45.1 45.0 44.3CO2 Emission
lb/kWh 0.745 1.582 1.707 1.618kg/kWh 0.338 0.718 0.774 0.734
*Year 2000 U.S. Dollars **20 year levelized values with 80 % capacity factor
38

Table 4.1.10 shows the impact of 90 per cent CO2 removal on the H Class combustion turbine and the supercritical pressure PC plants (for the lower performing F Class plants the reader is referred to [12]). With the NGCC and PC plants using chemical absorption to remove CO2 after combustion, they experience about a 10 to 12 percentage point drop in efficiency; the IGCC plant, which removes CO2 from its shifted syngas before combustion and at about 800 psig, experiences about half the efficiency loss (6 percentage points). In summary 90 per cent CO2 removal:
a.) USC PC: decreases efficiency by 12 points and increases COE by 62 per cent to 71.6 mills/kWh
b.) IGCC H: decreases efficiency by 6 points and increases COE by 25 per cent to 56.4 mills/kWh
c.) NGCC H: decreases efficiency by 10 points and increases COE by 59 per cent to 48.8 mills/kWh
The cost of CO2 removed or the CO2 avoided cost can be calculated by a comparison of plants with and without removal; the CO2 avoided cost is defined as the difference in plant COE in mills/kWh divided by the difference in plant CO2 emissions in lbs/kWh. With NGCC plants operating at high excess air and low stack gas CO2 concentrations, Table 4.1.10 shows that the NGCC plant has the highest CO2 avoided cost of $66.9/ton versus about $48/ton for the super critical pressure PC plants. Recognizing that the NGCC plant both starts with and ends with a much lower CO2 emission rate than the coal based plants, its 90 per cent CO2 removal requirement could be relaxed and the plants compared on an equal emission rate basis. For such an analysis the reader is referred to [12]. Table 4.1.10 NGCC and Illinois No 6 PC Plants with 90 Per Cent CO2 Capture
Plant Type+ NGCC-H IGCC-H SC-PC USC-PCParsons Case Number 1B 3A 7A 7BFuel Nat. Gas Illinois No 6 Illinois No 6 Illinois No 6Fuel Cost, $/MMBtu (HHV) 2.7 1.26 1.26 1.26Plant Net Output, MWe 310.8 403.5 329.3 367.4Plant Efficiency, % (HHV) 43.3 37 28.9 31.0Total Plant Cost, $/KW* 943 1642 1981 1943COE, mills/kWh** 48.8 56.4 74.4 71.6CO2 Removal Location Post Combustion Pre-Combustion Post Combustion Post CombustionPlant CO2 Emission
lb/kWh 0.088 0.162 0.238 0.222kg/kWh 0.040 0.073 0.108 0.101
CO2 Avoided Cost, $/ton 66.9 19.3 48.6 47.5
+ All plants include CO2 processing and compression to 1200 psig pipeline pressure
39
*Year 2000 U.S. Dollars **20 year levelized value with 80% capacity factor
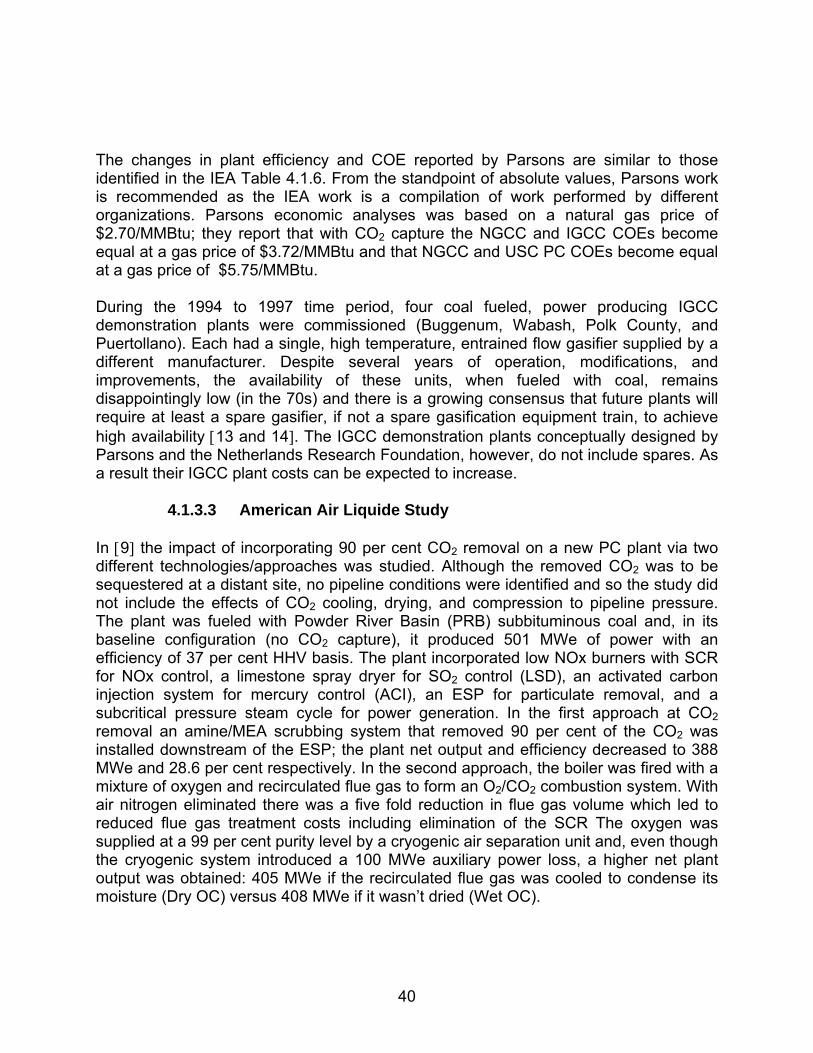
The changes in plant efficiency and COE reported by Parsons are similar to those identified in the IEA Table 4.1.6. From the standpoint of absolute values, Parsons work is recommended as the IEA work is a compilation of work performed by different organizations. Parsons economic analyses was based on a natural gas price of $2.70/MMBtu; they report that with CO2 capture the NGCC and IGCC COEs become equal at a gas price of $3.72/MMBtu and that NGCC and USC PC COEs become equal at a gas price of $5.75/MMBtu. During the 1994 to 1997 time period, four coal fueled, power producing IGCC demonstration plants were commissioned (Buggenum, Wabash, Polk County, and Puertollano). Each had a single, high temperature, entrained flow gasifier supplied by a different manufacturer. Despite several years of operation, modifications, and improvements, the availability of these units, when fueled with coal, remains disappointingly low (in the 70s) and there is a growing consensus that future plants will require at least a spare gasifier, if not a spare gasification equipment train, to achieve high availability [13 and 14]. The IGCC demonstration plants conceptually designed by Parsons and the Netherlands Research Foundation, however, do not include spares. As a result their IGCC plant costs can be expected to increase.
4.1.3.3 American Air Liquide Study In [9] the impact of incorporating 90 per cent CO2 removal on a new PC plant via two different technologies/approaches was studied. Although the removed CO2 was to be sequestered at a distant site, no pipeline conditions were identified and so the study did not include the effects of CO2 cooling, drying, and compression to pipeline pressure. The plant was fueled with Powder River Basin (PRB) subbituminous coal and, in its baseline configuration (no CO2 capture), it produced 501 MWe of power with an efficiency of 37 per cent HHV basis. The plant incorporated low NOx burners with SCR for NOx control, a limestone spray dryer for SO2 control (LSD), an activated carbon injection system for mercury control (ACI), an ESP for particulate removal, and a subcritical pressure steam cycle for power generation. In the first approach at CO2 removal an amine/MEA scrubbing system that removed 90 per cent of the CO2 was installed downstream of the ESP; the plant net output and efficiency decreased to 388 MWe and 28.6 per cent respectively. In the second approach, the boiler was fired with a mixture of oxygen and recirculated flue gas to form an O2/CO2 combustion system. With air nitrogen eliminated there was a five fold reduction in flue gas volume which led to reduced flue gas treatment costs including elimination of the SCR The oxygen was supplied at a 99 per cent purity level by a cryogenic air separation unit and, even though the cryogenic system introduced a 100 MWe auxiliary power loss, a higher net plant output was obtained: 405 MWe if the recirculated flue gas was cooled to condense its moisture (Dry OC) versus 408 MWe if it wasn’t dried (Wet OC).
40

Table 4.1.11 identifies the plant outputs and efficiencies, Figure 4.1.9 presents plant capital costs, and Figure 4.1.10 identifies the plant costs of electricity and CO2 avoided costs. In addition to imposing a smaller efficiency penalty, O2 combustion also imposes a smaller cost penalty on the plant. Compared to the baseline, the MEA absorption process increased the plant capital costs per KW of net power by 48 per cent whereas with O2 combustion the increase was only 23 per cent. From a cost of electricity standpoint, the increase from the baseline was approximately 59 per cent for amine scrubbing (10 versus 6.3 cents/kWh) versus 27 per cent for the O2 combustion plant (8 versus 6.3 cents/kWh) plus the latter’s CO2 avoided cost was less than half that of scrubbing ($20/ton versus $47/ton). Despite its large requirement for oxygen, the greatly reduced flue gas flow rate associated with O2 combustion allows for a more compact, less expensive boiler design and reduced flue gas cleanup costs; all of these make O2 combustion a more cost effective technology for CO2 removal and, should emerging technologies reduce oxygen production costs (see Section 4.1.4), its economics will become even more attractive, especially for retrofit applications.
Table 4.1.11 PRB Fueled PC Plant Performance With and Without CO2 Capture
Boiler Oxidant Air Air Oxygen OxygenFlue Gas Recycle No No Yes-Undried Yes-DriedCO2 Concentrated* No Yes Yes Yes
Technique Used Not Applicable MEA Scrubbing O2 Combustion O2 CombustionSteam Turbine Power, MWe 533 434 533 533Plant Auxiliary Power, MWe
ASU 100 104Other 31 47 24 24Total 31 47 124 128
Plant Net Power, MWe 501 388 408 405Plant Net Efficiency, % (HHV) 37.0 28.6 31.4 29.9
* Plant does not include CO2 processing or compression for pipeline transport
41
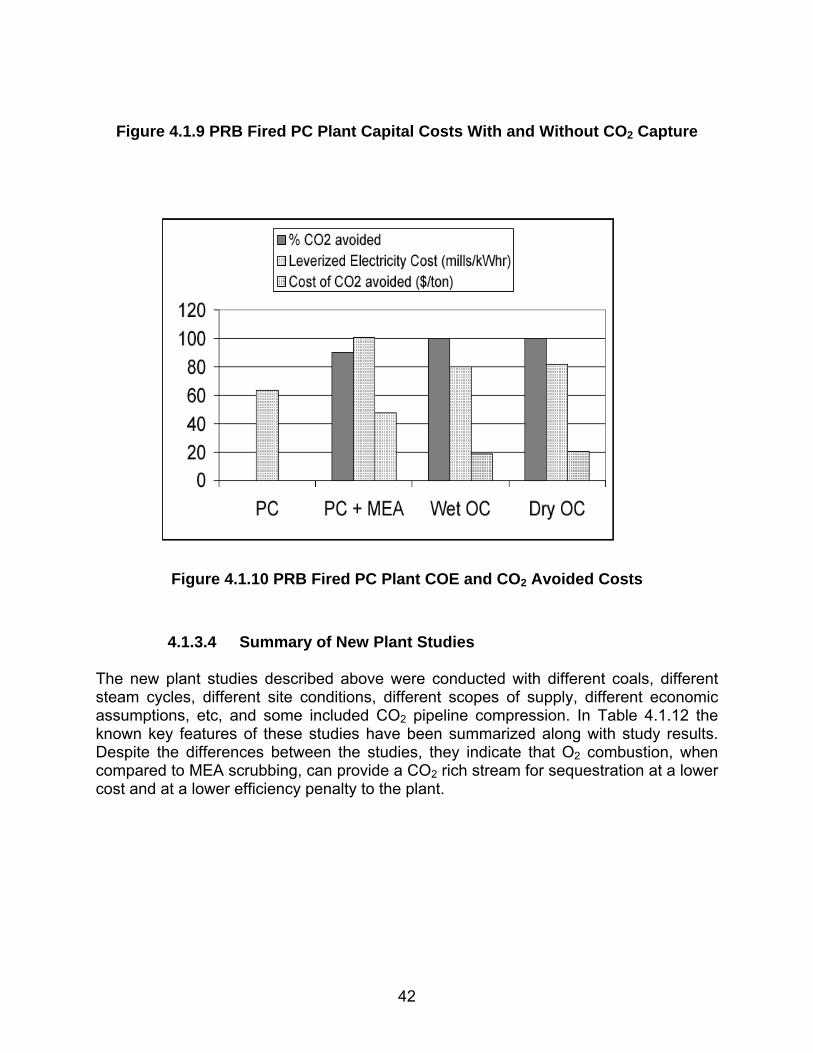
Figure 4.1.9 PRB Fired PC Plant Capital Costs With and Without CO2 Capture
Figure 4.1.10 PRB Fired PC Plant COE and CO2 Avoided Costs
4.1.3.4 Summary of New Plant Studies The new plant studies described above were conducted with different coals, different steam cycles, different site conditions, different scopes of supply, different economic assumptions, etc, and some included CO2 pipeline compression. In Table 4.1.12 the known key features of these studies have been summarized along with study results. Despite the differences between the studies, they indicate that O2 combustion, when compared to MEA scrubbing, can provide a CO2 rich stream for sequestration at a lower cost and at a lower efficiency penalty to the plant.
42
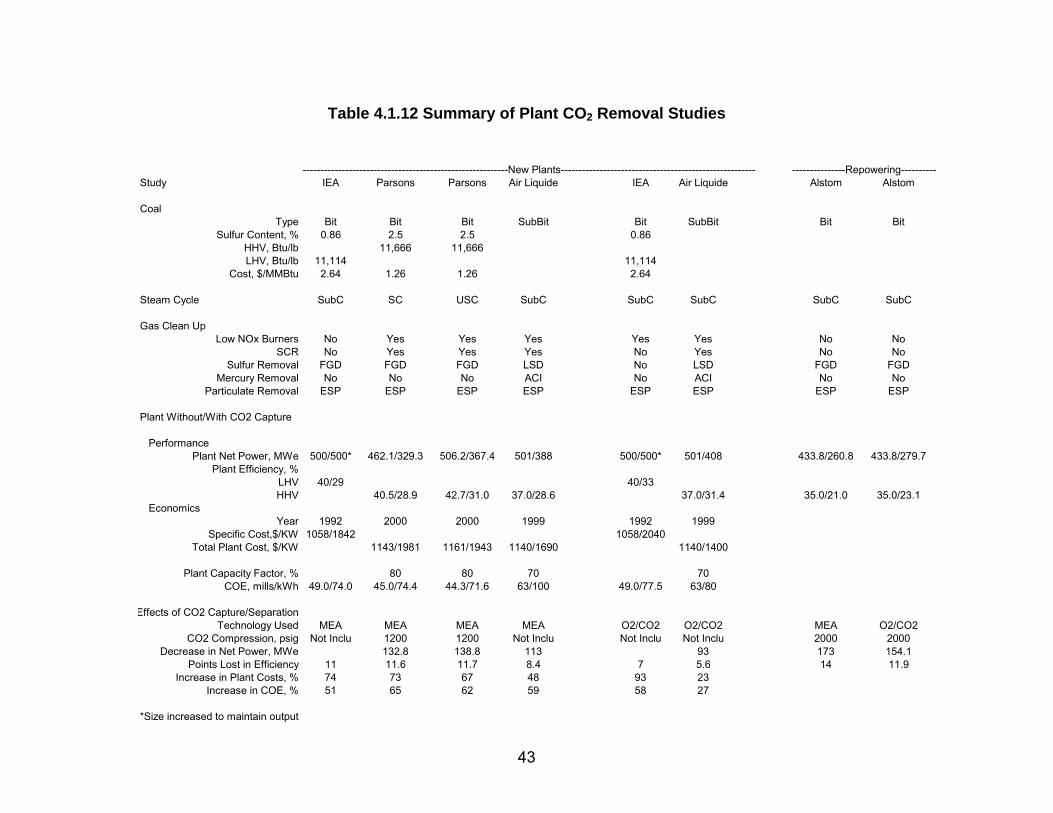
Table 4.1.12 Summary of Plant CO2 Removal Studies
----------------------------------------------------------New Plants------------------------------------------------------- ---------------Repowering----------Study IEA Parsons Parsons Air Liquide IEA Air Liquide Alstom Alstom
CoalType Bit Bit Bit SubBit Bit SubBit Bit Bit
Sulfur Content, % 0.86 2.5 2.5 0.86HHV, Btu/lb 11,666 11,666LHV, Btu/lb 11,114 11,114
Cost, $/MMBtu 2.64 1.26 1.26 2.64
Steam Cycle SubC SC USC SubC SubC SubC SubC SubC
Gas Clean UpLow NOx Burners No Yes Yes Yes Yes Yes No No
SCR No Yes Yes Yes No Yes No NoSulfur Removal FGD FGD FGD LSD No LSD FGD FGD
Mercury Removal No No No ACI No ACI No NoParticulate Removal ESP ESP ESP ESP ESP ESP ESP ESP
Plant Without/With CO2 Capture
Performance Plant Net Power, MWe 500/500* 462.1/329.3 506.2/367.4 501/388 500/500* 501/408 433.8/260.8 433.8/279.7
Plant Efficiency, %LHV 40/29 40/33HHV 40.5/28.9 42.7/31.0 37.0/28.6 37.0/31.4 35.0/21.0 35.0/23.1
EconomicsYear 1992 2000 2000 1999 1992 1999
Specific Cost,$/KW 1058/1842 1058/2040Total Plant Cost, $/KW 1143/1981 1161/1943 1140/1690 1140/1400
Plant Capacity Factor, % 80 80 70 70COE, mills/kWh 49.0/74.0 45.0/74.4 44.3/71.6 63/100 49.0/77.5 63/80
Effects of CO2 Capture/SeparationTechnology Used MEA MEA MEA MEA O2/CO2 O2/CO2 MEA O2/CO2
CO2 Compression, psig Not Inclu 1200 1200 Not Inclu Not Inclu Not Inclu 2000 2000 Decrease in Net Power, MWe 132.8 138.8 113 93 173 154.1
Points Lost in Efficiency 11 11.6 11.7 8.4 7 5.6 14 11.9 Increase in Plant Costs, % 74 73 67 48 93 23
Increase in COE, % 51 65 62 59 58 27
*Size increased to maintain output
43

4.1.4 Impact of CO2 Removal On Existing Plants In [16] Alstom Power Incorporated conducted a study to determine the impact of incorporating CO2 removal into an existing pulverized coal-fired power plant via two different technologies/approaches. The plant selected was American Electric Power’s bituminous coal fired Unit Number 2 at Conesville Ohio. It utilized a tangentially fired boiler together with a 2400 psig/1000°F/1000°F steam turbine, an ESP, and a wet FGD system; prior to CO2 removal it produced 433.8 MWe of net power with an efficiency of 35 per cent and a CO2 emission rate of 866.2 klb/h (1.997 lb/kWh). The first case studied employed an MEA scrubber system to remove CO2 from the unit’s flue gas. The MEA system had a flue gas SO2 limit of 10 ppm dry volume basis; to accommodate this limit, the sulfur removal efficiency of the FGD system was increased by the addition of a second absorber and the MEA system was installed at its outlet. Approximately 79 per cent of the intermediate pressure steam turbine exhaust was required to regenerate the MEA solvent and the released CO2 was cooled, dried, and compressed to 2000 psig for delivery to a pipeline. The system removed 96 per cent of the plant CO2 and in doing so the plant net power output and efficiency decreased by 173 MWe and 14 percentage points. It was also noted that a plot plan area of 5 acres was required to accommodate the MEA system. In the second case O2 combustion was used. Three trains of conventional cryogenic air separation units were used to supply 99 per cent pure oxygen to the boiler at a total rate of approximately 8924 tons per day. About 2/3rds of the flue gas was recirculated to the boiler to maintain its air-fired temperature and gas flow profiles and an air in-leakage rate of one per cent of the total oxygen requirement was assumed. Although the steam turbine power was maintained, the cryogenic system consumed approximately 96 MWe and the plant net output and efficiency decreased by 154 MWe and 12 percentage points. The O2/CO2 system was calculated to remove 94 per cent of the plant CO2 and required half as much plot plan area (2 ½ acres) as the MEA system for its equipment. Results of the two cases are summarized in Table 4.1.13. An O2 combustion retrofit, based on conventional cryogenic air separation, yields an efficiency about 2 percentages points higher than an MEA retrofit, requires half the real estate, and its efficiency, according to the authors, might be increased by another 20 per cent if advanced oxygen separating ceramic membranes (see Section 4.1.5) were used instead of cryogenic air separation. The retrofit study results have been added to Table 4.1.12 and the referenced two percentage point efficiency advantage shown for O2 combustion is similar to that predicted by American Air Liquide [9] for a new PRB coal-fired plant application. Although Table 4.1.13 does not present economic data, [9] also analyzed an MEA versus O2 combustion retrofit and concluded that O2 combustion involved significantly lower capital costs and significantly lower operating and maintenance costs.
44
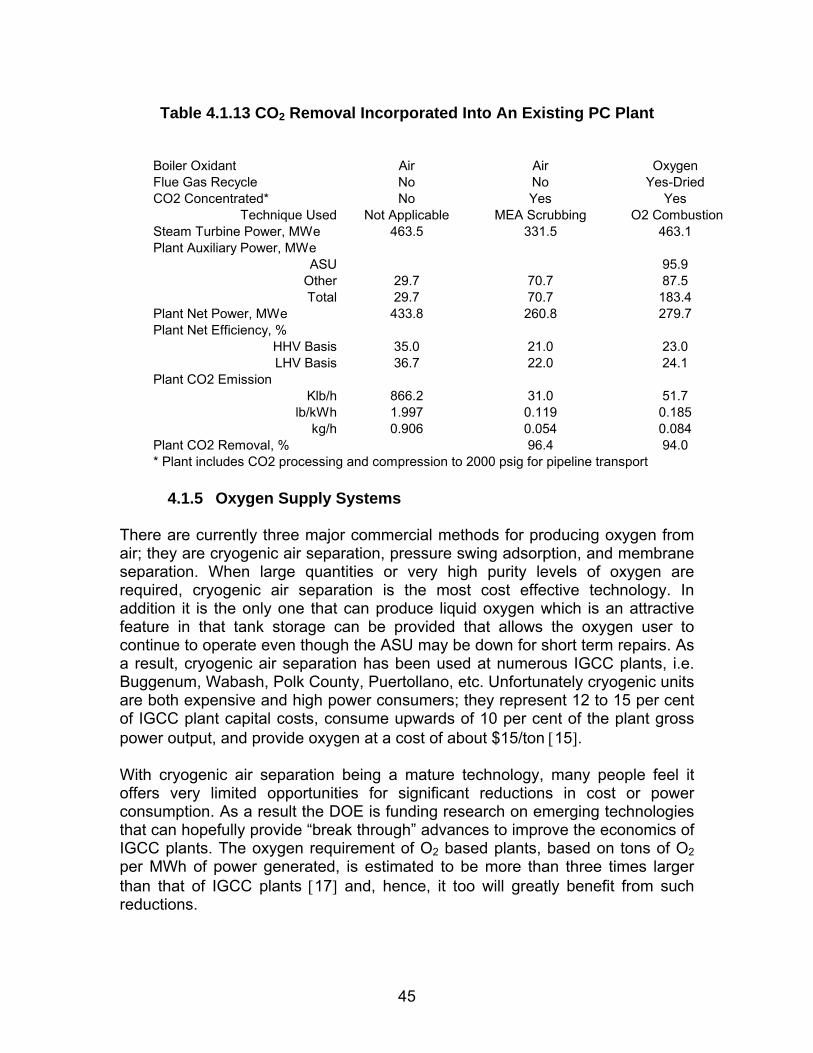
Table 4.1.13 CO2 Removal Incorporated Into An Existing PC Plant
Boiler Oxidant Air Air OxygenFlue Gas Recycle No No Yes-DriedCO2 Concentrated* No Yes Yes
Technique Used Not Applicable MEA Scrubbing O2 CombustionSteam Turbine Power, MWe 463.5 331.5 463.1Plant Auxiliary Power, MWe
ASU 95.9Other 29.7 70.7 87.5Total 29.7 70.7 183.4
Plant Net Power, MWe 433.8 260.8 279.7Plant Net Efficiency, %
HHV Basis 35.0 21.0 23.0LHV Basis 36.7 22.0 24.1
Plant CO2 EmissionKlb/h 866.2 31.0 51.7
lb/kWh 1.997 0.119 0.185kg/h 0.906 0.054 0.084
Plant CO2 Removal, % 96.4 94.0* Plant includes CO2 processing and compression to 2000 psig for pipeline transport
4.1.5 Oxygen Supply Systems
There are currently three major commercial methods for producing oxygen from air; they are cryogenic air separation, pressure swing adsorption, and membrane separation. When large quantities or very high purity levels of oxygen are required, cryogenic air separation is the most cost effective technology. In addition it is the only one that can produce liquid oxygen which is an attractive feature in that tank storage can be provided that allows the oxygen user to continue to operate even though the ASU may be down for short term repairs. As a result, cryogenic air separation has been used at numerous IGCC plants, i.e. Buggenum, Wabash, Polk County, Puertollano, etc. Unfortunately cryogenic units are both expensive and high power consumers; they represent 12 to 15 per cent of IGCC plant capital costs, consume upwards of 10 per cent of the plant gross power output, and provide oxygen at a cost of about $15/ton [15]. With cryogenic air separation being a mature technology, many people feel it offers very limited opportunities for significant reductions in cost or power consumption. As a result the DOE is funding research on emerging technologies that can hopefully provide “break through” advances to improve the economics of IGCC plants. The oxygen requirement of O2 based plants, based on tons of O2 per MWh of power generated, is estimated to be more than three times larger than that of IGCC plants [17] and, hence, it too will greatly benefit from such reductions.
45

Air Products and Chemicals Inc. (Air Products) and Praxair Inc. are working under separate DOE contracts to develop oxygen transport membranes that hopefully will achieve a significant reduction in both oxygen production costs as well as power requirements. The Air Products technology is based on a ceramic membrane which, when operated at high temperature (typically 1500 to 1650°F), will selectively transport oxygen ions. When subjected to an oxygen partial-pressure driving force at this temperature the membrane will produce high-purity oxygen at a high flux rate. Air Products has named their air separation technology Ion Transport Membrane (ITM) Oxygen. When applied to a single train IGCC plant incorporating a Texaco high-pressure quench gasifier and a Siemens Westinghouse 501G gas turbine, ITM Oxygen, when compared with cryogenic ASU, is projected to cost 35 per cent less. In addition it requires 37 per cent less power yielding a 7 per cent reduction in IGCC capital costs and a one percentage point increase in plant efficiency [18]. Air Products is pursuing a planar membrane system, has successfully manufactured and tested commercial scale wafers, and hopes to have a commercial scale unit with an oxygen capacity in the hundreds of tons per day in the year 2007-2008 time frame. Praxair [19] reports similar success with the ceramic oxygen transport membrane (OTM) system it is developing. A ceramic material composed of synthetic inorganic compounds in an architecture suitable for a 10 year life appears feasible and a multi OTM element system, capable of delivering >99 per cent purity oxygen, has been successfully tested for 1000 hours at 1650°F and 275 psia; the multi element system is next undergoing cycle testing involving heating, oxygen production, and cool down to prove its integrity. Although the ceramic membranes being pursued by both Air Products and Praxair are aimed at reducing the costs and increasing the efficiency of IGCC plants, they can also be applied to and will improve the performance and economics of O2 combustion plants.
46

4.2 System Design and Analysis
4.2.1 Reference Site and Fuel Conditions In December, 2000 Parsons published a study of the cost of electricity of several case studies in CO2 sequestration from a PC boiler by post capture (Ref. 12). To provide a consistent comparison with the cases analyzed in the Parsons report, the same site conditions (59ºF, 14.7 psia, 60% RH) and the same fuel (Illinois #6) are used in the analysis presented herein. Site Conditions and fuel properties are presented in Table 4.2.1. Fuel HHV and LHV were estimated by a DuLong’s method and the stoichiometric air ratio of 867 lbair/lbcoal was calculated based on the fuel ultimate analysis. The liquid CO2 produced from the oxygen-based PC power plant is not chemically pure, but can readily sequestered in geologic formations (depleted oil and gas reservoirs, unmineable coal seams, saline formations, and shale formations). The liquid CO2 exits the plant at 2000 psia (Parsons study used 1200 psia). The other gases in the delivered CO2 are limited to H2O < 50 ppm (to avoid acid corrosion), and Ar+N2 < 3% (to avoid phase separation). The excess gases in CO2 stream either have to be purged or recycled. However, since SO2, as an acid gas, similar to CO2, it can be sent to pipeline directly, and as mentioned in literature, it does not need to be separated out from CO2 product. Furthermore, it is also not necessary to remove the small concentration of NOx in the CO2 effluent since it can be sequestered along with the CO2.
4.2.2 Air-Fired Reference Case To study the effects of CO2 removal on the performance of power plant, an air-fired PC boiler was been simulated in detail as a reference case. This model was used as the base, which was then extended to include the air separation unit (ASU) and CO2 compression for O2-fired PC cases. The reference plant employs a subcritical pressure, natural circulation boiler firing high-volatile bituminous coal producing 2400 psig steam at 1000ºF and reheat steam at 1000ºF to generate 460 MWe (gross). A condenser pressure of 2.5” Hg was applied along with seven feedwater heaters, which raise the feedwater temperature to 494ºF. Case 1 is the reference air-fired PC boiler case and the model and results are shown in Figure 4.2.1. The Aspen Plus model includes coal mills, flue gas heater, pulverized coal-fired furnace, steam generator, superheater, reheater, economizer, ash-removal unit, nitrogen oxides (NOx) selective catalytic reactor (SCR), flue gas de-sulfurization reactor (FGD), air blower, induced draft (ID) fan, feed water pump, cooling water
47

pump, feed water heaters, and a single reheat steam turbine. A coal drying function has been modeled and added into mill module to result in the proper correct mill exit gas temperature. The furnace was simulated by a zero dimensional model. However, all key tube banks of the heat recovery area (HRA) were individually modeled. The furnace roof heat absorption is also simulated. The high pressure steam temperature is controlled by water spray for de-superheat. The simulation also included heat losses from boiler and HRA sides, as well as steam pipes. Some user-defined models are included to perform emission calculations. User built-in calculations were added to determine boiler efficiency, system net efficiency, and net power. The heat carried by exhaust streams was automatically calculated by program. For a given steam turbine output and a fuel, ASPEN PLUS iterates to determine the feed rates of air, coal, etc., based on specified temperature approaches and the excess air requirement. The system configuration, detailed setup parameters and summary of results for the case 1 reference case are shown in Figure 4.2.1 and Table 4.2.2. This system has a steam turbine cycle efficiency (generator power divided by heat transferred to the steam cycle) of 45.78%, a boiler efficiency (heat to steam cycle divided by heat input from fuel to boiler) of 88.2%, an unburned carbon loss (UBC) of 1.0%, and a net plant efficiency of 36.68% (net plant heat rate of 9302 Btu/kWh). It has a gross power as 460 MWe at generator, an auxiliary power of 42 MWe, and a net power of 418 MWe. Total heat input from fuel is 3890 MM Btu/hr. The temperature of the flue gas exhausted to the stack is 292ºF. The flue gas exiting the boiler contains 3.0%, vol., wet O2 (18% excess air) and contains 773 klb/hr (1.95 lb/kwh) of CO2.This 3.0% O2 level is kept constant for all of the O2-fired cases. An SCR is applied to control NOx with NH3/NOx=1.0, while an FGD is used to control SOx by lime solution with Ca/S=1.05, L/G=10, and 85% excess air for aeration (Table 4.2.2) The breakdown of auxiliary power for case 1 is listed in Table 4.2.3. Most of these power consumptions were simulated directly by the ASPEN module. Some required user Fortran for those processes lacking ASPEN modules, such as solids handling. The power consumption was based on stream flows and design data. Fan power consumption was simulated based on the pressure drops from both air side and gas side. The total auxiliary power consumption, including FGD, for case 1 is approximately 9.2% of the gross power.
48

4.2.3 Oxygen-Based PC Plant
4.2.3.1 Boiler Plant Modifications The oxygen-based (or oxygen-fired) plant model contains essentially all the components in the conventional plant model. In addition, it also includes an air separation unit (ASU) and a flue gas cooler. In the O2-fired plant, the FGD is not needed because the SO2 is acid gas similar to CO2 and can thus be sent to pipeline together with the CO2. A substantial portion of the SOx and H2S will be removed as the flue gas is cooled down in the CO2 cooling and compression equipment. The steam side components remain very similar to the air-fired case with only some changes in heat bundle duties in the heat recover area (HRA). In O2-fired cases, flue gas is recycled is to control the flame temperature inside the PC-fired boiler to minimize NOx formation, minimize ash slagging in the furnace combustion zone, and avoid the application of exotic materials. Before the flue gas is separated into a recycled and effluent stream (to the pipeline), it is cooled to 90ºF. Since this is below the acid/moisture dew point a heat exchanger containing acid-resistant materials must be used. The recycled gas is then reheated, before the forced draft (FD) fan, by mixing it with a bypassed hot gas to avoid reaching the dew point. After the O2 from ASU plant is mixed with recycled flue gas, it is heated by the flue gas exiting the boiler in a gas-gas heat exchanger, which acts as a recuperator to improve cycle efficiency and reduce fan power requirements. It is assumed in this study that there is no tramp air ingress through the sealed boiler.
4.2.3.2 Air Separation Unit For an O2-fired PC, O2 purity is a key parameter for system performance and economics. A high purity O2 will produce a high purity of product CO2 gas that will reduce CO2 purification and compression power. However, producing high purity O2 requires high ASU plant operational and equipment costs. Furthermore, too high O2 purity is not necessary because the fuel combustion itself will generate some gases, such as N2 and some excess O2 is required for complete combustion, in additional to CO2 as flue gas. Therefore there is a balance point to give an optimum. After literature review and some trade studies, it was determined to use a complete ASU to separate air to O2 and N2/Ar, (Ar is separated out from the O2 by additional column) to maintain an O2 purity between 99.0 and 99.5%.
49
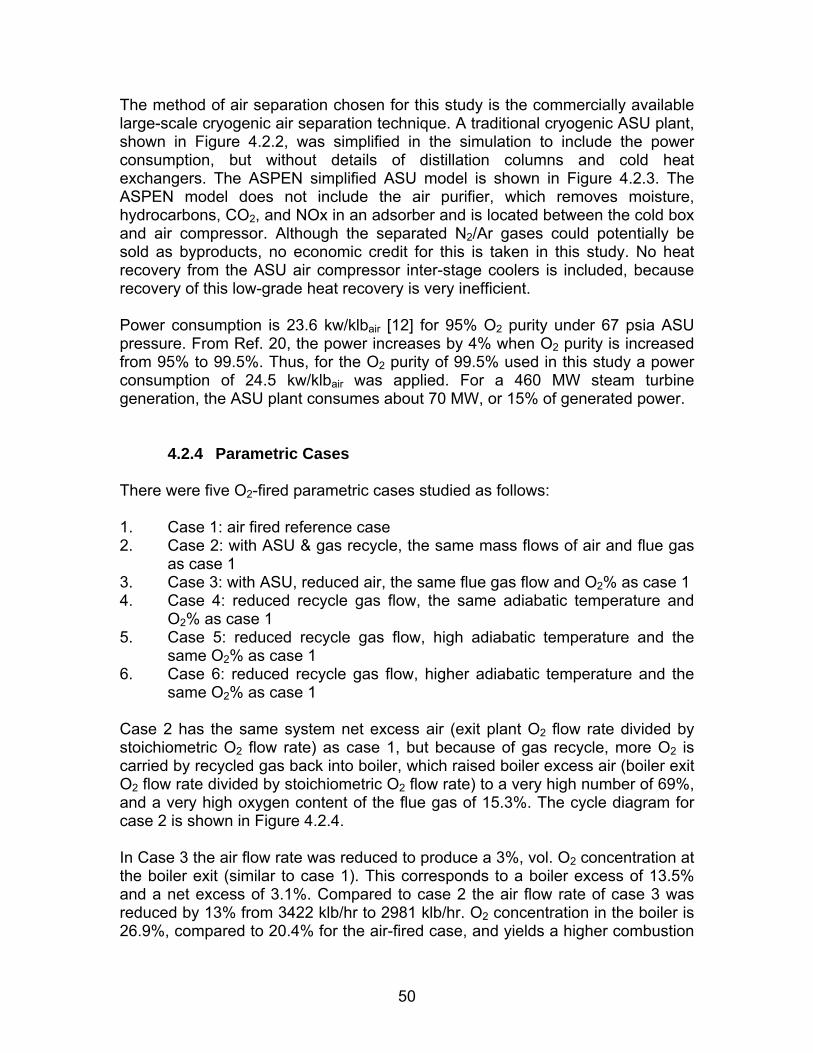
The method of air separation chosen for this study is the commercially available large-scale cryogenic air separation technique. A traditional cryogenic ASU plant, shown in Figure 4.2.2, was simplified in the simulation to include the power consumption, but without details of distillation columns and cold heat exchangers. The ASPEN simplified ASU model is shown in Figure 4.2.3. The ASPEN model does not include the air purifier, which removes moisture, hydrocarbons, CO2, and NOx in an adsorber and is located between the cold box and air compressor. Although the separated N2/Ar gases could potentially be sold as byproducts, no economic credit for this is taken in this study. No heat recovery from the ASU air compressor inter-stage coolers is included, because recovery of this low-grade heat recovery is very inefficient. Power consumption is 23.6 kw/klbair [12] for 95% O2 purity under 67 psia ASU pressure. From Ref. 20, the power increases by 4% when O2 purity is increased from 95% to 99.5%. Thus, for the O2 purity of 99.5% used in this study a power consumption of 24.5 kw/klbair was applied. For a 460 MW steam turbine generation, the ASU plant consumes about 70 MW, or 15% of generated power.
4.2.4 Parametric Cases There were five O2-fired parametric cases studied as follows: 1. Case 1: air fired reference case 2. Case 2: with ASU & gas recycle, the same mass flows of air and flue gas
as case 1 3. Case 3: with ASU, reduced air, the same flue gas flow and O2% as case 1 4. Case 4: reduced recycle gas flow, the same adiabatic temperature and
O2% as case 1 5. Case 5: reduced recycle gas flow, high adiabatic temperature and the
same O2% as case 1 6. Case 6: reduced recycle gas flow, higher adiabatic temperature and the
same O2% as case 1 Case 2 has the same system net excess air (exit plant O2 flow rate divided by stoichiometric O2 flow rate) as case 1, but because of gas recycle, more O2 is carried by recycled gas back into boiler, which raised boiler excess air (boiler exit O2 flow rate divided by stoichiometric O2 flow rate) to a very high number of 69%, and a very high oxygen content of the flue gas of 15.3%. The cycle diagram for case 2 is shown in Figure 4.2.4. In Case 3 the air flow rate was reduced to produce a 3%, vol. O2 concentration at the boiler exit (similar to case 1). This corresponds to a boiler excess of 13.5% and a net excess of 3.1%. Compared to case 2 the air flow rate of case 3 was reduced by 13% from 3422 klb/hr to 2981 klb/hr. O2 concentration in the boiler is 26.9%, compared to 20.4% for the air-fired case, and yields a higher combustion
50

efficiency. Flue gas flow to the sequestration plant is reduced from 927 klb/hr in case 2 to 820 klb/hr in case 3, which results in less CO2 compression duty. Case 3 maintains the same flue gas flow rate as cases 1 and 2. The cycle diagram for case 3 is shown in Figure 4.2.5. In cases 4 to 6 the amount of flue gas recycled was reduced to increase the O2 level in the boiler. This increase in boiler O2 creates a higher adiabatic temperature, which reduces the size of the furnace and increases the overall cycle efficiency. The adiabatic temperature (used as the abscissa in Figure 4.2.10 to Figure 4.2.13) is the maximum theoretical temperature that can be reached by the products of combustion with no loss of heat and no dissociation. Actual flame temperature is lower than the adiabatic temperature especially at adiabatic temperatures greater than 3600ºF due to flue gas dissociation of CO2 to CO and H2O. The effect of adiabatic temperature on cycle efficiency is shown in Table 4.2.4 and Figure 4.2.10. Case 4 has the same adiabatic temperature as air-fired reference case, while cases 5 and 6 have higher adiabatic temperatures. Although there is little change in gas exhaust flow to the CO2 compressor among cases 3-6 (listed as gas exit system in Table 4.2.4), the decreasing recycle gas flow results in reduced auxiliary power consumption for both the FD and ID fans. The reduction in FD and ID fan auxiliary power requirements is presented in Figure 4.2.11 (approximately 2.5 MW from case 3 to case 6) along with the reduction in ASU power requirements (approximately 1 MW from case 3 to case 6) Figure 4.2.12 shows the relationship of flue gas flow to boiler adiabatic temperature. Figure 4.2.13 is a similar plot to Figure 4.2.12, but it uses volumetric flow rate as the ordinate instead of mass flow rate. Both figures show the air-fired data for comparison. It can be observed that the O2-fired PC has a lower volume flow rate than does the air-fired PC due to the higher molecular weight of the flue gas (i.e. CO2 versus N2). From case 3 to case 6 the ratio of the O2-fired PC volume flow rate to the air-fired PC volume flow rate drops from 75% to 57%, which means for a constant flue gas velocity, boiler size is reduced. Another advantage from decreasing the quantity of recycle gas is to increase the O2 content in the boiler (from 27% to 34% by vol. from case 3 to case 6), which improves the fuel combustion and reduces the required height of the furnace. This credit has not been simulated in this system study, but was modeled in the 3-D CFD boiler simulation study (Section 4.4.1).
4.2.5 Hot Recycle A case with hot gas recycle (case 7, Figure 4.2.9) was run to evaluate its effect on the system performance. A hot gas recycle brings more energy back into boiler, reduces fuel and O2 feed rates, and reduces ASU duty, but it requires more power to the fan because of the increased recycle gas volume flow. Table 4.2.4 shows that increasing the recycle gas temperature from 95ºF to 148ºF increases the boiler efficiency from 89.60% to 90.94% and net efficiency
51

from 31.90% to 32.12%. The additional fan power increase of 0.3 MW was more than made up by a reduction in ASU power of 0.5 MW. The resultant fuel saving is approximately 0.7%. The size of the gas-gas heat exchanger increases due to the reduction in LMTD (fluid temperature difference is reduced from 213ºF to 176ºF for the hot end, and from 104ºF to 74ºF for the cold end). There is a limit to increasing the recycle gas temperature without increasing the stack gas temperature, which will reduce efficiency and increase cooling duty. One option mentioned in literature is to raise both stack gas and recycle gas temperatures, and then recover heat from stack gas to replace part of the feedwater heaters. The merits of this approach are questionable because the efficiency improvement will be very small from replacing the low pressure feedwater heater. Figure 4.2.14 shows the cooling curve for flue gas cooling before compressor. Part of the heat can be recovered to preheat the condensate. If 90 MMBtu/hr of heat is recovered (exit temperature = 142ºF), the steam saved from extraction will generate an additional 2.2 MW, or an efficiency increase of 0.2% point. If 150 MMBtu/hr of heat is recovered (exit temperature = 133ºF), the steam saved from extraction will generate an additional 3.4 MW, or an efficiency increase of 0.3% point. This potential energy savings will be further explored in Section 4.2.8.
4.2.6 CO2 Compression The flue gas effluent stream (mainly CO2) has to be compressed to the high pipeline pressure of 1200 to 2000 psia. Using case 3 as a basis, case 8 is simulated in which the CO2 sequestration equipment is added to the system and the effluent is conservatively compressed to 2000 psia. The dominant moisture in flue gas is condensed out first during flue gas cooling before the first stage compression. The condensed water contains acid gases and has to be treated before recycle or discharge. The flue gas dry composition before the first stage CO2 compressor from case 8 is:
CO2 O2 N2+Ar SOx H2O 90.9 2.9 1.3 1.3 3.6
In literature, a O2 concentration as low as 1.3% was used. Reducing O2 content, such as from 3.0% to 2.0% by reducing excess air, would be helpful in reducing CO2 compression power, but it is judged that and oxygen content of approximately 3.0% is required for good combustion efficiency. Both CO2 and SOX are acid gases. They combine with moisture to form acid, which causes a corrosion problem along CO2 pipeline. Therefore, after the 2nd stage, a chemical method of active dehydration with TEG (Triethyleneglycol), retarding hydrate formation and corrosion, has been applied to reduce the moisture to a very low
52
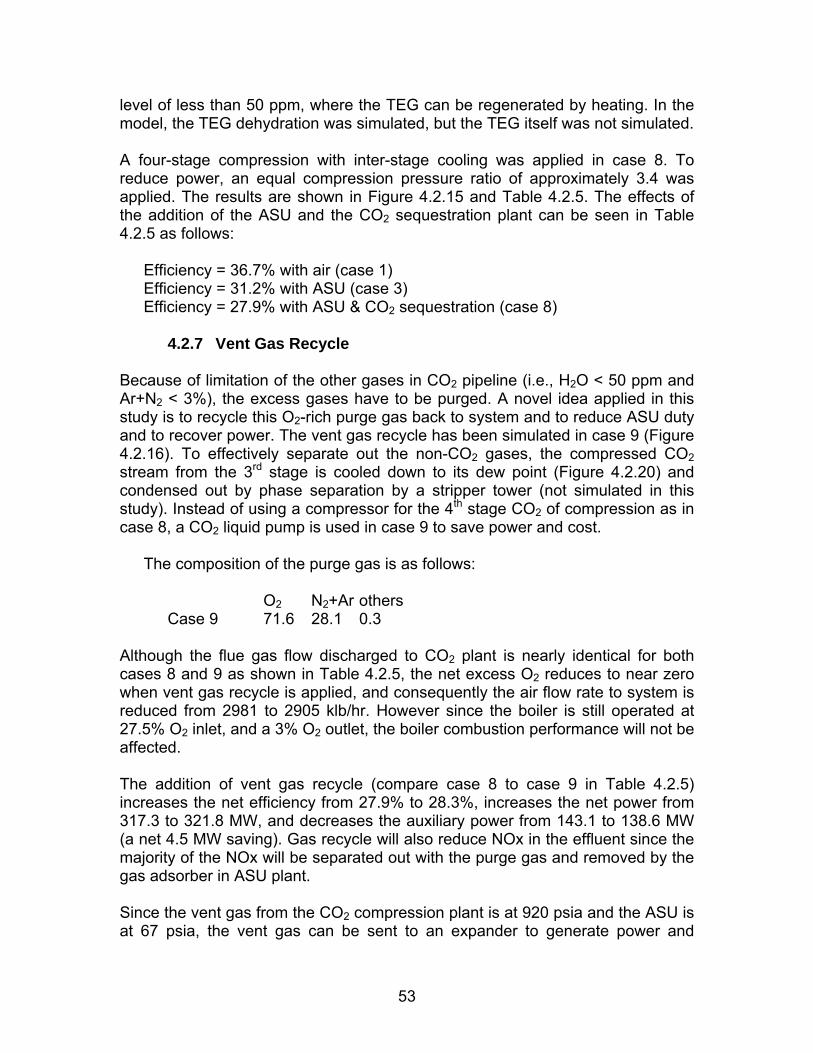
level of less than 50 ppm, where the TEG can be regenerated by heating. In the model, the TEG dehydration was simulated, but the TEG itself was not simulated. A four-stage compression with inter-stage cooling was applied in case 8. To reduce power, an equal compression pressure ratio of approximately 3.4 was applied. The results are shown in Figure 4.2.15 and Table 4.2.5. The effects of the addition of the ASU and the CO2 sequestration plant can be seen in Table 4.2.5 as follows:
Efficiency = 36.7% with air (case 1) Efficiency = 31.2% with ASU (case 3) Efficiency = 27.9% with ASU & CO2 sequestration (case 8)
4.2.7 Vent Gas Recycle Because of limitation of the other gases in CO2 pipeline (i.e., H2O < 50 ppm and Ar+N2 < 3%), the excess gases have to be purged. A novel idea applied in this study is to recycle this O2-rich purge gas back to system and to reduce ASU duty and to recover power. The vent gas recycle has been simulated in case 9 (Figure 4.2.16). To effectively separate out the non-CO2 gases, the compressed CO2 stream from the 3rd stage is cooled down to its dew point (Figure 4.2.20) and condensed out by phase separation by a stripper tower (not simulated in this study). Instead of using a compressor for the 4th stage CO2 of compression as in case 8, a CO2 liquid pump is used in case 9 to save power and cost.
The composition of the purge gas is as follows:
O2 N2+Ar others Case 9 71.6 28.1 0.3
Although the flue gas flow discharged to CO2 plant is nearly identical for both cases 8 and 9 as shown in Table 4.2.5, the net excess O2 reduces to near zero when vent gas recycle is applied, and consequently the air flow rate to system is reduced from 2981 to 2905 klb/hr. However since the boiler is still operated at 27.5% O2 inlet, and a 3% O2 outlet, the boiler combustion performance will not be affected. The addition of vent gas recycle (compare case 8 to case 9 in Table 4.2.5) increases the net efficiency from 27.9% to 28.3%, increases the net power from 317.3 to 321.8 MW, and decreases the auxiliary power from 143.1 to 138.6 MW (a net 4.5 MW saving). Gas recycle will also reduce NOx in the effluent since the majority of the NOx will be separated out with the purge gas and removed by the gas adsorber in ASU plant. Since the vent gas from the CO2 compression plant is at 920 psia and the ASU is at 67 psia, the vent gas can be sent to an expander to generate power and
53

reduce its pressure and temperature. This power generation is not included in case 9, but is added in a subsequent case (see Section 4.2.8). Furthermore, the low temperature expanded recycled gas could be used as extra coolant for the ASU distillation column. However, this energy savings has not been accounted at present time because the model does not include the details for ASU plant. In cases 10 and 11 the amount of flue gas recycled was reduced to increase the O2 level in the boiler (similar to cases 4 to 6). This increase in boiler O2 creates a higher adiabatic temperature, which reduces the size of the furnace and increases the overall cycle efficiency. The effect of adiabatic temperature on cycle efficiency is shown in Table 4.2.5, which demonstrates that raising the adiabatic temperature from 3575ºF to 4343ºF increases the net efficiency from 28.3% to 29.5% (boiler efficiency is also increased from 88.3% to 90.8%). Figure 4.2.17 presents the net cycle efficiency versus the recycle flow rate. Cycle diagrams for cases 10 and 11 are shown in Figure 4.2.18 and Figure 4.2.19, respectively.
4.2.8 Case 12 Based on the results of the parametric cases, cases 12 is modeled Since all processes that capture CO2 must include some kind of wet gas cooler, due to the low temperature to which the flue gas is cooled, case 12 utilizes a wet-end economizer to recover as much of this heat as practical. In case 12 a heat exchanger is added to recover the flue gas sensible energy prior to separation into recycle and outlet streams. The heat exchanger cools the flue gas to 142ºF and removes 90 MM Btu/hr. This significantly increases the boiler efficiency by reducing the energy content of the flue gas effluent. The LMTD of the heat exchanger is 34ºF and it is judged that reducing the flue gas temperature further (below 142ºF) could be uneconomical since the required heat exchanger would be too large. Figure 4.2.24 shows that reducing the flue gas temperature from 142ºF to 139ºF (increasing the heat exchanger absorption from 90 MM Btu/hr to 100 MM Btu/hr) reduces the LMTD from 34ºF to 26ºF. Although the flue gas outlet temperature of this additional heat exchanger is nominally at the moisture condensation temperature, the presence of SOx in the flue gas raises the dew point of gas such that sulfuric acid solutions will condense below 300ºF. Consequently the heat exchanger must be constructed from acid-resistant materials. There are two possible applications for this wet-end economizer: 1) replace the first stage FWH1 or 2) heat up a split stream from the condensate pump. The second option results in a higher thermal efficiency since it reduces the higher pressure steam extractions. This is demonstrated in Figure 4.2.26, which shows that the efficiency (work/steam thermal energy) of the steam, if it is not extracted,
54

increases with increasing pressure (stage). Therefore the split stream method yields higher efficiency and is applied in the design case (Figure 4.2.23). Case 12 also incorporates a turbine expander to recover power from the recycled purge gas pressure reduction. The turbine generates 0.41 MW of power as the pressure is reduced from 925 psia to 67 psia. The expanded gas is quite cold (-183ºF) and could potentially be used as a coolant for distillation operation. However, since the ASU was not modeled in detail in this study no credit for this cooling effect is taken. Due to the possible danger of pre-combustion in the mill and primary gas stream, a modification is made to the cycle to use the vitiated air (3.0% O2) as the coal-carrying primary gas stream. The recycled flue gas is mixed with the secondary gas stream after the primary gas take-off. Figure 4.2.23 shows the cycle diagram for case 12. The boiler efficiency is 93.2% and the overall cycle efficiency is 29.8% (Table 4.2.5). The 4.7% losses in the boiler efficiency is comprised of 17% sensible heat, 66% latent heat (H2O), 14% unburned carbon, 3% radiation. Since it is likely that with O2-fired combustion and a high flame temperature, the unburned carbon loss will be nearly zero (confirmed in Section 4.4.1.5), the boiler efficiency would be 94.1% and the overall cycle efficiency would be 30.1%.
4.2.9 Design Case: Case 13 To further reduce the required furnace surface area while increasing the net cycle efficiency, the flue gas recycle flow rate was reduced from 65% (case 12) to 56% (case 13). All features of case 12 are incorporated in case 13. In addition part of the CO2 compressor inter-stage cooling is used to replace part of the economizer duty in the feed water heating train. Figure 4.2.25 shows the cycle diagram for case 13. The boiler efficiency is 93.5% and the overall cycle efficiency is 30.3% (Table 4.2.5). The 4.7% losses in the boiler efficiency is comprised of 15% sensible heat, 67% latent heat (H2O), 14% unburned carbon, 3% radiation. Since it is likely that with O2-fired combustion and a high flame temperature, the unburned carbon loss will be nearly zero (confirmed in Section 4.4.1.5), the boiler efficiency would be 94.5% and the overall cycle efficiency would be 30.6%.
4.2.10 Furnace Waterwall Temperature The level of radiation in the O2-fired boiler is significantly higher than an air-fired boiler due to greater concentrations of radiating gas species (CO2 and H2O) and higher flame temperature. Consequently, it is important to select the proper
55

amount of recycled flue gas to limit the water wall temperature such that a reasonable waterwall material can be used. The maximum waterwall temperature and furnace heat flux was calculated from the ASPEN results using the Foster Wheeler computer program, EMISS. The EMISS computer program calculates radiative heat flux of CO2 and H2O gases as follows:
)(2
1/ 44
wgggwall TTAQ αεσ
ε−⎟
⎠⎞
⎜⎝⎛ +
=
)(/ fWO TTUAQ −=
where, ε = εCO2 + εH2O - ∆ε∆ε = Correction factor due to spectral overlap εCO2 = Emissivity of CO2 (function of temperature, mean beam length, and
partial pressure of CO2) εH2O = Emissivity of H2O (function of temperature, mean beam length, and
partial pressure of H2O) εg = Emissivity of gas at gas temperature αg = Absorptivity of gas at wall temperature (equal to emissivity) εwall = Tube wall emissivity (assumed to be 0.7) σ = Stefan-Boltzmann constant = 1.714 x 10⁻⁹ Btu/hr-ft2-R4
Q/A = Heat Flux (Btu/hr-ft2) Tf = Water/Steam fluid temperature (ºR) Tg = Gas temperature (ºR) Tw = Wall temperature (ºR) Uo = Heat transfer coefficient from outside of wall to steam/water (Btu/hr-ft2-F) Table 4.2.6 presents the calculated furnace heat flux for cases 1 to 13. Both the maximum heat flux (based on the maximum furnace gas temperature) and the average heat flux (based on the average furnace gas temperature) are presented. Based on the maximum heat flux, the maximum water wall temperature is computed. From this maximum wall temperature and the selected material, the minimum tube wall thickness is computed using stress allowables from the ASME Boiler and Pressure Vessel Code. Due to CO2 dissociation into CO and O2, the equilibrium flame temperature is lower than the adiabatic temperature. Figure 4.2.21 presents the equilibrium values of CO2 and CO concentration versus flue gas recycle flow. The effect of CO2 dissociation is shown in Figure 4.2.22, which presents the adiabatic temperature (without CO2 dissociation) and equilibrium temperature (with CO2 dissociation) versus flue gas recycle flow. The maximum flame temperature applied for furnace wall temperature calculations is based on a temperature
56

slightly lower than the equilibrium temperature to account for heat loss by the flame. Table 4.2.6 shows that for the air-fired reference case (case 1), the waterwalls are carbon steel with a 0.30” wall thickness. Even though the O2-fired cases 2 and 3 have similar furnace gas temperatures than case 1, the substantially greater concentrations of CO2 and H2O results in a radiative heat flux of approximately 50% higher. Thus, to maintain the same wall thickness requires an upgrade in the material to the T2 alloy. As the flame temperature is increased in cases 4 to 6 and cases 9 to 11, the heat flux and wall temperature increases requiring further material upgrades. For case, the maximum wall temperature is 960ºF for which 0.24” thick T91 material is required. The ratio of the average furnace heat flux of the O2-fired furnace to the average furnace heat flux of the air-fired furnace is also presented in Table 4.2.6. For case 13 this ratio is 0.53, which means that case 13 requires only approximately 53% of the case 1 heating surface area. This can be used as a preliminary estimate of the O2-fired furnace size. Table 4.2.6 shows that the air-fired furnace dimensions of 36’ x 51’ x 207’ (D x W x H) are substantially reduced to 30’ x 43’ x 142’ (D x W x H) in case 12 and 27’ x 38’ x 134’ (D x W x H) in case 13. Section 4.4.1.5 conducted a detailed design of the O2-fired boiler in detail by performing a three-dimensional CFD simulation.
4.2.11 Comparison With Post CO2 Capture CO2 cannot be free captured and sequestrated without reducing both the plant power and efficiency because of a potential energy stored in the pressurized liquid CO2. A minimum of 40 kw/klbCO2 additional auxiliary power is required for CO2 compression. The difference between technologies lies in the difference in power requirements of the different CO2 or O2 separation techniques. Parsons [12] performed some studies on CO2 removal by a post capture method for a conventional PC boiler. The plant efficiency drops from 40.5% to 28.9% for a supercritical (3500 psia/1050ºF/1050ºF/1050ºF/2.0”Hg) boiler, and from 42.7% to 31.0% for an ultra supercritical (5000 psia/1200ºF/1200ºF/1200ºF/2.0”Hg) boiler. In the study presented herein, the CO2 removal using an O2-fired PC is used, which relies on an ASU. The efficiency drops from 36.7% (case 1) to 30.6% (case 13 with minimal UBC loss) for a subcritical (2415 psia/1000ºF/1000ºF/2.5”Hg) boiler. Since the Parsons study compressed the effluent CO2 to 1200 psia, whereas this study herein compressed the CO2 to 2000 psia, the 1200 psia pressure is used as comparison basis, which increases the case 13 efficiency to 30.8%. The net efficiency drops for these cases are
11.7% points for supercritical, post combustion CO2 removal 11.7% points for ultra supercritical, post combustion CO2 removal
5.9% point for subcritical, O2 fired
57

Based on the Parson’s study it appears that the efficiency reduction is independent of steam cycle. However, there is a big difference between the efficiency reductions for post capture and O2-fired. Furthermore, the O2-fired method gives near 100% CO2 removal, while the post capture is practically limited to about 90% (limited by a vapor-liquid equilibrium from absorption-regeneration cycle). Another comparison basis is the kw/lbCO2 removal, where the kw is power generation difference between cases with and without CO2 removal. Comparing the post CO2 capture to the O2-fired case:
187 kwh/lbCO2 for supercritical, 90% post combustion CO2 removal 188 kwh/lbCO2 for ultra supercritical, 90% post combustion CO2 removal 80 kwh/lbCO2 for subcritical, O2 fired 100% removal
Again, the change in power penalty for CO2 removal appears independent of steam cycle. From above data, it is very clear that the O2-PC has advantages over the post CO2 capture. The efficiency of carbon sequestration in oxygen-firing boilers even can rival competing gasification plants. Figure 4.2.27 compares the power consumption of adding CO2 removal equipment to various competing technologies. Figure 4.2.27 shows that the power consumption of CO2 removal for O2-fired PC plants is less than one-third of natural gas combined cycles (NGCC), less than one-half of post CO2 removal PCs and 80% of integrated gasification combined cycles (IGCC). Figure 4.2.28 compares the reduction in power plant efficiency of adding CO2 removal equipment to various competing technologies. Figure 4.2.28 shows that the reduction in power plant efficiency of CO2 removal for O2-fired PC plants is nearly half of either natural gas combined cycles (NGCC) or post CO2 removal PCs and slightly less than integrated gasification combined cycles (IGCC). And once again note that the O2-firing PC is the only technology that removes 100% of the CO2.
58
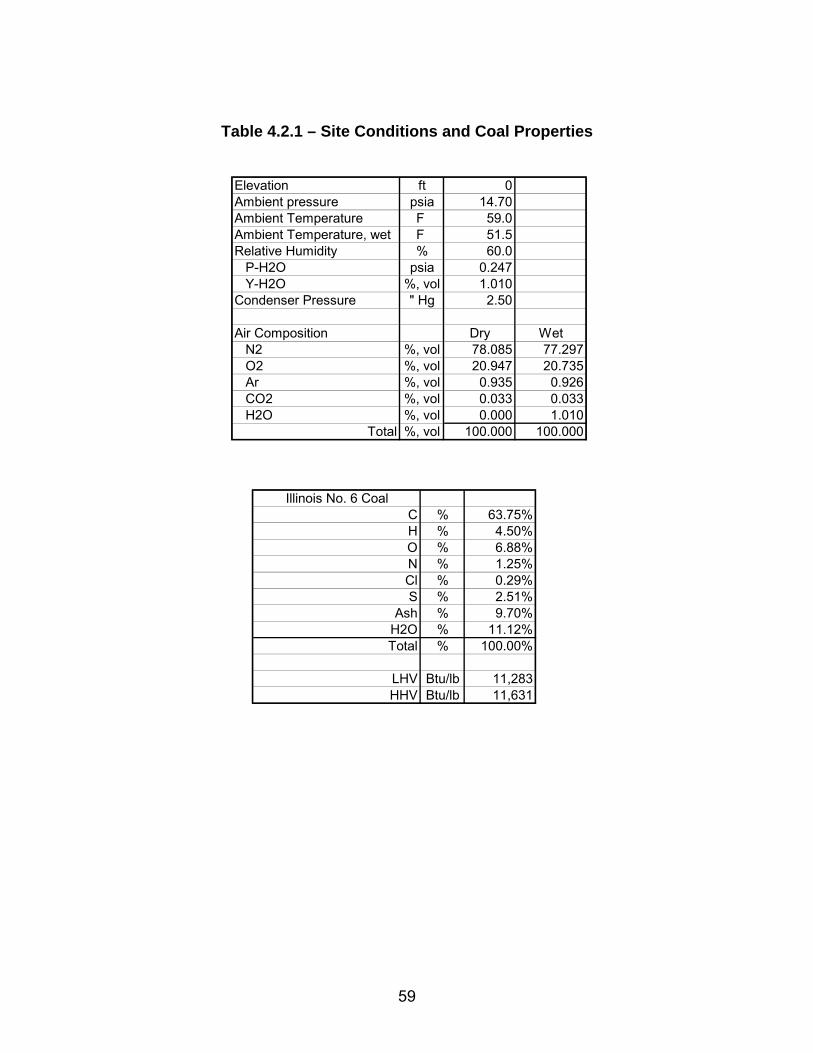
Table 4.2.1 – Site Conditions and Coal Properties
Elevation ft 0Ambient pressure psia 14.70Ambient Temperature F 59.0Ambient Temperature, wet F 51.5Relative Humidity % 60.0 P-H2O psia 0.247 Y-H2O %, vol 1.010Condenser Pressure " Hg 2.50
Air Composition Dry Wet N2 %, vol 78.085 77.297 O2 %, vol 20.947 20.735 Ar %, vol 0.935 0.926 CO2 %, vol 0.033 0.033 H2O %, vol 0.000 1.010
Total %, vol 100.000 100.000
Illinois No. 6 CoalC % 63.75%H % 4.50%O % 6.88%N % 1.25%Cl % 0.29%S % 2.51%
Ash % 9.70%H2O % 11.12%Total % 100.00%
LHV Btu/lb 11,283HHV Btu/lb 11,631
59

Figure 4.2.1 – Cycle Analysis of Case 1 (Air-Fired Reference Case)
487
14.7
3755
A6
3687
14.7
3754G1
258
16.6
1018A5
590
15.3
2737
A4
2135
14.7
3754G3
848
2613.0
2970
47
1827
14.7
3754
G4
1005
2516.0
2970
48
825
635.8
2617
24
1792
14.7
3754
G5
1570
14.7
3754
G6
1001
627.8
2617
26
1552
14.7
3754
G7
1552
14.7
1389G8
G9
1076
14.6
2177G12
537
2775.0
2835
35
838
14.6
2177G13
578
2765.0
283541
1472
14.7
2177G10
696
2675.0
282044
740
2625.0
282045
653
655.8
261723
894
14.6
1389G11853
14.7
18881
859
14.5
3754G14
494
2795.0
283534
720
14.4
3754G15
60
14.7
684
PA
89
16.9
684A2
734
14.3
3756G16
70
15.4
2737A1
590
16.7
684A3
291
14.3
3756
G17
60
20.0
2
NH3
291
14.1
3721
G18
291
14.1
34ASH
310
15.1
3721
G19
310
15.1
3721
G20
100
29.7
37240
L2
100
14.7
37240L1
111
14.7
3612STACK
111
14.7
37349
LIQ
60
14.7
27SORB
100
14.7
37213
SLV
60
14.7
2737
SA
60
14.7
3422
AIR
E1
G2
27QB
Q
60
16.7
334
COAL
049
1000
2415.0
287867
654
668.8
28783
1000
2415.0
911
1000
601.8
2617
27
815
316.9
27085
675
185.4
25866
552
106.6
24788
392
47.3
234328
249
21.0
223629
170
6.0
210430
109
1.2
1997
40
460
WEW
654
668.8
2617
22
654
668.8
25621
675
185.4
10318
552
106.6
13556
392
47.3
10725
249
21.0
13259
170
6.0
10757
1000
2415.0
2970
MAIN
1000
2415.0
0
2
1000
2415.0
110
618
10.0
3
9
119
5.8
35114
60
14.7
14
MK
109
1.2
2366
53
640
185.4
9
58
618
10.0
520
339
179.8
483
52
327
99.1
61815
815
316.9
12217
667
668.8
4
4
652
648.7
25663
433
648.7
256
89
816
316.9
12311
420
307.4
37965
379
307.4
379
80
373
179.8
48366
391
44.9
10769
232
44.9
107
78
228
20.2
23970
173
20.2
239
77
168
5.8
35171
109
236.6
23667
269
191.6
2366
73
327
99.1
298486
87
329
750.0
2984
85
415
720.0
298484
423
2860.0
2984
83
163
221.6
2366
16
222
206.6
2366
61
369
735.0
2984
74
494
2845.0
298432
E2
680
2700.0
2820
42
680
2700.0
14BLD
716
2625.0
2970
46
693
2700.0
2820
43
494
2805.0
298433
494
2795.0
14960
RSTOIC
FLAME
Q=0
NOZ
FSH
Q=359
FRH
Q=253
SPG
UECO
Q=144
PSH
Q=251
RHB
Q=264
DAMP
LECO
Q=143
SC1
Q=-40
SC23
Q=-20
SC4
Q=-52
PWQ=-38
PAFAN
W=1
AAHX
DENOX
ESPIDFAN
W=6
PREC
SLV
W=1
FGDPOND
SAFAN
W=2
SPA
SP1
HEATER
B3
Q=-1894
MILL
Q=0
SW
HP IP1 IP2 LP1 LP2 LP3 LP4 LP5
WMULTEG
EH
EI2EL1 EL2 EL3 EL4
GV
COND
Q=-1864
FSPLIT
SSR
VD
EI1
L2
V7 V6 V5 V3 V2 V1
CP
W=1
DEA
Q=-0
BFP1
W=2
BFP2
W=10
FWH1
Q=127
FWH2
Q=142
FWH3
Q=110
FWH6
Q=125
FWH7
Q=148
FWH8
Q=233
L1
M1
RGIBBS
B1
DRUM
Q=1381
DIVW
Q=451
ROOF
Q=147PRPBQ=38
FWV
SPQ
SPRAY
DPHRH
DPCRH
Temperature (F)
Pressure (psi)
Mass Flow Rate (Mlb/hr)
Duty (MMBtu/hr)
Power(MW)
Q Duty (MMBtu/hr)
W Power(MW)
ST=2415/1000/1000/2.5"Hg=460 MWCase: O2-PC-01, 05/30/2003
FGD
PC Boiler
60

Table 4.2.2 – Case 1 (Air-Fired Reference) Boundary Conditions and Results
amb dP-air "H2O ST resultelevation, ft 0 AAHX 4.0 main P, psia 2415 net power, MWe 418amb T, F 60 duct 6.0 main T, F 1000 net eff, % 36.68amb P, psia 14.7 nozzle 10.0 RH P, psia 602 gross @ST, MW 460RH, % 60 sum 20.0 RH T, F 1000 aux power, MW 42.1
FWHs 7 as % 9.2air %v dp-gas "H2O end wet, % 9.9O2 20.74 FSH 0.5 end P, "Hg 2.5 HHV in, mmbtu 3890N2 77.3 FRH 0.5 Q to ST, mmbtu 3431Ar 0.93 RH 1.0 FWH F Q, cond, mmbtu 1864CO2 0.03 PSH 0.7 TD 5 boiler eff, % 88.2H2O 1.01 UECO 0.3 DC 10 ST cycle eff, % 45.78
sum 100.0 ECO 2.0 FW T 494 Generator eff, % 98.3AAHX 1.6
coal %w Damper 4.3 DeSuperheat air, klb 3422C 63.75 BHG 5.5 SH, % 5 coal, klb 334H 4.5 FGD 12.0 water T, F 494 sorb, klb 26O 6.88 sum 28.4 flue gas, klb 3721N 1.25 Boiler O2, % 3.0S 2.51 dP "H2O UBC, % 1.0 H2O, % 8.5A 9.99 PAFan 60 margin, % 0.5 CO, ppmv 71M 11.12 IDFan 28 radiation, % 0.22 NOx, ppmv 733V 34.99 SAFan 20 Exa, % 18 SOx, ppmv 2082F 44.19 flame T, F 3839 after FGD 42
sum 100.0 eff % stack T, F 292 Ash, klb 34FDFan 75 blowdown, % 0.5 C, % 6.0
fuel HHV btu/lb IDFan 70 miller exit T, F 258given 11666 CWPump 80 main st flow, klb 2970aspen 11631 BFPump 80 FGD & SCR RH st flow, klb 2878
Motor/mechanic 95 L/G 10 end st flow, klb 1997sorb %w Ca/S 1.05CaCO3 100 air % Excess air, % 85 DeSOx, % 98
PA 20 NH3/NOx 1.0 DeNOx, % 90
SETUPS & RESULTS
61

Table 4.2.3 – Auxiliary Power Requirements for Case 1
Aux power MWecondensed water pump 0.6LP feed water pump 2.5HP feed water pump 9.8circulating water pump 3.9FGD pump 0.7PA Fan 1.5SA Fan 2.0ID Fan 5.6FGD Fan 4.1cooling tower Fan 2.1coal handling 2.1sorb handling 0.8ash handling + ESP 1.8others (=1%) 4.6total 42.1
62
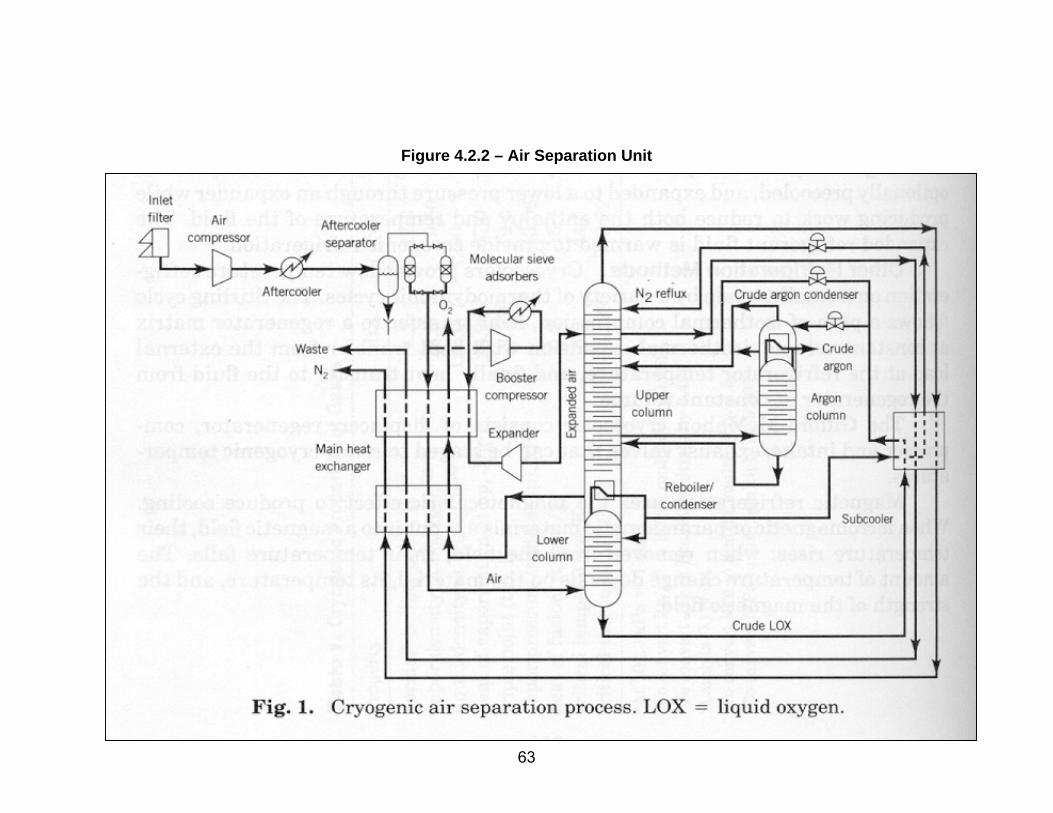
Figure 4.2.2 – Air Separation Unit
63

Figure 4.2.3 – ASPEN ASU Model
AS4
15.
64O
Q=-
Q=-
6
14.
278AI
48
90.
278
9
A
6
90.
278
A
4
15.
214N
DIST
W=8
PCOM
64

Figure 4.2.4 – Case 2 Cycle Diagram
65
486
14.7
3756
A6
3585
14.7
3755G1
253
16.6
1018A5
590
15.4
2739
A4
2135
14.7
3755G3
848
2613.0
2969
471839
14.7
3755
1005
2516.0
2969
48
825
635.8
2617
24
1804
14.7
3755
1591
14.7
3755
G6
1001
627.8
2617
26
1573
14.7
3755
G7
1573
14.7
1389G8
G9
1110
14.6
2178G12
543
2775.0
2834
35
838
14.6
2178G13
591
2765.0
283441
1493
14.7
2178G10
696
2675.0
282044
740
2625.0
282045
653
655.8
261723
937
14.6
1389G11
897
14.7
18881
878
14.5
3755G14
494
2795.0
283434720
14.4
3755G15
83
14.8
685
PA
109
17.0
685A2
720
14.3
3755G16
92
15.6
2739A1
590
16.9
685A3
310
14.3
3755
60
20.0
0
NH3
310
14.1
3721
G18
310
14.1
34ASH
326
15.1
3721
G19
326
15.1
0
G20
100
29.7
0
L2100
14.7
0
125
14.7
0STK1
125
14.7
0
LIQ
60
14.7
0SORB
100
14.7
0
83
14.8
2739
SA
44
15.0
791
O2
95
14.8
2632
RY2
E1
G2
29
Q
60
16.7
333
COAL
326
15.1
3665G21
326
15.1
56BYP
90
14.9
3665
G22
90
14.9
3503
G23
90
14.9
162W1
90
14.8
927
STK2
90
14.8
2576RY1
60
14.7
3422AIR
400
67.0
3422
90
60
67.0
3422
A0
44
15.0
2631N2
1000
2415.0
287867
654
668.8
28783
1000
2415.0
911
1000
602.0
2617
27
816
316.9
2708
675
185.4
2586
552
106.6
2478
392
47.3
2343
249
21.0
2236
170
6.0
2104
109
1.2
1997
40
460
WEW
654
668.8
2617
22
654
668.8
25621
675
185.4
10318
552
106.6
13556
392
47.3
10725
249
21.0
13259
170
6.0
10757
1000
2415.0
2970
MAIN
1000
2415.0
0
2
1000
2415.0
110
618
10.0
3
9
119
5.8
35114
60
14.7
14
MK
109
1.2
2366
53
640
185.4
9
58
618
10.0
520
339
179.8
483
52327
99.1
61815
816
316.9
12217
667
668.8
4
4
652
648.7
25663
433
648.7
256
89
816
316.9
12311
420
307.4
37965
379
307.4
379
80373
179.8
48366
391
44.9
10769
233
44.9
107
78228
20.2
23970
173
20.2
239
77168
5.8
35171
109
236.6
23667
269
191.6
2366
73
327
99.1
2984
87
329
750.0
2984
85
415
720.0
298484
423
2860.0
2984
83
163
221.6
2366
16
223
206.6
2366
61
369
735.0
2984
74494
2845.0
298432
680
2700.0
2820
42
680
2700.0
14BLD
716
2625.0
2969
46
693
2700.0
2820
43
494
2805.0
2984
494
2795.0
14960
1000
601.8
2617
19
RSTOIC
FLAME
Q=0
NOZ
FSH
Q=359
FRH
Q=253
SPG
UECO
Q=170
PSH
Q=251
RHB
Q=264
DAMP
LECO
Q=164
SC1
Q=-42
SC23
Q=-21
SC4
Q=-54
PWQ=-38
PAFAN
W=1
AAHX
DENOX
ESP IDFAN
W=4
PREC
SLV
W=0
FGD POND
SAFAN
W=2
SPA
SP1
HEATER
B3
Q=-1843
MILL
Q=0
SPF
COL
Q=-361 SEP1
Q=0
RECY
GRH
COMP
W=83
DIST
Q=-4
AC
Q=-298
HP IP1 IP2 LP1 LP2 LP3 LP4 LP5
WMULT
EG
EH
EI2EL1 EL2 EL3 EL4
GV
COND
Q=-1864
FSPLIT
SSR
VD
EI1
L2
V7 V6 V5 V3 V2 V1
CP
W=1
DEA
Q=-0
BFP1
W=2
BFP2
W=10
FWH1
Q=127
FWH2
Q=142
FWH3
Q=110
FWH6
Q=125
FWH7
Q=148
FWH8
Q=233
L1
M1
RGIBBS
B1
DRUM
Q=1334
DIVW
Q=451
ROOF
Q=147PRPBQ=38
FWV
SPQ
SPRAY
DPHRH
DPCRH
Temperature (F)
Pressure (psi)
Mass Flow Rate (Mlb/hr)
Duty (MMBtu/hr)
Power(MW)
Q Duty (MMBtu/hr)
W Power(MW)
ST=2415/1000/1000/2.5"Hg=460 MWCase: O2-PC-02, 06/05/2003
FGD
PC Boiler
ASU

Figure 4.2.5 – Case 3 Cycle Diagram
487
14.7
3756
A6
3552
14.7
3755G1
254
16.6
1018A5
590
15.4
2739
A4
2135
14.7
3755G3
848
2613.0
2969
47
1843
14.7
3755
G4
1005
2516.0
2969
48
825
635.8
2617
24
1808
14.7
3755
G5
1597
14.7
3755
G6
1001
627.8
2617
26
1579
14.7
3755
G7
1579
14.7
1389G8
G9
1121
14.6
2178G12
546
2775.0
2834
35
838
14.6
2178G13
595
2765.0
283441
1499
14.7
2178G10
696
2675.0
282044
740
2625.0
282045
653
655.8
261723
951
14.6
1389G11912
14.7
18881
884
14.5
3755G14
494
2795.0
283434
720
14.4
3755G15
84
14.8
685
PA
109
17.0
685A2
720
14.3
3755G16
93
15.6
2739A1
590
16.9
685A3
313
14.3
3755
G17
60
20.0
0
NH3
313
14.1
3721
G18
313
14.1
34ASH
328
15.1
3721
G19
328
15.1
0
G20
100
29.7
0
L2
100
14.7
0L1
128
14.7
0STK1
128
14.7
0
LIQ
60
14.7
0SORB
100
14.7
0
SLV
84
14.8
2739
SA 44
15.0
689
O2
95
14.8
2734
RY2
E1
G2
28QB
Q
60
16.7
333
COAL
328
15.1
3665G21
328
15.1
56BYP
90
14.9
3665
G22
90
14.9
3498
G23
90
14.9
167W1
90
14.8
820
STK2
90
14.8
2678RY1
60
14.7
2981AIR
400
67.0
2981
9060
67.0
2981
A0
44
15.0
2292N2
1000
2415.0
287867
654
668.8
28783
1000
2415.0
911
1000
602.0
2617
27
816
316.9
27085
675
185.4
25866
552
106.6
24788
392
47.3
234328
249
21.0
223629
170
6.0
210430
109
1.2
1997
40
460
WEW
654
668.8
2617
22
654
668.8
25621
675
185.4
10318
552
106.6
13556
392
47.3
10725
249
21.0
13259
170
6.0
10757
1000
2415.0
2970
MAIN
1000
2415.0
0
2
1000
2415.0
110
618
10.0
3
9
119
5.8
35114
60
14.7
14
MK
109
1.2
2366
53
640
185.4
9
58
618
10.0
520339
179.8
483
52
327
99.1
61815
816
316.9
12217
667
668.8
4
4
652
648.7
25663
433
648.7
256
89
816
316.9
12311
420
307.4
37965
379
307.4
379
80
373
179.8
48366
391
44.9
10769
233
44.9
107
78
228
20.2
23970
173
20.2
239
77
168
5.8
35171
109
236.6
23667
269
191.6
2366
73
327
99.1
298486
87
329
750.0
2984
85
415
720.0
298484
423
2860.0
2984
83
163
221.6
2366
16
223
206.6
2366
61
369
735.0
2984
74
494
2845.0
298432
E2
680
2700.0
2820
42
680
2700.0
14BLD
716
2625.0
2969
46
693
2700.0
2820
43
494
2805.0
298433
494
2795.0
14960
1000
601.8
2617
19
RSTOIC
FLAME
Q=0
NOZ
FSH
Q=359
FRH
Q=253
SPG
UECO
Q=178
PSH
Q=251
RHB
Q=264
DAMP
LECO
Q=172
SC1
Q=-42
SC23
Q=-21
SC4
Q=-55
PWQ=-38
PAFAN
W=1
AAHX
DENOX
ESP IDFAN
W=4
PREC
SLV
W=0
FGDPOND
SAFAN
W=1
SPA
SP1
HEATER
B3
Q=-1826
MILL
Q=0
SPF
COL
Q=-365SEP1
Q=0
RECY
GRH
COMP
W=72
DIST
Q=-4
AC
Q=-260
HP IP1 IP2 LP1 LP2 LP3 LP4 LP5
W MULT
EG
EH
EI2EL1 EL2 EL3 EL4
GV
COND
Q=-1864
FSPLIT
SSR
VD
EI1
L2
V7 V6 V5 V3 V2 V1
CP
W=1
DEA
Q=-0
BFP1
W=2
BFP2
W=10
FWH1
Q=127
FWH2
Q=142
FWH3
Q=110
FWH6
Q=125
FWH7
Q=148
FWH8
Q=233
L1
M1
RGIBBS
B1
DRUM
Q=1318
DIVW
Q=451
ROOF
Q=147PRPB
Q=38
FWV
SPQ
SPRAY
DPHRH
DPCRH
Temperature (F)
Pressure (psi)
Mass Flow Rate (Mlb/hr)
Duty (MMBtu/hr)
Power(MW)
Q Duty (MMBtu/hr)
W Power(MW)
ST=2415/1000/1000/2.5"Hg=460 MWCase: O2-PC-03, 06/05/2003
FGD
PC Boiler
ASU
66

Figure 4.2.6 – Case 4 Cycle Diagram
482
14.7
3560
A6
3687
14.7
3559G1
243
16.6
978A5
590
15.4
2583
A4
2135
14.7
3559G3
848
2613.0
2969
47
1827
14.7
3559
G4
1005
2516.0
2969
48
825
635.8
2617
24
1792
14.7
3559
G5
1570
14.7
3559
G6
1001
627.8
2617
26
1552
14.7
3559
G7
1552
14.7
1317G8
G9
1072
14.6
2064G12
535
2775.0
2834
35
838
14.6
2064G13
575
2765.0
283441
1472
14.7
2064G10
696
2675.0
282044
740
2625.0
282045
653
655.8
261723
885
14.6
1317G11843
14.7
17881
856
14.5
3559G14
494
2795.0
283434
720
14.4
3559G15
84
14.8
646
PA
109
17.0
646A2
720
14.3
3559G16
92
15.6
2583A1
590
16.9
646A3
315
14.3
3559
G17
60
20.0
0
NH3
315
14.1
3525
G18
315
14.1
34ASH
331
15.1
3525
G19
331
15.1
0
G20
100
29.7
0
L2
100
14.7
0L1
128
14.7
0STK1
128
14.7
0
LIQ
60
14.7
0SORB
100
14.7
0
SLV
84
14.8
2583
SA 44
15.0
687
O2
95
14.8
2541
RY2
E1
G2
24QB
Q
60
16.7
332
COAL
331
15.1
3472G21
331
15.1
53BYP
90
14.9
3472
G22
90
14.9
3306
G23
90
14.9
166W1
90
14.8
818
STK2
90
14.8
2488RY1
60
14.7
2972AIR
400
67.0
2972
9060
67.0
2972
A0
44
15.0
2285N2
1000
2415.0
287867
654
668.8
28783
1000
2415.0
911
1000
602.0
2617
27
816
316.9
27085
675
185.4
25866
552
106.6
24788
392
47.3
234328
249
21.0
223629
170
6.0
210430
109
1.2
1997
40
460
WEW
654
668.8
2617
22
654
668.8
25621
675
185.4
10318
552
106.6
13556
392
47.3
10725
249
21.0
13259
170
6.0
10757
1000
2415.0
2970
MAIN
1000
2415.0
0
2
1000
2415.0
110
618
10.0
3
9
119
5.8
35114
60
14.7
14
MK
109
1.2
2366
53
640
185.4
9
58
618
10.0
520339
179.8
483
52
327
99.1
61815
816
316.9
12217
667
668.8
4
4
652
648.7
25663
433
648.7
256
89
816
316.9
12311
420
307.4
37965
379
307.4
379
80
373
179.8
48366
391
44.9
10769
233
44.9
107
78
228
20.2
23970
173
20.2
239
77
168
5.8
35171
109
236.6
23667
269
191.6
2366
73
327
99.1
298486
87
329
750.0
2984
85
415
720.0
298484
423
2860.0
2984
83
163
221.6
2366
16
223
206.6
2366
61
369
735.0
2984
74
494
2845.0
298432
E2
680
2700.0
2820
42
680
2700.0
14BLD
716
2625.0
2969
46
693
2700.0
2820
43
494
2805.0
298433
494
2795.0
14960
1000
601.8
2617
19
RSTOIC
FLAME
Q=0
NOZ
FSH
Q=359
FRH
Q=253
SPG
UECO
Q=139
PSH
Q=251
RHB
Q=264
DAMP
LECO
Q=135
SC1
Q=-40
SC23
Q=-20
SC4
Q=-52
PWQ=-38
PAFAN
W=1
AAHX
DENOX
ESP IDFAN
W=4
PREC
SLV
W=0
FGDPOND
SAFAN
W=1
SPA
SP1
HEATER
B3
Q=-1904
MILL
Q=0
SPF
COL
Q=-356SEP1
Q=0
RECY
GRH
COMP
W=72
DIST
Q=-4
AC
Q=-259
HP IP1 IP2 LP1 LP2 LP3 LP4 LP5
W MULTEG
EH
EI2EL1 EL2 EL3 EL4
GV
COND
Q=-1864
FSPLIT
SSR
VD
EI1
L2
V7 V6 V5 V3 V2 V1
CP
W=1
DEA
Q=-0
BFP1
W=2
BFP2
W=10
FWH1
Q=127
FWH2
Q=142
FWH3
Q=110
FWH6
Q=125
FWH7
Q=148
FWH8
Q=233
L1
M1
RGIBBS
B1
DRUM
Q=1394
DIVW
Q=451
ROOF
Q=147PRPBQ=38
FWV
SPQ
SPRAY
DPHRH
DPCRH
Temperature (F)
Pressure (psi)
Mass Flow Rate (Mlb/hr)
Duty (MMBtu/hr)
Power(MW)
Q Duty (MMBtu/hr)
W Power(MW)
ST=2415/1000/1000/2.5"Hg=460 MWCase: O2-PC-04, 06/05/2003
FGD
PC Boiler
ASU
67

Figure 4.2.7 – Case 5 Cycle Diagram
471
14.7
3204
A6
3978
14.7
3203G1
220
16.6
906A5
590
15.4
2298
A4
2135
14.7
3203G3
848
2613.0
2969
47
1794
14.7
3203
G4
1005
2516.0
2969
48
825
635.8
2617
24
1759
14.7
3203
G5
1512
14.7
3203
G6
1001
627.8
2617
26
1494
14.7
3203
G7
1494
14.7
1185G8
G9
965
14.6
1858G12
515
2775.0
2834
35
838
14.6
1858G13
535
2765.0
283441
1414
14.7
1858G10
696
2675.0
282044
740
2625.0
282045
653
655.8
261723
744
14.6
1185G11696
14.7
16081
796
14.5
3203G14
494
2795.0
283434
720
14.4
3203G15
83
14.8
575
PA
108
17.0
575A2
720
14.3
3203G16
91
15.6
2298A1
590
16.9
575A3
321
14.3
3203
G17
60
20.0
0
NH3
321
14.1
3169
G18
321
14.1
34ASH
337
15.1
3169
G19
337
15.1
0
G20
100
29.7
0
L2
100
14.7
0L1
129
14.7
0STK1
129
14.7
0
LIQ
60
14.7
0SORB
100
14.7
0
SLV
83
14.8
2298
SA 44
15.0
685
O2
96
14.8
2188
RY2
E1
G2
25QB
Q
60
16.7
331
COAL
337
15.1
3121G21
337
15.1
48BYP
90
14.9
3121
G22
90
14.9
2955
G23
90
14.9
166W1
90
14.8
815
STK2
90
14.8
2140RY1
60
14.7
2963AIR
400
67.0
2963
9060
67.0
2963
A0
44
15.0
2278N2
1000
2415.0
287867
654
668.8
28783
1000
2415.0
911
1000
602.0
2617
27
816
316.9
27085
675
185.4
25866
552
106.6
24788
392
47.3
234328
249
21.0
223629
170
6.0
210430
109
1.2
1997
40
460
WEW
654
668.8
2617
22
654
668.8
25621
675
185.4
10318
552
106.6
13556
392
47.3
10725
249
21.0
13259
170
6.0
10757
1000
2415.0
2970
MAIN
1000
2415.0
0
2
1000
2415.0
110
618
10.0
3
9
119
5.8
35114
60
14.7
14
MK
109
1.2
2366
53
640
185.4
9
58
618
10.0
520339
179.8
483
52
327
99.1
61815
816
316.9
12217
667
668.8
4
4
652
648.7
25663
433
648.7
256
89
816
316.9
12311
420
307.4
37965
379
307.4
379
80
373
179.8
48366
391
44.9
10769
233
44.9
107
78
228
20.2
23970
173
20.2
239
77
168
5.8
35171
109
236.6
23667
269
191.6
2366
73
327
99.1
298486
87
329
750.0
2984
85
415
720.0
298484
423
2860.0
2984
83
163
221.6
2366
16
223
206.6
2366
61
369
735.0
2984
74
494
2845.0
298432
E2
680
2700.0
2820
42
680
2700.0
14BLD
716
2625.0
2969
46
693
2700.0
2820
43
494
2805.0
298433
494
2795.0
14960
1000
601.8
2617
19
RSTOIC
FLAME
Q=0
NOZ
FSH
Q=359
FRH
Q=253
SPG
UECO
Q=68
PSH
Q=251
RHB
Q=264
DAMP
LECO
Q=68
SC1
Q=-36
SC23
Q=-18
SC4
Q=-46
PWQ=-38
PAFAN
W=1
AAHX
DENOX
ESP IDFAN
W=4
PREC
SLV
W=0
FGDPOND
SAFAN
W=1
SPA
SP1
HEATER
B3
Q=-2055
MILL
Q=0
SPF
COL
Q=-342SEP1
Q=0
RECY
GRH
COMP
W=72
DIST
Q=-4
AC
Q=-258
HP IP1 IP2 LP1 LP2 LP3 LP4 LP5
W MULTEG
EH
EI2EL1 EL2 EL3 EL4
GV
COND
Q=-1864
FSPLIT
SSR
VD
EI1
L2
V7 V6 V5 V3 V2 V1
CP
W=1
DEA
Q=-0
BFP1
W=2
BFP2
W=10
FWH1
Q=127
FWH2
Q=142
FWH3
Q=110
FWH6
Q=125
FWH7
Q=148
FWH8
Q=233
L1
M1
RGIBBS
B1
DRUM
Q=1533
DIVW
Q=451
ROOF
Q=147PRPBQ=38
FWV
SPQ
SPRAY
DPHRH
DPCRH
Temperature (F)
Pressure (psi)
Mass Flow Rate (Mlb/hr)
Duty (MMBtu/hr)
Power(MW)
Q Duty (MMBtu/hr)
W Power(MW)
ST=2415/1000/1000/2.5"Hg=460 MWCase: O2-PC-05, 06/05/2003
FGD
PC Boiler
ASU
68

Figure 4.2.8 – Case 6 Cycle Diagram
69
474
14.7
2839
A6
4337
14.7
2838G1
205
16.6
830A5
610
15.4
2009
A4
2135
14.7
2838G3
848
2643.0
2969
47
1750
14.7
2838
G4
1005
2546.0
2969
48
794
635.8
2617
24
1715
14.7
2838
G5
1384
14.7
2838
G6
1001
627.8
2617
26
1366
14.7
2838
G7
1366
14.7
1050G8
G9
776
14.6
1646G12
494
2795.0
2834
35
776
14.6
1646G13
494
2795.0
283441
1286
14.7
1646G10
697
2705.0
282044
740
2655.0
282045
653
655.8
261723
655
14.6
1050G11409
14.7
14281
714
14.5
2838G14
494
2795.0
283434
714
14.5
2838G15
81
14.8
502
PA
106
17.0
502A2
714
14.4
2838G16
90
15.6
2009A1
610
16.9
502A3
303
14.3
2838
G17
60
20.0
0
NH3
303
14.1
2804
G18
303
14.1
34ASH
317
15.1
2804
G19
317
15.1
0
G20
100
29.7
0
L2
100
14.7
0L1
129
14.7
0STK1
129
14.7
0
LIQ
60
14.7
0SORB
100
14.7
0
SLV
81
14.8
2009
SA 44
15.0
679
O2
96
14.8
1832
RY2
E1
G2
25QB
Q
60
16.7
328
COAL
317
15.1
2762G21
317
15.1
42BYP
90
14.9
2762
G22
90
14.9
2598
G23
90
14.9
164W1
90
14.8
808
STK2
90
14.8
1790RY1
60
14.7
2936AIR
400
67.0
2936
9060
67.0
2936
A0
44
15.0
2257N2
1000
2415.0
287867
654
668.8
28783
1000
2415.0
911
1000
602.0
2617
27
816
316.9
27085
675
185.4
25866
552
106.6
24788
392
47.3
234328
249
21.0
223629
170
6.0
210430
109
1.2
1997
40
460
WEW
654
668.8
2617
22
654
668.8
25621
675
185.4
10318
552
106.6
13556
392
47.3
10725
249
21.0
13259
170
6.0
10757
1000
2415.0
2970
MAIN
1000
2415.0
0
2
1000
2415.0
110
618
10.0
3
9
119
5.8
35114
60
14.7
14
MK
109
1.2
2366
53
640
185.4
9
58
618
10.0
520339
179.8
483
52
327
99.1
61815
816
316.9
12217
667
668.8
4
4
652
648.7
25663
433
648.7
256
89
816
316.9
12311
420
307.4
37965
379
307.4
379
80
373
179.8
48366
391
44.9
10769
233
44.9
107
78
228
20.2
23970
173
20.2
239
77
168
5.8
35171
109
236.6
23667
269
191.6
2366
73
327
99.1
298486
87
329
750.0
2984
85
415
720.0
298484
423
2860.0
2984
83
163
221.6
2366
16
223
206.6
2366
61
369
735.0
2984
74
494
2845.0
298432
E2
681
2730.0
2820
42
681
2730.0
14BLD
717
2655.0
2969
46
694
2730.0
2820
43
494
2805.0
298433
494
2795.0
14960
1000
601.8
2617
19
RSTOIC
FLAME
Q=0
NOZ
FSH
Q=361
FRH
Q=298
SPG
UECO
Q=0
PSH
Q=247
RHB
Q=219
DAMP
LECO
Q=0
SC1
Q=-32
SC23
Q=-16
SC4
Q=-41
PWQ=-39
PAFAN
W=1
AAHX
DENOX
ESP IDFAN
W=3
PREC
SLV
W=0
FGDPOND
SAFAN
W=1
SPA
SP1
HEATER
B3
Q=-2201
MILL
Q=0
SPF
COL
Q=-307SEP1
Q=0
RECY
GRH
COMP
W=71
DIST
Q=-4
AC
Q=-256
HP IP1 IP2 LP1 LP2 LP3 LP4 LP5
W MULTEG
EH
EI2EL1 EL2 EL3 EL4
GV
COND
Q=-1864
FSPLIT
SSR
VD
EI1
L2
V7 V6 V5 V3 V2 V1
CP
W=1
DEA
Q=-0
BFP1
W=2
BFP2
W=10
FWH1
Q=127
FWH2
Q=142
FWH3
Q=110
FWH6
Q=125
FWH7
Q=148
FWH8
Q=233
L1
M1
RGIBBS
B1
DRUM
Q=1657
DIVW
Q=455
ROOF
Q=152PRPBQ=39
FWV
SPQ
SPRAY
DPHRH
DPCRH
Temperature (F)
Pressure (psi)
Mass Flow Rate (Mlb/hr)
Duty (MMBtu/hr)
Power(MW)
Q Duty (MMBtu/hr)
W Power(MW)
ST=2415/1000/1000/2.5"Hg=460 MWCase: O2-PC-06, 06/05/2003
FGD
PC Boiler
ASU
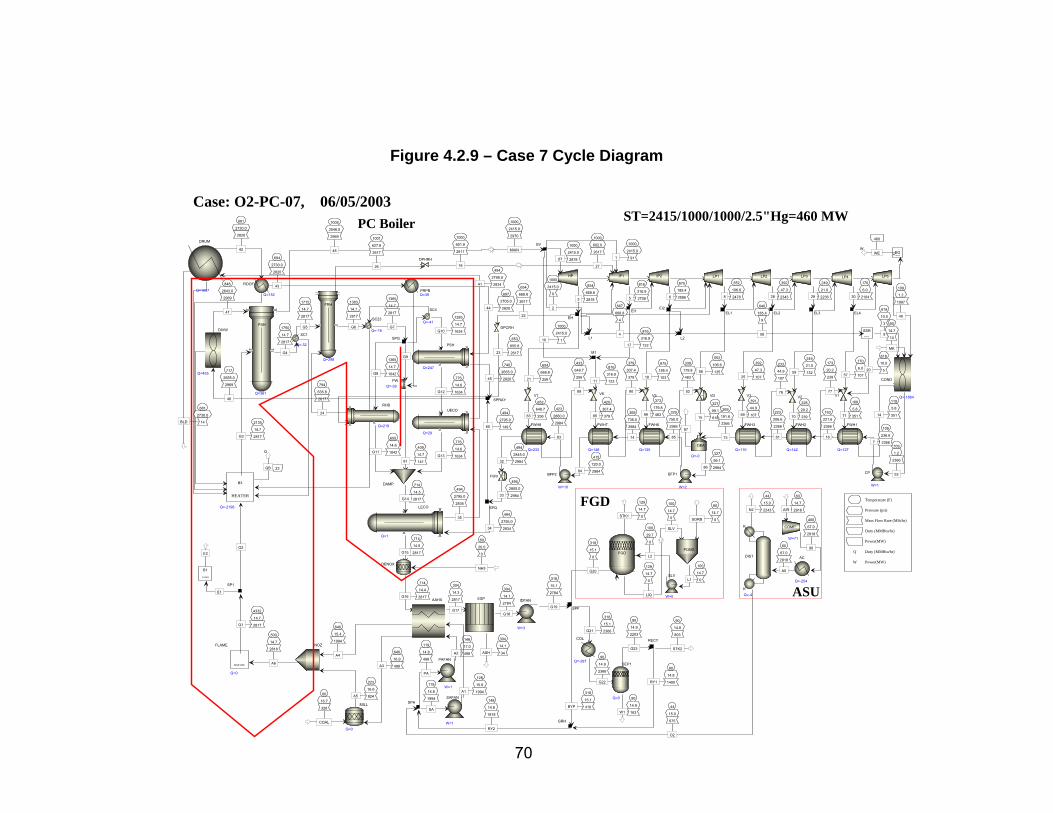
Figure 4.2.9 – Case 7 Cycle Diagram
500
14.7
2818
A6
4332
14.7
2817G1
223
16.6
824A5
640
15.4
1994
A4
2135
14.7
2817G3
848
2643.0
2969
47
1750
14.7
2817
G4
1005
2546.0
2969
48
794
635.8
2617
24
1715
14.7
2817
G5
1383
14.7
2817
G6
1001
627.8
2617
26
1365
14.7
2817
G7
1365
14.7
1042G8
G9
776
14.6
1634G12
494
2795.0
2834
35
776
14.6
1634G13
494
2795.0
283441
1285
14.7
1634G10
697
2705.0
282044
740
2655.0
282045
653
655.8
261723
655
14.6
1042G11409
14.7
14181
714
14.5
2817G14
494
2795.0
283434
714
14.5
2817G15
119
14.8
498
PA
146
17.0
498A2
714
14.4
2817G16
128
15.6
1994A1
640
16.9
498A3
304
14.3
2817
G17
60
20.0
0
NH3
304
14.1
2784
G18
304
14.1
34ASH
318
15.1
2784
G19
318
15.1
0
G20
100
29.7
0
L2
100
14.7
0L1
129
14.7
0STK1
129
14.7
0
LIQ
60
14.7
0SORB
100
14.7
0
SLV
119
14.8
1994
SA44
15.0
675
O2
148
14.8
1818
RY2
E1
G2
23QB
Q
60
16.7
326
COAL
318
15.1
2366G21
318
15.1
418BYP
90
14.9
2366
G22
90
14.9
2203
G23
90
14.9
163W1
90
14.8
803
STK2
90
14.8
1400RY1
60
14.7
2918AIR
400
67.0
2918
9060
67.0
2918
A0
44
15.0
2243N2
1000
2415.0
287867
654
668.8
28783
1000
2415.0
911
1000
602.0
2617
27
816
316.9
27085
675
185.4
25866
552
106.6
24788
392
47.3
234328
249
21.0
223629
170
6.0
210430
109
1.2
1997
40
460
WEW
654
668.8
2617
22
654
668.8
25621
675
185.4
10318
552
106.6
13556
392
47.3
10725
249
21.0
13259
170
6.0
10757
1000
2415.0
2970
MAIN
1000
2415.0
0
2
1000
2415.0
110
618
10.0
3
9
119
5.8
35114
60
14.7
14
MK
109
1.2
2366
53
640
185.4
9
58
618
10.0
520
339
179.8
483
52
327
99.1
61815
816
316.9
12217
667
668.8
4
4
652
648.7
25663
433
648.7
256
89
816
316.9
12311
420
307.4
37965
379
307.4
379
80
373
179.8
48366
391
44.9
10769
233
44.9
107
78
228
20.2
23970
173
20.2
239
77
168
5.8
35171
109
236.6
23667
269
191.6
2366
73
327
99.1
298486
87
329
750.0
2984
85
415
720.0
298484
423
2860.0
2984
83
163
221.6
2366
16
223
206.6
2366
61
369
735.0
2984
74
494
2845.0
298432
E2
681
2730.0
2820
42
681
2730.0
14BLD
717
2655.0
2969
46
694
2730.0
2820
43
494
2805.0
298433
494
2795.0
14960
1000
601.8
2617
19
RSTOIC
FLAME
Q=0
NOZ
FSH
Q=361
FRH
Q=298
SPG
UECO
Q=29
PSH
Q=247
RHB
Q=219
DAMP
LECO
Q=1
SC1
Q=-32
SC23
Q=-16
SC4
Q=-41
PWQ=-39
PAFAN
W=1
AAHX
DENOX
ESP IDFAN
W=3
PREC
SLV
W=0
FGDPOND
SAFAN
W=1
SPA
SP1
HEATER
B3
Q=-2198
MILL
Q=0
SPF
COL
Q=-287SEP1
Q=0
RECY
GRH
COMP
W=71
DIST
Q=-4
AC
Q=-254
HP IP1 IP2 LP1 LP2 LP3 LP4 LP5
WMULTEG
EH
EI2EL1 EL2 EL3 EL4
GV
COND
Q=-1864
FSPLIT
SSR
VD
EI1
L2
V7 V6 V5 V3 V2 V1
CP
W=1
DEA
Q=-0
BFP1
W=2
BFP2
W=10
FWH1
Q=127
FWH2
Q=142
FWH3
Q=110
FWH6
Q=125
FWH7
Q=148
FWH8
Q=233
L1
M1
RGIBBS
B1
DRUM
Q=1657
DIVW
Q=455
ROOF
Q=152PRPBQ=39
FWV
SPQ
SPRAY
DPHRH
DPCRH
Temperature (F)
Pressure (psi)
Mass Flow Rate (Mlb/hr)
Duty (MMBtu/hr)
Power(MW)
Q Duty (MMBtu/hr)
W Power(MW)
ST=2415/1000/1000/2.5"Hg=460 MWCase: O2-PC-07, 06/05/2003
FGD
PC Boiler
ASU
70

Table 4.2.4 – Parametric Cases Summary (Without CO2 Compression)
case 1 2 3 4 5 6 7ASU no yes yes yes yes yes yescoal to boiler, klb/h 334 333 333 332 331 328 326air to plant, klb/h 3422 3422 2981 2972 2963 2936 2918 O2 purity, % 20.7 99.6 99.6 99.6 99.6 99.6 99.6 O2 level to boiler, % 20.4 39.7 26.9 28.1 30.9 34.1 33.7 O2 level exit boiler, % 3.0 15.3 3.0 3.0 3.0 3.0 3.0 Net EXA, % 18.0 18.0 3.1 3.1 3.0 3.2 3.2 Boiler EXA, % 18.0 69.1 13.6 12.5 11.2 10.4 10.4adiabatic temperature, F 3687 3608 3574 3687 3978 4337 4332gas to boiler exit, klb/h 3721 3721 3721 3525 3169 2804 2784 gas to boiler exit, mmcft/h 237 181 175 167 151 134 135 gas recycle to boiler, klb/h 0 2632 2734 2541 2188 1832 1818gas T before IDFan, F 291 307 309 315 321 303 304Recycled gas T, F - 95 95 95 95 96 148gas exit system, klb/h 3721 927 820 818 815 808 803 CO2, %v 14.0 76.4 89.6 89.6 89.6 89.6 89.6ASU plant power, MW 0 83.0 72.3 72.1 71.8 71.2 70.7Aux power, MW 42.1 116.7 105.8 105.3 104.4 102.7 102.5Boiler eff, % 88.2 88.3 88.3 88.6 88.9 89.60 90.94Net eff (w/o CO2), % 36.68 30.19 31.15 31.29 31.46 31.90 32.12
71
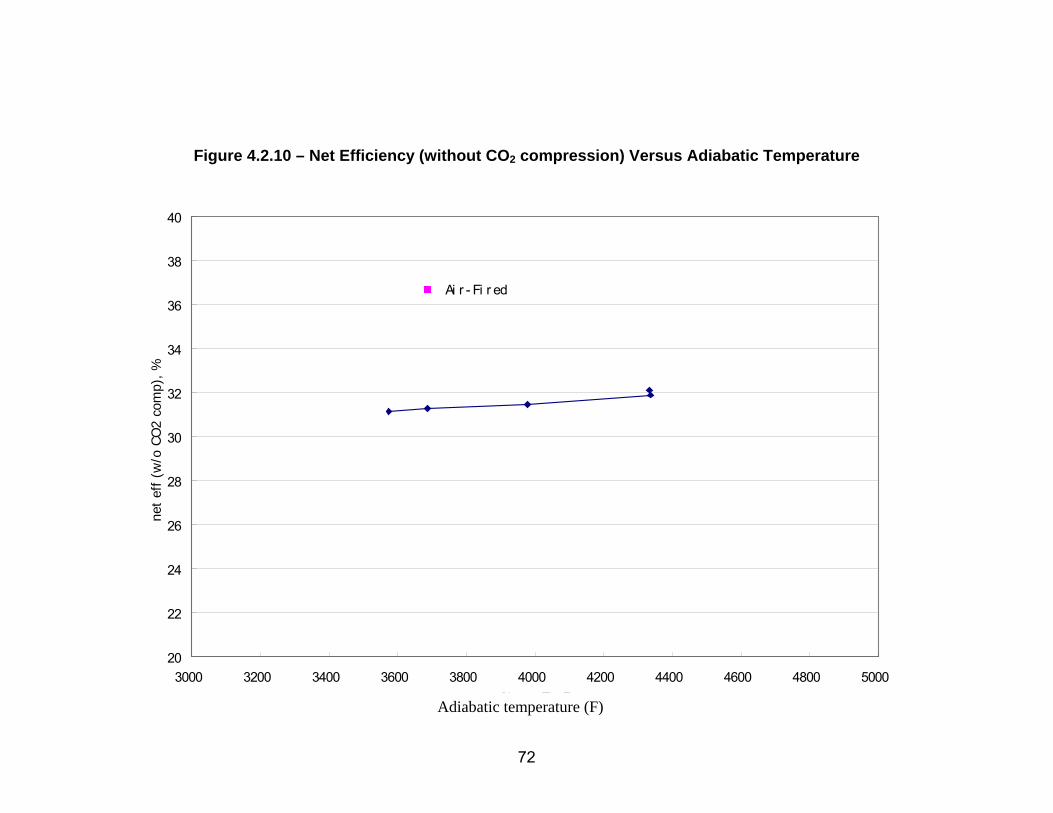
Figure 4.2.10 – Net Efficiency (without CO2 compression) Versus Adiabatic Temperature
20
22
24
26
28
30
32
34
36
38
40
3000 3200 3400 3600 3800 4000 4200 4400 4600 4800 5000f l ame T, F
net
eff
(w/o
CO
2 co
mp)
, %
Ai r - Fi r ed
Adiabatic temperature (F)
72

Figure 4.2.11 - ASU and Auxiliary Power Requirements Versus Adiabatic Temperature
0.0
20.0
40.0
60.0
80.0
100.0
120.0
3000 3200 3400 3600 3800 4000 4200 4400 4600
Adiabatic Temperature (F)
Pow
er (M
W)
ASU Aux. Air-Fired Aux.
73

Figure 4.2.12 – Recycled Gas Mass Flow Rate Versus Adiabatic Temperature
2000
2200
2400
2600
2800
3000
3200
3400
3600
3800
4000
3000 3200 3400 3600 3800 4000 4200 4400 4600 4800 5000
gas
flow
, klb
/hr
Air-fired
flame T, FAdiabatic temperature (F)
74
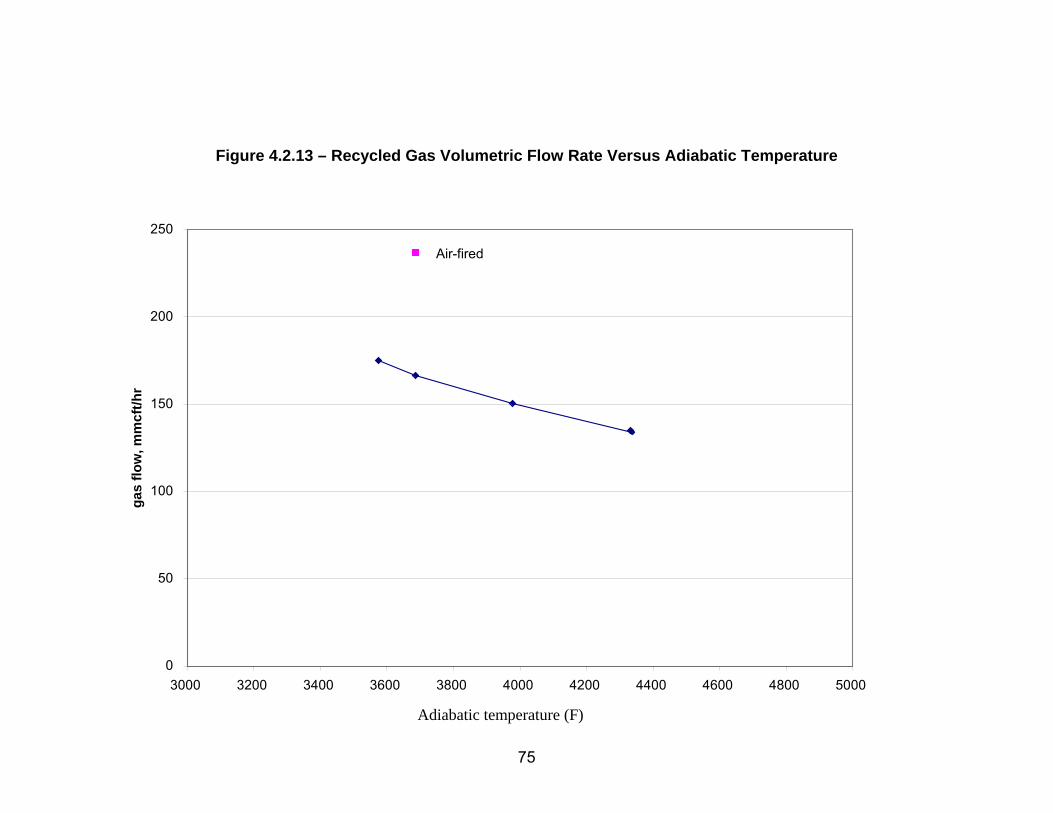
Figure 4.2.13 – Recycled Gas Volumetric Flow Rate Versus Adiabatic Temperature
0
50
100
150
200
250
3000 3200 3400 3600 3800 4000 4200 4400 4600 4800 5000
flame T, F
gas
flow
, mm
cft/h
r
Air-fired
Adiabatic temperature (F)
75
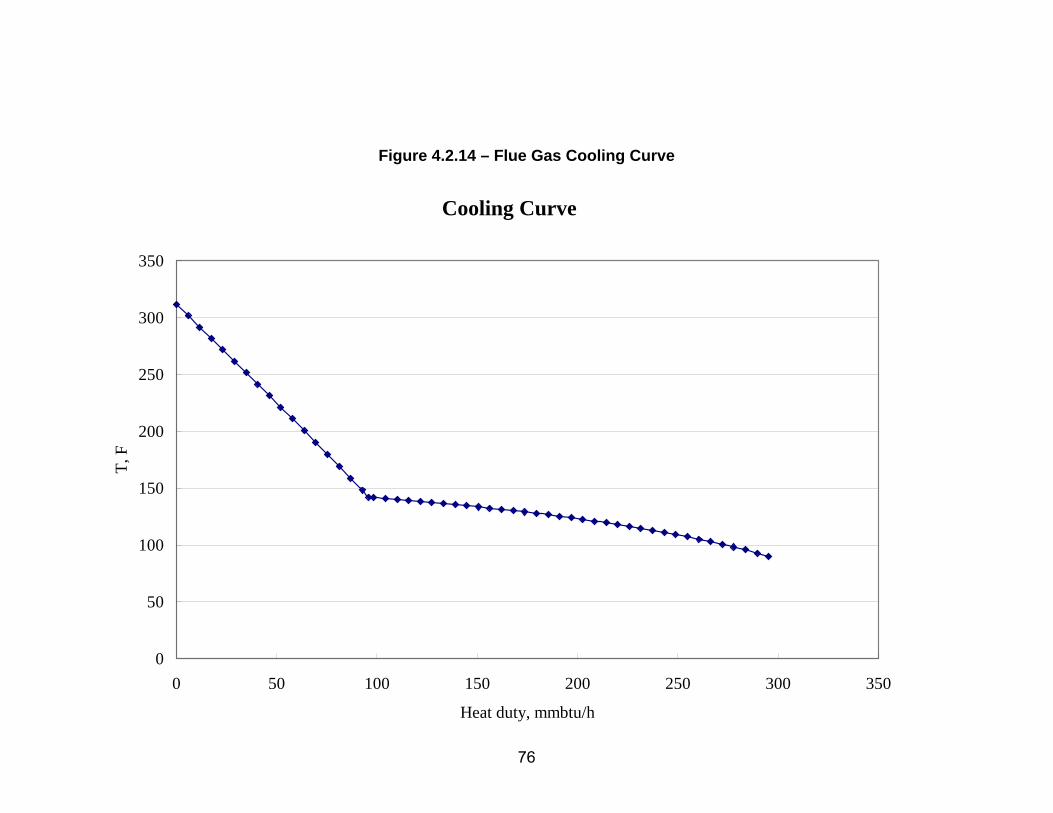
Figure 4.2.14 – Flue Gas Cooling Curve
Cooling Curve
0
50
100
150
200
250
300
350
0 50 100 150 200 250 300 350
Heat duty, mmbtu/h
T, F
76

Figure 4.2.15 – Case 8 Cycle Diagram
77
487
14.7
3756
A6
3573
14.7
3755G1
253
16.6
1018A5
590
15.4
2739
A4
2135
14.7
3755G3
848
2613.0
2969
47
1842
14.7
3755
G4
1005
2516.0
2969
48
825
635.8
2617
24
1807
14.7
3755
G5
1596
14.7
3755
G6
1001
627.8
2617
26
1578
14.7
3755
G7
1578
14.7
1389G8
G9
1118
14.6
2178G12
545
2775.0
2834
35
838
14.6
2178G13
594
2765.0
283441
1498
14.7
2178G10
696
2675.0
282044
740
2625.0
282045
653
655.8
261723
947
14.6
1389G11908
14.7
18881
882
14.5
3755G14
494
2795.0
283434
720
14.4
3755G15
85
14.8
685
PA
110
17.0
685A2
721
14.3
3755G16
93
15.6
2739A1
590
16.9
685A3
314
14.3
3755
G17
60
20.0
0
NH3
314
14.1
3722
G18
314
14.1
33ASH
330
15.1
3722
G19
330
15.1
0
G20
97
29.7
0
L2
98
14.7
0L1
120
14.7
0STK1
120
14.7
0
LIQ
60
14.7
0SORB
100
14.7
0
SLV
85
14.8
2739
SA46
15.0
689
O2
95
14.8
2734
RY2
E1
G2
44QB
Q
60
16.7
333
COAL
330
15.1
3722G21
330
15.1
3666C1
90
14.9
3666
C2
90
14.9
3508
C3
90
14.9
159D1
90
14.8
830
C4
90
14.8
2678
RY1
330
15.1
56BYP
60
14.7
2981AIR
400
67.0
2981
90
60
67.0
2981
A0
46
15.0
2292N2
282
50.5
830C5
80
49.5
820
C6
272
168.2
820C7
80
166.2
817
278
565.2
817C10
80
562.2
817
C11
297
2004.0
817C12
80
166.2
818
80
166.2
1D4
80
49.5
10D2
80
166.2
2D3
562.2
0D5
2000.0
0PIPE
80
2000.0
817
VT
1000
2415.0
287867
654
668.8
28783
1000
2415.0
911
1000
602.0
2617
27
816
316.9
27085
675
185.4
25866
552
106.6
24788
392
47.3
234328
249
21.0
223629
170
6.0
210430
109
1.2
1997
40
460
WEW
654
668.8
2617
22
654
668.8
25621
675
185.4
10318
552
106.6
13556
392
47.3
10725
249
21.0
13259
170
6.0
10757
1000
2415.0
2970
MAIN
1000
2415.0
02
1000
2415.0
1
10
618
10.0
3
9
119
5.8
35114
60
14.7
14
MK
109
1.2
2366
53
640
185.4
9
58
618
10.0
520
339
179.8
483
52
327
99.1
61815
816
316.9
12217
667
668.8
4
4
652
648.7
25663
433
648.7
256
89
816
316.9
12311
420
307.4
37965
379
307.4
379
80
373
179.8
48366
391
44.9
10769
233
44.9
107
78
228
20.2
23970
173
20.2
239
77
168
5.8
35171
109
236.6
23667
269
191.6
2366
73
327
99.1
298486
87
329
750.0
2984
85
415
720.0
298484
423
2860.0
2984
83
163
221.6
2366
16
223
206.6
2366
61
369
735.0
2984
74
494
2845.0
298432
E2
680
2700.0
2820
42
680
2700.0
14BLD
716
2625.0
2969
46
693
2700.0
2820
43
494
2805.0
298433
494
2795.0
14960
1000
601.8
2617
19
RSTOIC
FLAME
Q=0
NOZ
FSH
Q=359
FRH
Q=253
SPG
UECO
Q=176
PSH
Q=251
RHB
Q=264
DAMP
LECO
Q=169
SC1
Q=-42
SC23
Q=-21
SC4
Q=-55
PWQ=-38
PAFAN
W=1
AAHX
DENOX
ESP IDFAN
W=4
PREC
SLV
W=0
FGDPOND
SAFAN
W=1
SPA
SP1
HEATER
B3
Q=-1847
MILL
Q=0
SPF
COL1
Q=-380
SEP1
Q=0
RECY
GRH
COMP
W=72
DIST
Q=-3
AC
Q=-263
COMP1
W=10
COMP2
W=10
GBY
COMP3
W=9
COMP4
W=8
DEM
Q=-1
COL2
Q=-48
COL3
Q=-37
COL4
Q=-42
COL5
Q=-99
HP IP1 IP2 LP1 LP2 LP3 LP4 LP5
W MULTEG
EH
EI2EL1 EL2 EL3 EL4
GV
COND
Q=-1864
FSPLIT
SSR
VD
EI1
L2
V7 V6 V5 V3 V2 V1
CP
W=1
DEA
Q=-0
BFP1
W=2
BFP2
W=10
FWH1
Q=127
FWH2
Q=142
FWH3
Q=110
FWH6
Q=125
FWH7
Q=148
FWH8
Q=233
L1
M1
RGIBBS
B1
DRUM
Q=1323
DIVW
Q=451
ROOF
Q=147PRPBQ=38
FWV
SPQ
SPRAY
DPHRH
DPCRH
Temperature (F)
Pressure (psi)
Mass Flow Rate (Mlb/hr)
Duty (MMBtu/hr)
Power(MW)
Q Duty (MMBtu/hr)
W Power(MW)
ST=2415/1000/1000/2.5"Hg=460 MW
Case: O2-PC-11, 08/04/2003
FGD
PC Boiler
ASUCO2
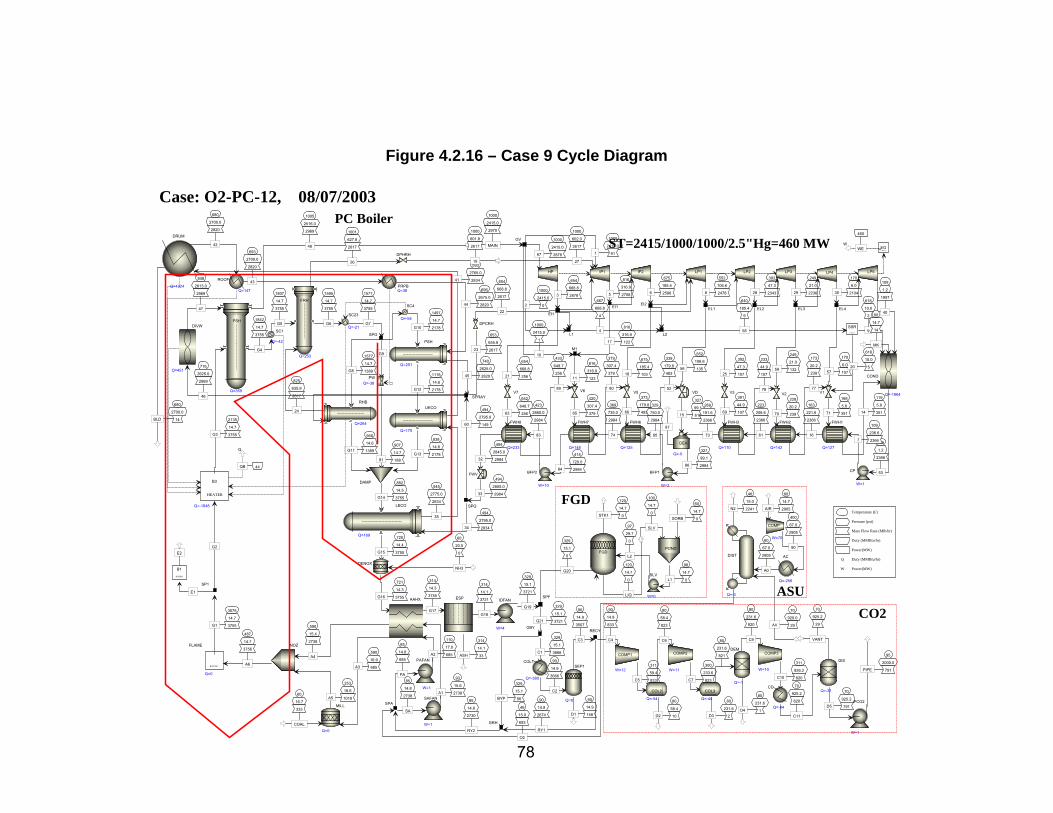
Figure 4.2.16 – Case 9 Cycle Diagram
487
14.7
3756
A6
3575
14.7
3755G1
253
16.6
1018A5
590
15.4
2738
A4
2135
14.7
3755G3
848
2613.0
2969
47
1842
14.7
3755
G4
1005
2516.0
2969
48
825
635.8
2617
24
1807
14.7
3755
G5
1595
14.7
3755
G6
1001
627.8
2617
26
1577
14.7
3755
G7
1577
14.7
1389G8
G9
1118
14.6
2178G12
545
2775.0
2834
35
838
14.6
2178G13
593
2765.0
283441
1497
14.7
2178G10
696
2675.0
282044
740
2625.0
282045
653
655.8
261723
946
14.6
1389G11907
14.7
18881
882
14.5
3755G14
494
2795.0
283434
720
14.4
3755G15
85
14.8
685
PA
110
17.0
685A2
721
14.3
3755G16
93
15.6
2738A1
590
16.9
685A3
314
14.3
3755
G17
60
20.0
0
NH3
314
14.1
3721
G18
314
14.1
33ASH
329
15.1
3721
G19
329
15.1
0
G20
97
29.7
0
L2
98
14.7
0L1
120
14.7
0STK1
120
14.7
0
LIQ
60
14.7
0SORB
100
14.7
0
SLV
85
14.8
2738
SA46
15.0
693
O2
95
14.8
2730
RY2
E1
G2
44QB
Q
60
16.7
333
COAL
329
15.1
3721G21
329
15.1
3666C1
90
14.9
3666
C2
90
14.9
3507
C3
90
14.9
158D1
90
14.8
833
C4
90
14.8
2674
RY1
329
15.1
56BYP
60
14.7
2905AIR
400
67.0
2905
90
60
67.0
2905
A0
70
920.0
29AV
46
15.0
2241N2
311
59.4
833C5
80
58.4
823
C6
300
233.6
823C7
80
231.6
820
C9
311
926.2
820C10
80
231.6
821
80
231.6
1D4
80
58.4
10D2
80
231.6
2D3
70
925.2
820
C11
70
925.2
791D5
95
2000.0
791PIPE
70
925.2
29
VANT
1000
2415.0
287867
654
668.8
28783
1000
2415.0
911
1000
602.0
2617
27
816
316.9
27085
675
185.4
25866
552
106.6
24788
392
47.3
234328
249
21.0
223629
170
6.0
210430
109
1.2
1997
40
460
WEW
654
668.8
2617
22
654
668.8
25621
675
185.4
10318
552
106.6
13556
392
47.3
10725
249
21.0
13259
170
6.0
10757
1000
2415.0
2970
MAIN
1000
2415.0
02
1000
2415.0
1
10
618
10.0
3
9
119
5.8
35114
60
14.7
14
MK
109
1.2
2366
53
640
185.4
9
58
618
10.0
520
339
179.8
483
52
327
99.1
61815
816
316.9
12217
667
668.8
4
4
652
648.7
25663
433
648.7
256
89
816
316.9
12311
420
307.4
37965
379
307.4
379
80
373
179.8
48366
391
44.9
10769
233
44.9
107
78
228
20.2
23970
173
20.2
239
77
168
5.8
35171
109
236.6
23667
269
191.6
2366
73
327
99.1
298486
87
329
750.0
2984
85
415
720.0
298484
423
2860.0
2984
83
163
221.6
2366
16
223
206.6
2366
61
369
735.0
2984
74
494
2845.0
298432
E2
680
2700.0
2820
42
680
2700.0
14BLD
716
2625.0
2969
46
693
2700.0
2820
43
494
2805.0
298433
494
2795.0
14960
1000
601.8
2617
19
RSTOIC
FLAME
Q=0
NOZ
FSH
Q=359
FRH
Q=253
SPG
UECO
Q=175
PSH
Q=251
RHB
Q=264
DAMP
LECO
Q=169
SC1
Q=-42
SC23
Q=-21
SC4
Q=-54
PWQ=-38
PAFAN
W=1
AAHX
DENOX
ESP IDFAN
W=4
PREC
SLV
W=0
FGDPOND
SAFAN
W=1
SPA
SP1
HEATER
B3
Q=-1848
MILL
Q=0
SPF
COL1
Q=-380
SEP1
Q=0
RECY
GRH
COMP
W=70
DIST
Q=-3
AC
Q=-256
COMP1
W=12
COMP2
W=11
GBY
COMP3
W=10
DEM
Q=-1
COL2
Q=-54
COL3
Q=-44
CD
Q=-84PCO2
W=1
DIS
Q=-31
HP IP1 IP2 LP1 LP2 LP3 LP4 LP5
WMULTEG
EH
EI2EL1 EL2 EL3 EL4
GV
COND
Q=-1864
FSPLIT
SSR
VD
EI1
L2
V7 V6 V5 V3 V2 V1
CP
W=1
DEA
Q=-0
BFP1
W=2
BFP2
W=10
FWH1
Q=127
FWH2
Q=142
FWH3
Q=110
FWH6
Q=125
FWH7
Q=148
FWH8
Q=233
L1
M1
RGIBBS
B1
DRUM
Q=1324
DIVW
Q=451
ROOF
Q=147PRPBQ=38
FWV
SPQ
SPRAY
DPHRH
DPCRH
Temperature (F)
Pressure (psi)
Mass Flow Rate (Mlb/hr)
Duty (MMBtu/hr)
Power(MW)
Q Duty (MMBtu/hr)
W Power(MW)
ST=2415/1000/1000/2.5"Hg=460 MW
Case: O2-PC-12, 08/07/2003
FGD
PC Boiler
ASUCO2
78
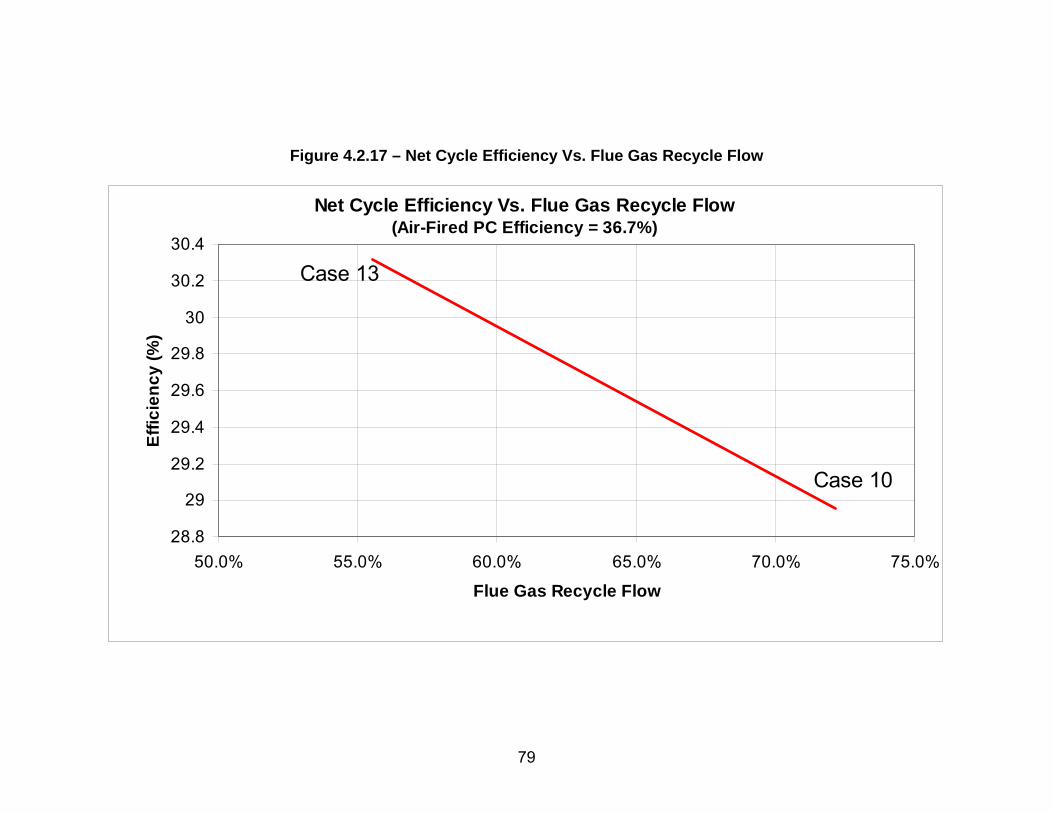
Figure 4.2.17 – Net Cycle Efficiency Vs. Flue Gas Recycle Flow
Net Cycle Efficiency Vs. Flue Gas Recycle Flow(Air-Fired PC Efficiency = 36.7%)
28.8
29
29.2
29.4
29.6
29.8
30
30.2
30.4
50.0% 55.0% 60.0% 65.0% 70.0% 75.0%
Flue Gas Recycle Flow
Effic
ienc
y (%
)
Case 13
Case 10
79

Figure 4.2.18 – Case 10 Cycle Diagram
526
14.7
3533
A6
3705
14.7
3532G1
275
16.6
968A5
640
15.4
2564
A4
2135
14.7
3532G3
848
2613.0
2969
47
1826
14.7
3532
G4
1005
2516.0
2969
48
825
635.8
2617
24
1791
14.7
3532
G5
1567
14.7
3532
G6
1001
627.8
2617
26
1549
14.7
3532
G7
1549
14.7
1307G8
G9
1066
14.6
2048G12
534
2775.0
2834
35
838
14.6
2048G13
572
2765.0
283441
1469
14.7
2048G10
696
2675.0
282044
740
2625.0
282045
653
655.8
261723
878
14.6
1307G11836
14.7
17781
853
14.5
3532G14
494
2795.0
283434
720
14.4
3532G15
120
14.8
641
PA
146
17.0
641A2
721
14.3
3532G16
129
15.6
2564A1
640
16.9
641A3
297
14.3
3532
G17
60
20.0
0
NH3
297
14.1
3499
G18
297
14.1
33ASH
312
15.1
3499
G19
312
15.1
0
G20
97
29.7
0
L2
98
14.7
0L1
121
14.7
0STK1
121
14.7
0
LIQ
60
14.7
0SORB
100
14.7
0
SLV
120
14.8
2564
SA46
15.0
681
O2
140
14.8
2525
RY2
E1
G2
27QB
Q
60
16.7
327
COAL
312
15.1
3499G21
312
15.1
2974C1
90
14.9
2974
C2
90
14.9
2819
C3
90
14.9
156D1
90
14.8
819
C4
90
14.8
2000
RY1
312
15.1
525BYP
60
14.7
2853AIR
400
67.0
2853
9060
67.0
2853
A0
70
920.0
29AV
46
15.0
2201N2
311
59.4
819C5
80
58.4
808
C6
301
233.6
808C7
80
231.6
806
C9
311
926.2
806C10
80
231.6
807
80
231.6
1D4
80
58.4
10D2
80
231.6
2D3
70
925.2
806
C11
70
925.2
777D5
95
2000.0
777PIPE
70
925.2
29
VANT
1000
2415.0
287867
654
668.8
28783
1000
2415.0
911
1000
602.0
2617
27
816
316.9
27085
675
185.4
25866
552
106.6
24788
392
47.3
234328
249
21.0
223629
170
6.0
210430
109
1.2
1997
40
460
WEW
654
668.8
2617
22
654
668.8
25621
675
185.4
10318
552
106.6
13556
392
47.3
10725
249
21.0
13259
170
6.0
10757
1000
2415.0
2970
MAIN
1000
2415.0
02
1000
2415.0
1
10
618
10.0
3
9
119
5.8
35114
60
14.7
14
MK
109
1.2
2366
53
640
185.4
9
58
618
10.0
520
339
179.8
483
52
327
99.1
61815
816
316.9
12217
667
668.8
4
4
652
648.7
25663
433
648.7
256
89
816
316.9
12311
420
307.4
37965
379
307.4
379
80
373
179.8
48366
391
44.9
10769
233
44.9
107
78
228
20.2
23970
173
20.2
239
77
168
5.8
35171
109
236.6
23667
269
191.6
2366
73
327
99.1
298486
87
329
750.0
2984
85
415
720.0
298484
423
2860.0
2984
83
163
221.6
2366
16
223
206.6
2366
61
369
735.0
2984
74
494
2845.0
298432
E2
680
2700.0
2820
42
680
2700.0
14BLD
716
2625.0
2969
46
693
2700.0
2820
43
494
2805.0
298433
494
2795.0
14960
1000
601.8
2617
19
RSTOIC
FLAME
Q=0
NOZ
FSH
Q=359
FRH
Q=253
SPG
UECO
Q=135
PSH
Q=251
RHB
Q=264
DAMP
LECO
Q=131
SC1
Q=-40
SC23
Q=-20
SC4
Q=-51
PWQ=-38
PAFAN
W=1
AAHX
DENOX
ESP IDFAN
W=4
PREC
SLV
W=0
FGDPOND
SAFAN
W=1
SPA
SP1
HEATER
B3
Q=-1916
MILL
Q=0
SPF
COL1
Q=-328
SEP1
Q=0
RECY
GRH
COMP
W=69
DIST
Q=-3
AC
Q=-252
COMP1
W=12
COMP2
W=11
GBY
COMP3
W=10
DEM
Q=-1
COL2
Q=-53
COL3
Q=-43
CD
Q=-81PCO2
W=1
DIS
Q=-31
HP IP1 IP2 LP1 LP2 LP3 LP4 LP5
WMULTEG
EH
EI2EL1 EL2 EL3 EL4
GV
COND
Q=-1864
FSPLIT
SSR
VD
EI1
L2
V7 V6 V5 V3 V2 V1
CP
W=1
DEA
Q=-0
BFP1
W=2
BFP2
W=10
FWH1
Q=127
FWH2
Q=142
FWH3
Q=110
FWH6
Q=125
FWH7
Q=148
FWH8
Q=233
L1
M1
RGIBBS
B1
DRUM
Q=1402
DIVW
Q=451
ROOF
Q=147PRPBQ=38
FWV
SPQ
SPRAY
DPHRH
DPCRH
Temperature (F)
Pressure (psi)
Mass Flow Rate (Mlb/hr)
Duty (MMBtu/hr)
Power(MW)
Q Duty (MMBtu/hr)
W Power(MW)
ST=2415/1000/1000/2.5"Hg=460 MWCase: O2-PC-13, 09/08/2003
FGD
PC Boiler
ASUCO2
80

Figure 4.2.19 – Case 11 Cycle Diagram
500
14.7
2816
A6
4343
14.7
2815G1
223
16.6
822A5
640
15.4
1994
A4
2135
14.7
2815G3
848
2613.0
2969
47
1750
14.7
2815
G4
1005
2516.0
2969
48
825
635.8
2617
24
1715
14.7
2815
G5
1434
14.7
2815
G6
1001
627.8
2617
26
1416
14.7
2815
G7
1416
14.7
1323G8
G9
760
14.6
1351G12
504
2775.0
2834
35
760
14.6
1351G13
504
2765.0
283441
1336
14.7
1351G10
696
2675.0
282044
735
2625.0
282045
653
655.8
261723
746
14.6
1323G11491
14.7
14181
740
14.5
2815G14
494
2795.0
283434
700
14.4
2815G15
117
14.8
498
PA
143
17.0
498A2
701
14.3
2815G16
126
15.6
1994A1
640
16.9
498A3
288
14.3
2815
G17
60
20.0
0
NH3
288
14.1
2783
G18
288
14.1
32ASH
303
15.1
2783
G19
303
15.1
0
G20
97
29.7
0
L2
98
14.7
0L1
122
14.7
0STK1
122
14.7
0
LIQ
60
14.7
0SORB
100
14.7
0
SLV
117
14.8
1994
SA 46
15.0
675
O2
144
14.8
1817
RY2
E1
G2
25QB
Q
60
16.7
324
COAL
303
15.1
2783G21
303
15.1
2365C1
90
14.9
2365
C2
90
14.9
2211
C3
90
14.9
154D1
90
14.8
811
C4
90
14.8
1400
RY1
303
15.1
417BYP
60
14.7
2826AIR
400
67.0
2826
9060
67.0
2826
A0
70
920.0
29AV
46
15.0
2180N2
311
59.4
811C5
80
58.4
801
C6
301
233.6
801C7
80
231.6
799
C9
311
926.2
799C10
80
231.6
799
C8
80
231.6
1D4
80
58.4
10D2
80
231.6
2D3
70
925.2
799
C11
70
925.2
770D5
95
2000.0
770PIPE
70
925.2
29
VANT
1000
2415.0
287867
654
668.8
28783
1000
2415.0
911
1000
602.0
2617
27
816
316.9
27085
675
185.4
25866
552
106.6
24788
392
47.3
234328
249
21.0
223629
170
6.0
210430
109
1.2
1997
40
460
WEW
654
668.8
2617
22
654
668.8
25621
675
185.4
10318
552
106.6
13556
392
47.3
10725
249
21.0
13259
170
6.0
10757
1000
2415.0
2970
MAIN
1000
2415.0
02
1000
2415.0
1
10
618
10.0
3
9
119
5.8
35114
60
14.7
14
MK
109
1.2
2366
53
640
185.4
9
58
618
10.0
520
339
179.8
483
52
327
99.1
61815
816
316.9
12217
667
668.8
4
4
652
648.7
25663
433
648.7
256
89
816
316.9
12311
420
307.4
37965
379
307.4
379
80
373
179.8
48366
391
44.9
10769
233
44.9
107
78
228
20.2
23970
173
20.2
239
77
168
5.8
35171
109
236.6
23667
269
191.6
2366
73
327
99.1
298486
87
329
750.0
2984
85
415
720.0
298484
423
2860.0
2984
83
163
221.6
2366
16
223
206.6
2366
61
369
735.0
2984
74
494
2845.0
298432
E2
680
2700.0
2820
42
680
2700.0
14BLD
712
2625.0
2969
46
693
2700.0
2820
43
494
2805.0
298433
494
2795.0
14960
1000
601.8
2617
19
RSTOIC
FLAME
Q=0
NOZ
FSH
Q=359
FRH
Q=253
SPG
UECO
Q=0
PSH
Q=231
RHB
Q=264
DAMP
LECO
Q=32
SC1
Q=-32
SC23
Q=-16
SC4
Q=-34
PWQ=-38
PAFAN
W=1
AAHX
DENOX
ESP IDFAN
W=3
PREC
SLV
W=0
FGDPOND
SAFAN
W=1
SPA
SP1
HEATER
B3
Q=-2198
MILL
Q=0
SPF
COL1
Q=-290
SEP1
Q=0
RECY
GRH
COMP
W=69
DIST
Q=-3
AC
Q=-249
COMP1
W=11
COMP2
W=11
GBY
COMP3
W=10
DEM
Q=-1
COL2
Q=-53
COL3
Q=-42
CD
Q=-80PCO2
W=1
DIS
Q=-31
HP IP1 IP2 LP1 LP2 LP3 LP4 LP5
WMULTEG
EH
EI2EL1 EL2 EL3 EL4
GV
COND
Q=-1864
FSPLIT
SSR
VD
EI1
L2
V7 V6 V5 V3 V2 V1
CP
W=1
DEA
Q=-0
BFP1
W=2
BFP2
W=10
FWH1
Q=127
FWH2
Q=142
FWH3
Q=110
FWH6
Q=125
FWH7
Q=148
FWH8
Q=233
L1
M1
RGIBBS
B1
DRUM
Q=1637
DIVW
Q=471
ROOF
Q=147PRPBQ=38
FWV
SPQ
SPRAY
DPHRH
DPCRH
Temperature (F)
Pressure (psi)
Mass Flow Rate (Mlb/hr)
Duty (MMBtu/hr)
Power(MW)
Q Duty (MMBtu/hr)
W Power(MW)
ST=2415/1000/1000/2.5"Hg=460 MWCase: O2-PC-14, 10/22/2003
FGD
PC Boiler
ASUCO2
81

Table 4.2.5 – Parametric Cases Summary (With CO2 Compression)
case 1 3 8 9 10 11 12 13ASU no yes yes yes yes yes yes yesCO2 Sequestration no no yes yes yes yes yes yesVent gas recover no no no yes yes yes yes yesWet-end economizer no no no no no no yes yescoal to boiler, klb/h 334 333 333 333 327 324 324 324air to plant, klb/h 3422 2981 2981 2905 2853 2826 2826 2817 O2 purity, % 20.7 99.6 99.6 99.5 99.5 99.5 99.5 99.5 O2 level to boiler, % 20.4 26.9 26.7 27.1 28.0 33.9 33.9 42.4 O2 level exit boiler, % 3.0 3.0 3.0 3.0 3.0 3.0 3.0 3.0 Excess Air, % 18.0 3.1 3.1 0.3 0.3 0.3 0.3 0.3adiabatic temperature, F 3687 3574 3573 3575 3705 4343 4343 5164gas to boiler exit, klb/h 3721 3721 3722 3721 3499 2783 2783 2169 gas to boiler exit, mmcft/h 237 175 175 174 166 134 134 104 gas recycle to boiler, klb/h 0 2734 2734 2730 2525 1817 1817 1205gas exit system, klb/h 3721 820 820 833 819 811 811 810ASU plant power, MW 0 72.3 72.3 70.5 69.2 68.6 68.6 68.6CO2 compression power, MW 0 0 37.2 34.6 34.0 33.7 33.7 32.0Gross power, MW 460 460 460.0 460.0 460.0 460.0 464 468Aux power, MW 42.1 105.8 143.1 138.6 136.4 133.9 134.6 132Net Power, MW 417.9 354.2 317.3 321.8 324.0 326.5 329.6 336.0Boiler efficiency, % 88.2 88.3 88.3 88.3 89.9 90.8 93.2 93.4Net efficiency, % 36.68 31.15 27.87 28.27 28.98 29.48 29.75 30.33
82
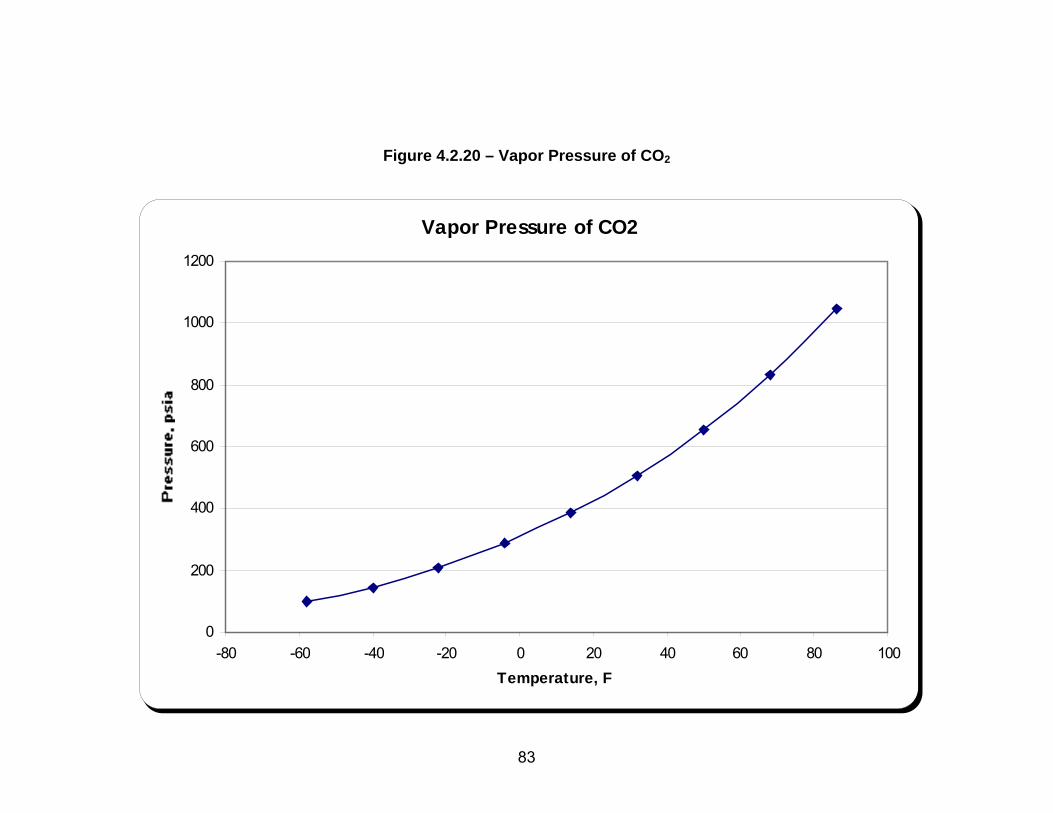
Figure 4.2.20 – Vapor Pressure of CO2
Vapor Pressure of CO2
0
200
400
600
800
1000
1200
-80 -60 -40 -20 0 20 40 60 80 100Temperature, F
83
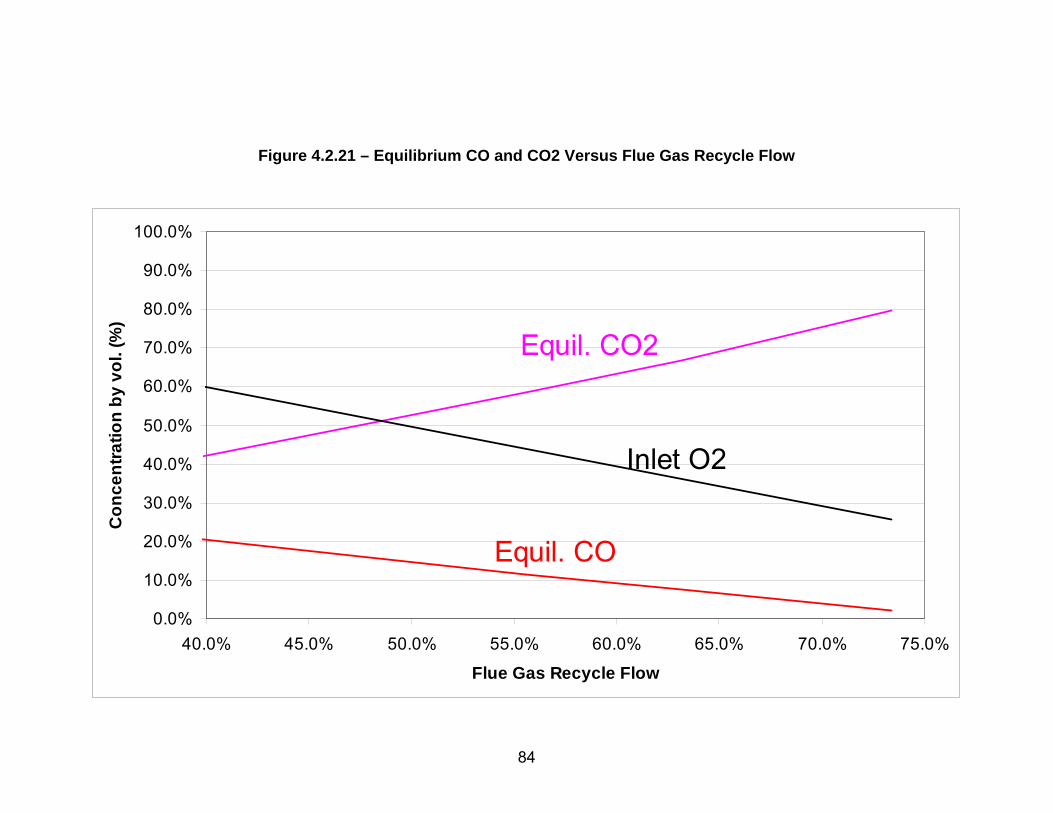
Figure 4.2.21 – Equilibrium CO and CO2 Versus Flue Gas Recycle Flow
0.0%
10.0%
20.0%
30.0%
40.0%
50.0%
60.0%
70.0%
80.0%
90.0%
100.0%
40.0% 45.0% 50.0% 55.0% 60.0% 65.0% 70.0% 75.0%
Flue Gas Recycle Flow
Con
cent
ratio
n by
vol
. (%
)
Equil. CO2
Inlet O2
Equil. CO
84

Figure 4.2.22 – Adiabatic and Equilibrium Temperatures Versus Flue Gas Recycle Flow
3000
3500
4000
4500
5000
5500
6000
6500
7000
40.0% 45.0% 50.0% 55.0% 60.0% 65.0% 70.0% 75.0%
Flue Gas Recycle Flow
Tem
pera
ture
(F)
Equilibrium Adiabatic
85

Table 4.2.6 – Radiation Heat Flux and Water Wall Temperature
1 2 3 4 5 6 7 8 9 10 11, 12 13Gas Flow Rate MM ft3/hr 320.8 223.1 222.7 212.1 193.3 174.3 173.0 219.9 219.9 208.7 173.7 173.7
Furnace Heat Duty MM Btu/hr 1894 1848 1826 1904 2055 2201 2198 1847 1848 1916 2198 2198Furnace H2O % 5.0 11.1 11.6 11.9 12.8 13.8 15.2 11.1 11.0 12.6 14.7 17.6Furnace CO2 % 7.0 59.2 68.9 68.6 67.8 66.9 65.5 69.8 69.4 67.8 65.9 63.0
Depth ft 39.6 33.0 33.0 32.2 30.7 29.2 29.1 32.8 32.8 31.9 30.2 27.0Width ft 56.3 46.9 46.9 45.8 43.7 41.5 41.3 46.6 46.6 45.4 42.9 38.0Height ft 176.5 150.3 144.2 152.7 166.0 174.9 172.6 155.2 155.4 158.5 141.9 133.7
Mean Beam Length ft 32.9 27.2 27.0 26.7 26.0 25.0 24.9 27.2 27.2 26.7 24.9 22.2
Tube wall PropertiesOutside Diameter in 2.75 2.75 2.75 2.75 2.75 2.75 2.75 2.75 2.75 2.75 2.75 2.75
Wall Thickness in 0.3 0.285 0.285 0.285 0.285 0.23 0.23 0.285 0.285 0.285 0.23 0.24Inside Diameter in 2.15 2.18 2.18 2.18 2.18 2.29 2.29 2.18 2.18 2.18 2.29 2.27
inside H.T.C. Btu/hr-ft2-F 2500 2500 2500 2500 2500 2500 2500 2500 2500 2500 2500 2500Material SA-210C SA-213-T2 SA-213-T2 SA-213-T2 SA-213-T22 SA-213-T91 SA-213-T91 SA-213-T2 SA-213-T2 SA-213-T2 SA-213-T91 SA-213-T91
Wall Therm. Cond. Btu/hr-ft-F 22.0 21.8 22.2 22.2 20.0 16.1 16.1 22.2 22.2 22.2 16.1 16.1Overall U Btu/hr-ft2-F 557.5 579.6 587.0 587.0 544.9 560.8 560.8 587.0 587.0 587.0 560.8 540.6
Stress Allowable psi 12,362 14,502 14,482 14,439 14,753 19,435 19,292 14,492 14,492 14,404 19,129 17,463Min. Wall in 0.30 0.26 0.26 0.26 0.26 0.20 0.20 0.26 0.26 0.26 0.21 0.22
Max. Furnace Temp. F 3492 3467 3456 3492 3584 3710 3710 3372 3372 3433 3640 4013Max. Heat Flux Btu/hr-ft2 63,300 98,408 100,700 102,800 109,400 115,550 118,900 100,210 100,210 104,500 122,700 152,040
Max. Wall Temp. F 794 850 852 855 881 886 892 851 851 858 899 961
Ave. Furnace Temp. F 3128 2989 2981 3008 3076 3171 3171 2920 2920 2964 3118 3404Ave. Wall Flux Btu/hr-ft2 49,460 68,140 69,900 71,150 75,028 81,100 82,320 66,684 66,684 69,900 78,410 93,901
flux/flux(case1) 1.00 0.73 0.71 0.70 0.66 0.61 0.60 0.74 0.74 0.71 0.63 0.53
86

Figure 4.2.23 – Case 12 Cycle Diagram
500
14.7
2816
A6
4343
14.7
2815G1
228
16.6
824A5
640
15.4
1992
A4
2135
14.7
2815G3
848
2613.0
2969
47
1750
14.7
2815
G4
1005
2516.0
2969
48
825
635.8
2617
24
1715
14.7
2815
G5
1434
14.7
2815
G6
1001
627.8
2617
26
1416
14.7
2815
G7
1416
14.7
1323G8
G9
760
14.6
1351G12
504
2775.0
2834
35
760
14.6
1351G13
504
2765.0
283441
1336
14.7
1351G10
696
2675.0
282044
735
2625.0
282045
653
655.8
261723
746
14.6
1323G11491
14.7
14181
740
14.5
2815G14
494
2795.0
283434
700
14.4
2815G15
144
14.8
500
PA
169
17.0
500A2
701
14.3
2815G16
119
15.6
1992A1
640
16.9
500A3
288
14.3
2815
G17
60
20.0
0
NH3
288
14.1
2783
G18
288
14.1
32ASH
303
15.1
2783
G19
303
15.1
0
G20
97
29.7
0
L2
98
14.7
0L1
122
14.7
0STK1
122
14.7
0
LIQ
60
14.7
0SORB
100
14.7
0
SLV
144
14.8
1317
SA
45
15.0
675
O2
144
14.8
1817
RY2
E1
G2
25QB
Q
60
16.7
324
COAL
303
15.1
2783G21
303
15.1
2365C1
90
14.9
2365
C2
90
14.9
2211
C3
90
14.9
154D1
90
14.8
811
C4
90
14.8
1400
RY1
303
15.1
417BYP
60
14.7
2826AIR
400
67.0
2826
90
60
67.0
2826
A0
-183
67.0
29
AV
45
15.0
2180N2
311
59.4
811C5
80
58.4
801
C6
301
233.6
801C7
80
231.6
799
C9
311
926.2
799C10
80
231.6
799
80
231.6
1D4
80
58.4
10D2
80
231.6
2D3
70
925.2
799
C11
70
925.2
770D5
77
1200.0
770PIPE
70
925.2
29VANT
-183
67.0
29
49
1000
2415.0
287867
654
668.8
28783
1000
2415.0
911
1000
602.0
2617
27
816
316.9
27085
675
185.4
25866
552
106.6
24788
392
47.3
234428
249
21.0
226229
170
6.0
216230
109
1.2
2081
40
464
WEW
654
668.8
2617
22
654
668.8
25621
675
185.4
10318
552
106.6
13456
392
47.3
8225
249
21.0
10059
170
6.0
8157
1000
2415.0
2970
MAIN
1000
2415.0
02
1000
2415.0
1
10
618
10.0
3
9
119
5.8
26814
60
14.7
14
MK
109
1.2
2367
53
640
185.4
9
58
618
10.0
520
339
179.8
483
52
327
99.1
61715
816
316.9
12217
667
668.8
4
4
652
648.7
25663
433
648.7
256
89
816
316.9
12311
420
307.4
37965
379
307.4
379
80
373
179.8
48366
391
44.9
8269
233
44.9
82
78
228
20.2
18270
173
20.2
182
77
168
5.8
26871
50
269
191.6
1804
73
269
206.6
563
68
327
99.1
298386
87
329
750.0
2983
85
415
720.0
298384
423
2860.0
2983
83109
236.6
18047
163
221.6
1804
16
223
206.6
1804
61
369
735.0
2983
74
494
2845.0
298332
E2
680
2700.0
2820
42
680
2700.0
14BLD
712
2625.0
2969
46
693
2700.0
2820
43
494
2805.0
298333
494
2795.0
14960
1000
601.8
2617
19
109
236.6
563
64
RSTOIC
FLAME
Q=0
NOZ
FSH
Q=359
FRH
Q=253
SPG
UECO
Q=0
PSH
Q=231
RHB
Q=264
DAMP
LECO
Q=32
SC1
Q=-32
SC23
Q=-16
SC4
Q=-34
PWQ=-38
PAFAN
W=1
AAHX
DENOX
ESP IDFAN
W=3
PREC
SLV
W=0
FGDPOND
SAFAN
W=1
SPA
SP1
HEATER
B3
Q=-2198
MILL
Q=0
SPF
COL1
Q=-290
SEP1
Q=0
RECY
GRH
COMP
W=69
DIST
Q=-3
AC
Q=-249
COMP1
W=11
COMP2
W=11
GBY
COMP3
W=10
DEM
Q=-1
COL2
Q=-53
COL3
Q=-42
CD
Q=-80PCO2
W=0
DIS
Q=-31
EXPD
W=-0
HP IP1 IP2 LP1 LP2 LP3 LP4 LP5
WMULTEG
EH
EI2EL1 EL2 EL3 EL4
GV
COND
Q=-1942
FSPLIT
SSR
VD
EI1
L2
V7 V6 V5 V3 V2 V1
CP
W=1
DEA
Q=-0
BFP1
W=2
BFP2
W=10
FWH1
Q=97
FWH2
Q=108
FWH3
Q=84
FWH6
Q=125
FWH7
Q=148
FWH8
Q=233
L1
M1
RGIBBS
B1
DRUM
Q=1637
DIVW
Q=471
ROOF
Q=147PRPBQ=38
FWV
SPQ
SPRAY
DPHRH
DPCRH
BYFWWETECO
Q=90
Temperature (F)
Pressure (psi)
Mass Flow Rate (Mlb/hr)
Duty (MMBtu/hr)
Power(MW)
Q Duty (MMBtu/hr)
W Power(MW)
ST=2415/1000/1000/2.5"Hg=460 MWCase: O2-PC-16, 01/20/2004
FGD
PC Boiler
ASU
CO2
87

Figure 4.2.24 – Wet End Economizer Temperature Vs. Heat Duty
WETECO T-Q Diagram
0
50
100
150
200
250
300
350
0 50 100 150 200 250 300
Duty, MMBtu
T, F
hotcoldcold
Case 12 , Tgas-out = 142F (LMTD = 34F)
Tgas-out = 139F (LMTD = 26F)
88

Figure 4.2.25 – Case 13 Cycle Diagram
89
417
14.7
2202
A6
5164
14.7
2201G1
216
16.6
873A5
580
15.4
1329
A4
2350
14.7
2201G3
848
2613.0
2969
47
1872
14.7
2201
G4
1005
2516.0
2969
48
815
635.8
2617
24
1837
14.7
2201
G5
1465
14.7
2201
G6
1001
627.8
2617
26
1447
14.7
2201
G7
1447
14.7
1166G8
G9
768
14.6
880G12
513
2775.0
2834
35
768
14.6
880G13
513
2765.0
2834
41
1367
14.7
880G10
692
2675.0
282044
713
2625.0
282045
653
655.8
261723
740
14.6
1166G11 705
14.7
15481
749
14.5
2201G14
494
2795.0
283434
650
14.4
2201G15
160
14.8
550
PA
186
17.0
550A2
651
14.3
2201G16
111
15.6
1329A1
580
16.9
550A3
308
14.3
2201
G17
60
20.0
0
NH3
308
14.1
2169
G18
308
14.1
32ASH
323
15.1
2169
G19
323
15.1
0
G20
97
29.7
0
L2
98
14.7
0L1
124
14.7
0STK1
124
14.7
0
LIQ
60
14.7
0SORB
100
14.7
0
SLV
160
14.8
655
SA 45
15.0
673
O2
160
14.8
1205
RY2
E1
G2
25QB
Q
60
16.7
323
COAL
323
15.1
2169G21
323
15.1
1843C1
90
14.9
1843
C2
90
14.9
1690
C3
90
14.9
154D1
90
14.8
810
C4
90
14.8
880
RY1
323
15.1
325BYP
60
14.7
2817AIR
400
67.0
2817
9060
67.0
2817
A0
-183
67.0
30
AV
45
15.0
2173N2
311
59.4
810C5
80
58.4
800
C6
301
233.6
800C7
80
231.6
797
C9
311
926.2
797C10
80
231.6
798
C8
80
231.6
1D4
80
58.4
10D2
80
231.6
2D3
70
925.2
797
C11
70
925.2
767D5
77
1200.0
767PIPE
70
925.2
30VANT
-183
67.0
30
49
1000
2415.0
287867
654
668.8
28783
1000
2415.0
911
1000
602.0
2617
27
816
316.9
27085
675
185.4
25866
552
106.6
24788
392
47.3
234428
249
21.0
229029
170
6.0
222130109
1.2
2170
40
468
WEW
654
668.8
2617
22
654
668.8
25621
675
185.4
10318
552
106.6
13456392
47.3
5425
249
21.0
6959
170
6.0
5157
1000
2415.0
2970
MAIN
1000
2415.0
02
1000
2415.0
1
10
618
10.0
3
9
119
5.8
17914
60
14.7
14
MK
109
1.2
2366
53
640
185.4
9
58
618
10.0
520339
179.8
483
52
327
99.1
61715
816
316.9
12217
667
668.8
4
4
652
648.7
25663
433
648.7
256
89
816
316.9
12311
420
307.4
37965
379
307.4
379
80
373
179.8
48366
391
44.9
5469
233
44.9
54
78
228
20.2
12370
172
20.2
123
77
168
5.8
17971
50
269
191.6
1206
73
269
206.6
1160
68
327
99.1
298486
87
329
750.0
2984
85
415
720.0
298484
423
2860.0
2983
83 109
236.6
12067
162
221.6
1206
16
223
206.6
1206
61
369
735.0
2984
74
494
2845.0
298332
4170
14.7
0E2
680
2700.0
2820
42
680
2700.0
14BLD
696
2625.0
2969
46
690
2700.0
2820
43
494
2805.0
298333
494
2795.0
14960
1000
602.0
2617
19
109
236.6
1160
64
RSTOIC
FLAME
Q=0
NOZ
FSH
Q=359
FRH
Q=267
SPG
UECO
Q=0
PSH
Q=159
RHB
Q=250
DAMP
LECO
Q=61
SC1
Q=-26
SC23
Q=-13
SC4
Q=-22
PW
Q=-34
PAFAN
W=1
AAHX
Q=-199
DENOX
ESP IDFAN
W=3
PREC
SLV
W=0
FGDPOND
SAFAN
W=1
SPA
SP1
HEATER
BOILER
Q=-2264
MILL
Q=0
SPF
COL1
Q=-275
SEP1
Q=0
RECY
GRH
COMP
W=68
DIST
Q=-3
AC
Q=-249
COMP1
W=11
COMP2
W=11
GBY
COMP3
W=10
DEM
Q=-1
COL2
Q=-53
COL3
Q=-42
COL-4
Q=-79PCO2
W=0
DIS
Q=-32
EXPD
W=-0
HP IP1 IP2 LP1 LP2 LP3 LP4 LP5
W MULTEG
EH
EI2EL1 EL2 EL3 EL4
GV
COND
Q=-2024
FSPLIT
SSR
VD
EI1
L2
V7 V6 V5 V3 V2 V1
CP
W=1
DEA
Q=-0
BFP1
W=2
BFP2
W=10
FWH1
Q=64
FWH2
Q=74
FWH3
Q=55
FWH6
Q=125
FWH7
Q=148
FWH8
Q=233
L1
M1
RGIBBS
EQ
DRUM
Q=1607
DIVW
Q=573
ROOF
Q=120PRPB
Q=34
FWV
SPQ
SPRAY
DPHRH
DPCRH
BYFWWETECO
Q=186
Temperature (F)
Pressure (psi)
Mass Flow Rate (Mlb/hr)
Duty (MMBtu/hr)
Power(MW)
Q Duty (MMBtu/hr)
W Power(MW)
ST=2415/1000/1000/2.5"Hg=460 MWCase: O2-PC-18, 09/07/2004
FGD
PC Boiler
ASU
CO2

Figure 4.2.26 – Efficiency of Saved Extraction Steam Versus Stage
0
5
10
15
20
25
30
1 2 3 4 5 6St age of FWH
eff,
%
90

Figure 4.2.27 – Comparison of Power Consumption of CO2 Removal of Different Technologies
Power Consumption of CO2 Removal
0
50
100
150
200
250
300
350
Post comb. CO2 capturecombustion (PC)
O2-fired combustion(PC)
Post comb. captureNGCC
IGCC
kWh/
klbC
O2
91

Figure 4.2.28 – Comparison of Overall Cycle Efficiency Point of CO2 Removal of Different Technologies
Efficency Point Reduction of CO2 Removal
0
2
4
6
8
10
12
14
Post comb. CO2 capturecombustion (PC)
O2-fired combustion (PC) Post comb. captureNGCC
IGCC
Effic
ienc
y dr
op, p
oint
92
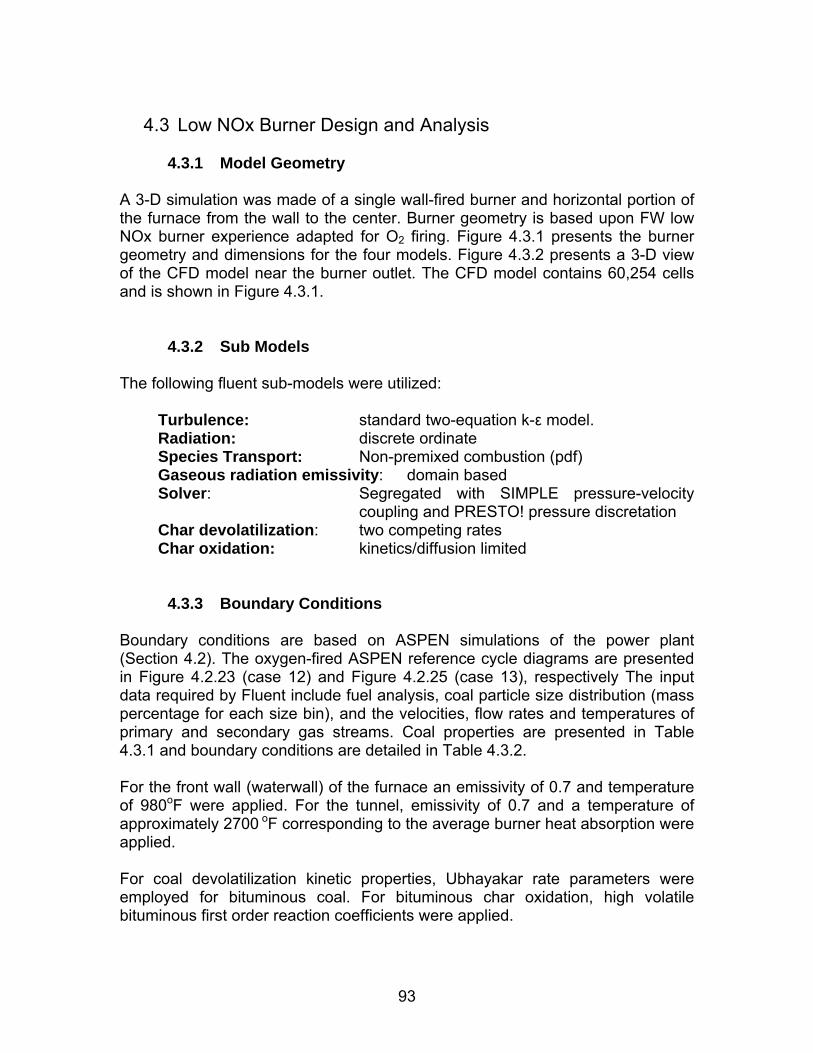
4.3 Low NOx Burner Design and Analysis
4.3.1 Model Geometry
A 3-D simulation was made of a single wall-fired burner and horizontal portion of the furnace from the wall to the center. Burner geometry is based upon FW low NOx burner experience adapted for O2 firing. Figure 4.3.1 presents the burner geometry and dimensions for the four models. Figure 4.3.2 presents a 3-D view of the CFD model near the burner outlet. The CFD model contains 60,254 cells and is shown in Figure 4.3.1.
4.3.2 Sub Models The following fluent sub-models were utilized:
Turbulence: standard two-equation k-ε model. Radiation: discrete ordinate Species Transport: Non-premixed combustion (pdf) Gaseous radiation emissivity: domain based Solver: Segregated with SIMPLE pressure-velocity
coupling and PRESTO! pressure discretation Char devolatilization: two competing rates Char oxidation: kinetics/diffusion limited
4.3.3 Boundary Conditions Boundary conditions are based on ASPEN simulations of the power plant (Section 4.2). The oxygen-fired ASPEN reference cycle diagrams are presented in Figure 4.2.23 (case 12) and Figure 4.2.25 (case 13), respectively The input data required by Fluent include fuel analysis, coal particle size distribution (mass percentage for each size bin), and the velocities, flow rates and temperatures of primary and secondary gas streams. Coal properties are presented in Table 4.3.1 and boundary conditions are detailed in Table 4.3.2. For the front wall (waterwall) of the furnace an emissivity of 0.7 and temperature of 980oF were applied. For the tunnel, emissivity of 0.7 and a temperature of approximately 2700 oF corresponding to the average burner heat absorption were applied. For coal devolatilization kinetic properties, Ubhayakar rate parameters were employed for bituminous coal. For bituminous char oxidation, high volatile bituminous first order reaction coefficients were applied.
93

4.3.4 65% Recycle Case With No OFG
The boundary conditions were applied to the computational model (Figure 4.3.1) and Fluent was run until steady state conditions were achieved. The modeling results are summarized in Table 4.3.3. The coal burnout shown in the table is the percentage of dry ash-free based coal burned.
4.3.4.1 No Primary Gas Swirl Figure 4.3.4 presents the velocity distribution and Figure 4.3.5 presents the temperature distribution. The O2 mole fraction is shown in Figure 4.3.6. The trajectories and burnout of the 69 micron and 169 micron coal particles are shown in Figure 4.3.7 and Figure 4.3.8. Due to the low oxygen content of the primary gas (3.0%, by vol.), coal burnout is relatively small, especially for the larger particles as can be seen in Figure 4.3.8. Consequently, it is necessary to add swirl to the primary gas to bring the coal particles (especially the larger sizes) in contact with the secondary gas. However, as the primary gas swirl is increased the NOx generally increases since the combustion staging is reduced. Figure 4.3.3 shows the effect of primary gas swirl ratio on burnout and NOx. Note that the NOx at the burner outlet can be significantly lower than the NOx at the furnace outlet, which is predicted in Section 4.4.1.5. Based on Figure 4.3.3 a primary gas swirl ratio of 0.5 was chosen as optimal.
4.3.4.2 Primary Gas Swirl Ratio = 0.5 Figure 4.3.9 presents the velocity distribution and Figure 4.3.10 presents the temperature distribution. Comparing Figure 4.3.5 with Figure 4.3.10 demonstrates that the addition of the 0.5 PG swirl increases the maximum flame temperature by 450oF and also increases the flame core temperature. Increasing the core temperature creates a more stable flame since the secondary gas swirl recirculates the hot flue gas back to the flame ignition point as shown in Figure 4.3.12. The O2 mole fraction is shown in Figure 4.3.11. The trajectories and burnout of the 69 micron and 169 micron coal particles are shown in Figure 4.3.13 and Figure 4.3.14. Note that with the 0.5 PG swirl ratio approximately 55% of the larger coal particles are burned (Figure 4.3.14) as compared to only about 25% for a zero PG swirl ratio (Figure 4.3.8).
4.3.5 65% Recycle Case With 20% OFG The boundary conditions were applied to the computational model (Figure 4.3.1) and Fluent was run until steady state conditions were achieved. The modeling results are summarized in Table 4.3.3.
94
4.3.5.1 No Primary Gas Swirl
Figure 4.3.15 presents the velocity distribution and Figure 4.3.16 presents the temperature distribution. The O2 mole fraction is shown in Figure 4.3.17. The trajectories and burnout of the 69 micron and 169 micron coal particles are shown in Figure 4.3.18 and Figure 4.3.19. Due to the low oxygen content of the primary gas (3.0%, by vol.), coal burnout is relatively small, especially for the larger particles as can be seen in Figure 4.3.19. Consequently, it is necessary to add swirl to the primary gas to bring the coal particles (especially the larger sizes) in contact with the secondary gas.
4.3.5.2 Primary Gas Swirl Ratio = 0.5 Figure 4.3.20 presents the velocity distribution and Figure 4.3.21 presents the temperature distribution. Comparing Figure 4.3.16 with Figure 4.3.21 demonstrates that the addition of the 0.5 PG swirl increases the maximum flame temperature by 160oF and also increases the flame core temperature. Increasing the core temperature creates a more stable flame since the secondary gas swirl recirculates the hot flue gas back to the flame ignition point. The O2 mole fraction is shown in Figure 4.3.22. The trajectories and burnout of the 69 micron and 169 micron coal particles are shown in Figure 4.3.23 and Figure 4.3.24. Note that with the 0.5 PG swirl ratio approximately 45% of the larger coal particles are burned (Figure 4.3.24) as compared to only about 33% for a zero PG swirl ratio (Figure 4.3.19).
4.3.6 56% Recycle Case With No OFG The boundary conditions were applied to the computational model (Figure 4.3.1) and Fluent was run until steady state conditions were achieved. The modeling results are summarized in Table 4.3.3.
4.3.6.1 No Primary Gas Swirl Figure 4.3.25 presents the velocity distribution Figure 4.3.26 presents the temperature distribution. The O2 mole fraction is shown in Figure 4.3.27. The trajectories and burnout of the 69 micron and 169 micron coal particles are shown in Figure 4.3.28 and Figure 4.3.29. Due to the low oxygen content of the primary gas (3.0%, by vol.), coal burnout is relatively small, especially for the larger particles as can be seen in Figure 4.3.29. Consequently, it is necessary to add swirl to the primary gas to bring the coal particles (especially the larger sizes) in contact with the secondary gas.
4.3.6.2 Primary Gas Swirl Ratio = 0.5 Figure 4.3.30 presents the velocity distribution and Figure 4.3.31presents the temperature distribution. Comparing with Figure 4.3.26 with Figure 4.3.31
95

demonstrates that the addition of the 0.5 PG swirl increases the maximum flame temperature by 100oF and also increases the flame core temperature. Increasing the core temperature creates a more stable flame since the secondary gas swirl recirculates the hot flue gas back to the flame ignition point. The O2 mole fraction is shown in Figure 4.3.32. The trajectories and burnout of the 69 micron and 169 micron coal particles are shown in Figure 4.3.33 and Figure 4.3.34. Note that with the 0.5 PG swirl ratio approximately 47% of the 169µ coal particles are burned (Figure 4.3.34) as compared to only about 44% for a zero PG swirl ratio (Figure 4.3.29) and 85% of the 69µ coal particles are burned (Figure 4.3.33) as compared to only about 52% for a zero PG swirl ratio (Figure 4.3.28)
4.3.7 56% Recycle Case With 20% OFG The boundary conditions were applied to the computational model (Figure 4.3.1) and Fluent was run until steady state conditions were achieved. The modeling results are summarized in Table 4.3.3.
4.3.7.1 No Primary Gas Swirl Figure 4.3.35 presents the velocity distribution and Figure 4.3.36 presents the temperature distribution. The O2 mole fraction is shown in Figure 4.3.37. The trajectories and burnout of the 69 micron and 169 micron coal particles are shown in Figure 4.3.38 and Figure 4.3.39. Due to the low oxygen content of the primary gas (3.0%, by vol.), coal burnout is relatively small, especially for the larger particles as can be seen in Figure 4.3.39. Consequently, it is necessary to add swirl to the primary gas to bring the coal particles (especially the larger sizes) in contact with the secondary gas.
4.3.7.2 Primary Gas Swirl Ratio = 0.5 Figure 4.3.40 presents the velocity distribution and Figure 4.3.41 presents the temperature distribution. Comparing Figure 4.3.36 with Figure 4.3.41 demonstrates that the addition of the 0.5 PG swirl increases the maximum flame temperature by 220oF and also increases the flame core temperature. Increasing the core temperature creates a more stable flame since the secondary gas swirl recirculates the hot flue gas back to the flame ignition point. The O2 mole fraction is shown in Figure 4.3.42. The trajectories and burnout of the 69 micron and 169 micron coal particles are shown in Figure 4.3.43 and Figure 4.3.44. Note that with the 0.5 PG swirl ratio approximately 49% of the larger coal particles are burned (Figure 4.3.44) as compared to only about 18% for a zero PG swirl ratio (Figure 4.3.39).
96

Figure 4.3.1 – Oxygen-Fired Burner Geometry
DnoDso Dfd Dt
<fd
<t
Lsw SBsw dl
<Dsw
Lb
Lfd
Dtunnel
Ltunnel
No OFG 20% OFG No OFG 20% OFGDt in. 32 29 29 25
Dfd in. 22.25 21 21 19SBsw in. 13 12 11.875 11.875Lsw in. 9 8.375 8.375 8.375
<Dsw deg. 18 18 18 18Lfd in. 4 4 4 4<fd deg. 22.5 22.5 22.5 22.5dl in. 12 11 11.25 11.25<t deg. 22.5 22.5 22.5 22.5
Dno in. 15.5 15.5 15.5 15.5Dso in. 10 10 10 10Lb in. 20 20 20 20
Dtunnel in. 120 120 120 120Ltunnel in. 144 144 144 144
65 % Flue Gas Recycle 56 % Flue Gas Recycle
97
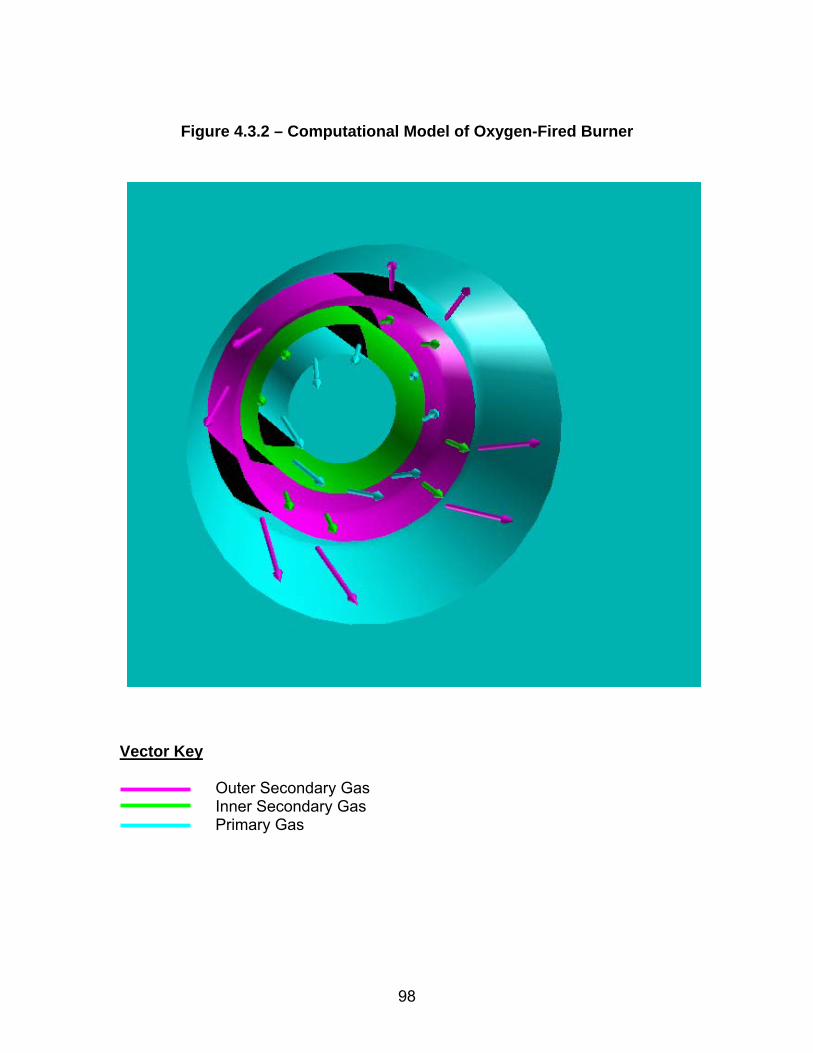
Figure 4.3.2 – Computational Model of Oxygen-Fired Burner
Vector Key Outer Secondary Gas Inner Secondary Gas
Primary Gas
98

Table 4.3.1 – Coal Properties
Coal Size Distribution< 75 micron % 85
< 150 micron % 99
Size (micron)10.7 lb/hr 3,54033.7 lb/hr 4,58069.3 lb/hr 3,106
118.2 lb/hr 654169.2 lb/hr 120Total lb/hr 12,000
Coal Ultimate AnalysisAsh % 9.99%
S % 2.51%H % 4.50%C % 63.75%
H2O % 11.12%N % 1.25%O % 6.88%
Total % 100.00%
Volatile Matter (daf) % 44.35%Density lb/ft3 80.0
HHV, as received Btu/lb 11,666
99
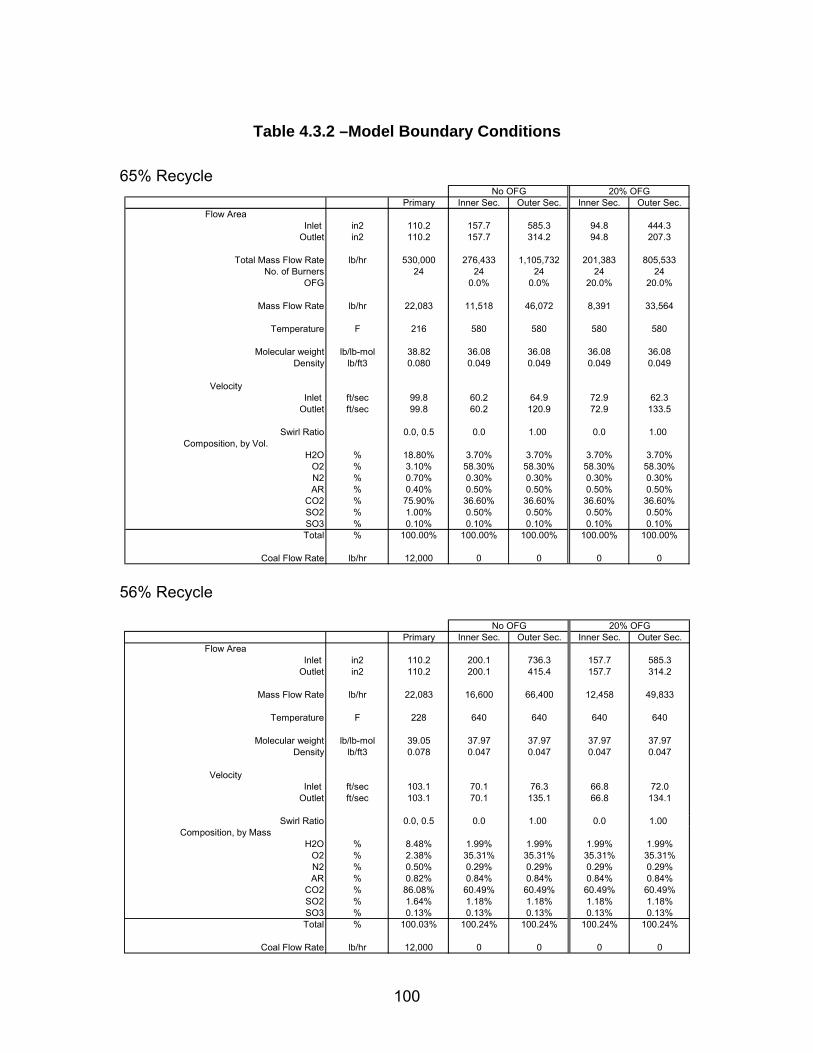
Table 4.3.2 –Model Boundary Conditions
65% Recycle
Primary Inner Sec. Outer Sec. Inner Sec. Outer Sec.Flow Area
Inlet in2 110.2 157.7 585.3 94.8 444.3Outlet in2 110.2 157.7 314.2 94.8 207.3
Total Mass Flow Rate lb/hr 530,000 276,433 1,105,732 201,383 805,533No. of Burners 24 24 24 24 24
OFG 0.0% 0.0% 20.0% 20.0%
Mass Flow Rate lb/hr 22,083 11,518 46,072 8,391 33,564
Temperature F 216 580 580 580 580
Molecular weight lb/lb-mol 38.82 36.08 36.08 36.08 36.08Density lb/ft3 0.080 0.049 0.049 0.049 0.049
VelocityInlet ft/sec 99.8 60.2 64.9 72.9 62.3
Outlet ft/sec 99.8 60.2 120.9 72.9 133.5
Swirl Ratio 0.0, 0.5 0.0 1.00 0.0 1.00Composition, by Vol.
H2O % 18.80% 3.70% 3.70% 3.70% 3.70%O2 % 3.10% 58.30% 58.30% 58.30% 58.30%N2 % 0.70% 0.30% 0.30% 0.30% 0.30%AR % 0.40% 0.50% 0.50% 0.50% 0.50%
CO2 % 75.90% 36.60% 36.60% 36.60% 36.60%SO2 % 1.00% 0.50% 0.50% 0.50% 0.50%SO3 % 0.10% 0.10% 0.10% 0.10% 0.10%Total % 100.00% 100.00% 100.00% 100.00% 100.00%
Coal Flow Rate lb/hr 12,000 0 0 0 0
No OFG 20% OFG
56% Recycle
Primary Inner Sec. Outer Sec. Inner Sec. Outer Sec.Flow Area
Inlet in2 110.2 200.1 736.3 157.7 585.3Outlet in2 110.2 200.1 415.4 157.7 314.2
Mass Flow Rate lb/hr 22,083 16,600 66,400 12,458 49,833
Temperature F 228 640 640 640 640
Molecular weight lb/lb-mol 39.05 37.97 37.97 37.97 37.97Density lb/ft3 0.078 0.047 0.047 0.047 0.047
VelocityInlet ft/sec 103.1 70.1 76.3 66.8 72.0
Outlet ft/sec 103.1 70.1 135.1 66.8 134.1
Swirl Ratio 0.0, 0.5 0.0 1.00 0.0 1.00Composition, by Mass
H2O % 8.48% 1.99% 1.99% 1.99% 1.99%O2 % 2.38% 35.31% 35.31% 35.31% 35.31%N2 % 0.50% 0.29% 0.29% 0.29% 0.29%AR % 0.82% 0.84% 0.84% 0.84% 0.84%
CO2 % 86.08% 60.49% 60.49% 60.49% 60.49%SO2 % 1.64% 1.18% 1.18% 1.18% 1.18%SO3 % 0.13% 0.13% 0.13% 0.13% 0.13%Total % 100.03% 100.24% 100.24% 100.24% 100.24%
Coal Flow Rate lb/hr 12,000 0 0 0 0
No OFG 20% OFG
100
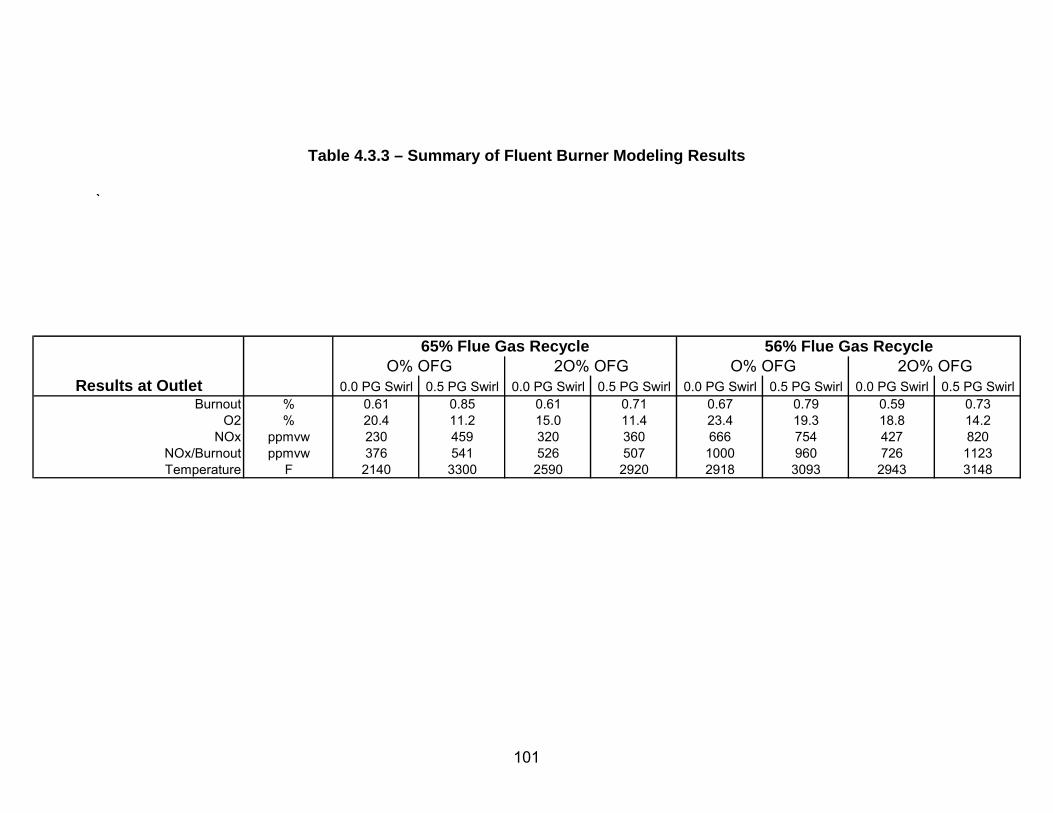
Table 4.3.3 – Summary of Fluent Burner Modeling Results
`
Results at Outlet 0.0 PG Swirl 0.5 PG Swirl 0.0 PG Swirl 0.5 PG Swirl 0.0 PG Swirl 0.5 PG Swirl 0.0 PG Swirl 0.5 PG SwirlBurnout % 0.61 0.85 0.61 0.71 0.67 0.79 0.59 0.73
O2 % 20.4 11.2 15.0 11.4 23.4 19.3 18.8 14.2NOx ppmvw 230 459 320 360 666 754 427 820
NOx/Burnout ppmvw 376 541 526 507 1000 960 726 1123Temperature F 2140 3300 2590 2920 2918 3093 2943 3148
O% OFG 2O% OFG O% OFG 2O% OFG65% Flue Gas Recycle 56% Flue Gas Recycle
101
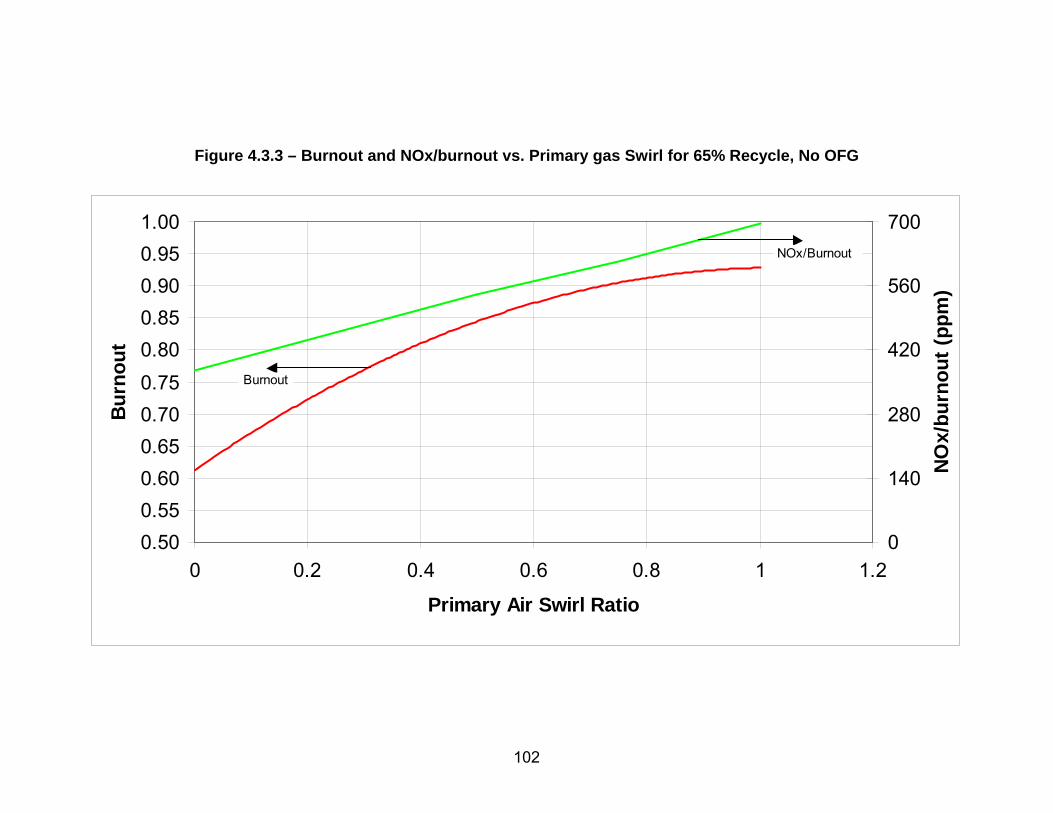
Figure 4.3.3 – Burnout and NOx/burnout vs. Primary gas Swirl for 65% Recycle, No OFG
0.500.550.600.650.700.750.800.850.900.951.00
0 0.2 0.4 0.6 0.8 1 1.2
Primary Air Swirl Ratio
Bur
nout
0
140
280
420
560
700
NO
x/bu
rnou
t (pp
m)
NOx/Burnout
Burnout
102

Figure 4.3.4 – Gas Velocity for 65% Recycle, No OFG, 0.0 PG Swirl
103

Figure 4.3.5 – Gas Temperature for 65% Recycle, No OFG, 0.0 PG Swirl
104

Figure 4.3.6 – O2 Mole Fraction for 65% Recycle, No OFG, 0.0 PG Swirl
105

Figure 4.3.7 – Burnout of 69µ Particles for 65% Recycle, No OFG, 0.0 PG
Swirl
0% 10% 20% 30% 40% 50% 60% 70% 80% 90% 100%
106

Figure 4.3.8 – Burnout of 169µ Particles for 65% Recycle, No OFG, 0 PG
Swirl
0% 10% 20% 30% 40% 50% 60% 70% 80% 90% 100%
107
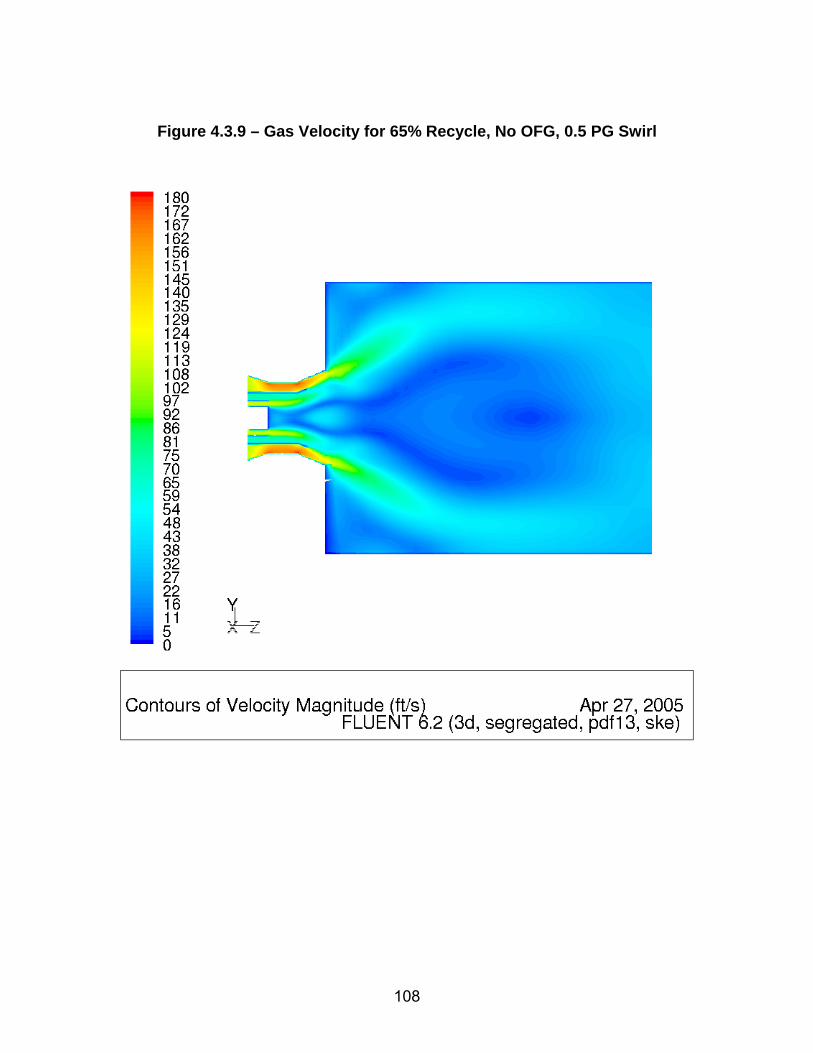
Figure 4.3.9 – Gas Velocity for 65% Recycle, No OFG, 0.5 PG Swirl
108

Figure 4.3.10 – Gas Temperature for 65% Recycle, No OFG, 0.5 PG Swirl
109
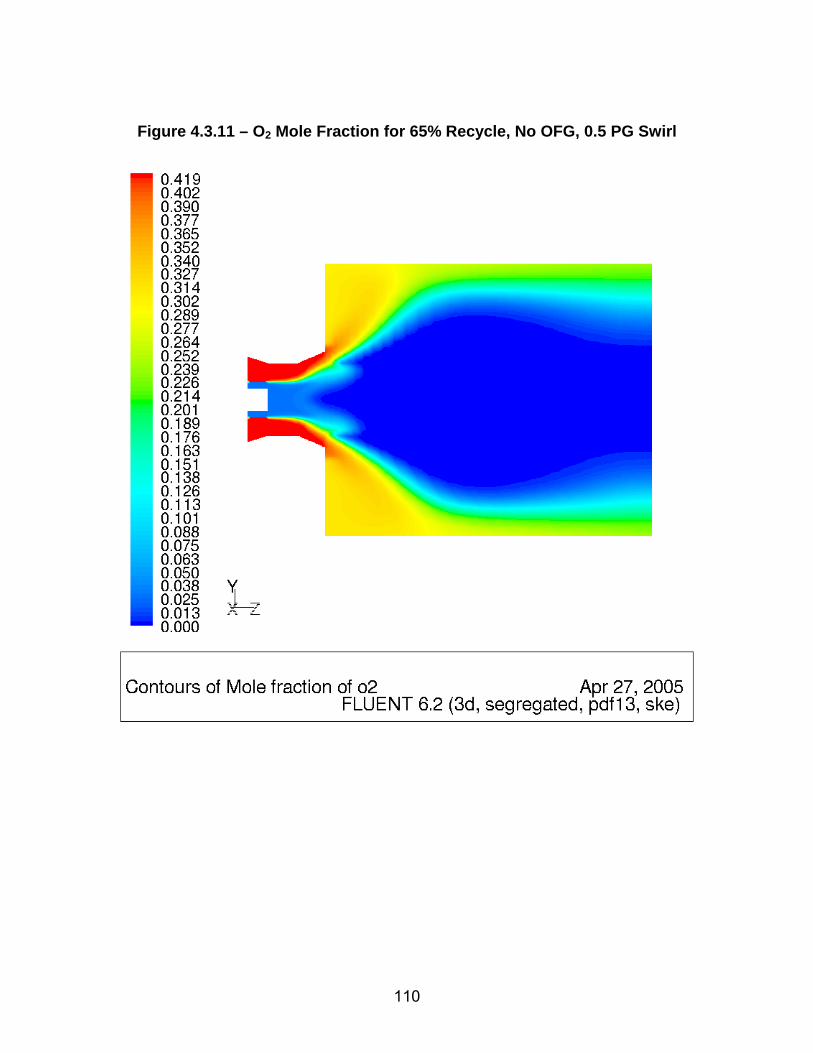
Figure 4.3.11 – O2 Mole Fraction for 65% Recycle, No OFG, 0.5 PG Swirl
110

Figure 4.3.12 – Velocity Vectors Colored by Axial Velocity (ft/sec) for 65%
Recycle, No OFG, 0.5 PG Swirl
111

Figure 4.3.13 – Burnout of 69µ Particles for 65% Recycle, No OFG, 0.0 PG
Swirl
0% 10% 20% 30% 40% 50% 60% 70% 80% 90% 100%
112

Figure 4.3.14 – Burnout of 169µ Particles for 65% Recycle, No OFG, 0 PG
Swirl
0% 10% 20% 30% 40% 50% 60% 70% 80% 90% 100%
113
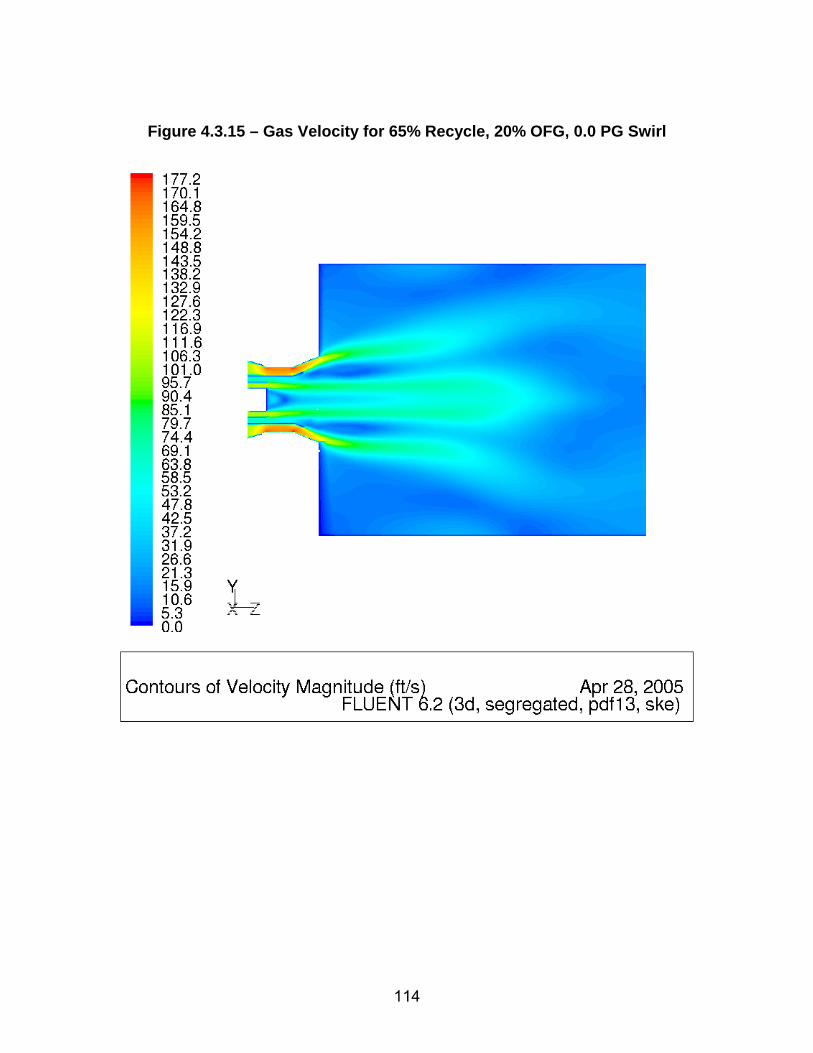
Figure 4.3.15 – Gas Velocity for 65% Recycle, 20% OFG, 0.0 PG Swirl
114

Figure 4.3.16 – Gas Temperature for 65% Recycle, 20% OFG, 0.0 PG Swirl
115

Figure 4.3.17 – O2 Mole Fraction for 65% Recycle, 20% OFG, 0.0PG Swirl
116
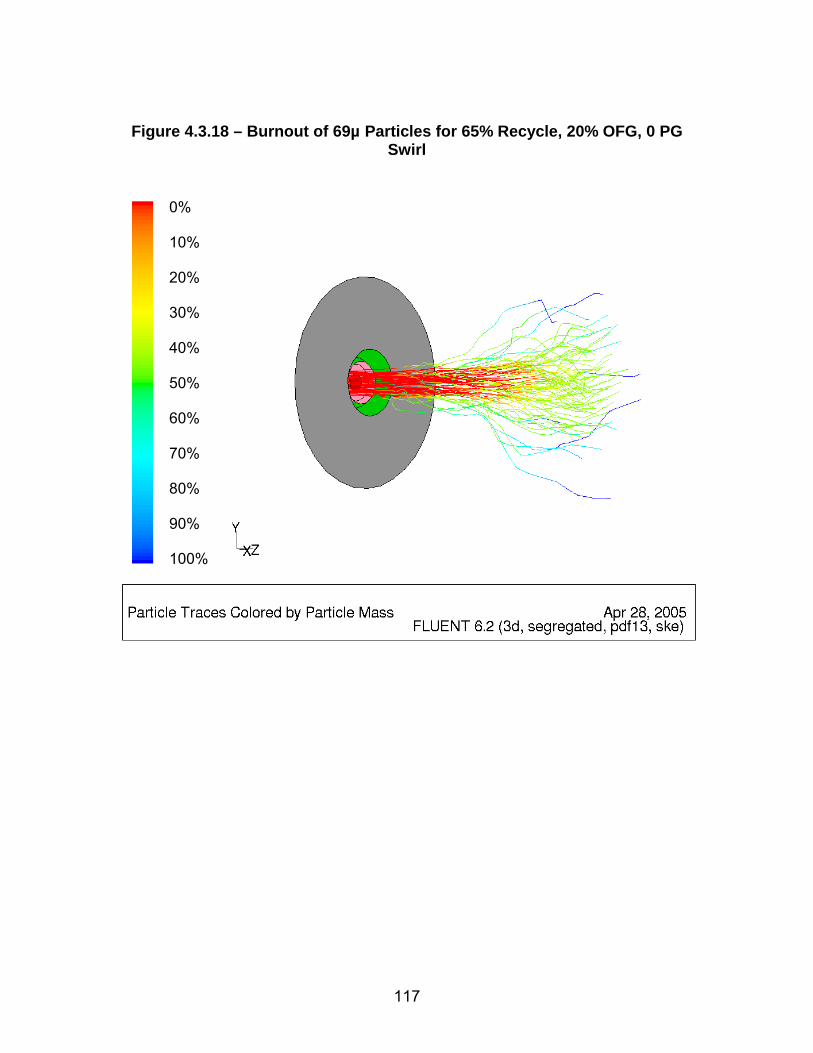
Figure 4.3.18 – Burnout of 69µ Particles for 65% Recycle, 20% OFG, 0 PG
Swirl
0% 10% 20% 30% 40% 50% 60% 70% 80% 90% 100%
117

Figure 4.3.19 – Burnout of 169µ Particles for 65% Recycle, 20% OFG, 0 PG
Swirl
0% 10% 20% 30% 40% 50% 60% 70% 80% 90% 100%
118

Figure 4.3.20 – Gas Velocity for 65% Recycle, 20% OFG, 0.5 PG Swirl
119
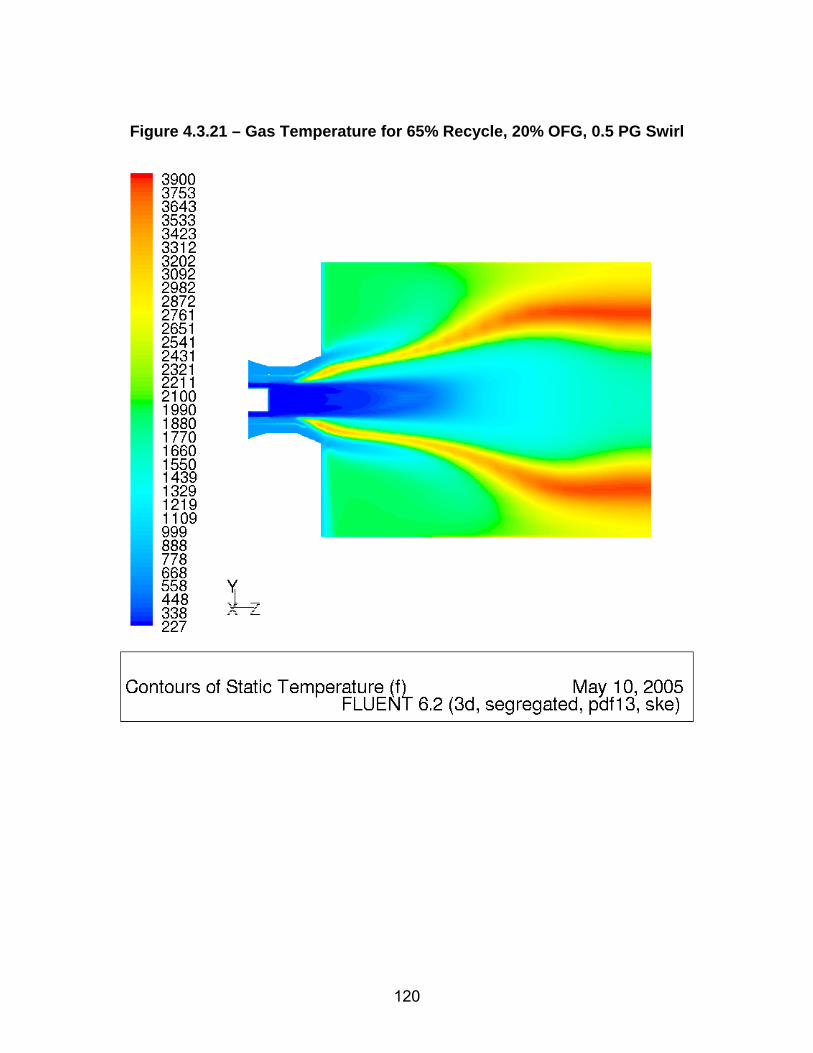
Figure 4.3.21 – Gas Temperature for 65% Recycle, 20% OFG, 0.5 PG Swirl
120

Figure 4.3.22 – O2 Mole Fraction for 65% Recycle, 20% OFG, 0.5 PG Swirl
121
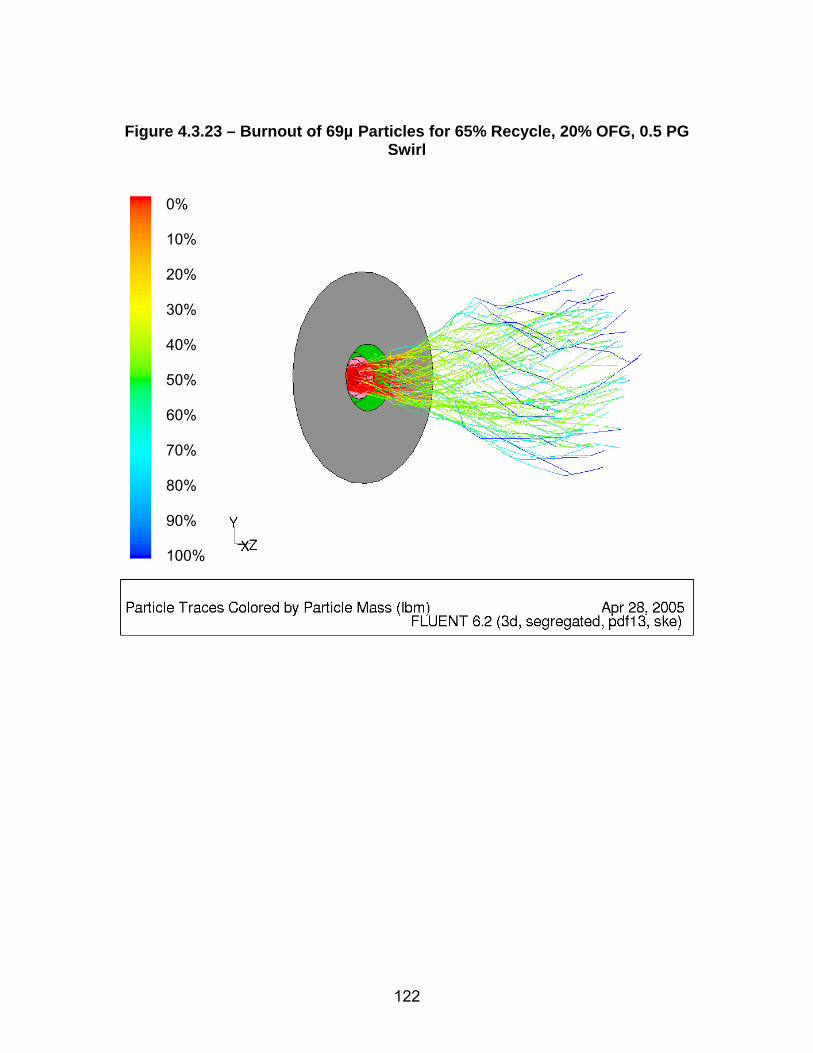
Figure 4.3.23 – Burnout of 69µ Particles for 65% Recycle, 20% OFG, 0.5 PG
Swirl
0% 10% 20% 30% 40% 50% 60% 70% 80% 90% 100%
122

Figure 4.3.24 – Burnout of 169µ Particles for 65% Recycle, 20% OFG, 0.5 PG
Swirl
0% 10% 20% 30% 40% 50% 60% 70% 80% 90% 100%
123
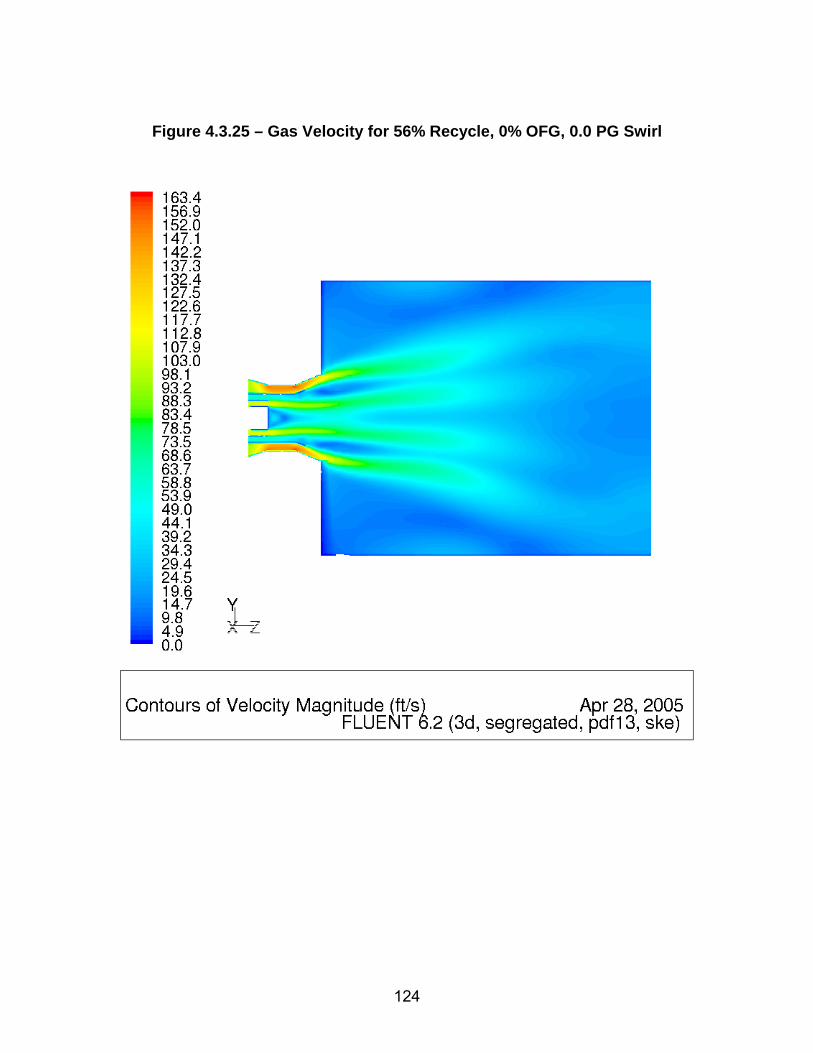
Figure 4.3.25 – Gas Velocity for 56% Recycle, 0% OFG, 0.0 PG Swirl
124
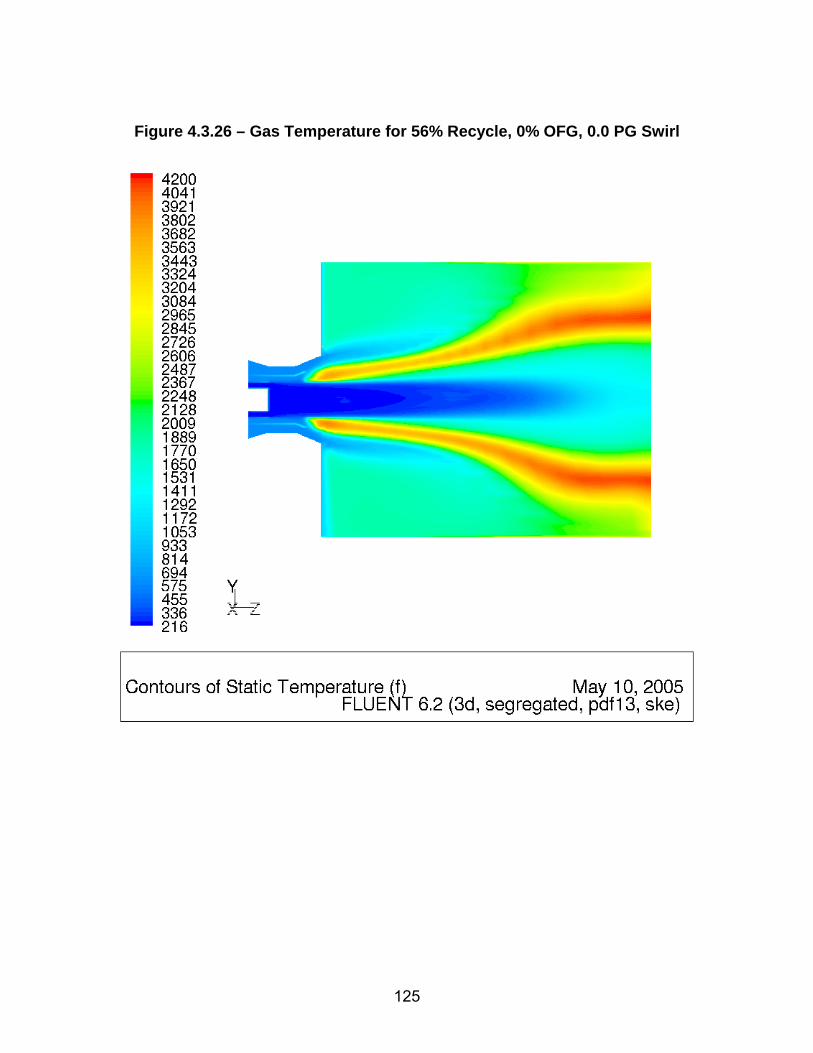
Figure 4.3.26 – Gas Temperature for 56% Recycle, 0% OFG, 0.0 PG Swirl
125
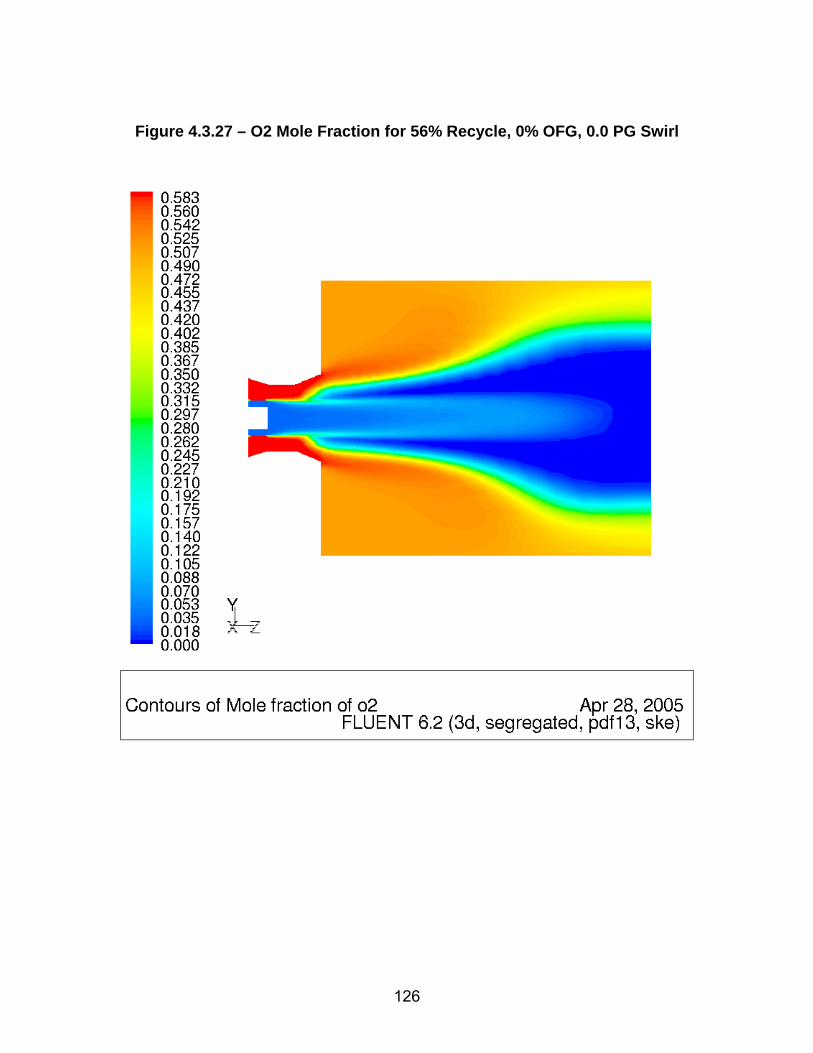
Figure 4.3.27 – O2 Mole Fraction for 56% Recycle, 0% OFG, 0.0 PG Swirl
126

Figure 4.3.28 – Burnout of 69µ Particles for 56% Recycle, 0% OFG, 0 PG
Swirl
0% 10% 20% 30% 40% 50% 60% 70% 80% 90% 100%
127

Figure 4.3.29 – Burnout of 169µ Particles for 56% Recycle, 0% OFG, 0 PG
Swirl
0% 10% 20% 30% 40% 50% 60% 70% 80% 90% 100%
128

Figure 4.3.30 – Gas Velocity for 56% Recycle, 0% OFG, 0.5 PG Swirl
129

Figure 4.3.31 – Gas Temperature for 56% Recycle, 0% OFG, 0.5 PG Swirl
130

Figure 4.3.32 – O2 Mole Fraction for 56% Recycle, 0% OFG, 0.5 PG Swirl
131

Figure 4.3.33 – Burnout of 69µ Particles for 56% Recycle, 0% OFG, 0.5 PG
Swirl
0% 10% 20% 30% 40% 50% 60% 70% 80% 90% 100%
132

Figure 4.3.34 – Burnout of 169µ Particles for 56% Recycle, 0% OFG, 0.5 PG
Swirl
0% 10% 20% 30% 40% 50% 60% 70% 80% 90% 100%
133

Figure 4.3.35 – Gas Velocity for 56% Recycle, 20% OFG, 0. PG Swirl
134

Figure 4.3.36 – Gas Temperature for 56% Recycle, 20% OFG, 0. PG Swirl
135

Figure 4.3.37 – O2 Mole Fraction for 56% Recycle, 20% OFG, 0. PG Swirl
136

Figure 4.3.38 – Burnout of 69µ Particles for 56% Recycle, 20% OFG, 0. PG
Swirl
0% 10% 20% 30% 40% 50% 60% 70% 80% 90% 100%
137
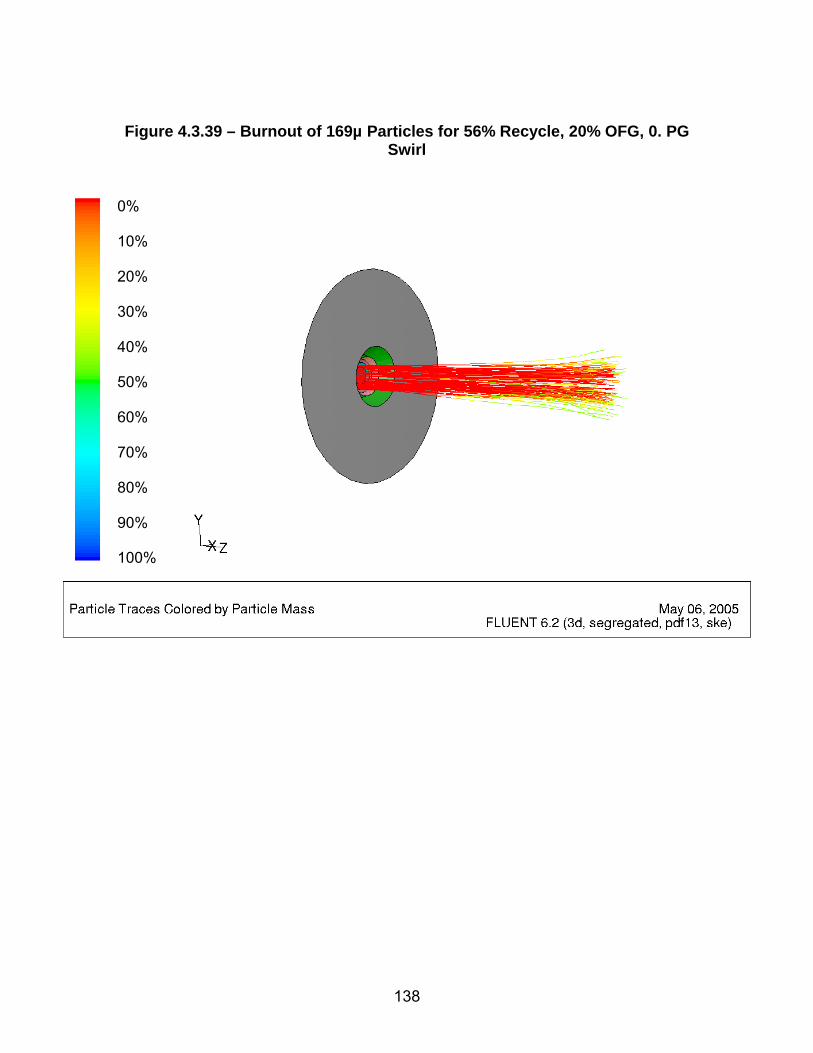
Figure 4.3.39 – Burnout of 169µ Particles for 56% Recycle, 20% OFG, 0. PG
Swirl
0% 10% 20% 30% 40% 50% 60% 70% 80% 90% 100%
138

Figure 4.3.40 – Gas Velocity for 56% Recycle, 20% OFG, 0.5 PG Swirl
139
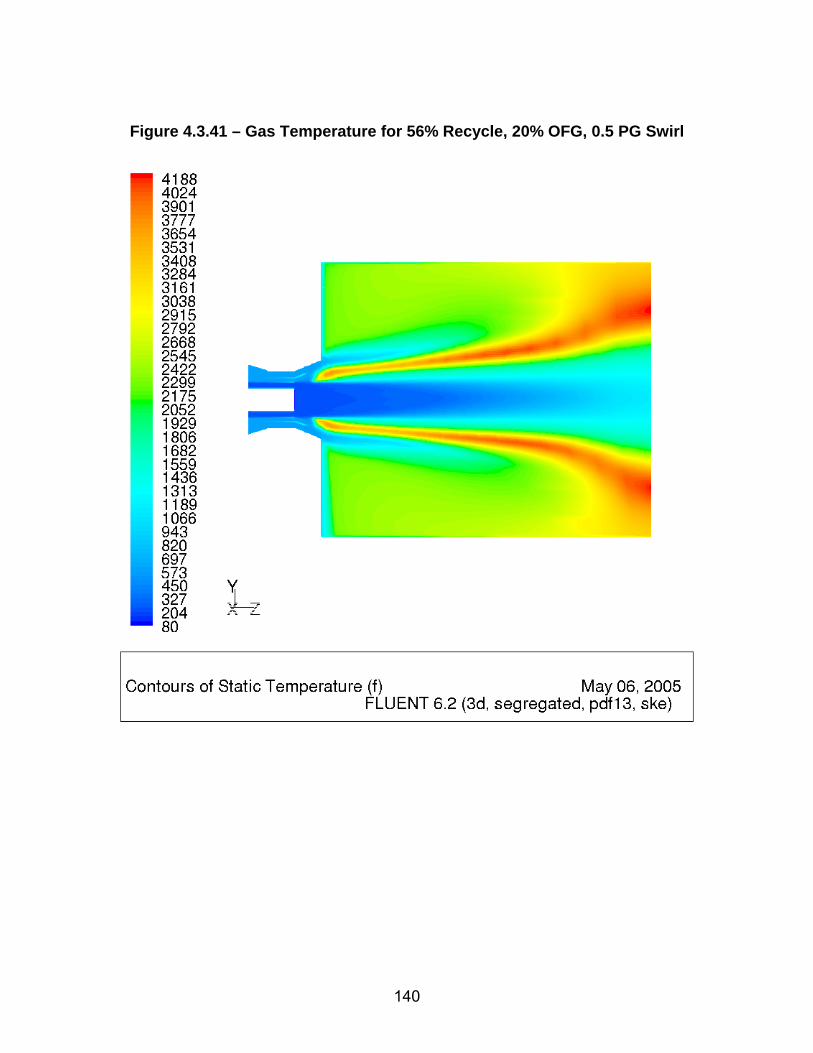
Figure 4.3.41 – Gas Temperature for 56% Recycle, 20% OFG, 0.5 PG Swirl
140

Figure 4.3.42 – O2 Mole Fraction for 56% Recycle, 20% OFG, 0.5 PG Swirl
141

Figure 4.3.43 – Burnout of 69µ Particles for 56% Recycle, 20% OFG, 0.5 PG
Swirl
0% 10% 20% 30% 40% 50% 60% 70% 80% 90% 100%
142

Figure 4.3.44 – Burnout of 169µ Particles for 56% Recycle, 20% OFG, 0.5 PG
Swirl
0% 10% 20% 30% 40% 50% 60% 70% 80% 90% 100%
143

4.4 Furnace and HRA Design and Analysis
4.4.1 Furnace Design and Analysis
4.4.1.1 FW-FIRE Computer Program Description
FW-FIRE (Fossil fuel, Water-walled Furnace Integrated Reaction and Emission Simulation) simulates furnace combustion, heat transfer and pollutant formation based on fundamental principles of mass, momentum, and energy conservation [21]. FW-FIRE is an extended and enhanced version of PCGC-3, which was developed over a period of ten years by the Advanced Combustion Engineering Research Center (ACERC), operated jointly by Brigham Young University and the University of Utah. The FW-FIRE computer program incorporates the latest state-of-art coal combustion/gasification, pollutant formation, and physical analysis techniques based on extensive empirical research. The FW-FIRE code performs general three dimensional multiphase gas combustion steady state analysis of reactive fluid flows. The program is fully capable of analyzing gas-fired and coal-fired boilers although FW-FIRE was initially tailored for pulverized coal combustion and gasification. The FW-FIRE program models the gas flow field as a three dimensional (Cartesian or cylindrical) turbulent reacting continuum that is described locally by the Newtonian form of the Navier-Stokes equations coupled with the energy equation and other appropriate constitutive equations. These equations are solved in Eulerian framework to predict gas properties such as pressure, temperature, velocity, and pollutants and other species concentrations. The Reynolds stress terms, which result from Favre-averaging of the conservation equations, are approximated using the Boussinesq assumption and effective eddy viscosity. The value of the eddy viscosity and subsequent closure of the turbulence equations is made using either a linear or non-linear k-ε two-equation model. The effects of turbulence of the flow field on the combustion reactions are included. The turbulent flow field is also coupled with the combustion chemistry. Since gaseous reactions are limited by mixing rates and not reaction kinetics, the process chemistry is calculated using locally instantaneous equilibrium based on the degree of mixing of the species. Rate constants for processes such as devolatilization (two step process) and char oxidation are built-in to the program based on empirical testing. A Lagrangian model of the particle conservation equations is used to predict particle transport by characterizing the particle field as a series of discrete particle trajectories through the gas continuum. Particles interact with the gas
144

field via mass, momentum, and energy exchange. Particle properties such as burnout, velocities, temperatures, and particle component compositions are obtained by integrating the governing equations along the trajectory paths. The program possesses the capability to input a particle size distribution and chemical composition. In a pulverized coal flame, the radiation field is a multi-component, non-uniform, emitting, absorbing, gas-particle system. The coal particles cause anisotropic and multiple scattering, and the flame is surrounded by non-uniform, emitting, reflecting, absorbing surfaces. The radiation field calculations are based on an energy balance on a beam of radiation passing through a volume element containing the absorbing-reflecting-emitting medium. An Eulerian framework using a discrete-ordinates approach is used to model this process. Heat transfer via radiation and convection to waterwall and tube banks is determined by specifying a local wall temperature and emissivity. The set of non-linear differential equations is discretized and combined by a upwind and weighted central-differencing scheme. The resulting gas flow field finite difference equations are solved using variations of the SIMPLE/SIMPER algorithm. FW-FIRE contains a sub-model for the prediction of nitrogen pollutant emissions. This sub-model has the capability of predicting both fuel and thermal NOx formation. Fuel NO formation can proceed directly to N2 and NO (such as in the case of char) or through HCN and NH3 which are oxidized to form NO and reduced to N2 (such as in the case of volatiles). Global reaction rates are based on work by de Soete and Bose. Thermal NO formation is governed by the extended Zel=dovich mechanism.
4.4.1.2 Model Geometry A simulation was made for both the reference air-fired case and for the oxygen-fired case. The FW-FIRE model simulates the furnace, in height from the bottom of the hopper to the roof, in depth from the front wall to the rear wall, and in width from the left side wall to the right side wall. Furnace partial division walls are also included in the model. Finer meshes are used to model the burners and over-fire air (OFA) ports. The air-fired model contains 528,840 (117x113x40) nodes and is shown in Figure 4.4.1. Two oxygen-fired models were constructed: one with no OFG ports and the second with OFG ports. The oxygen-fired model without OFG ports contains 364,320 (132x69x40) and is shown in Figure 4.4.2. The oxygen-fired model with OFG ports contains 484,160 (136x89x40) nodes and is shown in Figure 4.4.3.
145

4.4.1.3 Boundary Conditions Boundary conditions are based on ASPEN simulations of the power plant (Section 4.2). The air-fired and oxygen-fired ASPEN reference cycle diagrams are presented in Figure 4.2.1 and Figure 4.2.25, respectively The input data required by FW-FIRE include fuel analysis, coal particle size distribution (mass percentage for each size bin), waterwall fluid temperatures, and the velocities, flow rates and temperatures of primary and secondary gas streams. Boundary conditions are detailed in Table 4.4.1 and Table 4.4.2. The waterwalls of the furnace are assumed to be gray and diffusive. The wall temperature at each location is calculated based on the fluid temperature and the heat flux at the wall cell. For the waterwalls, a fluid saturation temperature of 680oF corresponding to a pressure of 2700 psia is applied. For the partial division walls, a steam inlet temperature of 712oF and a steam outlet temperature of 848oF are applied. For coal devolatilization kinetic properties, Ubhayakar rate parameters were employed for bituminous coal. For bituminous char oxidation, Sandia kinetic and burning mode parameters were applied for Illinois #6 coal.
4.4.1.4 Air-Fired Reference Case The general layout drawing of the air-fired reference case is shown in Figure 4.4.4. The furnace has a total 24 opposed wall-fired burners (3 vertical x 4 horizontal x 2 walls) and 10 overfire air ports. 30% of the total combustion air is injected through the over-fire air ports located at one burner pitch above the top burner row. The radiant heat transfer surface consists of 2.75” OD tube waterwalls and five 2.0” OD tube partial divisional wall panels. Water is circulated in the furnace by natural circulation. The boundary conditions were applied to the computational model and FW-FIRE was run until steady state conditions were achieved. The modeling results are summarized in Table 4.4.3. The coal burnout shown in the table is the percentage of dry ash-free based coal burned. The furnace exit gas temperature (FEGT) shown in the table is the average temperature of flue gas before the platen superheaters (vertical plane above the nose). The energy absorption listed is the total energy absorbed by water walls and partial division walls prior to the vertical plane above the nose. Total furnace absorption and FEGT predicted by FW-FIRE and ASPEN match closely. Figure 4.4.5 is a plot of the flue gas velocity magnitude in a vertical plane through the second burner column. It can be seen that the gas velocity near the burners accelerates to greater than 150 ft/s due to the reduced gas density after particle ignition. Figure 4.4.6 presents a plot of gas temperature in a vertical plane through the second burner column. The maximum flue gas temperature is
146
approximately 3300oF. The mole fraction of O2 through the second burner column is presented in Figure 4.4.7. The heat flux at the furnace water wall is shown in Figure 4.4.8. The maximum heat flux is approximately 70,000 Btu/hr-ft2 and is located on the side wall at the top of the burner zone. The total heat absorbed by the furnace walls before the furnace exit is 1840 MM Btu/hr. Figure 4.4.9 displays temperatures of the furnace walls and roof. The maximum temperature of the waterwalls is approximately 800oF and of the division walls is approximately 875oF. Figure 4.4.10 presents the CO concentration at the wall, peaks at approximately 10% due to the sub-stoichiometric conditions of the lower furnace (without overfire air the wall CO would be below 2%). The trajectories of the 72-micron particles are plotted in Figure 4.4.11 with colors in each trajectory representing the mass fraction of char in the particle. Char is formed from devolatilization and consumed by oxidation. The maximum char mass fraction is usually less than the mass fraction of fixed carbon in a proximate analysis. Figure 4.4.11 shows that all of the 72-micron particles are completely burned before the furnace exit. The trajectories of 176-micron particles are plotted in Figure 4.4.12. It can be observed from Figure 4.4.12 that some particles are not completely burned at the exit of the furnace, causing unburned carbon in the fly ash. Total burnout of all particle sizes is 99.66% (2.61% LOI). Average NOx concentration at the furnace outlet is 227 ppmvw (0.34 lb/MMBtu). A series of runs were made to determine the furnace average outlet NOx as a function of over-fire air flow. Figure 4.4.13 presents the NOx concentration at the furnace outlet as a function of OFA flow. Increasing OFA can have a negative effect on fuel burnout. Figure 4.4.14 presents the fuel burnout versus OFA flow.
4.4.1.5 Oxygen-Fired Design Case The preliminary size of the furnace heat transfer area was based on a calculation of average wall heat flux using the Foster Wheeler computer program, EMISS [23]. The EMISS computer program calculates radiative heat flux of CO2 and H2O gases. A three dimensional CFD run was then made using FW-FIRE to more accurately determine the total heat absorption. Based on the CFD results, the height of the furnace model was adjusted until the total heat absorption approximately matched that required in the ASPEN oxygen-fired design case. Figure 4.4.15 shows a comparison between the sizes of the resultant oxygen-fired furnace and the air-fired reference furnace. Compared to the air-fired furnace, the oxygen furnace has only approximately 65% of the surface area and approximately 45% of the volume. Figure 4.4.16 presents the oxygen-fired design general layout drawing. The oxygen-fired furnace has a total 24 opposed wall-fired burners (4 vertical x 3 horizontal x 2 walls) and 8 overfire gas ports. The burner designs (including 0.5
147
primary gas swirl) are based on the Low NOx Burner Design Task (see Section 4.3). The radiant heat transfer surface consists of 2.75” OD tube waterwalls and ten 2.0” OD tube partial divisional wall panels. Water is circulated in the furnace by natural circulation. Two designs were simulated: 1) without over-fire air and 2) with over-fire air. Since it is somewhat unknown how much NOx will be tolerated in the liquid CO2 effluent stream, a case with no OFG and a case with 20% OFG were run. The modeling results are summarized in Table 4.4.3. The coal burnout for the oxygen-fired case is 100% due to the high furnace temperature and high concentration of O2. Total furnace absorption and FEGT predicted by FW-FIRE and ASPEN match well. NOx is 333 ppmvw for the no OFG case and 257 ppmvw for the 20% OFG case. Thus, the injection of 20% OFG results in a NOx reduction of 23%. Although the average NOx concentration at the furnace outlet is similar on a volume basis for both air-fired and O2-fired PC, it is substantially less on a mass basis for the O2-fired PC due to the substantially lower volumetric flue gas flow rate of the O2-fired PC.
4.4.1.5.1 No OFG Case Figure 4.4.17 is a plot of the flue gas velocity magnitude in a vertical plane through the middle burner column. It can be seen that the gas velocity near the burners accelerates to nearly 150 ft/s due to the reduced gas density after particle ignition. Figure 4.4.18 presents a plot of gas temperature in a vertical plane through the middle burner column. The maximum flue gas temperature is approximately 3900oF. The mole fraction of O2 through the middle burner column is presented in Figure 4.4.19. The mixed primary/secondary gas O2 content (before combustion) is 42%. The heat flux at the furnace water wall is shown in Figure 4.4.20. The maximum heat flux is approximately 175,000 Btu/hr-ft2 and is located on the side wall at the top of the burner zone. This maximum heat flux is approximately 2.5 times the air-fired case due to the higher flame temperature and higher H2O and CO2 concentrations. The total heat absorbed by the furnace walls before the furnace exit is 2287 MM Btu/hr. Figure 4.4.21 displays temperatures of the furnace walls and roof. The maximum temperature of the waterwalls is approximately 935oF and of the division walls is approximately 945oF. Because of the higher temperature of the oxygen-fired case compared to the air-fired case, furnace water wall material was upgraded from 0.285” thick carbon steel (SA-210C) to 0.240” thick SA-213-T91. Figure 4.4.22 presents the CO concentration at the wall, which is significantly greater than for the air-fired case (Figure 4.4.10) and its effects on corrosion will need to be studied in future work. The trajectories of the 69-micron particles are plotted in Figure 4.4.23 with colors in each trajectory representing the mass fraction of char in the particle. Figure 4.4.23 shows that all of the 69-micron particles are completely burned before the
148

furnace exit. The trajectories of 169-micron particles are plotted in Figure 4.4.24. Note that due to the higher temperature and O2 concentration all the 169-micron particles are completely burned as compared to the air-fired case (Figure 4.4.12) where there is some residual unburned char at the outlet. Figure 4.4.25 shows the trajectories of 169-micron particles without primary gas swirl (this case was run prior to the finalization of the burner design analysis). Comparing Figure 4.4.24 with Figure 4.4.25 demonstrates that primary gas swirl achieves an earlier burnout of the large coal particles.
4.4.1.5.2 20% OFG Case Figure 4.4.26 is a plot of the flue gas velocity magnitude in a vertical plane through the middle burner column. It can be seen that the gas velocity near the burners accelerates to nearly 150 ft/s due to the reduced gas density after particle ignition. Figure 4.4.27 presents a plot of gas temperature in a vertical plane through the middle burner column. The maximum flue gas temperature is approximately 3750oF. The mole fraction of O2 through the middle burner column is presented in Figure 4.4.28. The mixed primary/secondary gas O2 content (before combustion) is 42%. The heat flux at the furnace water wall is shown in Figure 4.4.29. The maximum heat flux is approximately 165,000 Btu/hr-ft2 and is located on the side wall at the above the over-fire ports. This maximum heat flux is approximately 2.4 times the air-fired case due to the higher flame temperature and higher H2O and CO2 concentrations. The total heat absorbed by the furnace walls before the furnace exit is 2186 MM Btu/hr. Figure 4.4.30 displays temperatures of the furnace walls and roof. The maximum temperature of the waterwalls is approximately 930oF and of the division walls is approximately 945oF. Because of the higher temperature of the oxygen-fired case compared to the air-fired case, furnace water wall material was upgraded from 0.285” thick carbon steel (SA-210C) to 0.240” thick SA-213-T91. Figure 4.4.31 presents the CO concentration at the wall, which is significantly greater than for the air-fired case (Figure 4.4.10) and its effects on corrosion will need to be studied in future work. The trajectories of the 69-micron particles are plotted in Figure 4.4.32 with colors in each trajectory representing the mass fraction of char in the particle. Figure 4.4.32 shows that all of the 69-micron particles are completely burned before the furnace exit. The trajectories of 169-micron particles are plotted in Figure 4.4.33. Note that due to the higher temperature and O2 concentration all the 169-micron particles are completely burned as compared to the air-fired case (Figure 4.4.12) where there is some residual unburned char at the outlet. Figure 4.4.34 shows the trajectories of 169-micron particles without primary gas swirl (this case was run prior to the finalization of the burner design analysis). Comparing Figure 4.4.33 with Figure 4.4.34 demonstrates that primary gas swirl achieves an earlier burnout of the large coal particles.
149
4.4.2 Heat Recovery Area Design and Analysis
4.4.2.1 HEATEX Program Description HEATEX [22] is a Foster Wheeler general-purpose program for thermal/hydraulic analysis of tube banks. The program performs heat transfer calculations on a local basis by dividing the tube bundle into a number of small heat transfer elements.
4.4.2.2 Air-Fired Reference Case HEATEX was used to determine the heat recovery area (HRA) design of the convective tube banks between the furnace exit and the SCR/air heater. These tube banks include the finishing superheater, finishing reheater, primary superheater, primary reheater, upper economizer, and lower economizer. Flue gas exits the furnace at 2135ºF and flows over the finishing superheater and finishing reheater tube bundles where it heats the main steam and reheat steam to 1000ºF and 1005ºF, respectively. The gas flow is then split into two parallel flows: one passing over the primary reheater and the other passing over the primary superheater and upper economizer. The gas split is controlled by dampers to achieve the proper reheater outlet temperature. Attemperating spray is used to control superheat temperature. The flue gas is combined downstream of the dampers and flows over the lower economizer, which receives water from the last feedwater heater stage. Flue gas exits the lower economizer at 720ºF and is sent to the SCR and then to the air heater. Figure 4.2.1 presents the heat transfer requirements of the HRA banks. Table 4.4.4 presents the corresponding design of the HRA banks. Total surface area of all convective banks is 294,111 ft2. The performance of HRA tube banks is shown Table 4.4.5. The total heat transferred to the water/steam is 1354 MM Btu/hr as 3.88 MM lb/hr of flue gas is cooled from 2135ºF to 720ºF.
4.4.2.3 Oxygen-Fired Case Due to the 40% lower flue gas flow rate of the oxygen-fired case versus the air-fired case, the cross sectional area of the HRA is reduced to maintain the same gas side velocity (and pressure drop). HEATEX was used to determine the heat recovery area design of the convective tube banks between the furnace exit and the gas recuperator. These tube banks include the finishing superheater, finishing reheater, primary superheater, primary reheater, and lower economizer. Flue gas exits the furnace at 2350ºF and flows over the finishing superheater and finishing reheater tube bundles where it heats the main steam and reheat steam to 1000ºF and 1005ºF, respectively. The gas flow is then split into two parallel flows: one passing over the primary reheater and the other passing over the primary superheater. The gas split is controlled by dampers to achieve the proper reheater outlet temperature. Attemperating spray is used to control superheat
150

temperature. The flue gas is combined downstream of the dampers and flows over the lower economizer, which receives water from the last feedwater heater stage. Flue gas exits the lower economizer at 650ºF and is sent to the gas recuperator. Figure 4.2.25 presents the heat transfer requirements of the HRA banks. Table 4.4.4 presents the corresponding design of the HRA banks. Total surface area of all convective banks is 215,700 ft2. The performance of HRA tube banks is shown in Table 4.4.5.The total heat transferred to the water/steam is 1096 MM Btu/hr as 2.20 MM lb/hr of flue gas is cooled from 2350ºF to 650ºF. The total heat transfer surface required in the oxygen-fired HRA is 25% less than the air-fired HRA due to the following main reasons:
1. More heat is absorbed in the oxygen-fired furnace (2264 MM Btu/hr) than the air-fired furnace (1894 MM Btu/hr) due to the higher adiabatic temperature and greater the specific heat of the oxygen-fired furnace flue gas. This requires less heat transfer duty in the HRA (as a consequence the upper economizer is not needed)
2. A higher heat transfer coefficient can be achieved in the oxygen-fired
HRA than the air-fired HRA for the same flue gas pressure loss due to greater molecular weight (38 mol/lb-mol vs. 29 mol/lb-mol) of the oxygen-fired flue gas.
The HRA tube materials and wall thickness are practically the same for the air-fired and oxygen-fired design since the flue gas and water/steam temperature profiles encountered by the heat transfer banks are very similar.
151
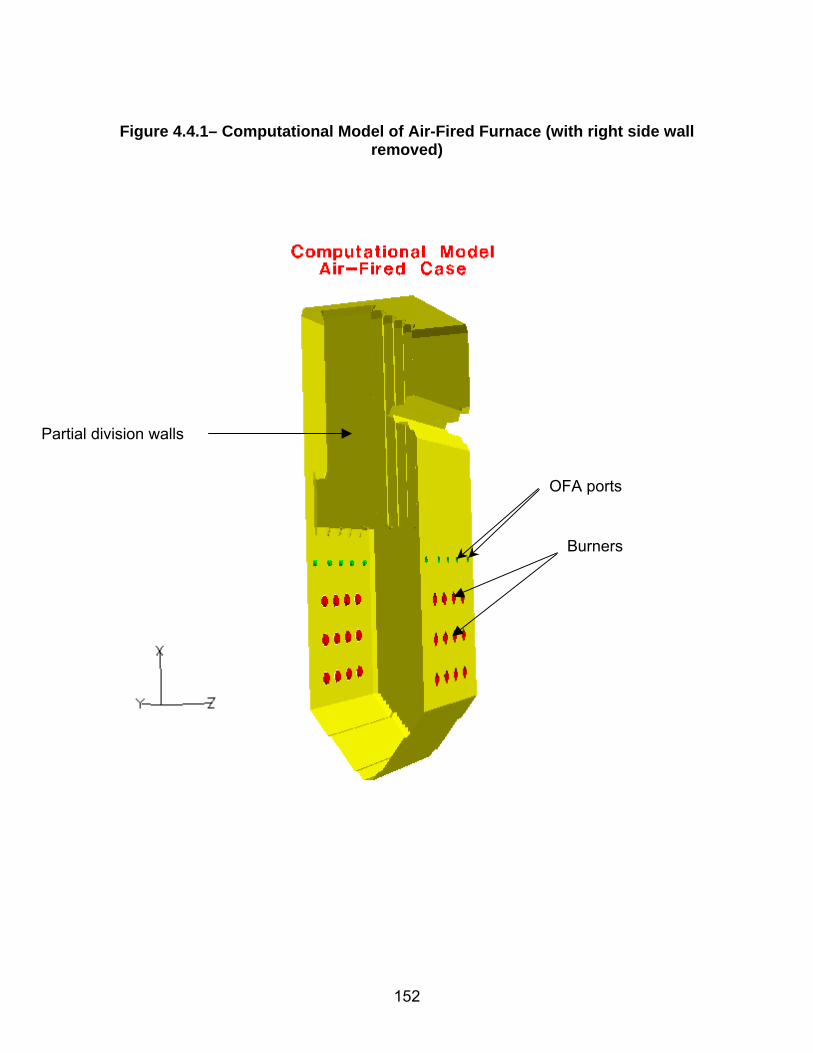
Figure 4.4.1– Computational Model of Air-Fired Furnace (with right side wall
removed)
Burners
OFA ports
Partial division walls
152

Figure 4.4.2 – Computational Model of Oxygen-Fired Furnace Without OFG
Partial division walls
Burners
153
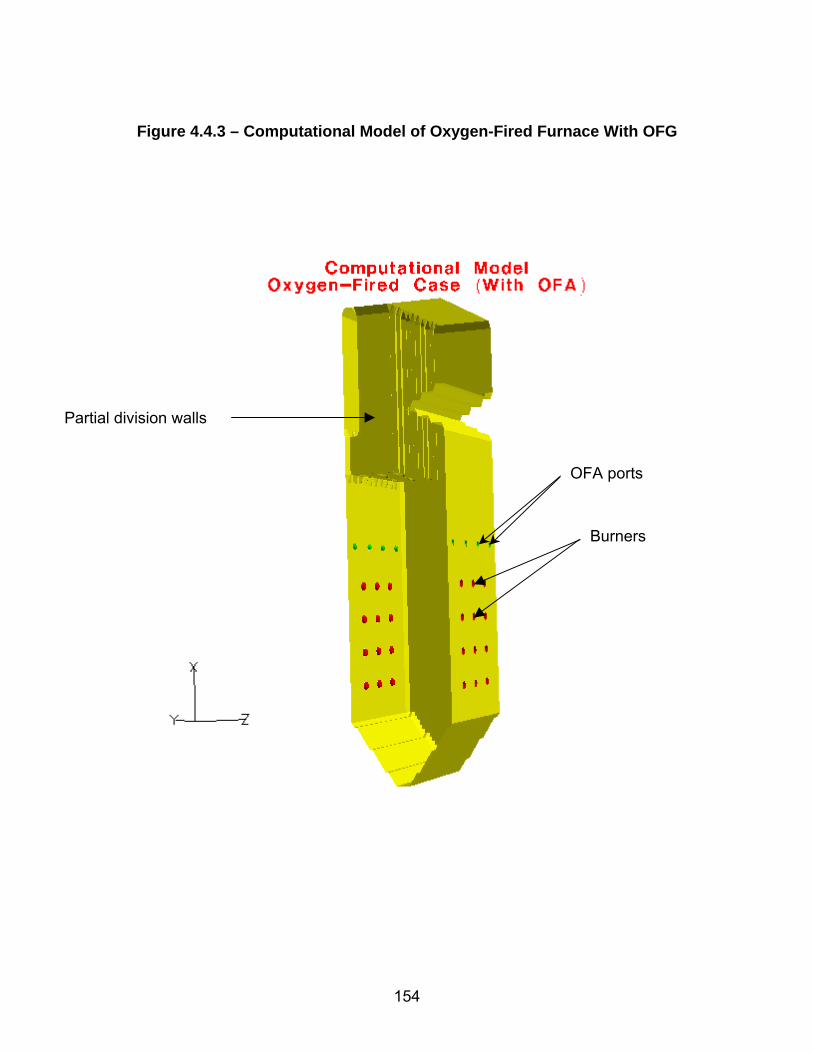
Figure 4.4.3 – Computational Model of Oxygen-Fired Furnace With OFG
Partial division walls
Burners
OFA ports
154

Table 4.4.1 – Air-Fired Boundary Conditions
Coal Size (micron)Ultimate Analysis Distribution Mass Percent
Ash % 9.99% 9.3 % 28.9S % 2.51% 33.7 % 27.3 Coal Flow 333,500H % 4.50% 71.7 % 23.9 Moisture in Coal 37,085C % 63.75% 121.8 % 10.7
H2O % 11.12% 175.5 % 9.2N % 1.25% Total % 100.0O % 6.88%
Total % 100.00% < 75 micron % 70< 150 micron % 99
Volatile Matter (daf) % 44.35%Density lb/ft3 80.0
HHV, as received Btu/lb 11,666 Heat Input 3890.61 MM Btu/hr
TCA lb/hr 3,428,000 Divwall Temp (F) Temp (K)Excess O2 % 11.0 Inlet 712 651Drum Pressure psia 2700 Outlet 848 726OFA % 30.0% Average 780 689
Flow Rate Temperature Density Inner Diam. Outer Diam. Area per Port No. of Ports Axial Velocity Tan./Axial Rad./Axial Coal Flowlb/hr % F lb/ft3 in in ft2 ft/sec Velocity Velocity lb/hr
Primary 685,600 19.8 258 0.056 13.100 22.750 1.887 24 75.2 0.00 0.00 296,415Inner Sec. Air 350,217 10.1 590 0.038 23.750 33.375 2.999 24 35.4 0.00 0.21Outer Sec. Air 1,400,868 40.4 590 0.038 33.875 49.000 6.837 24 62.0 0.41 0.41
Tertiary Air 0 0.0 590 0.038 0.000 12.100 0.799 24 0.0 0.00 0.00Overfire Air - Inner 523,075 15.1 590 0.038 0.000 19.000 1.969 10 193.1 0.00 0.00Overfire Air - Outer 505,325 14.6 590 0.038 19.500 27.000 1.902 10 193.1 0.00 0.21
3,465,085 100.0
155
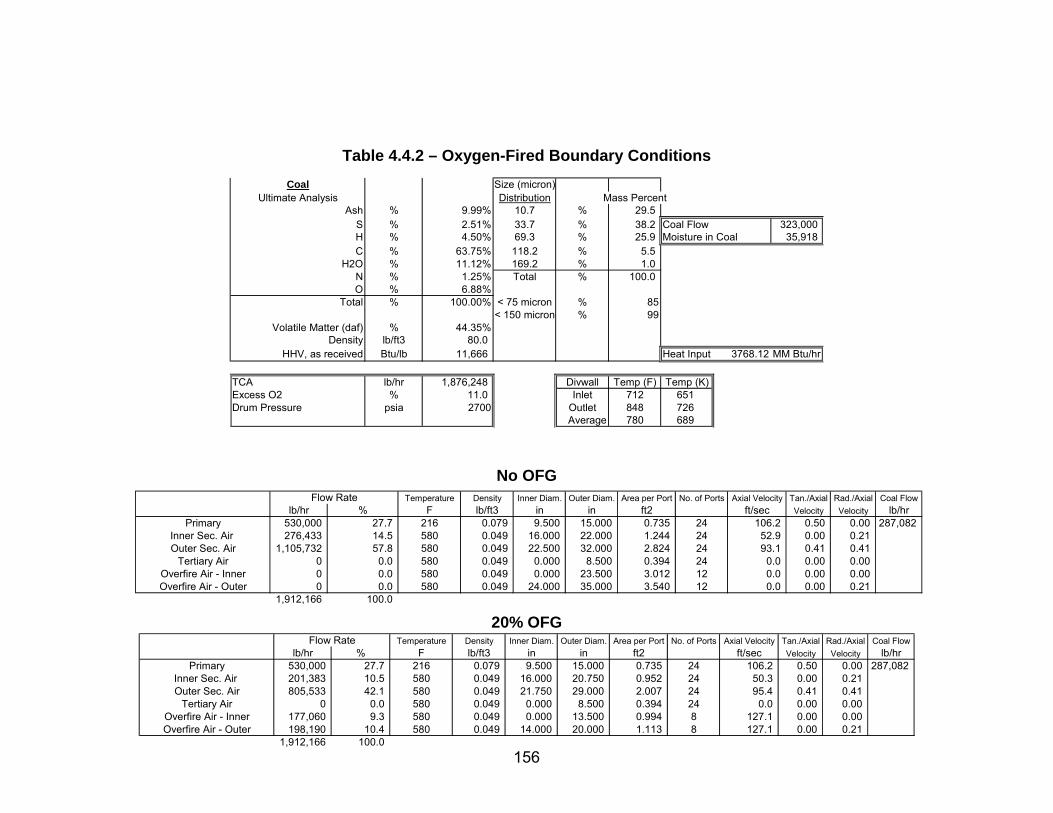
Table 4.4.2 – Oxygen-Fired Boundary Conditions
Coal Size (micron)Ultimate Analysis Distribution Mass Percent
Ash % 9.99% 10.7 % 29.5S % 2.51% 33.7 % 38.2 Coal Flow 323,000H % 4.50% 69.3 % 25.9 Moisture in Coal 35,918C % 63.75% 118.2 % 5.5
H2O % 11.12% 169.2 % 1.0N % 1.25% Total % 100.0O % 6.88%
Total % 100.00% < 75 micron % 85< 150 micron % 99
Volatile Matter (daf) % 44.35%Density lb/ft3 80.0
HHV, as received Btu/lb 11,666 Heat Input 3768.12 MM Btu/hr
TCA lb/hr 1,876,248 Divwall Temp (F) Temp (K)Excess O2 % 11.0 Inlet 712 651Drum Pressure psia 2700 Outlet 848 726
Average 780 689
No OFG Flow Rate Temperature Density Inner Diam. Outer Diam. Area per Port No. of Ports Axial Velocity Tan./Axial Rad./Axial Coal Flow
lb/hr % F lb/ft3 in in ft2 ft/sec Velocity Velocity lb/hrPrimary 530,000 27.7 216 0.079 9.500 15.000 0.735 24 106.2 0.50 0.00 287,082
Inner Sec. Air 276,433 14.5 580 0.049 16.000 22.000 1.244 24 52.9 0.00 0.21Outer Sec. Air 1,105,732 57.8 580 0.049 22.500 32.000 2.824 24 93.1 0.41 0.41
Tertiary Air 0 0.0 580 0.049 0.000 8.500 0.394 24 0.0 0.00 0.00Overfire Air - Inner 0 0.0 580 0.049 0.000 23.500 3.012 12 0.0 0.00 0.00Overfire Air - Outer 0 0.0 580 0.049 24.000 35.000 3.540 12 0.0 0.00 0.21
1,912,166 100.0
20% OFG Flow Rate Temperature Density
156
Inner Diam. Outer Diam. Area per Port No. of Ports Axial Velocity Tan./Axial Rad./Axial Coal Flowlb/hr % F lb/ft3 in in ft2 ft/sec Velocity Velocity lb/hr
Primary 530,000 27.7 216 0.079 9.500 15.000 0.735 24 106.2 0.50 0.00 287,082Inner Sec. Air 201,383 10.5 580 0.049 16.000 20.750 0.952 24 50.3 0.00 0.21Outer Sec. Air 805,533 42.1 580 0.049 21.750 29.000 2.007 24 95.4 0.41 0.41
Tertiary Air 0 0.0 580 0.049 0.000 8.500 0.394 24 0.0 0.00 0.00Overfire Air - Inner 177,060 9.3 580 0.049 0.000 13.500 0.994 8 127.1 0.00 0.00Overfire Air - Outer 198,190 10.4 580 0.049 14.000 20.000 1.113 8 127.1 0.00 0.21
1,912,166 100.0
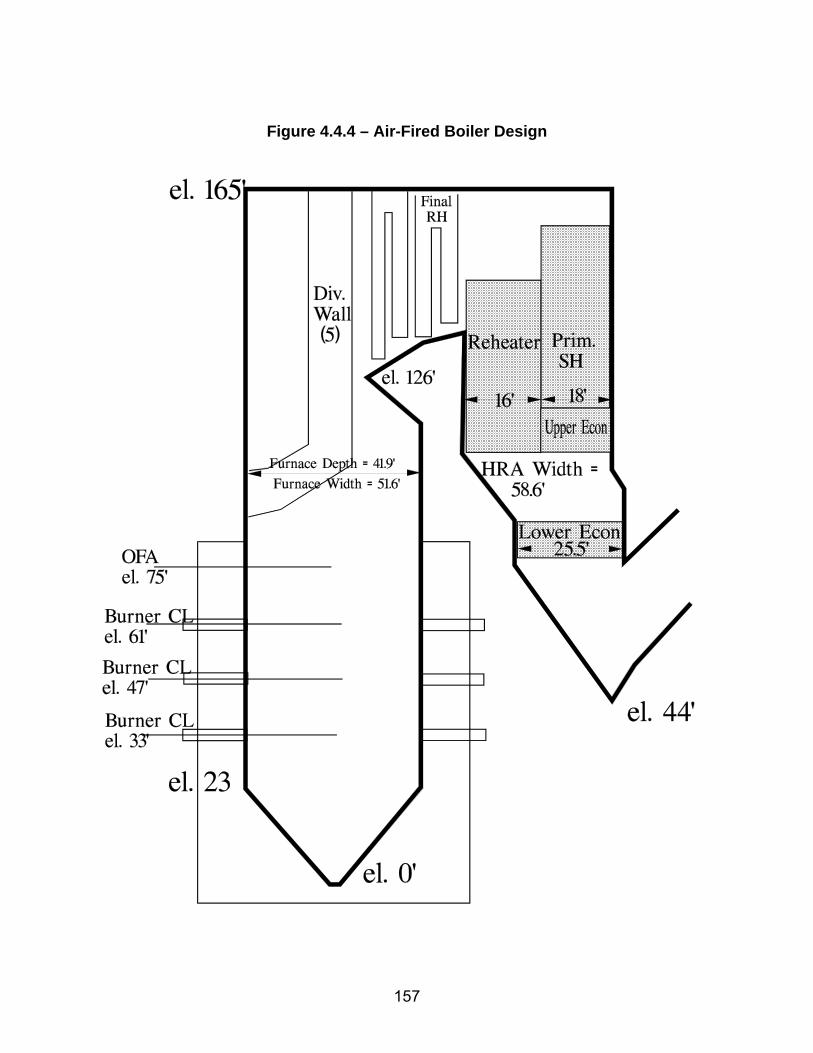
Figure 4.4.4 – Air-Fired Boiler Design
157

Table 4.4.3 – Summary of FW-FIRE Furnace Modeling Results Air-Fired FW-FIRE ASPEN
Burnout % 99.66 99.0LOI % 2.61 7.32
Total Furnace Absorption M Btu/hr 1840 1838Division Wall Absorption 0.0 494 451
FEGT F 2101 2135NOx ppmvw 227
lb/MMBtu 0.34
Oxygen-Fired (No OFG) FW-FIRE ASPEN
Burnout % 100.0 99.5LOI % 0.00 3.80
Total Furnace Absorption M Btu/hr 2287 2264Division Wall Absorption M Btu/hr 499 573
FEGT F 2190 2350NOx ppmvw 333
lb/MMBtu 0.23
Oxygen-Fired (20% OFG)
FW-FIRE ASPENBurnout % 100.0 99.5
LOI % 0.00 3.80Total Furnace Absorption M Btu/hr 2186 2264Division Wall Absorption M Btu/hr 550 573
FEGT F 2262 2350NOx ppmvw 257
lb/MMBtu 0.18
158
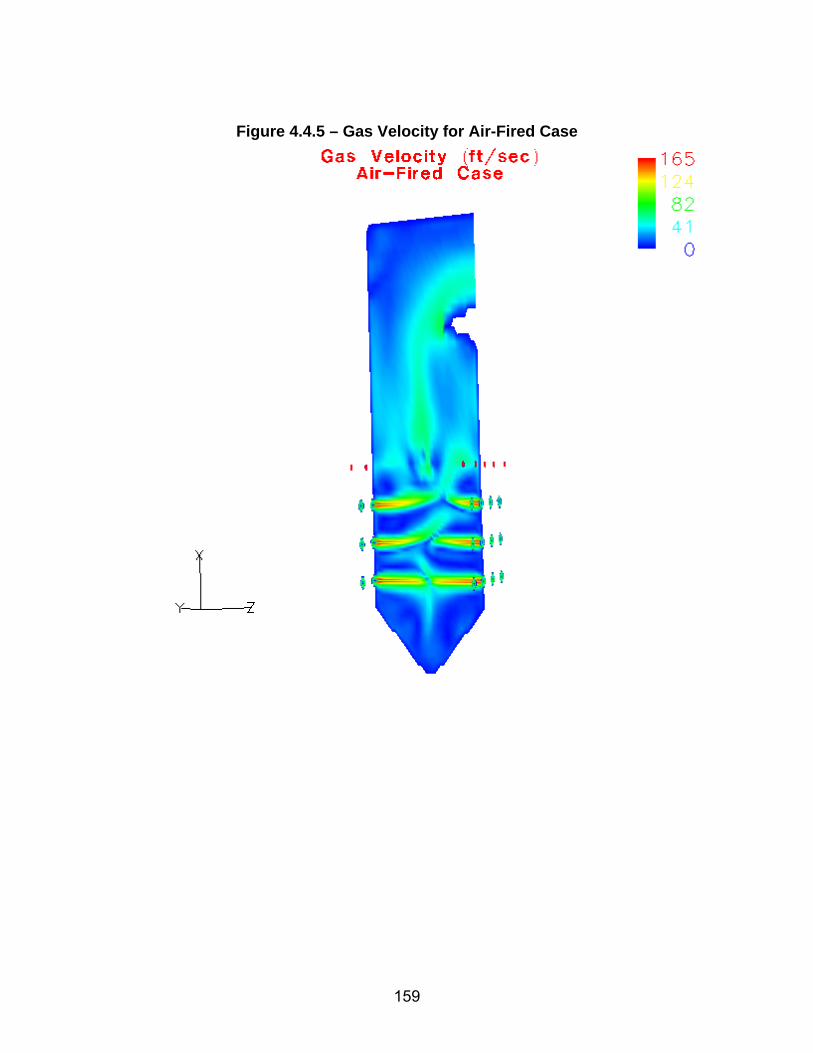
Figure 4.4.5 – Gas Velocity for Air-Fired Case
159
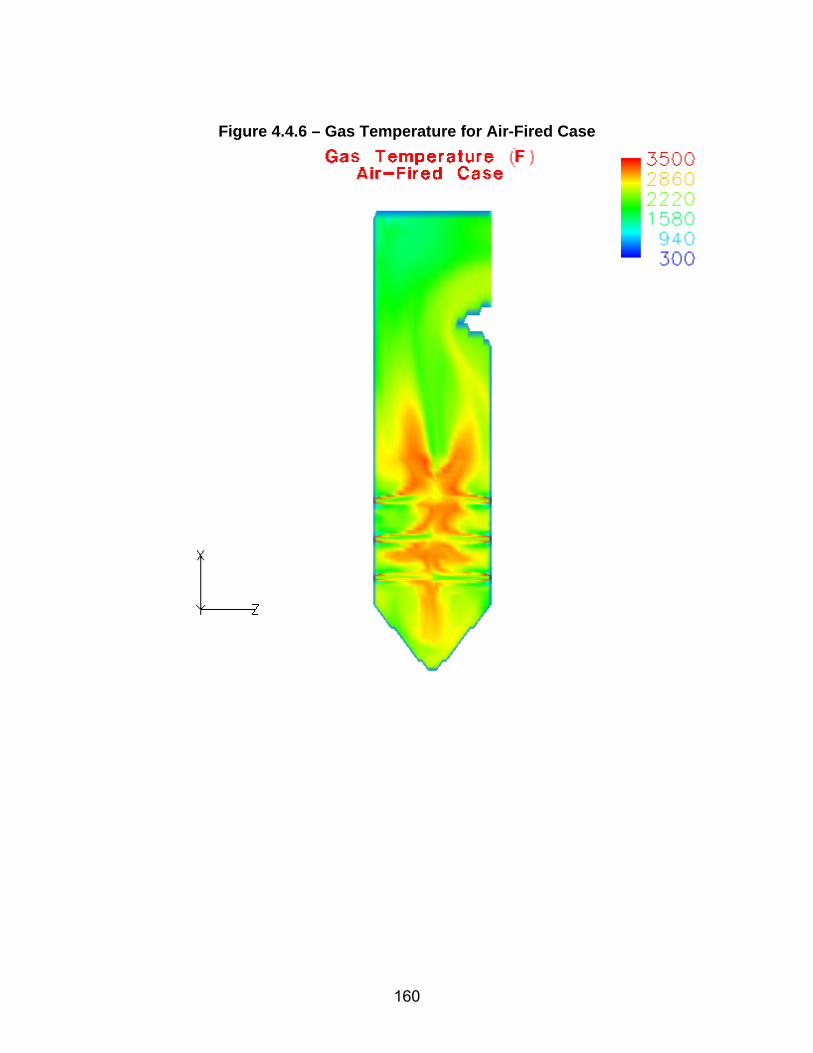
Figure 4.4.6 – Gas Temperature for Air-Fired Case
160
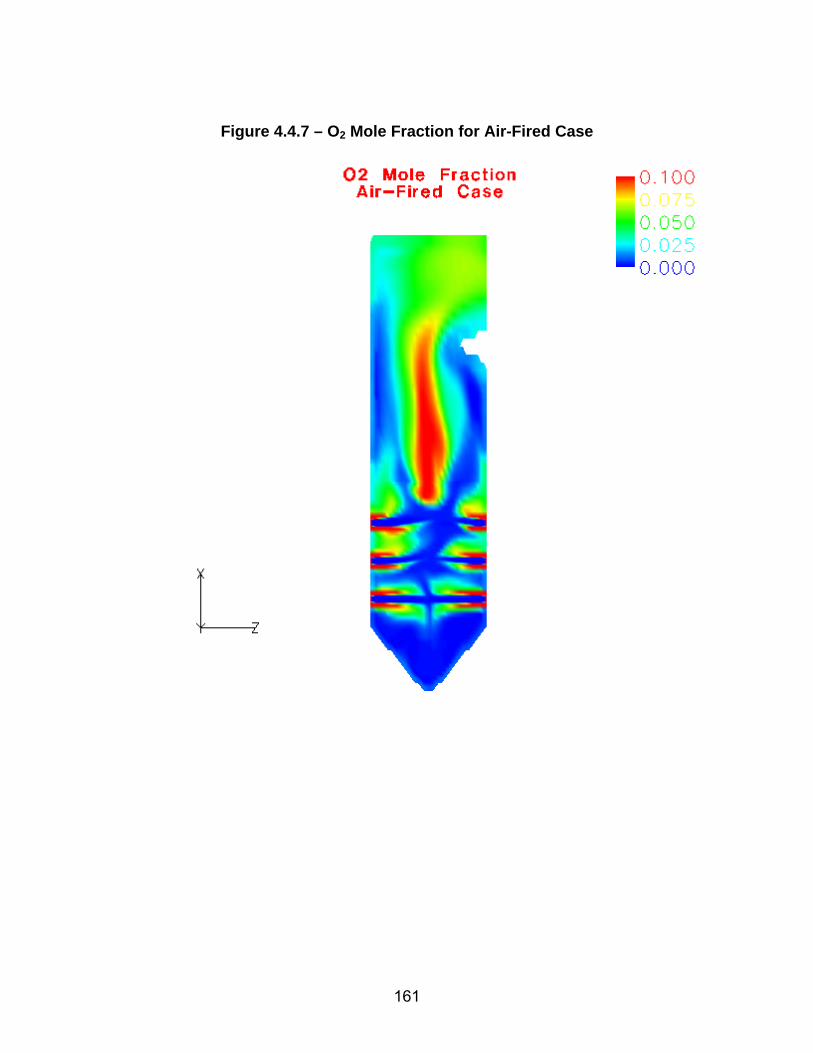
Figure 4.4.7 – O2 Mole Fraction for Air-Fired Case
161
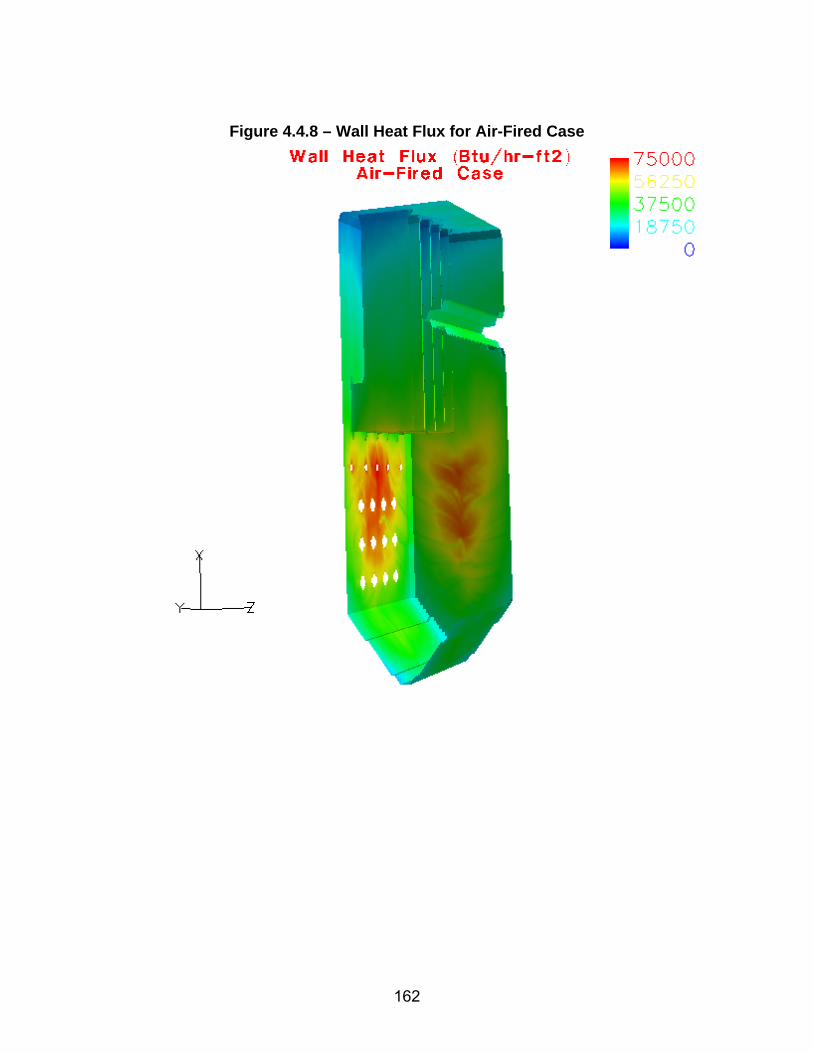
Figure 4.4.8 – Wall Heat Flux for Air-Fired Case
162

Figure 4.4.9 – Wall Temperature for Air-Fired Case
163

Figure 4.4.10 – Wall CO for Air-Fired Case
164
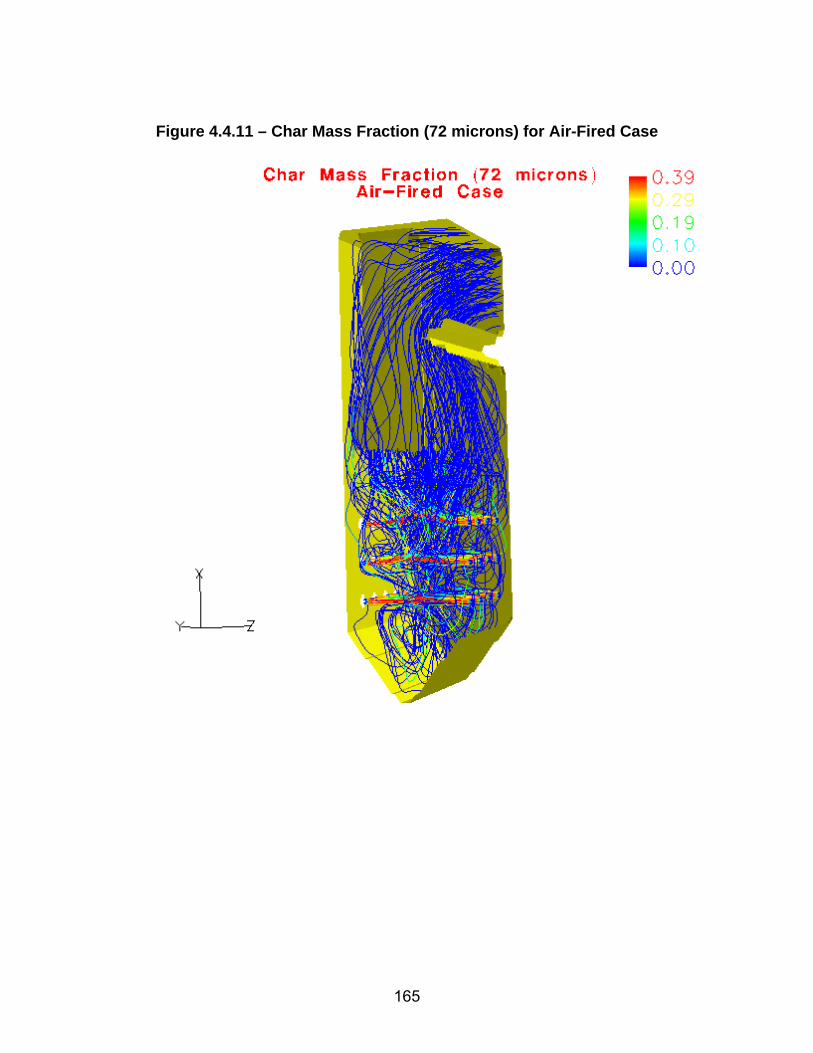
Figure 4.4.11 – Char Mass Fraction (72 microns) for Air-Fired Case
165

Figure 4.4.12 – Char Mass Fraction (176 microns) for Air-Fired Case
166
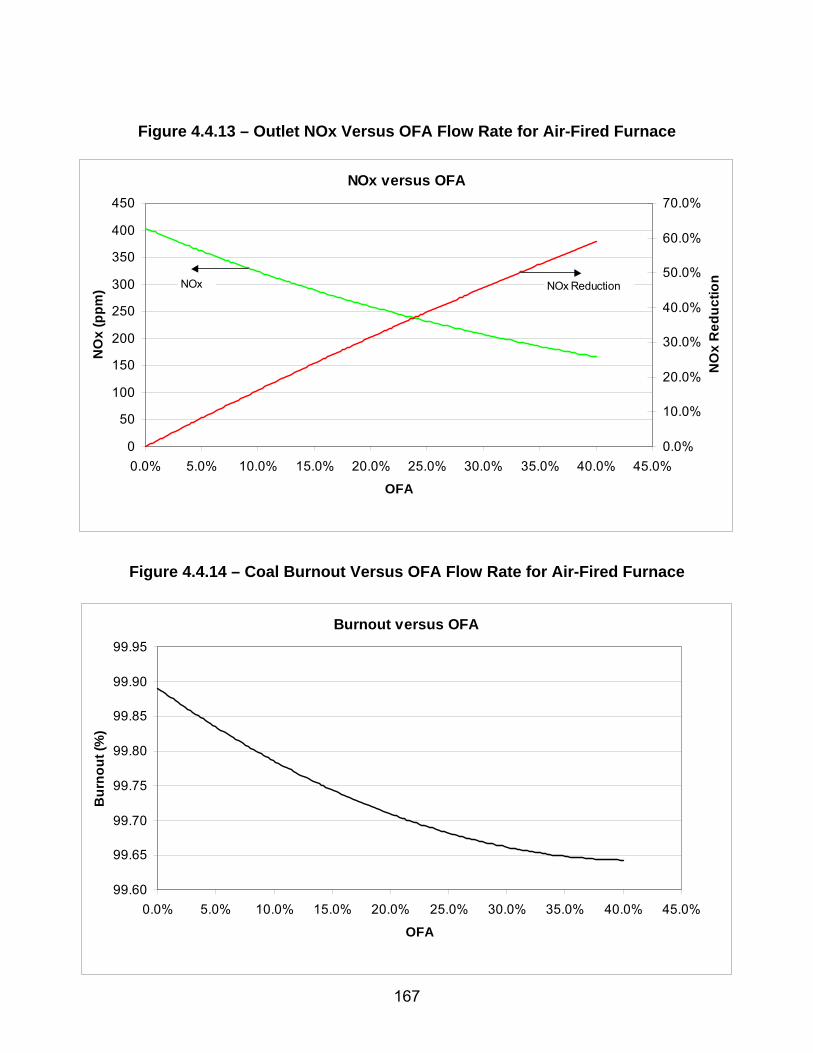
Figure 4.4.13 – Outlet NOx Versus OFA Flow Rate for Air-Fired Furnace
NOx versus OFA
0
50
100
150
200
250
300
350
400
450
0.0% 5.0% 10.0% 15.0% 20.0% 25.0% 30.0% 35.0% 40.0% 45.0%
OFA
NO
x (p
pm)
0.0%
10.0%
20.0%
30.0%
40.0%
50.0%
60.0%
70.0%
NO
x R
educ
tionNOx NOx Reduction
Figure 4.4.14 – Coal Burnout Versus OFA Flow Rate for Air-Fired Furnace
Burnout versus OFA
99.60
99.65
99.70
99.75
99.80
99.85
99.90
99.95
0.0% 5.0% 10.0% 15.0% 20.0% 25.0% 30.0% 35.0% 40.0% 45.0%
OFA
Bur
nout
(%)
167
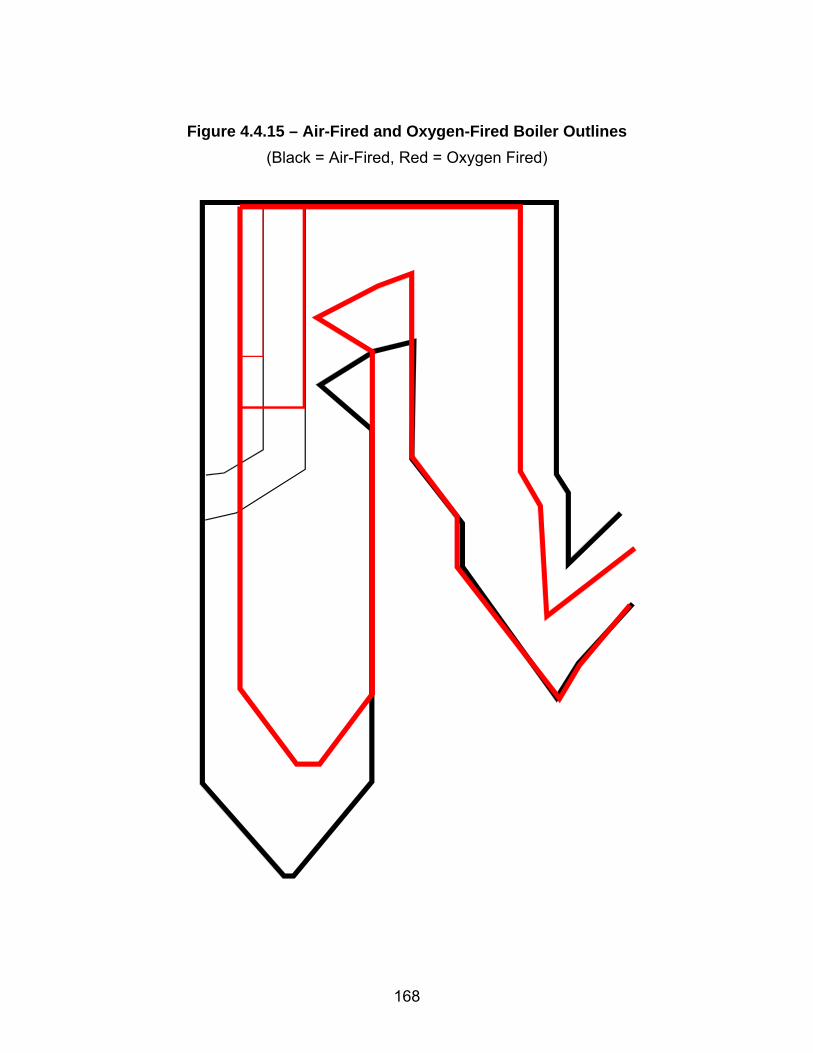
Figure 4.4.15 – Air-Fired and Oxygen-Fired Boiler Outlines
(Black = Air-Fired, Red = Oxygen Fired)
168

Figure 4.4.16 – Oxygen-Fired Boiler Design
169
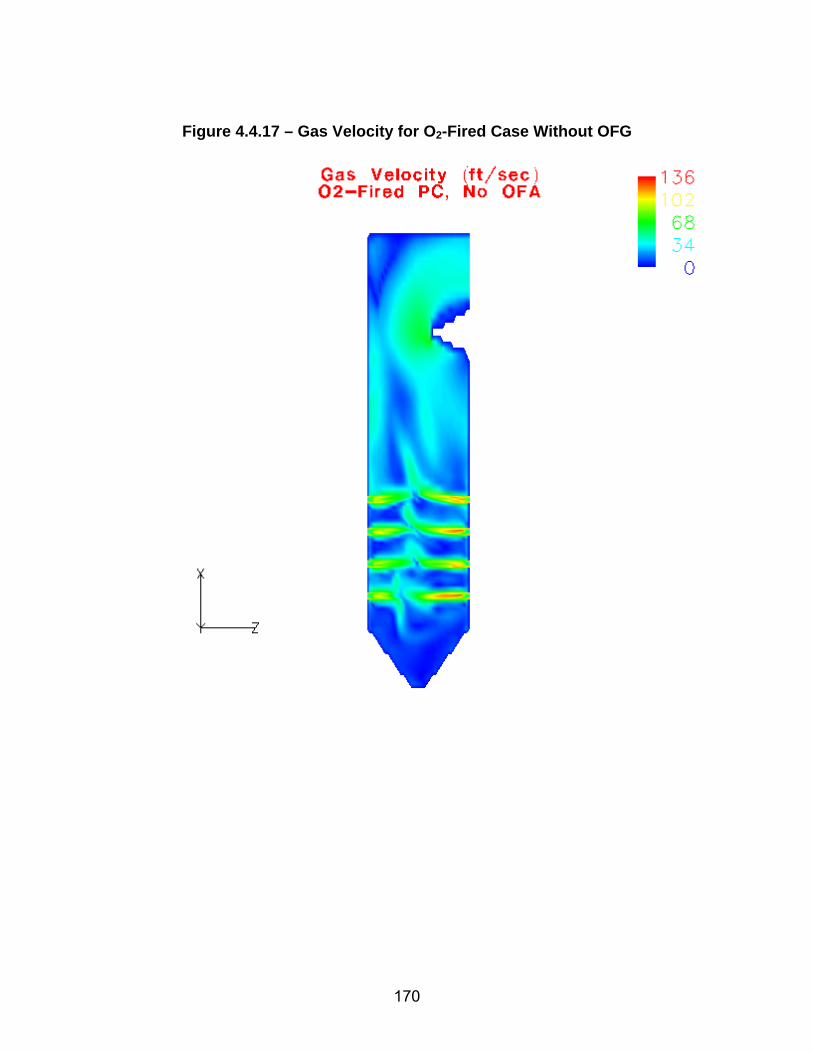
Figure 4.4.17 – Gas Velocity for O2-Fired Case Without OFG
170
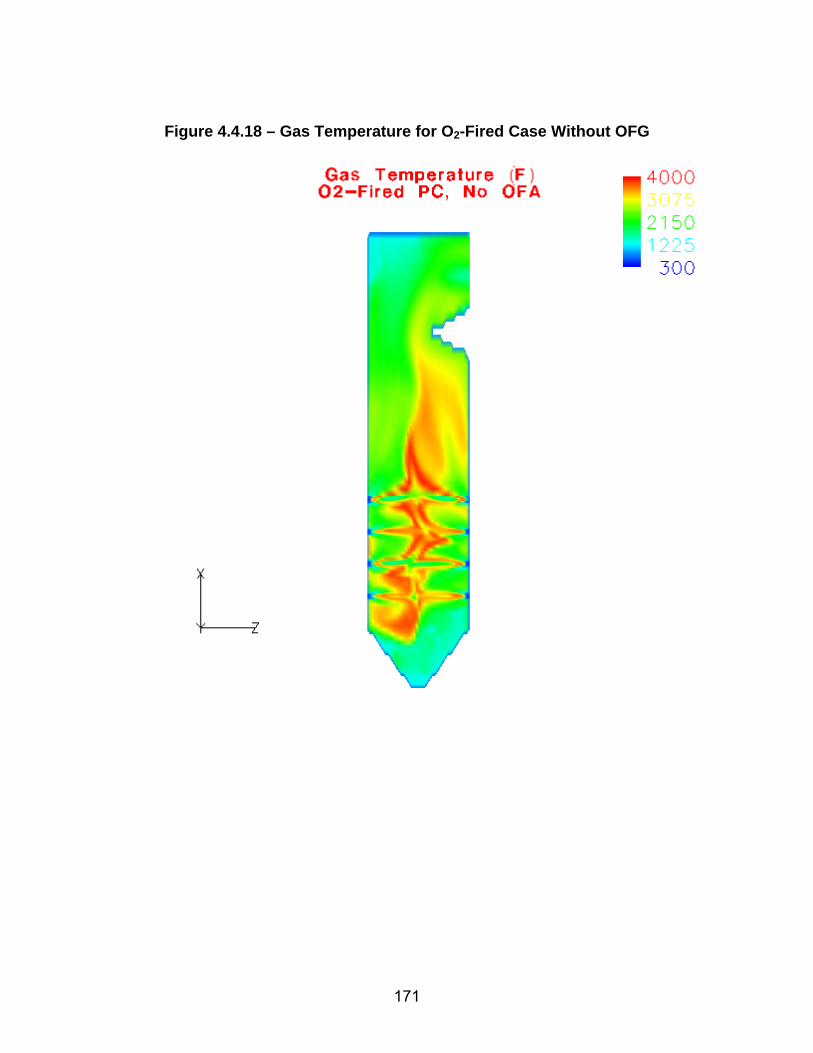
Figure 4.4.18 – Gas Temperature for O2-Fired Case Without OFG
171
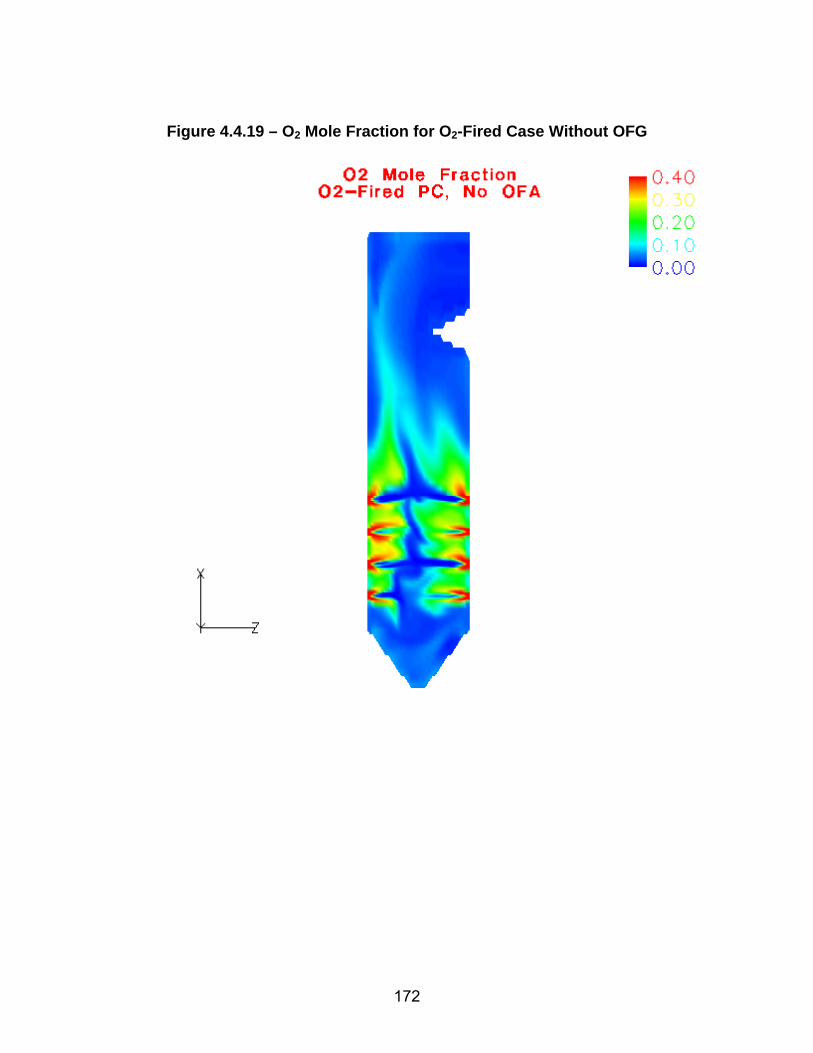
Figure 4.4.19 – O2 Mole Fraction for O2-Fired Case Without OFG
172
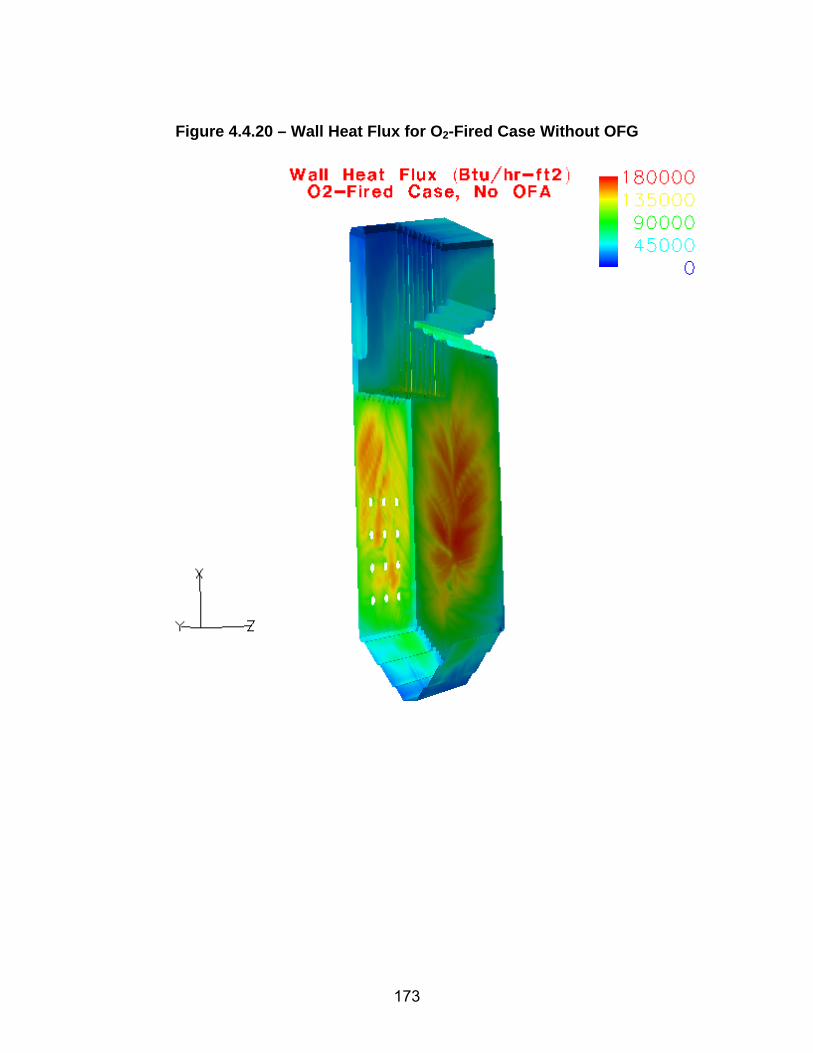
Figure 4.4.20 – Wall Heat Flux for O2-Fired Case Without OFG
173

Figure 4.4.21 – Wall Temperature for O2-Fired Case Without OFG
174

Figure 4.4.22 – Wall CO for O2-Fired Case Without OFG
175
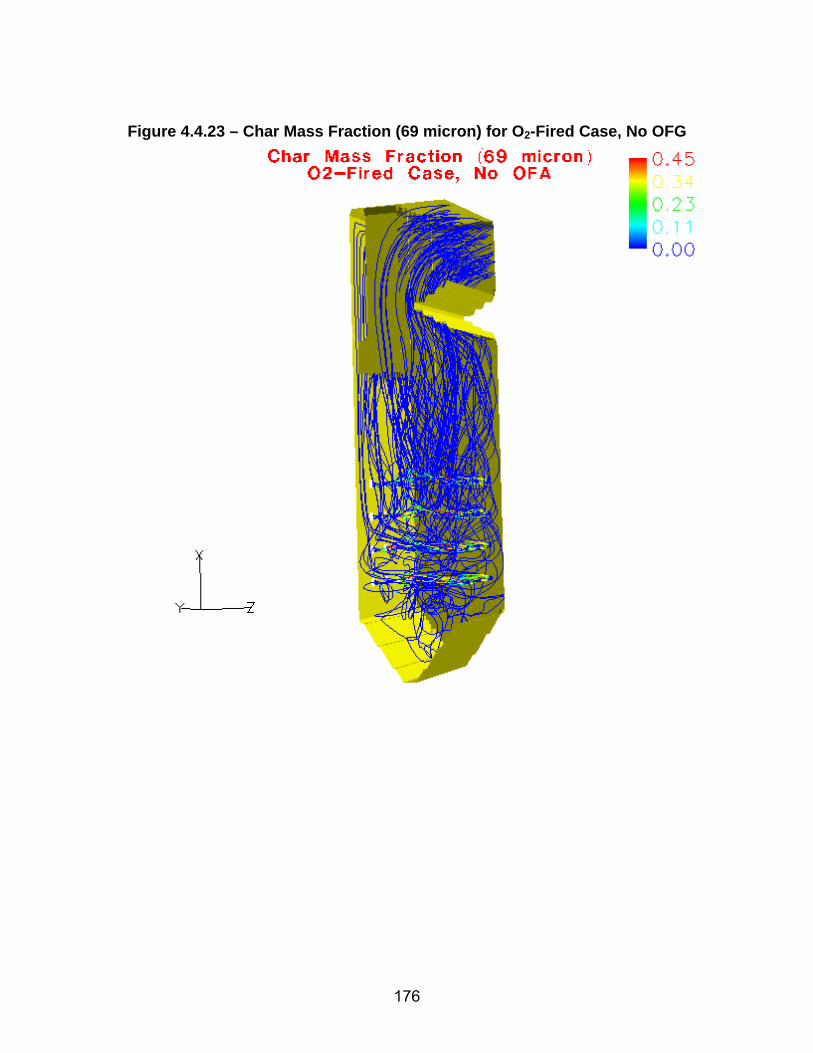
Figure 4.4.23 – Char Mass Fraction (69 micron) for O2-Fired Case, No OFG
176

Figure 4.4.24 – Char Mass Fraction (169 micron) for O2-Fired Case, No OFG
177

Figure 4.4.25 – Char Mass Fraction (169 micron) for O2-Fired Case, No OFG,
Without Primary gas Swirl
178
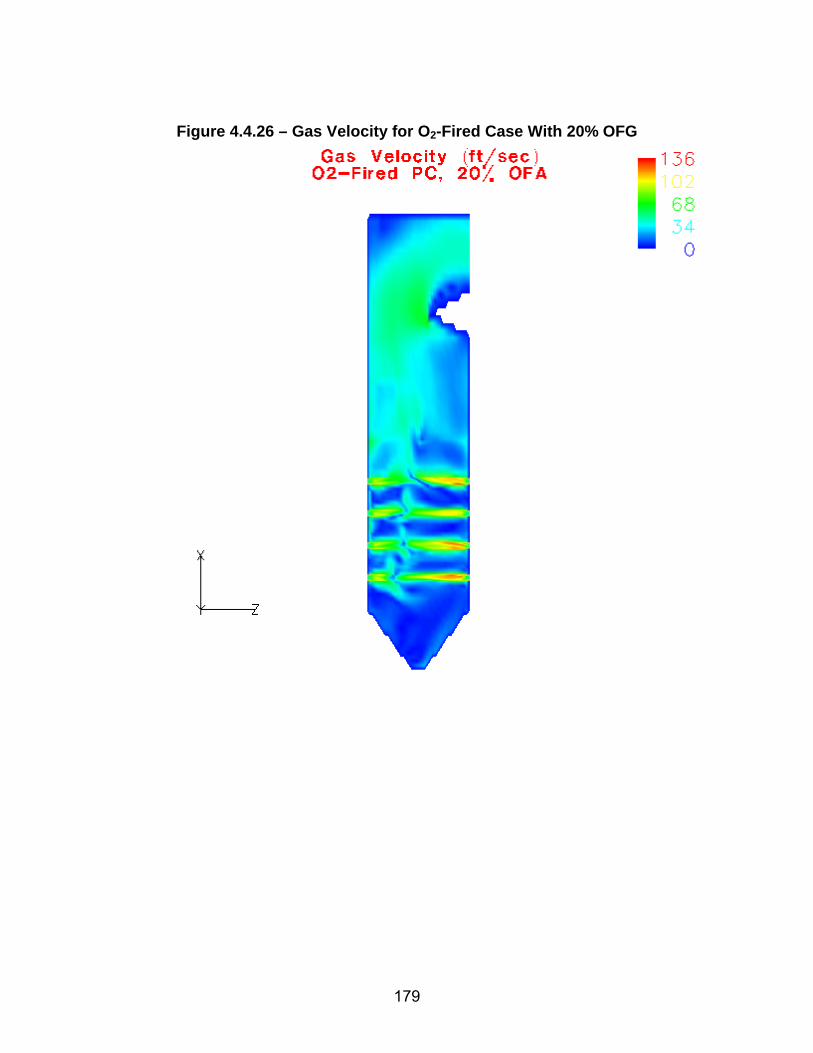
Figure 4.4.26 – Gas Velocity for O2-Fired Case With 20% OFG
179

Figure 4.4.27 – Gas Temperature for O2-Fired Case With 20% OFG
180
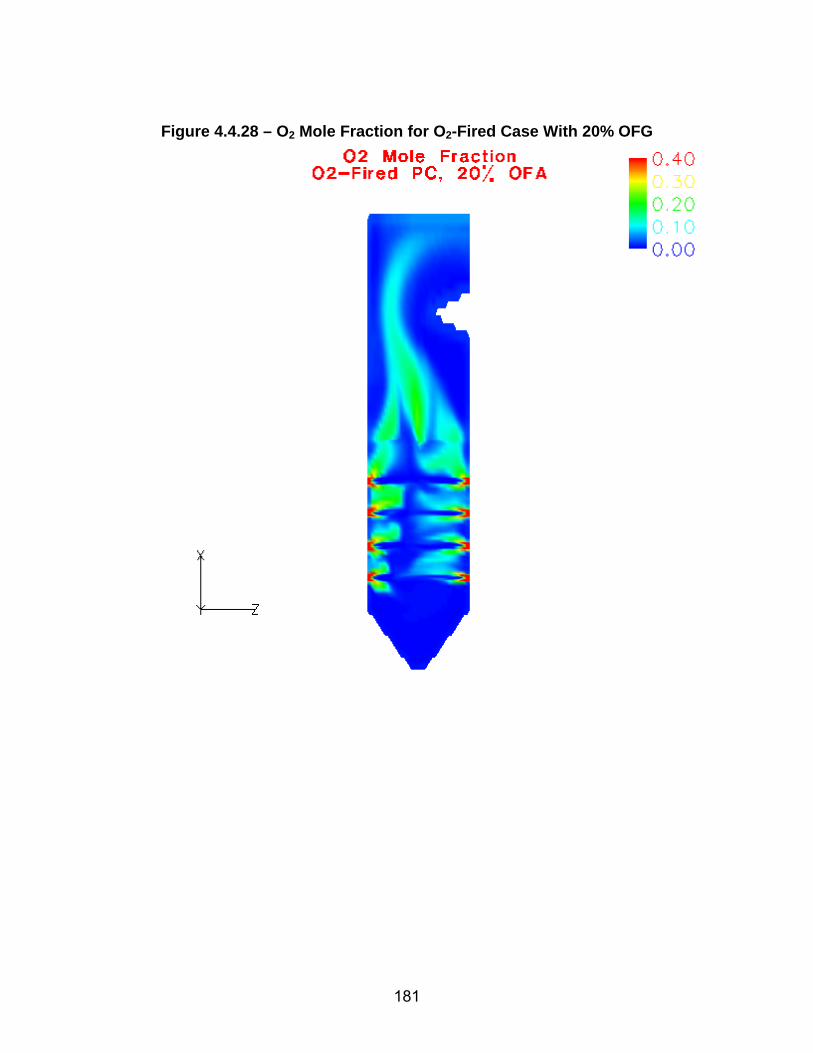
Figure 4.4.28 – O2 Mole Fraction for O2-Fired Case With 20% OFG
181
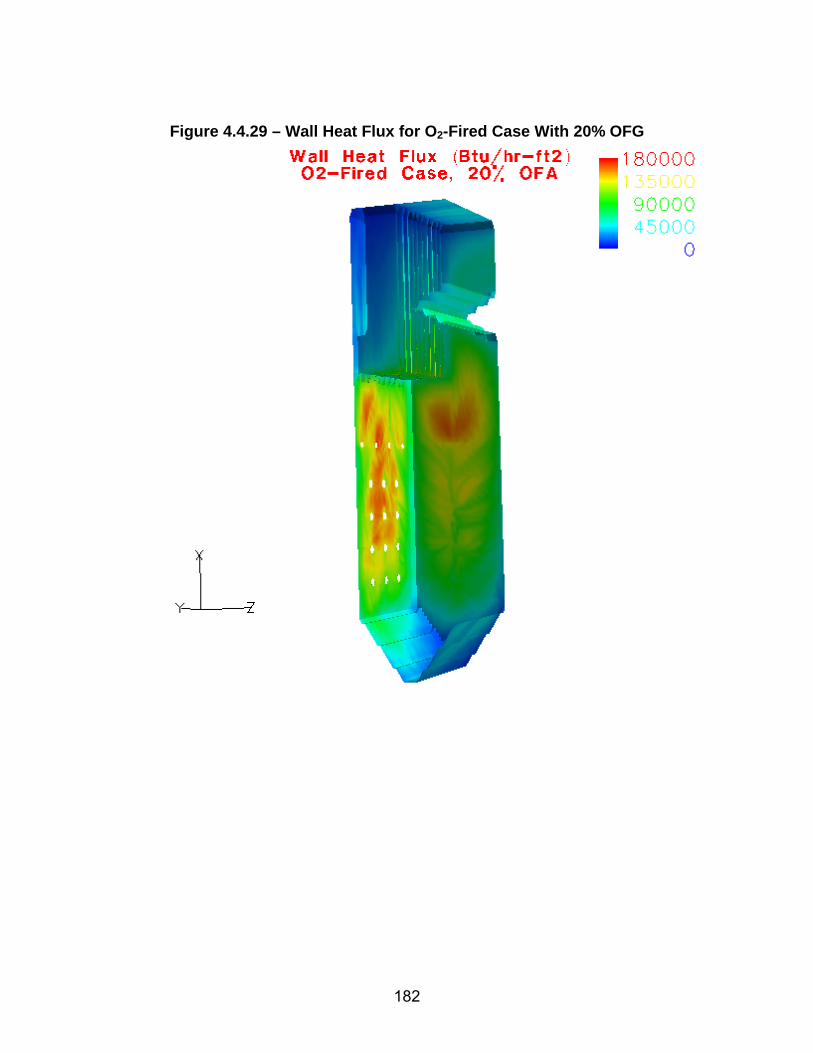
Figure 4.4.29 – Wall Heat Flux for O2-Fired Case With 20% OFG
182

Figure 4.4.30 – Wall Temperature for O2-Fired Case With 20% OFG
183
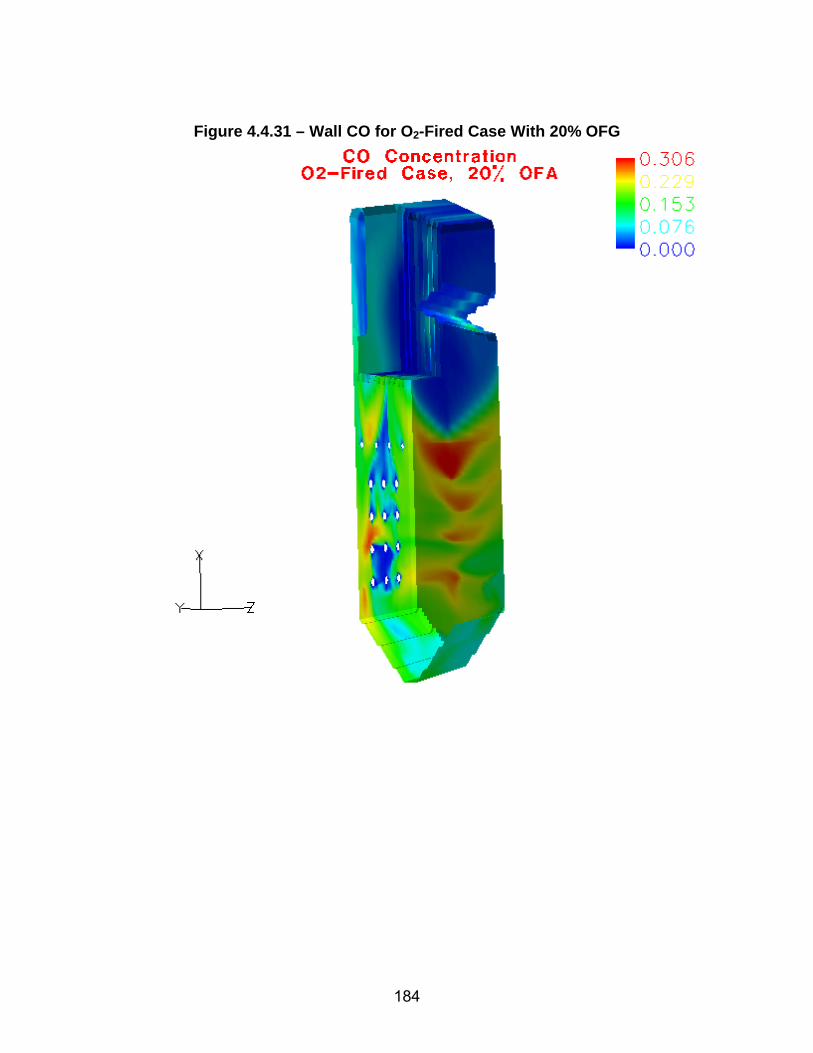
Figure 4.4.31 – Wall CO for O2-Fired Case With 20% OFG
184

Figure 4.4.32 – Char Mass Fraction (69 micron) for O2-Fired Case, 20% OFG
185
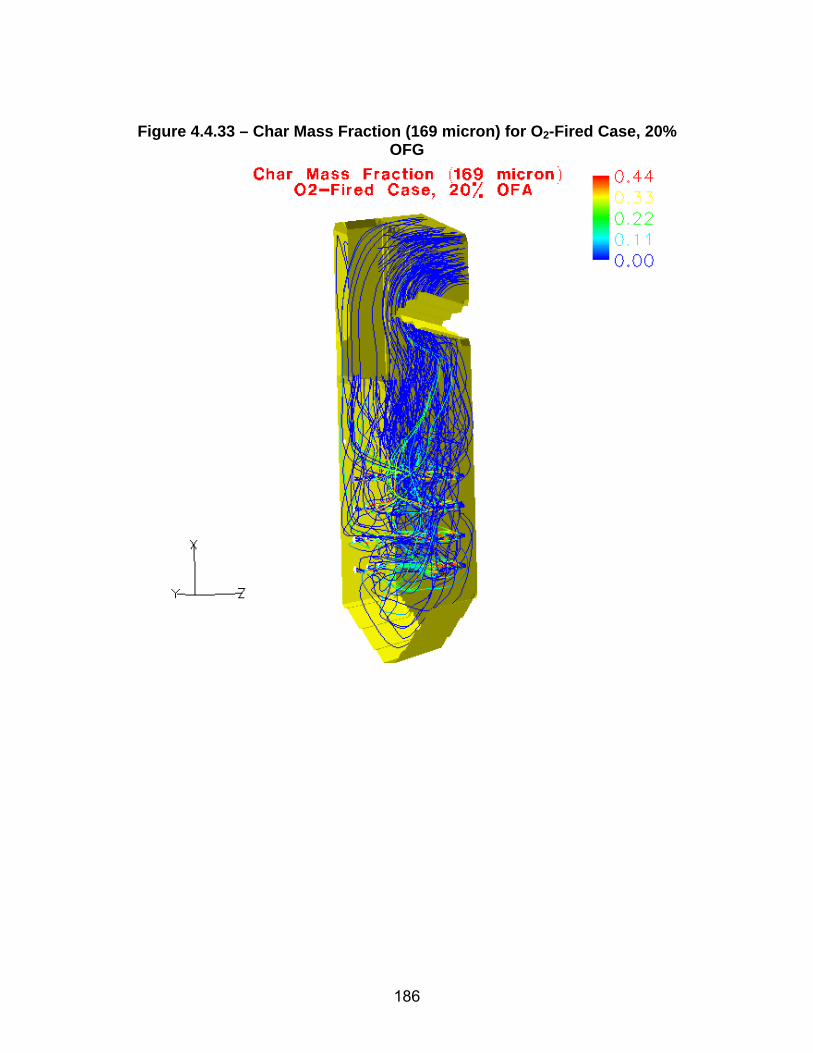
Figure 4.4.33 – Char Mass Fraction (169 micron) for O2-Fired Case, 20%
OFG
186

Figure 4.4.34 – Char Mass Fraction (169 micron) for O2-Fired Case, 20%
OFG, Without Primary gas Swirl
187
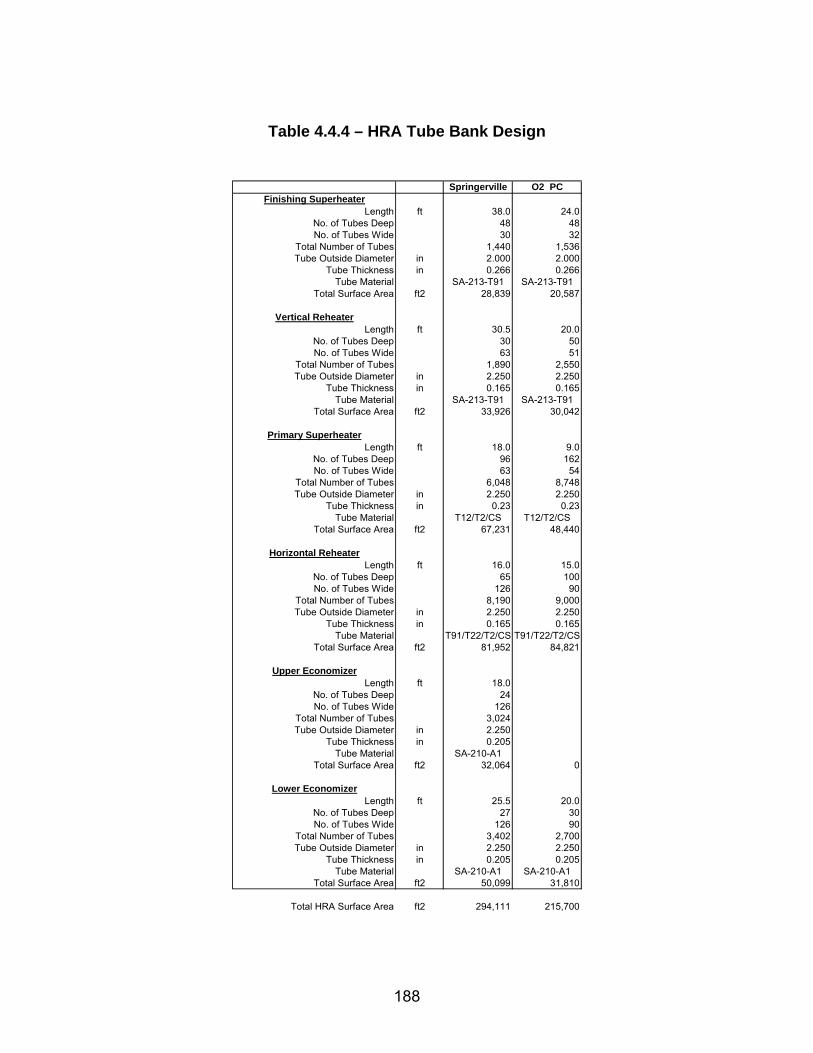
Table 4.4.4 – HRA Tube Bank Design
Springerville O2 PCFinishing Superheater
Length ft 38.0 24.0No. of Tubes Deep 48 48No. of Tubes Wide 30 32
Total Number of Tubes 1,440 1,536Tube Outside Diameter in 2.000 2.000
Tube Thickness in 0.266 0.266Tube Material SA-213-T91 SA-213-T91
Total Surface Area ft2 28,839 20,587
Vertical ReheaterLength ft 30.5 20.0
No. of Tubes Deep 30 50No. of Tubes Wide 63 51
Total Number of Tubes 1,890 2,550Tube Outside Diameter in 2.250 2.250
Tube Thickness in 0.165 0.165Tube Material SA-213-T91 SA-213-T91
Total Surface Area ft2 33,926 30,042
Primary SuperheaterLength ft 18.0 9.0
No. of Tubes Deep 96 162No. of Tubes Wide 63 54
Total Number of Tubes 6,048 8,748Tube Outside Diameter in 2.250 2.250
Tube Thickness in 0.23 0.23Tube Material T12/T2/CS T12/T2/CS
Total Surface Area ft2 67,231 48,440
Horizontal ReheaterLength ft 16.0 15.0
No. of Tubes Deep 65 100No. of Tubes Wide 126 90
Total Number of Tubes 8,190 9,000Tube Outside Diameter in 2.250 2.250
Tube Thickness in 0.165 0.165Tube Material T91/T22/T2/CS T91/T22/T2/CS
Total Surface Area ft2 81,952 84,821
Upper EconomizerLength ft 18.0
No. of Tubes Deep 24No. of Tubes Wide 126
Total Number of Tubes 3,024Tube Outside Diameter in 2.250
Tube Thickness in 0.205Tube Material SA-210-A1
Total Surface Area ft2 32,064 0
Lower EconomizerLength ft 25.5 20.0
No. of Tubes Deep 27 30No. of Tubes Wide 126 90
Total Number of Tubes 3,402 2,700Tube Outside Diameter in 2.250 2.250
Tube Thickness in 0.205 0.205Tube Material SA-210-A1 SA-210-A1
Total Surface Area ft2 50,099 31,810
Total HRA Surface Area ft2 294,111 215,700
188
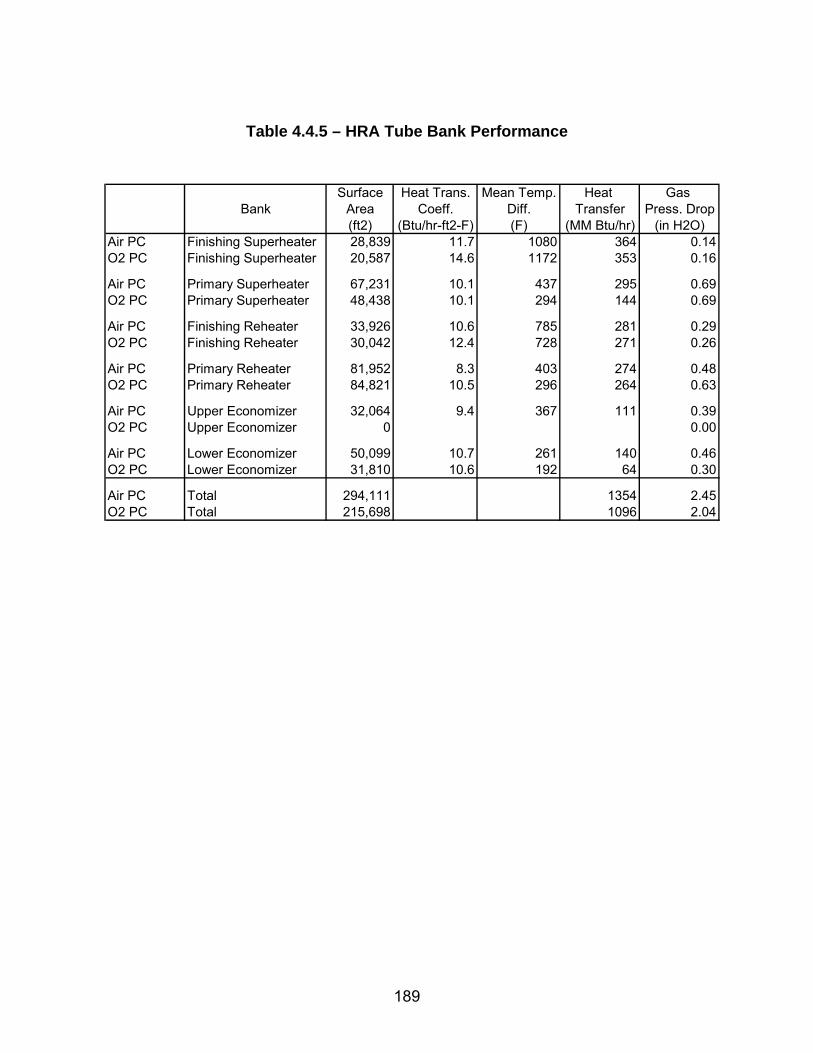
Table 4.4.5 – HRA Tube Bank Performance
Surface Heat Trans. Mean Temp. Heat Gas Bank Area Coeff. Diff. Transfer Press. Drop
(ft2) (Btu/hr-ft2-F) (F) (MM Btu/hr) (in H2O)Air PC Finishing Superheater 28,839 11.7 1080 364 0.14O2 PC Finishing Superheater 20,587 14.6 1172 353 0.16
Air PC Primary Superheater 67,231 10.1 437 295 0.69O2 PC Primary Superheater 48,438 10.1 294 144 0.69
Air PC Finishing Reheater 33,926 10.6 785 281 0.29O2 PC Finishing Reheater 30,042 12.4 728 271 0.26
Air PC Primary Reheater 81,952 8.3 403 274 0.48O2 PC Primary Reheater 84,821 10.5 296 264 0.63
Air PC Upper Economizer 32,064 9.4 367 111 0.39O2 PC Upper Economizer 0 0.00
Air PC Lower Economizer 50,099 10.7 261 140 0.46O2 PC Lower Economizer 31,810 10.6 192 64 0.30
Air PC Total 294,111 1354 2.45O2 PC Total 215,698 1096 2.04
189

4.5 Economic Analysis
4.5.1 Main Assumptions
The economic analysis was carried out based on the EPRI Technical Assessment Guide (TAG) methodology. Plant capital costs were compiled under the Code of Accounts developed by EPRI and used in references [12] and [24]. The estimate basis and major assumptions are listed below:
• Total plant costs are estimated in January 2004 dollars.
• Plant book life is 20 years.
• The net power output for the reference PC plant (without CO2 sequestration) is 450 MWe and for the O2 PC plant (with sequestration) is 327 MWe.
• Capacity factor is 85%. The plant will operate at 100% load at 85% of the
time.
• Cost of electricity (COE) was determined on a levelized constant dollar basis.
• Average annual ambient air conditions for material balances, thermal
efficiencies and other performance related parameters are at a dry bulb temperature of 60 deg. F and an air pressure of 14.7 psia.
• The coal is Illinois #6 coal (see Table 4.2.1 for analysis).
• Terms used are consistent with the EPRI TAG.
4.5.2 Plant Cost Basis The total plant cost (TPC), also referred to as the plant capital cost is comprised of the following elements:
1. Bare erected plant cost. 2. Overheads and fee for engineering and home office. 3. Project and process contingencies.
The O2-fired PC plant capital costs were derived in comparison to a recently constructed Foster Wheeler reference plant, which is an existing subcritical pressure, natural circulation PC plant.
190
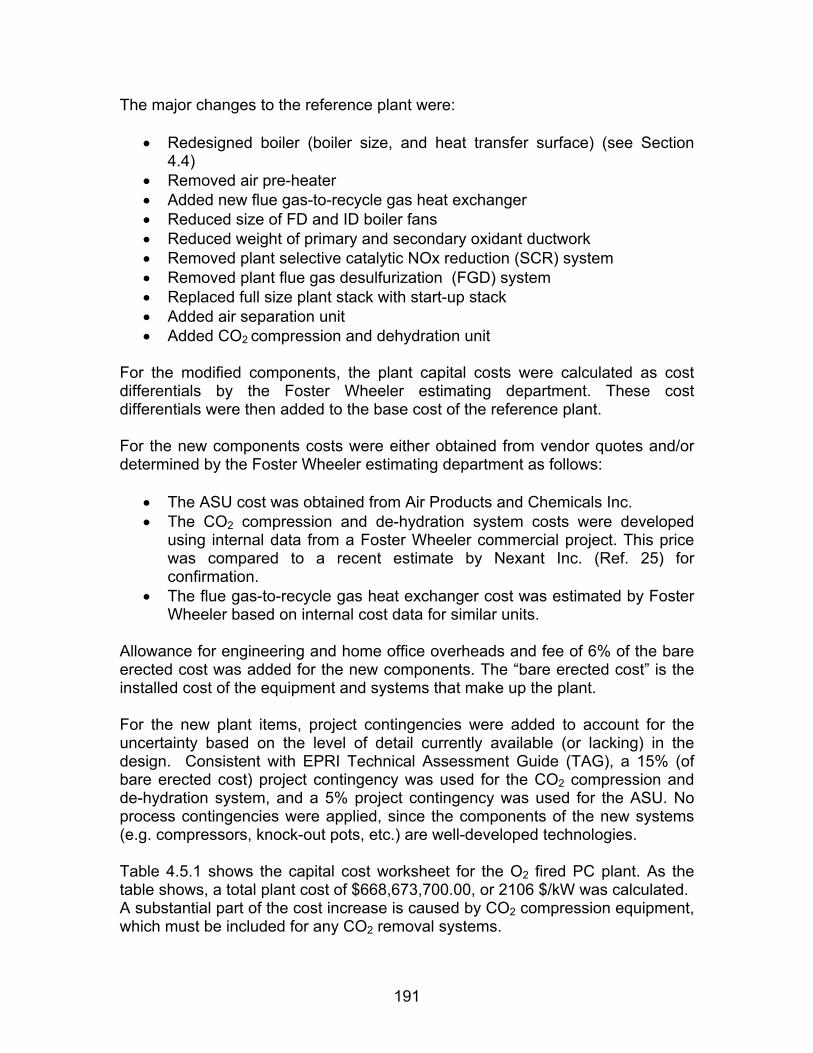
The major changes to the reference plant were:
• Redesigned boiler (boiler size, and heat transfer surface) (see Section 4.4)
• Removed air pre-heater • Added new flue gas-to-recycle gas heat exchanger • Reduced size of FD and ID boiler fans • Reduced weight of primary and secondary oxidant ductwork • Removed plant selective catalytic NOx reduction (SCR) system • Removed plant flue gas desulfurization (FGD) system • Replaced full size plant stack with start-up stack • Added air separation unit • Added CO2 compression and dehydration unit
For the modified components, the plant capital costs were calculated as cost differentials by the Foster Wheeler estimating department. These cost differentials were then added to the base cost of the reference plant. For the new components costs were either obtained from vendor quotes and/or determined by the Foster Wheeler estimating department as follows:
• The ASU cost was obtained from Air Products and Chemicals Inc. • The CO2 compression and de-hydration system costs were developed
using internal data from a Foster Wheeler commercial project. This price was compared to a recent estimate by Nexant Inc. (Ref. 25) for confirmation.
• The flue gas-to-recycle gas heat exchanger cost was estimated by Foster Wheeler based on internal cost data for similar units.
Allowance for engineering and home office overheads and fee of 6% of the bare erected cost was added for the new components. The “bare erected cost” is the installed cost of the equipment and systems that make up the plant. For the new plant items, project contingencies were added to account for the uncertainty based on the level of detail currently available (or lacking) in the design. Consistent with EPRI Technical Assessment Guide (TAG), a 15% (of bare erected cost) project contingency was used for the CO2 compression and de-hydration system, and a 5% project contingency was used for the ASU. No process contingencies were applied, since the components of the new systems (e.g. compressors, knock-out pots, etc.) are well-developed technologies. Table 4.5.1 shows the capital cost worksheet for the O2 fired PC plant. As the table shows, a total plant cost of $668,673,700.00, or 2106 $/kW was calculated. A substantial part of the cost increase is caused by CO2 compression equipment, which must be included for any CO2 removal systems.
191

Table 4.5.1 – Oxygen-Fired PC Plant Capital Cost Estimate
Base Plant: Air-Fired subcritical pressure, natural circulation PCBase Plant Output: 450 MWe, netBase Plant "As bid" cost: 585,000,000.00$ Includes contingencies and EPC costs
Cost differences in converting air-fired PC to the oxygen-fired PC configuration:
Item Bare erected cost Process Project600,000.00$ Incl. As bid -$ -$ 600,000.00$
(306,000.00)$ Incl. As bid -$ -$ (306,000.00)$ (600,000.00)$ Incl. As bid -$ -$ (600,000.00)$
(4,600,000.00)$ Incl. As bid -$ -$ (4,600,000.00)$ 6,000,000.00$ Incl. As bid -$ -$ 6,000,000.00$
(1,000,000.00)$ Incl. As bid -$ -$ (1,000,000.00)$ (6,400,000.00)$ Incl. As bid -$ -$ (6,400,000.00)$ (2,200,000.00)$ Incl. As bid -$ -$ (2,200,000.00)$ (2,000,000.00)$ Incl. As bid -$ -$ (2,000,000.00)$
(56,000,000.00)$ Incl. As bid -$ -$ (56,000,000.00)$ (6,000,000.00)$ Incl. As bid -$ -$ (6,000,000.00)$
ASU 116,970,000.00$ 7,018,200.00$ -$ 5,848,500.00$ 129,836,700.00$ CO2 System 38,300,000.00$ 2,298,000.00$ -$ 5,745,000.00$ 46,343,000.00$
82,764,000.00$ 9,316,200.00$ -$ 11,593,500.00$ 103,673,700.00$
O2 PC Plant Cost: 688,673,700.00$ 2,106 $/kW
O2 PC Plant net output: 327 MW
Eng'g CMHO & Fee
Total PlantCost
Air separation unit addedCO2 compression and dehydration unit added
Less oxidant and gas ductworkSCR system not required
Contingencies
Total difference:
FGD sytem not requiredFull size stack replaced by small, start-up stack
Boiler
BOP
Furnace panels change from carbon steel to alloy steelDescription of change
Less HRA surface neededSmaller economizer
Smaller FD and ID boiler fansLess boiler structural steel (smaller boiler)
Air pre-heater not requiredNew Flue-gas/recycle gas heat exchanger
192
4.5.3 Total Plant Investment (TPI) To determine the total investment required at the date of start-up, the TPC is escalated by the average interest rate over the construction period. Unlike the TPC, which assumes instantaneous construction, TPI ensures that escalation of construction costs and allowance for funds used during construction is properly taken into account. The construction period was estimated to be 4 years. Assuming uniform cash flow over the construction period, the TPI was calculated as follows: TPI = TPC [1+iavg] Where iavg = Average interest rate over construction period = (Interest rate)(Construction Period in Years)/2 = 10% The annual interest rate was taken as 5%.
4.5.4 Total Capital Requirement (TCR) The TCR includes all capital required to complete the project. TCR is the sum of TPI, pre-paid royalties, pre-production (start-up) costs, inventory capital, and land cost:
• Royalties costs are assumed inapplicable to the CO2 hybrid plant • Pre-production costs cover operator training, equipment checkout, major
changes in plant equipment, extra maintenance, and inefficient use of fuel and other materials during start-up. They are estimated as follows:
- 1 month of fixed operating costs, operating and maintenance labor, administrative and support labor, and maintenance materials.
- 1 month of variable operating costs at full capacity (excluding fuel) – includes chemicals, water, and other consumables and waste disposal charges.
- 25% of full capacity fuel cost for 1 month – covers inefficient operation that occurs during the start-up period.
- 2% of TPI – covers expected changes and modifications to equipment that will be needed to bring the plant up to full capacity.
• Inventory capital is the capital required for initial inventories of fuel and other consumables, which are capitalized and included in the inventory capital account. Fuel and other consumables inventory (except water) are based on full-capacity operation for 15 days. An allowance of ½ percent of the TPC equipment cost is included for spare parts.
193

• Initial catalyst and chemical charge covers the initial cost of any catalysts or chemicals that are contained in the process equipment, but not in storage. In this study, this small charge was included with the equipment capital costs and is a part of the TPC.
• Land cost is based on 60 acres at $10,000/acre. The TPI and the TCR cost components are shown on Table 4.5.5 and Table 4.5.6.
4.5.5 Operating Costs And Expenses Operating costs were expressed in terms of the following categories:
• Operating Labor • Maintenance Cost
- Maintenance labor - Maintenance materials
• Administrative and Support Labor • Consumables • Fuel Cost
These values were calculated in consistence with EPRI TAG methodology. All costs were based on a first year basis with January 2004 dollars. The first year costs do not include start-up expenses, which are included in the TCR. The cost categories listed above are calculated, on a dollars per year basis, as follows:
• Operating labor is calculated by multiplying the number of operating personnel with the average annual (burdened) compensation per person.
• Maintenance costs are estimated to be 2% of the TPC and are divided into
maintenance labor and maintenance materials
- Maintenance labor is estimated to be 40% of the total maintenance cost
- Maintenance materials are estimated to be 60% of the total maintenance cost
• Administrative and support labor is estimated to be equal to 25% of the
sum of operating and maintenance labor. • Consumables are feedstock and disposal costs calculated from the annual
usage at 100% load and 85% capacity factor. The costs is expressed in year 2004 dollars and levelized over 20 years on constant dollar basis.
194
• Fuel cost is calculated based on the assumed net cost for delivered coal, which is $1.14/MMBtu [26]. Fuel cost is determined on a first year basis and levelized over 20 years on a constant dollar basis. The calculation of first year fuel costs is done as follows:
Fuel (tons/day) = (Plant Heat Rate)x (net capacity in kW) x 24 hr/day
HHV x 2000 lb/ton
Fuel Unit Cost ($/ton) = HHV x 2000 lb/ton x (Fuel Cost in $/MMBtu) x 106
Fuel Cost (1st year) = Fuel (tons/day) x Fuel Unit Cost ($/ton) x 365 day/yr x 0.85 (CF) The operating and maintenance costs, excluding fuel and consumables, are combined and divided into two components: 1) Fixed O&M, which is independent of power generation, and 2) Variable O&M, which is proportional to power generation. These are calculated as follows:
Fixed O&M ($/yr) = Oper. Labor + Maint. Labor + Adm. and Support Labor
Fixed O&M ($/kW-yr) = Fixed O&M($/year) Net Power (kW) Variable O&M ($/yr) = Maintenance Materials Variable O&M (¢/kWh) = Variable O&M ($/yr)_______ Net Power (kW) x CF x 8760 Where, CF is the plant capacity factor and 8760 is the total number of hours in one year. The operating and maintenance costs for the O2-fired PC and the air-fired reference plant are shown on Table 4.5.2. The “total production cost” shown at the bottom of the table expresses the charge of operating and maintaining the baseline plant (including fuel and consumable costs) in terms of cents per kilowatt-hour.
4.5.6 Cost Of Electricity (COE) The COE value is made up of contributions from the capital cost (called the carrying charge), operating and maintenance costs, consumables, and fuel costs. The following relationship is used to calculate COE from these cost components: COE = LCC + LFOM x 100/(8760 x CF) + LVOM + LCM +LFC LCC = Levelized carrying charge, ¢/kWh
195
LFOM = Levelized fixed O&M, $/kW-yr LVOM = Levelized variable O&M, ¢/kWh LCM = Levelized consumables, ¢/kWh LFC = Levelized fuel costs, ¢/kWh CF = plant capacity factor (0.85) The basis for calculating the capital investment and revenue requirements for the reference plant and the O2 PC are given in Table 4.5.3 and Table 4.5.4, respectively. The capital investment and revenue requirements summary is given in Table 4.5.5 for the reference plant without CO2 sequestration and in Table 4.5.6 for the O2 PC. As Table 4.5.5 and Table 4.5.6 show, the levelized COE for 85% capacity factor was calculated at 4.61 ¢/kWh without CO2 sequestration and at 6.41¢/kWh with CO2 sequestration.
4.5.7 Comparison with Other Technologies An economic comparison was performed between the O2 PC and other competing CO2 removal technologies. For comparison the following alternate technologies were chosen: Air PC: Supercritical PC plant with post-combustion CO2 mitigation (Ref
[12] case 7A). NGCC: Natural Gas Combined Cycle with post combustion (Ref. [12] case
1A). IGCC: Integrated Gasification Combined Cycle with pre-combustion CO2
mitigation (Ref. [24] case 3E). The economics of these technologies were compared with the O2 PC using both the levelized cost of electricity and the CO2 mitigation cost as indexes. The CO2 mitigation cost (MC) shows the cost impact, in dollars per tonne of CO2 that would otherwise be emitted, of a configuration that allows CO2 capture relative to the reference plant. The MC is calculated as follows: MC = COEwith removal - COEreference x 0.01 $/¢ Ereference – Ewith removal COE = Cost of electricity in ¢/kWh E = CO2 emission in tonnes/kWh The COE and MC for the Air PC, NGCC, and IGCC were obtained from Ref. 12and Ref. 24. Since the economic analysis of Ref. 12 and Ref. 24 were made in
196

2000 two adjustments were necessary so that the values can be compared to the results of the current O2 PC economic analysis:
1. A constant inflation rate of 2% was assumed between 2000 and 2004. 2. The 2000 natural gas fuel price was replaced with the 2004 natural gas
fuel price (fuel price = 5.89 $/MM Btu, an increase of 118% above 2000 price).
Since the analyses of Ref. 12 and Ref. 24 were assumed at a 65% capacity factor, Figure 4.5.1 and Figure 4.5.2 present a comparison of the COE and MC using a 65% capacity factor for the O2 PC. Compared to the COE of the O2 PC, the COE for the other technologies is 17% higher for Air PC, 15% higher for NGCC, and 14% lower for IGCC. Compared to the MC of the O2 PC, the MC for the other technologies is 170% higher for NGCC, 100% higher for Air PC, and 9% lower for IGCC. Since the O2 PC uses reliable long-proven technology it is expected that the capacity factor of the O2 PC will be close to 85%. Consequently Figure 4.5.3 and Figure 4.5.4 present a comparison of the COE and MC using an 85% capacity factor for the O2 PC. Compared to the COE of the O2 PC, the COE for the other technologies is 45% higher for Air PC, 40% higher for NGCC, and 6% higher for IGCC. Compared to the MC of the O2 PC, the MC for the other technologies is 250% higher for NGCC, 160% higher for Air PC, and 17% higher for IGCC. Note that the air-fired post combustion capture PC plant data used in Figure 4.5.1 to Figure 4.5.4 is for a supercritical unit whereas the O2 PC plant operates at subcritical pressure. It is expected that the economic cost (COE and MC) of a supercritical O2 PC will be lower than a subcritical O2 PC.
197

Table 4.5.2 - Operating, Maintenance and Fuel Costs for the O2 PC and the
Air-fired Reference
198
1) With CO2 Sequestration (O2 PC)Plant Net Power = 326 MWCapacity Factor 85%Operating and Maintenance Costs
Unit Cost $/year $/KW-yrOperating labor 60 people $90,000.00 $5,400,000.00 $16.56Maintenance Cost 2% of TPC
Maintenance Labor (40%) $5,509,389.60 $16.90Maintenance Materials (60%) $8,264,084.40 $25.35
Administrative Support and Labor 25 % of O&M Labor $2,727,347.40 $8.37
Consumable Operating Costs (Except Fuel) Unit Cost $/year c/KWh
Water 8080 kgals/day $0.80 $2,005,411 0.070 Water Chemicals 19553 lbs/day $0.16 $970,619 0.034 LimestoneStart-up Fuel 5 starts/year $50,000.00 0.002 Startup Electricity 6300 MWh/yr $30 $189,000.00 0.007 Ash disposal 18.26 ton/hr $10 $1,359,639.60 0.048 Other Chemicals $330,000.00 0.012
0.160 Fuel Cost (2004 Dollars) Heat Rate = 11,411 Btu/kWh
Unit Cost $/year c/KWh3720.11 MMBtus/hr $1.14 $31,577,905 1.301
Total Production Cost 2.36 c/kWh
2) Without CO2 Sequestration (Air-fired reference)Plant Net Power = 417 MWCapacity Factor 85%Operating and Maintenance Costs
Unit Cost $/year $/KW-yrOperating labor 56 people $90,000.00 $5,040,000.00 $15.46Maintenance Cost 2% of TPC
Maintenance Labor (40%) $4,680,000.00 $14.36Maintenance Materials (60%) $7,020,000.00 $21.53
Administrative Support and Labor 25 % of O&M Labor $2,430,000.00 $7.45
Consumable Operating Costs (Except Fuel) Unit Cost $/year c/KWh
Water 7906 kgals/day $0.80 $1,962,269 0.054 Water Chemicals 19133 lbs/day $0.16 $949,738 0.026 Limestone 432 tons/day $15 $2,010,420 0.055 Start-up Fuel 5 starts/year $50,000.00 0.001 Startup Electricity 6300 MWh/yr $30 $189,000.00 0.005 Ash disposal 52.43 ton/hr $10 $3,903,937.80 0.107
0.248 Fuel Cost (2004 Dollars) Heat Rate = 9,302 Btu/kWh
Unit Cost $/year c/KWh3878.96 MMBtus/hr $1.14 $32,926,353 1.060
Total Production Cost 2.10 c/kWh

Table 4.5.3 - Estimate Basis/Financial Criteria for Revenue Requirement
Calculations: Air-fired Reference Plant
GENERAL DATA/CHARACTERISTICS
Plant Type: Air-fired Subcritical PC
Plant Size: 450 MW, net
Location: Sea Level, Middletown USA
Fuel: Primary/Secondary Illinois #6 --
Energy from Primary/Secondary Fuels: 9,302 Btu/kWh -- Btu/kWh
Levelized Capacity Factor / Preproduction (equivalent months): 85% 1 months
Capital Cost Year Dollars (Reference Year Dollars): 2004 (January)
Delivered Cost of Primary/Secondary Fuel: 1.14 $/MBtu -- $/MBtu
Design/ Construction Period: 4 years
Plant Start-up Date (1st year Dollars): 2008 (January)
Land Area/Unit Cost: 60 acres $10,000 / Acre
FINANCIAL CRITERIA
Project Book Life: 20 years
Book Salvage Value: - %
Project Tax Life: 20 years
Tax Depreciation Method: Accel. Based on ACRS Class
Inflation Rate 2.0 %
Property Tax Rate: 1.0 %
Insurance Tax Rate: 1.0 %
Federal Income Tax Rate: 34.0 %
State Income Tax Rate: 4.2 %
Investment Tax Credit/% Eligible - % - %
Economic Basis: Over Book Constant Dollars
Capital Structure % of Total Cost(%)Common Equity 40 12Preferred Stock 0 8.5Debt 60 7
Weighted Cost of Capital: (after tax) 7.456%
199

Table 4.5.4 - Estimate Basis/Financial Criteria for Revenue Requirement
Calculations: O2-fired Reference Plant
GENERAL DATA/CHARACTERISTICS
Plant Type: Oxygen Fired Subcritical PC
Plant Size: 327 MW, net
Location: Sea Level, Middletown USA
Fuel: Primary/Secondary Illinois #6 --
Energy from Primary/Secondary Fuels: 11,411 Btu/kWh -- Btu/kWh
Levelized Capacity Factor / Preproduction (equivalent months): 85% 1 months
Capital Cost Year Dollars (Reference Year Dollars): 2004 (January)
Delivered Cost of Primary/Secondary Fuel: 1.14 $/MBtu -- $/MBtu
Design/ Construction Period: 4 years
Plant Start-up Date (1st year Dollars): 2008 (January)
Land Area/Unit Cost: 60 acres $10,000 / Acre
FINANCIAL CRITERIA
Project Book Life: 20 years
Book Salvage Value: - %
Project Tax Life: 20 years
Tax Depreciation Method: Accel. Based on ACRS Class
Inflation Rate: 2.0 %
Property Tax Rate: 1.0 %
Insurance Tax Rate: 1.0 %
Federal Income Tax Rate: 34.0 %
State Income Tax Rate: 4.2 %
Investment Tax Credit/% Eligible - % - %
Economic Basis: Over Book Constant Dollars
Capital Structure % of Total Cost(%)Common Equity 40 12Preferred Stock 0 8.5Debt 60 7
Weighted Cost of Capital: (after tax) 7.456%
200

Table 4.5.5 - Capital Investment and Revenue Requirement Summary: Air-
fired Reference Plant
Case: Subcritical PC PlantPlant size: 417 MW net Net Cycle Efficiency: 36.68%Primary/Secondary Fuel (type): Illinois #6 Net Plant Heat Rate (NPHR): 9,302 (Btu/kWh)Design/Construction: 4 (years) Cost: 1.14 ($/MMBtu)TPC (Plant Cost) Year: 2004 (July) Book Life: 20 (years)Capacity Factor: 85% (%) TPI Year: 2004 (July)
CO2 Removed: (tons/year)
CAPITAL INVESTMENT $x1000 $/kWProcess Capital and Facilities 585,000 1,402.9 Engineering Adder (Incl. C.M., H.O., and Fee) - - Process Contingency Adder - - Project Contingency Adder - -
TOTAL PLANT COST (TPC) 585,000$ 1,402.9 TOTAL CASH EXPENDED 585,000$ AFDC 58,500$ TOTAL PLANT INVESTMENT (TPI) 643,500$
Royalty AllowancePreproduction Cost $16,012Inventory Capital $3,544Initial Chemicals and Catalysts (w/equip)Land Cost $600
TOTAL CAPITAL REQUIREMENT (TCR) 663,656$
OPERATING & MAINTENANCE COSTS (1999 DOLLARS) $x1000 $/kW-yrOperating Labor 5,040 12.1 Maintenance Labor 4,680 11.2 Maintenance Materials 7,020 16.8 Administrative Support and Labor 2,430 5.8
TOTAL OPERATION & MAINTENANCE 19,170$ 46.0
FIXED O & M 29.14 $/kW-yr
VARIABLE O & M 0.23 c/kWh
CONSUMABLE OPERATING COSTS less Fuel (1999 DOLLARS) $x1000 c/kWhWater 1962 0.05Chemicals 2960 0.08Other Consumables 239 0.01Waste Disposal 3904 0.11
TOTAL CONSUMABLE OPERATING COST 9,065$ 0.25
FUEL COST (1999 Dollars) 32,926$ 1.06
Levelized (Over Book Life $)PRODUCTION COST SUMMARY c/kWhFixed O&M 0.39 Variable O&M 0.23 Consumables 0.25By-product Credit 0Fuel 1.06
TOTAL PRODUCTION COST 1.93
LEVELIZED CARRYING CHARGES (Capital) 2.68
LEVELIZED (Over Book Life) BUSBAR COST OF POWER 4.61
201

Table 4.5.6 - Capital Investment and Revenue Requirement Summary: O2-
fired Plant
Case: Oxygen Fired Subcritical PC PlantPlant size: 326 MW net Net Cycle Efficiency: 29.90%Primary/Secondary Fuel (type): Illinois #6 Net Plant Heat Rate (NPHR): 11,411 (Btu/kWh)Design/Construction: 4 (years) Cost: 1.14 ($/MMBtu)TPC (Plant Cost) Year: 2004 (July) Book Life: 20 (years)Capacity Factor: 85% (%) TPI Year: 2004 (July)
CO2 Removed: 3,652,640 (tons/year)
CAPITAL INVESTMENT $x1000 $/kWProcess Capital and Facilities 667,764 2,048.4 Engineering Adder (Incl. C.M., H.O., and Fee) 9,316 28.6 Process Contingency Adder - - Project Contingency Adder 11,594 35.6
TOTAL PLANT COST (TPC) 688,674$ 2,112.5 TOTAL CASH EXPENDED 688,674$ AFDC 68,867$ TOTAL PLANT INVESTMENT (TPI) 757,541$
Royalty AllowancePreproduction Cost $18,268Inventory Capital $3,718Initial Chemicals and Catalysts (w/equip)Land Cost $600
TOTAL CAPITAL REQUIREMENT (TCR) 780,128$
OPERATING & MAINTENANCE COSTS (1999 DOLLARS) $x1000 $/kW-yrOperating Labor 5,400 16.6 Maintenance Labor 5,509 16.9 Maintenance Materials 8,264 25.3 Administrative Support and Labor 2,727 8.4
TOTAL OPERATION & MAINTENANCE 21,901$ 67.2
FIXED O & M 41.83 $/kW-yr
VARIABLE O & M 0.34 c/kWh
CONSUMABLE OPERATING COSTS less Fuel (1999 DOLLARS) $x1000 c/kWhWater 2005 0.07Chemicals 1301 0.05Other Consumables 239 0.01Waste Disposal 1360 0.05
TOTAL CONSUMABLE OPERATING COST 4,905$ 0.17
FUEL COST (1999 Dollars) 31,578$ 1.30
Levelized (Over Book Life $)PRODUCTION COST SUMMARY $/tonne CO2 avoided c/kWhFixed O&M 2.03 0.56 Variable O&M 1.36 0.34 Consumables (0.91) 0.17 By-product Credit - - Fuel 2.86 1.30
TOTAL PRODUCTION COST 5.34 2.37
LEVELIZED CARRYING CHARGES (Capital) 16.08 4.03
LEVELIZED (Over Book Life) BUSBAR COST OF POWER 21.42 6.41
202
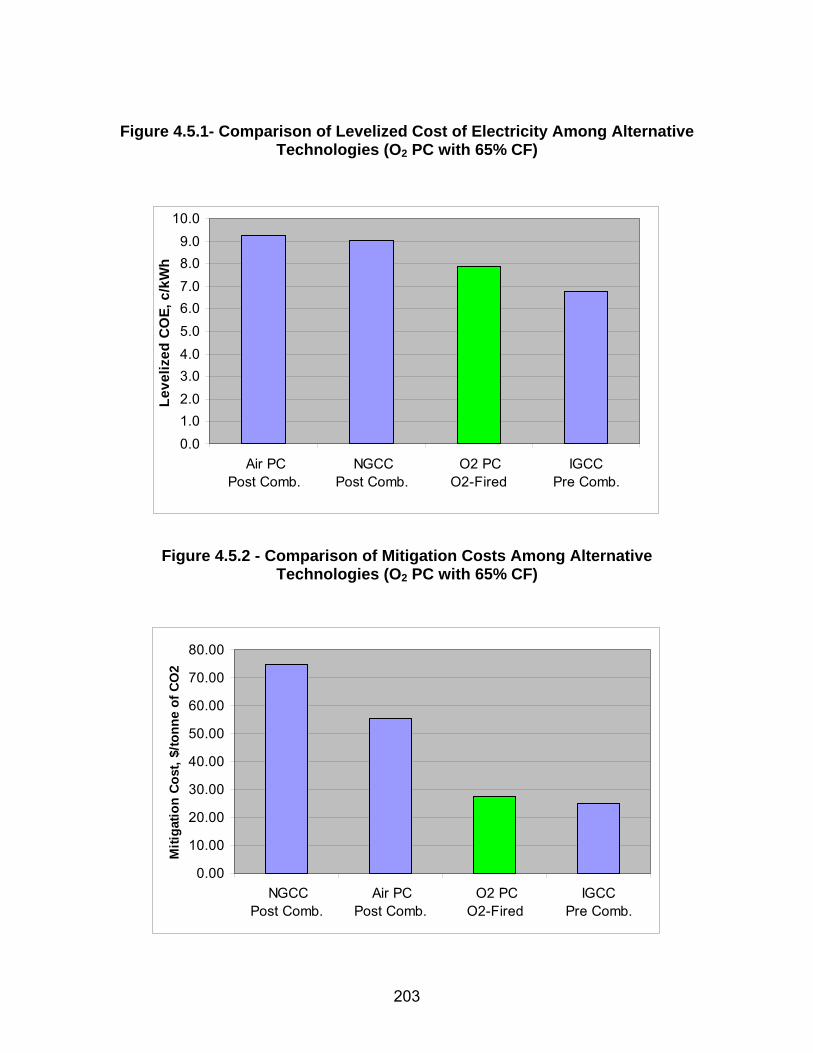
Figure 4.5.1- Comparison of Levelized Cost of Electricity Among Alternative
Technologies (O2 PC with 65% CF)
0.01.02.03.04.05.06.07.08.09.0
10.0
Air PC Post Comb.
NGCC Post Comb.
O2 PC O2-Fired
IGCC Pre Comb.
Leve
lized
CO
E, c
/kW
h
Figure 4.5.2 - Comparison of Mitigation Costs Among Alternative
Technologies (O2 PC with 65% CF)
0.00
10.00
20.00
30.00
40.00
50.00
60.00
70.00
80.00
NGCC Post Comb.
Air PC Post Comb.
O2 PC O2-Fired
IGCC Pre Comb.
Miti
gatio
n C
ost,
$/to
nne
of C
O2
203
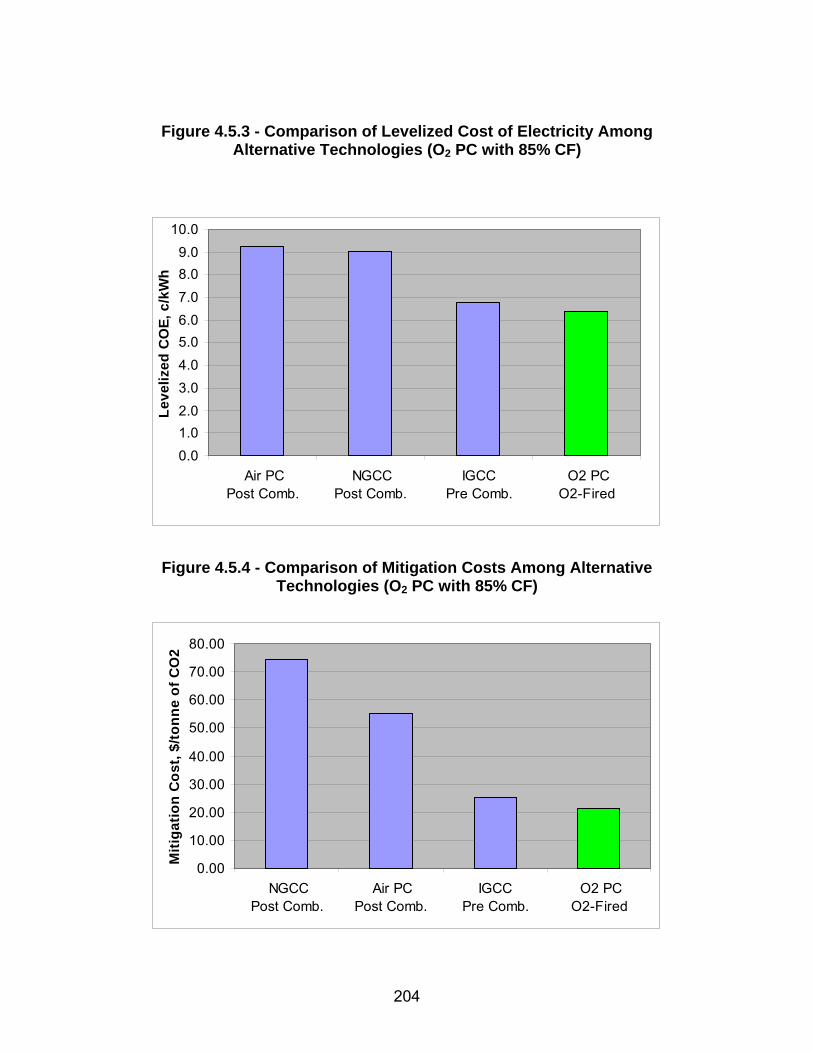
Figure 4.5.3 - Comparison of Levelized Cost of Electricity Among
Alternative Technologies (O2 PC with 85% CF)
0.01.02.03.04.05.06.07.08.09.0
10.0
Air PC Post Comb.
NGCC Post Comb.
IGCC Pre Comb.
O2 PC O2-Fired
Leve
lized
CO
E, c
/kW
h
Figure 4.5.4 - Comparison of Mitigation Costs Among Alternative
Technologies (O2 PC with 85% CF)
0.00
10.00
20.00
30.00
40.00
50.00
60.00
70.00
80.00
NGCC Post Comb.
Air PC Post Comb.
IGCC Pre Comb.
O2 PC O2-Fired
Miti
gatio
n C
ost,
$/to
nne
of C
O2
204

5.0 Conclusion To assure continued U.S. power generation from its abundant domestic coal resources, new coal combustion technologies must be developed to meet future emissions standards, especially CO2 sequestration. Current conventional coal-fired boiler plants burn coal using 15-20% excess air producing a flue gas, which is only approximately 15% CO2. Consequently, CO2 sequestration requires non-condensable gases stripping, which is both expensive and highly power-consumptive. Several different technologies for concentrating the CO2 by removing the non-condensable gases have been proposed including amine-based absorption and membrane gas absorption. However, these techniques require substantial energy, typically from low-pressure steam. A new boiler is presented where the combustion air is separated into O2 and N2 and the boiler uses the O2, mixed with recycled flue gas, to combust the coal. The products of combustion are thus only CO2 and water vapor. The water vapor is easily condensed, yielding a pure CO2 stream ready for sequestration. The CO2 effluent is in a liquid form and is piped from the plant to the sequestration site. The combustion facility is thus truly a zero emission stackless plant. The efficiency and cost-effectiveness of carbon sequestration in oxygen-firing boilers can rival competing gasification plants by specifically tailoring boiler design by appropriate surface location, combustion system design, material selection, furnace layout, and water/steam circuitry. Boiler efficiencies of near 100% can be achieved by recovery of virtually all of the flue gas exhaust sensible and latent heat. Boiler size can be substantially reduced due to higher radiative properties of O2-combustion versus air-combustion. Furthermore, a wider range of fuels can be burned due to the high oxygen content of the combustion gas and potential for high coal preheat. A review of the published literature indicates that: 1.) It is possible to design a pulverized coal burner to operate with an oxygen-
carbon dioxide gas mixture rather than air; a properly designed O2 burner can yield flame temperatures and thermal profiles similar to those of an air–fired boiler while also providing improved flame stability, combustion efficiency; and NOx emissions.
2.) Plant conceptual designs and cost estimates, although differing in absolute
values, indicate an O2 combustion based plant are technically feasible and, when compared to alternative existing technologies, appear to be the lowest cost way of providing a concentrated CO2 stream for sequestration. It is also expected that when for a new plant, O2 combustion will result in a more compact, less expensive boiler. Depending upon the SO2 and NOx levels that
205

can be recirculated back to the boiler, as well as tolerated at the sequestration site, O2 can possibly result in reduced flue gas cleanup costs.
3.) Even though O2 combustion is projected to be the least expensive way of
providing a concentrated CO2 stream for sequestration, significant increases in plant heat rates and costs will be experienced.
4.) Since O2 combustion eliminates the need for large, back end amine based scrubbers and, in essence, saves the boiler, it is especially attractive for retrofit applications.
5.) O2 based PC plants will require large amounts of oxygen and cryogenic air
separation presently appears best suited for this application. Cryogenic units, however, are expensive and consume substantial amounts of power. It is noted that ceramic oxygen transport membranes are under development that are projected to be a lower cost, lower power consuming way to produce large quantities of oxygen. When commercial, these membranes should improve the performance and reduce the costs of the O2 based plant.
A conceptual design of a CO2 sequestration-ready oxygen-based 460 MWe (gross) PC boiler plant was developed. The selected O2-fired design case has a system efficiency of 30.6% compared to the air-fired system efficiency of 36.7%. The design O2-fired case requires T91 waterwall material and has a waterwall surface area of only 65% of the air-fired reference case. A design and analysis of the Low NOx wall-fired burners for the proposed oxygen-fired boiler were performed. Burner designs were performed for 56% and 65% flue gas recycle for both 0% OFG and 20% OFG. To achieve proper burnout (> 70% by the center of the furnace) and stable ignition, a primary gas swirl ratio of 0.5 was required for all four burner designs. To achieve optimal performance the following wall-fired burner design conditions were selected as optimal:
1. Primary gas exit conditions are an axial velocity of 100 ft/sec with a tangential swirl ratio of 0.5 to achieve proper burnout and stable ignition.
2. A low velocity (60-70 ft/sec) inner secondary gas exit velocity for
combustion air staging to minimize NOx formation.
3. Outer secondary gas exit conditions are an axial velocity of 120-135 ft/sec with a tangential swirl ratio of 1.0 to induce hot flue gas recirculation to the flame ignition point.
206

A design and analysis of the reference air-fired boiler and the proposed oxygen-fired boiler were performed. The following conclusions are made comparing the air-fired furnace with the oxygen-fired furnace design and performance:
1. The oxygen furnace has only approximately 65% of the surface area and approximately 45% of the volume of the air-fired furnace due to the higher heat flux of the oxygen-fired furnace.
2. Due to the higher O2 concentration of the oxygen-fired furnace versus the
air-fired furnace (42% vs. 21%), the maximum flame temperature of the oxygen-fired furnace is approximately 500°F higher.
3. Maximum wall heat flux in the oxygen-fired furnace is more than double
that of the air-fired furnace (165,000 Btu/hr-ft2 vs. 75,000 Btu/hr-ft2) due to the higher flame temperature and higher H2O and CO2 concentrations.
4. 100% coal burnout is achieved in the oxygen-fired furnace (compared to
99.7% burnout in the air-fired furnace) due to higher furnace temperature and higher concentration of oxygen. The burnout differential between the oxygen-fired boiler and the air-fired boiler is expected to be significantly greater when harder to burn fuels are fired.
5. The higher heat flux of the oxygen-fired furnace significantly increases the
maximum waterwall temperature (from 800°F for the air-fired furnace to 935°F for the oxygen-fired furnace) requiring the material to be upgraded from carbon steel to T91.
6. The average NOx at the air-fired furnace outlet is reduced by 30% by
injecting 20% OFA and by 45% by injecting 30% OFA. The average NOx at the oxygen-fired furnace outlet is reduced by 23% by injecting 20% OFG. Since it is unclear how much NOx can be tolerated by the oxygen-fired furnace liquid CO2 piping system and sequestration site, the maximum permissible NOx of the oxygen-fired furnace is unknown.
7. The total heat transfer surface required in the oxygen-fired heat recovery
area (HRA) is 25% less than the air-fired HRA due to more heat being absorbed in the oxygen-fired furnace and the greater molecular weight of the oxygen-fired flue gas.
8. The required HRA tube materials and wall thickness are virtually the same
for the air-fired and oxygen-fired design since the flue gas and water/steam temperature profiles encountered by the heat transfer banks are very similar.
207

The levelized cost of electricity (COE) was calculated to be 4.61 ¢/kWh for the reference air-fired plant and to be 6.41¢/kWh for the O2 PC plant. The CO2 mitigation cost (MC) of the O2-PC plant was calculated at 21.4 $/tonne. Compared to the COE of the O2 PC, the COE for the other technologies is 45% higher for Air PC, 40% higher for NGCC, and 6% higher for IGCC. Compared to the MC of the O2 PC, the MC for the other technologies is 250% higher for NGCC, 160% higher for Air PC, and 17% higher for IGCC. It is expected that the COE and MC of the O2 PC will be reduced by the incorporation of new lower power-consuming air separation techniques, such as membrane separation and more advanced steam cycles such as supercritical and ultra-supercritical. In DOE contract, DE-FC26-04NT42207, FW will conduct a study to improve the efficiency and cost-effectiveness of the O2-based PC power plant through the incorporation of a high-temperature supercritical steam cycle and advanced O2 separation techniques. Thus CO2 sequestration with an oxygen-fired combustion plant can be performed in a proven reliable technology while maintaining a low-cost high-efficiency power plant. Of the CO2 sequestration-ready technologies, the O2-fired PC is the simplest, requires the least modification of existing proven designs, and requires no special chemicals for CO2 separation. As new lower power-consuming air separation techniques, such as membrane separation, become commercially available for large-scale operation in O2-fired plants, the CO2 removal power consumption and efficiency reduction will continue to decline.
208

6.0 References
1. International Energy Agency Greenhouse Gas R&D Programme Web Site.
2. International Energy Agency, “Key world Energy Statistics”, 2003.
3. Energy Information Administration of the U.S. Department of Energy,
“Annual Energy Outlook 2004”, January 2004.
4. Smith, D. and Danish, K., “The Heat is On”, Public Utilities Fortnightly, January 2004.
5. Bradley, J., et. al., “NOx Reduction From A 125 MW Wall-Fired Boiler
Utilizing Oxygen Enhanced Combustion”, 29th International Technical Conference on Coal Utilization and Fuel Systems, April 18-22, 2004, Clearwater, FL.
6. Haeyang, P., et. al., “Bench Scale Experiment of Pure Oxygen Pulverized
Coal Combustion in High Temperature”, 9th Asian Pacific Conference on Chemical Engineering Congress, September 29, 2002, Christchurch, New Zealand.
7. Douglas, M., et. al., “Oxy-Fuel Combustion At The CANMET Vertical
Combustor Research Facility”, 1st National Conference on Carbon Sequestration, May 15-17, 2001,Washington, DC.
8. Thambimuthu, K. and Croiset, E., “Enriched Oxygen Coal-Fired
Combustion”, Advanced Coal-Based Power and Environmental Systems Conference, July 21-23, 1998, Morgantown, W. VA.
9. Varagani, R., et. al., “Oxycombustion in Pulverized Coal-Fired Boiler; A
Promising Technology for CO2 Capture”, Third Annual Conference on Carbon Sequestration, May 3-6, 2004, Alexandria, VA.
10. “Greenhouse Gas Emissions from Power Stations”, International Energy
Agency Greenhouse Gas R&D Programme, Report No. ISBN 1 898373 10 8, June 1993.
11. “Carbon Dioxide Capture from Power Stations”, International Energy
Agency Greenhouse Gas R&D Programme, Report No. ISBN 1 898373 15G, February, 1994.
12. White, J.S., Buchanan, T.L., Schoff, R.L. (Parsons); Stiegel, G. (DOE);
Holt, N.A., Booras G. (EPRI); Wolk, R. (WITS), “Evaluation of Innovative
209

Fossil Fuel Power Plants with CO2 Removal”, EPRI, Palo Alto, CA, U,S. Department of Energy—Office of Fossil Energy, Germantown, MD and U.S. Department of Energy/NETL, Pittsburgh, PA EPRI Report No. 1000316, December 2000.
13. Amick, A. et. al., “An Advanced IGCC Coal Power Plant”, Twentieth
Annual International Pittsburgh Coal Conference, Pittsburgh PA., September 15-19, 2001.
14. Holt, N. et. al., “Summary of Recent IGCC Studies of CO2 Capture for
Sequestration”, Gasification Technologies 2003, San Francisco CA., October12-15, 2003.
15. Steigel, G., et. al., “DOE’s Gasification Industry Interviews: Survey of
Market Trends, Issues, and R&D Needs”, Gasification Technologies 2001, San Francisco, CA, October 7-10, 2001.
16. Nsakala, Y., et. al., “Engineering Feasibility of CO2 Capture On An
Existing US Coal-Fired Power Plant”, First National Conference on Carbon Sequestration, May 15-17, 2001, Washington, DC.
17. Simbeck, D., “Overview and Insights on the Three Basic CO2 Capture
Options”, Third Annual Conference on Carbon Sequestration, May 3-6, 2004, Alexandria, VA.
18. Armstrong, P., et. al., “ITM Oxygen: An Enabler for IGCC”, Gasification
Technologies 2003, San Francisco CA., October12-15, 2003.
19. Prasad, R., et. al., “Oxygen Transport Membranes for Future IGCC Power Plants”, Twentieth Annual International Pittsburgh Coal Conference, Pittsburgh PA., September 15-19, 2001.
20. Wilkinson, M.,Boden, John (BP), Panesar, R. (Mitsui Babcock), Allam, R.
(Air Products), “CO2 Capture Via Oxygen Firing: Optimisation of a Retrofit Design Concept for a Refinery Power Station Boiler”, First National Conference on Carbon Sequestration, May 15-17, 2001, Washington DC.
21. FW-FIRE, Fossil-fuel Water-walled Furnace Integrated Reaction
Emission, Theory and User’s Manual, Foster Wheeler Development Corp., 11/30/99.
22. HEATEX Computer Program, “A Program to Determine the
Thermal/Hydraulic Performance of Gas-Cooled Heat Exchangers”, Revision 24, Foster Wheeler Corporation.
210

23. EMISS Computer Program, “A Program to Determine Gaseous Emissivity”, Foster Wheeler Corporation.
24. Schoff, R.L., White, J.S., Buchanan, T.L. (Parsons); Holt, N.A., Booras G.
(EPRI); Wolk, R. (WITS), “Updated Cost and Performance Estimates For Fossil Fuel Power Plants with CO2 Removal”, EPRI, Palo Alto, CA, U.S. Department of Energy – Office of Fossil Energy, Germantown, MD and U.S. Department of Energy/NETL, Pittsburgh, PA: 2002. 1004483.
25. Gerard N. Choi, et al., “Cost Efficient Amine Plant Design for Post
Combustion CO2 Capture from Power Plant Flue Gas”, DOE/NETL 3rd Annual Conference on Carbon Sequestration, Alexandria, VA, May 3-6, 2004.
26. Energy Information Administration/Electric Power Monthly, October 2004.
211

7.0 Bibliography N/A
212

8.0 List of Acronyms and Abbreviations Α Absorptivity σ Stefan-Boltzmann constant ε Emissivity ACI Activated Carbon Injection ASU Air separation unit CF Capacity Factor CFD Computational fluid dynamics CO2 Carbon Dioxide COE Cost or Electricity E Emission of CO2 EIA Energy Information Agency EOR Enhanced Oil Recovery EPRI Electric Power Research Institute ESP Electrostatic Precipitator FD Forced draft FEGT Furnace exit gas temperature FGD Flue Gas Desulfurization FW Foster Wheeler FW-FIRE Fossil fuel, Water-walled Furnace Integrated Reaction and
Emission Simulation GE General Electric Company H2S Hydrogen Sulfide HHV Higher heating value HRA Heat recovery area HRSG Heat Recovery Steam Generator ID Induced draft IEA International Energy Agency IGCC Integrated Coal Gasification Combined Cycle ITM Ion Transport Membrane LCC Levelized Carrying Charge LCM Levelized Consumables LFC Levelized Fuel Costs LFOM Levelized Fixed O&M LHV Lower heating value LOI Loss on ignition LSD Limestone Spray Dryer LVOM Levelized Variable O&M MC Mitigation Cost (CO2) MEA Monoethanolamine N2 Nitrogen NGCC Natural Gas Combined Cycle NOx Nitrogen oxides O&M Operation and Maintenance
213

O2 Oxygen OEC Oxygen Enhanced Combustion OFA Over-fired air OFG Over-fire gas OTM Oxygen Transport Membrane PA Primary Air PG Primary Gas PC Pulverized coal PDF Probability density function ppmv Parts Per Million by Volume PRB Powder River Basin Q/A Heat Flux SC Super Critical Pressure SCR Selective catalytic reactor SO2 Sulfur Dioxide SOx Oxides of Sulfur T Temperature TCR Total Capital Requirement TEG Triethyleneglycol TPC Total Plant Cost TPI Total Plant Investment U Heat transfer coefficient U.S. United States UBC Unburned carbon loss USC Ultra Super Critical Pressure
214