conceptual design of supercritical o -based pc boiler ... library/research/coal/ewr/co2/42207... ·...
TRANSCRIPT

Conceptual Design of Supercritical O2-Based PC Boiler
Final Report
Andrew Seltzer Zhen Fan
Archie Robertson
November 2006
DE-FC26-04NT42207
Foster Wheeler Power Group, Inc. 12 Peach Tree Hill Road
Livingston, New Jersey 07039
1

DISCLAIMER
This report was prepared as an account of work sponsored by an agency of the United States Government. Neither the United States Government nor any agency thereof, nor any of their employees, makes any warranty, express or implied, or assumes any legal liability or responsibility for the accuracy, completeness, or usefulness of any information, apparatus, product, or process disclosed, or represents that its use would not infringe privately owned rights. Reference herein to any specific commercial product, process, or service by trade name, trademark, manufacturer, or otherwise does not necessarily constitute or imply its endorsement, recommendation, or favoring by the United States Government or any agency thereof. The views and opinions of authors expressed herein do not necessarily state or reflect those of the United States Government or any agency thereof.
2
ABSTRACT The objective of the system design and analysis task of the Conceptual Design of Oxygen-Based Supercritical PC Boiler study is to evaluate the effects of oxygen firing on supercritical PC boiler design, operation and system performance. Simulations of the oxygen-fired plant with CO2 sequestration were conducted using Aspen Plus and were compared to a reference air-fired 460 MWe plant. Flue gas recycle is used to control the flame temperature and resultant wall temperature in the O2-fired PC. Parametric trade-off studies were made to determine the effect of flame temperature on system efficiency. The degree of improvement in system performance of various modifications was investigated. The objective of the advanced oxygen separation system integration task of the study is to evaluate the benefits, effects, and limitations of the integration of advanced oxygen separation technologies into a supercritical O2-fired PC. Simulations of the power generation unit, oxygen separation unit, and CO2 sequestration system were conducted using the Aspen Plus software. The improvement of the O2-fired PC system performance incorporating the Oxygen Ion Transport Membrane (OITM) and Ceramic Auto-thermal Recovery (CAR) were investigated. A parametric study was conducted to determine the sensitivity of the design and performance to various variables. Compared to the other CO2 removal and sequestration technologies, the oxygen-fired PC integrated with OITM shows substantially less CO2 removal penalty. The CO2 removal penalty of the oxygen-fired PC integrated with CAR is between cryogenic air separation and OITM. The objective of the furnace and heat recovery area design and analysis task of the study is to optimize the location and design of the furnace, burners, over-fire gas ports, and internal radiant surfaces. The furnace and heat recovery area were designed and analyzed using the FW-FIRE, Siemens, and HEATEX computer programs. The furnace is designed with opposed wall-firing burners and over-fire air ports. Water is circulated in the furnace by forced circulation to the waterwalls at the periphery and divisional wall panels within the furnace. Compared to the air-fired furnace, the oxygen-fired furnace requires only 65% of the surface area and 45% of the volume. Two oxygen-fired designs were simulated: 1) with a cryogenic air separation unit (ASU) and 2) with an oxygen ion transport membrane (OITM). The maximum wall heat flux in the oxygen-fired furnace is more than double that of the air-fired furnace due to the higher flame temperature and higher H2O and CO2 concentrations. The coal burnout for the oxygen-fired case is 100% due to a 500°F higher furnace temperature and higher concentration of O2. Because of the higher furnace wall temperature of the oxygen-fired case compared to the air-fired case, furnace water wall material was upgraded from T2 to T92. Compared to the air-fired heat recovery area (HRA), the oxygen-fired HRA total heat transfer surface is 35% less for the cryogenic design and 13% less for the
3
OITM design due to more heat being absorbed in the oxygen-fired furnace and the greater molecular weight of the oxygen-fired flue gas. The HRA tube materials and wall thicknesses are nearly the same for the air-fired and oxygen-fired designs since the flue gas and water/steam temperature profiles encountered by the heat transfer banks are similar. The capital and operating costs of the pulverized coal-fired boilers required by the three different plants (air-fired, O2-fired with cryogenic ASU and O2-fired with OITM) were estimated by Foster Wheeler and the balance of plant costs were budget priced using published data together with vendor supplied quotations. The cost of electricity produced by each of the plants was determined and oxygen-based plant CO2 mitigation costs were calculated and compared to each other as well as to values published for some alternative CO2 capture technologies. Compared to other CO2 sequestration technologies, the O2-fired PC is substantially more cost effective than both natural gas combined cycles and post CO2 removal PCs and it is superior, especially when a supercritical steam cycle is applied, to integrated gasification combined cycles.
4
Table of Contents ABSTRACT....................................................................................................................... 3
1.0 INTRODUCTION................................................................................................. 9
2.0 EXECUTIVE SUMMARY ................................................................................ 11
3.0 EXPERIMENTAL.............................................................................................. 17
4.0 RESULTS AND DISCUSSION ......................................................................... 18 4.1 SYSTEM DESIGN AND ANALYSIS........................................................................ 18
4.1.1 Reference Site and Conditions .................................................................. 18 4.1.2 Air-Fired Reference Case (case-1) ........................................................... 19 4.1.3 Oxygen-Based PC Plant – Base Case....................................................... 22 4.1.4 Parametric Cases...................................................................................... 28 4.1.5 Part Load .................................................................................................. 40 4.1.6 Comparison With Post Combustion CO2 Capture.................................... 42 4.1.7 Furnace Waterwall Temperature.............................................................. 42
4.2 ADVANCED O2 SEPARATION SYSTEM INTEGRATION.......................................... 43 4.2.1 O2-Fired PC Integrated with Cryogenic ASU (case-6)............................ 43 4.2.2 O2-Fired PC Integrated with OITM.......................................................... 45 4.2.3 O2-Fired PC Integrated with CAR............................................................ 61 4.2.4 Comparisons ............................................................................................. 67
4.3 FURNACE AND HEAT RECOVERY AREA DESIGN AND ANALYSIS........................ 69 4.3.1 Furnace Design and Analysis ................................................................... 69 4.3.2 Boundary Conditions ................................................................................ 71 4.3.3 Furnace Waterwall and Division Wall Design....................................... 115 4.3.4 Furnace Waterwall Corrosion................................................................ 123 4.3.5 Heat Recovery Area Design and Analysis .............................................. 125
4.4 ECONOMIC ANALYSIS ...................................................................................... 131 4.4.1 Main Assumptions................................................................................... 131 4.4.2 Plant Cost Basis...................................................................................... 134 4.4.3 Total Plant Investment (TPI) .................................................................. 142 4.4.4 Total Capital Requirement (TCR)........................................................... 142 4.4.5 Operating Costs And Expenses............................................................... 143 4.4.6 Cost Of Electricity (COE)....................................................................... 144 4.4.7 Tube Weld Overlay ................................................................................. 145 4.4.8 Reduced Pipeline Pressure ..................................................................... 146 4.4.9 Comparison with Other Technologies .................................................... 155
5.0 CONCLUSION ................................................................................................. 157
6.0 REFERENCES.................................................................................................. 161
7.0 BIBLIOGRAPHY............................................................................................. 163
8.0 LIST OF ACRONYMS AND ABBREVIATIONS ........................................ 164
5

List of Figures Figure 4.1.1 - Reference Case of Air-fired Supercritical PC................................21 Figure 4.1.2 – Oxygen purity effect on ASU specific power ................................23 Figure 4.1.3 - Carbon burnout vs. O2 concentration to boiler ..............................25 Figure 4.1.4 - Base case of O2-fired supercritical PC..........................................27 Figure 4.1.5 - O2-fired supercritical PC with liquid CO2 pump (Case-3) .............31 Figure 4.1.6 - Temperature-Quality diagram for wet-end heat exchangers.........32 Figure 4.1.7 – Equilibrium and adiabatic temperatures vs. O2 concentration......33 Figure 4.1.8 - Boiler design with HRA series pass..............................................38 Figure 4.1.9 - Boiler design with HRA series pass (56% Flue Gas Recycle) ......39 Figure 4.1.10 - Flue gas recycle flow vs. part load operation..............................41 Figure 4.1.11 Efficiency at part load operation....................................................41 Figure 4.2.1 - Base case of O2-fired supercritical PC with Cryogenic ASU.........44 Figure 4.2.2 - A Typical Oxygen Ion Transport Membrane Schematic [4]...........47 Figure 4.2.3 – Integration of Oxygen Ion Transport Membrane into O2-PC........48 Figure 4.2.4 - O2-PC with OITM .........................................................................51 Figure 4.2.5 – Effect of OITM O2 Recovery Efficiency on Efficiency ...................54 Figure 4.2.6 – Effect of Sweep Gas Pressure on LMPD.....................................55 Figure 4.2.7 – Effect of OITM Pressure on System Efficiency and LMPD: Variable
O2 Recovery................................................................................................57 Figure 4.2.8 – Effect of O2 Recovery on System Efficiency ................................57 Figure 4.2.9 – Effect of OITM Pressure on System Efficiency and LMPD:
Constant and Variable O2 Recovery ...........................................................58 Figure 4.2.10 - O2-PC with OITM with 58% Recycle Flow..................................60 Figure 4.2.11 - CAR Process Schematic ............................................................61 Figure 4.2.12 – Integration of CAR Process into O2-PC....................................65 Figure 4.2.13 - O2-PC with CAR.........................................................................66 Figure 4.3.1 – Computational Model of Air-Fired Furnace (with right side wall
removed) .....................................................................................................76 Figure 4.3.2 – Computational Model of Oxygen-Fired Furnace With OFA..........77 Figure 4.3.3 – Air-Fired Boundary Conditions.....................................................78 Figure 4.3.4 – Oxygen-Fired Boundary Conditions (Cryogenic ASU) .................79 Figure 4.3.5 – Oxygen-Fired Boundary Conditions (OITM).................................80 Figure 4.3.6 – Air-Fired Boiler Design.................................................................81 Figure 4.3.7 – Summary of FW-FIRE Furnace Modeling Results .......................82 Figure 4.3.8 – Gas Velocity for Air-Fired Case ...................................................83 Figure 4.3.9 – Gas Temperature for Air-Fired Case............................................84 Figure 4.3.10 – O2 Mole Fraction for Air-Fired Case...........................................85 Figure 4.3.11 – Wall Heat Flux for Air-Fired Case ..............................................86 Figure 4.3.12 – Wall Temperature for Air-Fired Case .........................................87 Figure 4.3.13 – Wall CO for Air-Fired Case ........................................................88 Figure 4.3.14 – Char Mass Fraction (72 microns) for Air-Fired Case..................89 Figure 4.3.15 – Char Mass Fraction (176 microns) for Air-Fired Case................90 Figure 4.3.16 – Air-Fired and Oxygen-Fired Boiler Outlines ...............................91 Figure 4.3.17 – Oxygen-Fired Boiler Design (Cryogenic ASU) ...........................92 Figure 4.3.18 – Oxygen-Fired Boiler Design (OITM)...........................................93 Figure 4.3.19 – Gas Velocity for O2-Fired Case..................................................94
6

Figure 4.3.20 – Gas Temperature for O2-Fired Case..........................................95 Figure 4.3.21 – O2 Mole Fraction for O2-Fired Case ...........................................96 Figure 4.3.22 – Wall Heat Flux for O2-Fired Case...............................................97 Figure 4.3.23 – Wall Temperature for O2-Fired Case .........................................98 Figure 4.3.24 – Wall CO for O2-Fired Case.........................................................99 Figure 4.3.25 – Char Mass Fraction (69 micron) for O2-Fired Case..................100 Figure 4.3.26 – Char Mass Fraction (169 micron) for O2-Fired Case................101 Figure 4.3.27 - Flue gas recycle flow vs. part load operation...........................102 Figure 4.3.28 – Summary of O2-Fired Part Load Results, Cryogenic ASU .......103 Figure 4.3.29 – Gas Temperature for O2-Fired Part Load, Cryogenic ASU ......104 Figure 4.3.30 – Wall Heat Flux for O2-Fired Part Load, Cryogenic ASU ...........105 Figure 4.3.31 – Average and Peak Heat Flux in Waterwalls.............................106 Figure 4.3.32 – Gas Velocity for O2-Fired with OITM........................................107 Figure 4.3.33 – Gas Temperature for O2-Fired Case With OITM......................108 Figure 4.3.34 – O2 Mole Fraction for O2-Fired Case With OITM.......................109 Figure 4.3.35 – Wall Heat Flux for O2-Fired Case With OITM...........................110 Figure 4.3.36 – Wall Temperature for O2-Fired Case With OITM .....................111 Figure 4.3.37 – Wall CO for O2-Fired Case With OITM ....................................112 Figure 4.3.38 – Char Mass Fraction (69 micron) for O2-Fired Case, OITM.......113 Figure 4.3.39 – Char Mass Fraction (169 micron) for O2-Fired Case, OITM.....114 Figure 4.3.40 – Advantage of Low Mass Flux Design.......................................117 Figure 4.3.41 – Tube Wall Temperature with Smooth, Standard Rifled, and
Optimized Rifled Tubes .............................................................................118 Figure 4.3.42 – Rifled Tube Design ..................................................................119 Figure 4.3.43 – Outside Tube Wall Temperature with Peak Heat Flux .............120 Figure 4.3.44 – Tube Inlet Mass Flow With a 10% Heat Flux Step Increase (No
Pressure Equalization Header) ..................................................................121 Figure 4.3.45 – Tube Inlet Mass Flow With a 10% Heat Flux Step Increase
(With Pressure Equalization Header at 80’) ...............................................122 Figure 4.3.46 – Predicted Wall Corrosion (mil/yr) in Air-Fired and O2-Fired
Furnaces....................................................................................................124 Figure 4.3.47 – HRA Tube Bank Design...........................................................128 Figure 4.3.48 – HRA Tube Bank Performance .................................................130 Figure 4.4.1 – Increase in COE of O2 Plant Above Air-Fired Reference Plant ..152 Figure 4.4.2 – COE Breakdown ........................................................................153 Figure 4.4.3 - Comparison of Levelized Cost of Electricity Among Alternative
Technologies .............................................................................................156 Figure 4.4.4 - Comparison of Mitigation Costs Among Alternative Technologies
...................................................................................................................156
7

List of Tables
Table 4.1.1 - Summary of Plant Performance and Economics ...........................15 Table 4.1.1 - Site Conditions...............................................................................18 Table 4.1.2 - Setup and Assumptions .................................................................19 Table 4.1.3 - Case Summary .............................................................................29 Table 4.1.4 - Flame adiabatic temperature effect on performance .....................34 Table 4.1.5 – Flame adiabatic temperature effect on boiler flue gas flow ...........34 Table 4.2.1 – Comparison of O2PC with Cryogenic and OITM ASU ..................50 Table 4.2.2 – Parametric Case Summary ...........................................................52 Table 4.2.3 - Effect of OITM O2 Recovery Efficiency on LMPD ..........................54 Table 4.2.4 – Effect of Flame Temperature on Performance ..............................59 Table 4.2.5 - Comparison for CAR with Cryogenic ASU.....................................62 Table 4.2.6 – Comparison for CAR Using Different Sweep Gases .....................63 Table 4.2.7 – O2 PC Efficiency with Different O2 Separation Techniques...........64 Table 4.2.8 - Gains from OITM and CAR Compared to Cryogenic ASU.............67 Table 4.2.9 – Comparison of CO2 Removal Technologies .................................68 Table 4.4.1 - Coal Properties ............................................................................132 Table 4.4.2 - CO2 Effluent Purity Design Conditions.........................................132 Table 4.4.3 – Economic Study Assumptions.....................................................133 Table 4.4.4 - Cost of 430.2 MWe Air-Fired Supercritical PC Plant ($1000 Yr
2006) .........................................................................................................138 Table 4.4.5 - Cost of 347.0 MWe ASU Based Supercritical PC Plant ($1000 Yr
2006) .........................................................................................................139 Table 4.4.6 - Cost of 463.3 MWe OITM Based Supercritical PC Plant ($1000 Yr
2006) .........................................................................................................140 Table 4.4.7 - Comparison of Total Plant Costs ($1000 Yr 2006) ......................141 Table 4.4.8 - Air Fired PC Plant Capital Investment & Revenue Requirement .147 Table 4.4.9 - ASU Based PC Plant Capital Investment & Revenue Requirement
...................................................................................................................148Table 4.4.10 - OITM Based PC Plant Capital Investment & Revenue
Requirement ..............................................................................................149 Table 4.4.11 - Summary of Plant Economics and CO2 Mitigation Costs...........150 Table 4.4.12 - Plant Daily Consumable Requirements .....................................151 Table 4.4.13 – COE and CO2 MC with Weld Overlay and 2200 psi Pressure ..154
8
1.0 Introduction The objective of the Conceptual Design of Oxygen-Based supercritical PC Boiler study is to develop a conceptual pulverized coal (PC)-fired power plant, which facilitates the practical capture of carbon dioxide capture for subsequent sequestration. The system design and analysis task, which was performed using the Aspen Plus computer program, is aimed at optimizing the PC boiler plant operating parameters to minimize the overall power plant heat rate. The flow rates and other properties of individual streams of the power plant were calculated as the results of the Aspen Plus simulations. The required performance characteristics of such operating components as pulverized coal-fired furnace, heat recovery area, flue gas recuperator, and economizer were determined. Two plant configurations were simulated: 1) a conventional air-fired PC power plant and 2) the proposed oxygen-based supercritical PC plant. In order to compare the performance of the oxygen-based plant with that of the conventional plant, the main steam generation rate in the both plants was kept constant. The objective of the advanced oxygen separation system integration task is to identify promising, low cost advanced options of oxygen separation, which can be integrated into the O2-fired PC power plant. Currently, a number of new oxygen separation technologies are in development. They are categorized as high temperature ion membranes, such as oxygen ion transport membrane (OITM), and high temperature sorption, such as ceramic auto-thermal recovery (CAR). The former relies on oxygen transport through a ceramic membrane, and the latter on oxygen storage in perovskite type materials. Integration of these advanced oxygen separations into the O2-fired PC has the potential to substantially reduce the cost of CO2 removal. This task deals with the system-level evaluation of the O2-fired PC integrated with these advanced oxygen separation methods. The advanced oxygen separation system integration task, which was performed using the Aspen Plus computer program, is aimed at a system level optimization to minimize the overall heat rate and maximize system performance. Two types of advanced oxygen separation systems and related configurations were simulated: 1) high temperature membrane technology (OITM) and 2) high temperature oxygen sorbent technology (CAR). Determined are the required performance characteristics of the operating components such as the boiler (with air heater for OITM), GT expander, wet-end economizer for low-grade heat recovery, and air separation equipment. The furnace and heat recovery area design and analysis task, which was performed using the FW-FIRE, Siemens and HEATEX computer programs, is aimed at optimizing the location and design of the furnace, burners, over-fire gas ports, and internal radiant surfaces. Three furnace and HRA designs were developed: 1) a conventional air-fired PC power plant and 2) an oxygen-based
9

PC plant with cryogenic ASU and 3) an oxygen-based PC plant with oxygen ion transport membrane. The objective of the economic analysis is to prepare a budgetary estimate of the capital and operating costs of the O2-fired PC power plants to permit comparison to an equivalent, conventional, air-fired power plant (e.g. the reference plant) as well as other CO2 capture technologies.
10

2.0 Executive Summary The objective of the Conceptual Design of Oxygen-Based supercritical PC Boiler study is to develop and design a conceptual pulverized coal-fired power plant, which facilitates the practical capture of carbon dioxide capture for subsequent sequestration. The reference plant employs a supercritical steam turbine with conditions, 4035psia/1076ºF/1112ºF/2.0”Hg, fires high-volatile bituminous Illinois 6 coal, and produces 460 MWe at the generator. A conventional air-fired case was simulated as the comparison basis. The air-fired plant has a boiler efficiency of 88.2% and a net plant efficiency of 39.5%. The system design and analysis task (Task 1), which was performed using the Aspen Plus computer program, is aimed at optimizing the PC boiler plant operating parameters to minimize the overall power plant heat rate. The oxygen-based plant model contains all the components in the conventional plant model (with the exception of the FGD and SCR) plus the addition of an air separation unit and a flue gas cooler. Flue gas is recycled to control the flame temperature inside the PC boiler to minimize NOx formation, to minimize ash slagging in the furnace combustion zone, and to avoid the application of exotic materials. Equipment to compress and liquefy the CO2 effluent to 3000 psia and to reduce the moisture to 50 ppm (to avoid transport pipe corrosion) was included in the O2-PC system model. Compression to 3000 psia is conservative compared to the pressure of 2200 psia specified in Reference 14. The supercritical O2-PC power plant simulated with the same flame temperature as the air-fired PC, shows a plant net efficiency drop from 39.5 to 30.8%, and a power reduction from 430 to 332 MWe. The flue gas flowing through the boiler changes from 3555 to 3363 klb/hr (179 to 125 Mcf/hr, a 30% reduction in volumetric flow). As the result of the air separation unit (ASU) power and CO2 compressions, the specific power penalty for CO2 removal is 129 kWh/klbCO2. Parametric trade-off runs were made by varying the amount of recycled flue gas (which directly affects the flame temperature) while maintaining the same boiler outlet O2 concentration (3%, vol.) as the air-fired case, and by varying the temperature of the recycled flue gas. The results show that by reducing the recycled flue gas flow rate by 38% (by volume), and by raising the temperature of the recycled flue gas from 95ºF to 260ºF, the equilibrium temperature increases from 3480ºF to 4160ºF, the system efficiency increases from 30.8% to 32.9%, and the specific penalty for CO2 removal reduces from 129 to 99 kWh/klbCO2. The objective of Task 2 is to develop a system design of a conceptual pulverized coal-fired oxygen combustion power plant, integrated with advanced oxygen separation technology. The baseline oxygen-based PC boiler incorporates cryogenic O2 separation, which can produce oxygen with high purity; but it requires substantial capital and operating costs. Membrane separation of O2 has
11
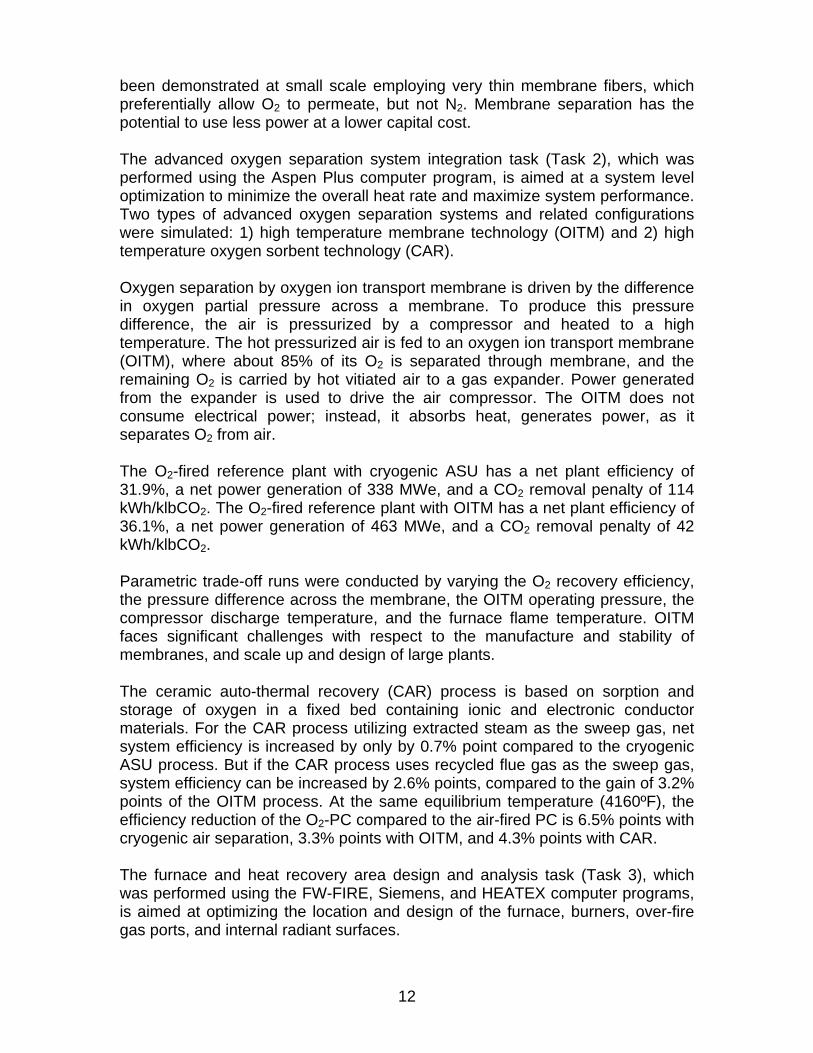
been demonstrated at small scale employing very thin membrane fibers, which preferentially allow O2 to permeate, but not N2. Membrane separation has the potential to use less power at a lower capital cost. The advanced oxygen separation system integration task (Task 2), which was performed using the Aspen Plus computer program, is aimed at a system level optimization to minimize the overall heat rate and maximize system performance. Two types of advanced oxygen separation systems and related configurations were simulated: 1) high temperature membrane technology (OITM) and 2) high temperature oxygen sorbent technology (CAR). Oxygen separation by oxygen ion transport membrane is driven by the difference in oxygen partial pressure across a membrane. To produce this pressure difference, the air is pressurized by a compressor and heated to a high temperature. The hot pressurized air is fed to an oxygen ion transport membrane (OITM), where about 85% of its O2 is separated through membrane, and the remaining O2 is carried by hot vitiated air to a gas expander. Power generated from the expander is used to drive the air compressor. The OITM does not consume electrical power; instead, it absorbs heat, generates power, as it separates O2 from air. The O2-fired reference plant with cryogenic ASU has a net plant efficiency of 31.9%, a net power generation of 338 MWe, and a CO2 removal penalty of 114 kWh/klbCO2. The O2-fired reference plant with OITM has a net plant efficiency of 36.1%, a net power generation of 463 MWe, and a CO2 removal penalty of 42 kWh/klbCO2. Parametric trade-off runs were conducted by varying the O2 recovery efficiency, the pressure difference across the membrane, the OITM operating pressure, the compressor discharge temperature, and the furnace flame temperature. OITM faces significant challenges with respect to the manufacture and stability of membranes, and scale up and design of large plants. The ceramic auto-thermal recovery (CAR) process is based on sorption and storage of oxygen in a fixed bed containing ionic and electronic conductor materials. For the CAR process utilizing extracted steam as the sweep gas, net system efficiency is increased by only by 0.7% point compared to the cryogenic ASU process. But if the CAR process uses recycled flue gas as the sweep gas, system efficiency can be increased by 2.6% points, compared to the gain of 3.2% points of the OITM process. At the same equilibrium temperature (4160ºF), the efficiency reduction of the O2-PC compared to the air-fired PC is 6.5% points with cryogenic air separation, 3.3% points with OITM, and 4.3% points with CAR. The furnace and heat recovery area design and analysis task (Task 3), which was performed using the FW-FIRE, Siemens, and HEATEX computer programs, is aimed at optimizing the location and design of the furnace, burners, over-fire gas ports, and internal radiant surfaces.
12
A simulation was made for both the reference air-fired case and for the oxygen-fired case. Two oxygen-fired models were constructed: one for the cryogenic ASU design (with radiant superheater partial division walls) and the second for the OITM design with a furnace wall radiant superheater and a high temperature air heater. Boundary conditions are based on ASPEN simulations of the power plant. The furnace is designed with opposed wall-firing burners and over-fire air ports located at one burner pitch above the top burner row. The O2-PC supercritical boiler incorporates the BENSON vertical technology, which uses low fluid mass flow rates in combination with optimized rifled tubing. Water is circulated in the furnace by forced circulation to the waterwalls at the periphery and divisional wall panels within the furnace. For the air-fired furnace simulation, the maximum flue gas temperature is approximately 3350oF. The maximum heat flux is approximately 70,000 Btu/hr-ft2 and is located on the side wall at the top of the burner zone. The total heat absorbed by the furnace walls before the furnace exit is 1770 MM Btu/hr. The maximum temperature of the waterwalls is approximately 870oF and of the division walls is approximately 1000oF. Total burnout of all particle sizes is 99.6%. Average NOx concentration at the furnace outlet is 276 ppmvw (0.38 lb/MMBtu). Compared to the air-fired furnace, the oxygen furnace requires only 65% of the surface area and 45% of the volume. Two oxygen-fired designs were simulated: 1) with cryogenic ASU and 2) with OITM. The mixed primary/secondary gas O2 content (before combustion) is approximately 40%. In the oxygen-fired furnace, the maximum flue gas temperature is approximately 3900oF for cryogenic ASU and 3850oF for OITM. The maximum heat flux is 171,000 Btu/hr-ft2 for cryogenic ASU and 180,000 Btu/hr-ft2 for OITM. The maximum wall heat flux in the oxygen-fired furnace is more than double that of the air-fired furnace due to the higher flame temperature and higher H2O and CO2 concentrations. The total heat absorbed by the furnace walls before the furnace exit is approximately 2287 (cryogenic) and 2029 (OITM) MM Btu/hr. The coal burnout for the oxygen-fired case is 100% due to the high furnace temperature and high concentration of O2. NOx is 261 ppmvw (0.18 lb/MMBtu). The maximum temperature of the oxygen-fired furnace is approximately 1060oF for the waterwalls, 1065oF for the division walls, and 1100oF for OITM radiant superheater walls. Because of the higher temperature of the oxygen-fired case compared to the air-fired case, furnace tube material was upgraded from T2 to T92. Since the boiler is a supercritical once-through sliding pressure unit, part load cases (72%, 50%, and 25%) were run and evaluated with thermal/hydraulic and structural criteria. A pressure equalization header is included at an elevation of 80’ to ensure stable operation at low loads.
13

To reduce the corrosion in the O2-PC, tube weld overlays with high Nickel and Chromium contents (e.g. alloy 622) are applied to the waterwalls. This reduces the predicted maximum corrosion from 45 mil/yr to 10 mil/yr. HEATEX was used to determine the heat recovery area (HRA) design of the convective tube banks between the furnace exit and the SCR/air heater. These tube banks include the finishing superheater, finishing reheater, primary superheater, primary reheater, upper economizer, and lower economizer. For the air-fired design, total surface area of all convective banks is 335,025 ft2. The total heat transferred to the water/steam is 1431 MM Btu/hr as 3.59 MM lb/hr of flue gas is cooled from 2185ºF to 720ºF. For the cryogenic ASU oxygen-fired design, convective bank total surface area is 218,693 ft2 and the total heat transferred to the water/steam is 1151 MM Btu/hr as 2.12 MM lb/hr of flue gas is cooled from 2450ºF to 695ºF. For the OITM oxygen-fired design, convective bank total surface area is 274,466 ft2 and the total heat transferred to the water/steam is 1185 MM Btu/hr and to the air is 990 MM Btu/hr as 2.68 MM lb/hr of flue gas is cooled from 2950ºF to 695ºF.The total heat transfer surface required in the oxygen-fired HRA is less than the air-fired HRA due to more heat being absorbed in the oxygen-fired furnace and the greater molecular weight of the oxygen-fired flue gas. The HRA tube materials and wall thicknesses are nearly the same for the air-fired and oxygen-fired designs since the flue gas and water/steam temperature profiles encountered by the heat transfer banks are similar. A tubular convective air heater is included in the OITM O2-PC to provide the necessary air heating for the membrane separation process. The furnace air heater is an Incoloy MA956 three-pass tubular design situated above the furnace nose. The objective of the economic analysis task (Task 4) is to prepare a budgetary estimate of the capital and operating costs of the O2-fired PC power plants to permit comparison to an equivalent, conventional, air-fired power plant (e.g. the reference plant) as well as other CO2 capture technologies. The economic analyses of the plants were carried out based on the EPRI Technical Assessment Guide (TAG) methodology. Plant capital costs were compiled under the Code of Accounts developed by EPRI. The estimate basis is year 2006 dollars, a 20-year life, and an 85 per cent capacity factor. Table 4.1.1 summarizes the performance and economics of the plants.
14

Table 4.1.1 - Summary of Plant Performance and Economics
Reference ASU Based OITM BasedAir-Fired Plant Plant Plant
Net Power Output, MWe 430.2 347.0 463.3
Efficiency, % (HHV) 39.5 33.0 36.1
Coal Flow, Klb/hr 319.0 308.0 375.4
Total Plant CostMillions of Dollars 633.0 723.3 953.0
$/kW 1,471 2,084 2,057
Levelized COE, $/MWhr 50.41 66.17 63.48
CO2 Mitigation Cost, $/tonne 20.23 16.77 Total plant costs are $633 million (1471 $/kW) for the air-fired reference plant, $723 (2084 $/kW) million for the cryogenic ASU O2-PC, and $953 (2057 $/kW) million for the OITM O2-PC. Even though the OITM O2-PC has a total plant cost that was 32 per cent higher than the ASU O2-PC, its higher power output results in a slightly lower $/kW cost of $2,057/kW versus $2,084/kW. The levelized cost of electricity (COE) was calculated for each of the plants assuming an 85 per cent capacity factor. The COE value is made up of contributions from capital cost, operating and maintenance costs, consumables, and fuel costs. The levelized COE was calculated to be $50.41/MWhr for the reference plant, $66.17/MWhr for the cryogenic ASU O2-PC, and $63.48/MWhr for the OITM O2-PC. Again, because of its higher output, the OITM O2-PC has a lower levelized cost of electricity ($63.48/MWhr versus $66.17/MWhr) and a lower CO2 mitigation cost (MC) ($16.77/tonne versus $20.23/tonne) than the ASU O2-PC. The addition of weld overlay increases the COE approximately 0.75%, but reducing the pipeline pressure from 3000 psia to 2200 psia (specified in Ref. 14) reduces the COE by 0.3%. Thus, the combined effect of these two adjustments on the COE is relatively small (+0.4% for cryogenic O2-PC and +0.1% for the OITM O2-PC). Compared to the COE of the supercritical cryogenic O2 PC, the COE for the other technologies is 52% higher for Air PC, 35% higher for NGCC, 15% higher for IGCC, and 5% higher for the subcritical O2PC, and 4% lower for the supercritical O2PC with OITM. Compared to the MC of the supercritical cryogenic O2 PC, the
15

MC for the other technologies is 238% higher for NGCC, 192% higher for Air PC, 25% higher for IGCC, 5% higher for the subcritical O2PC, and 17% lower for the supercritical O2PC with OITM.
16

3.0 Experimental This work performed for this report was performed utilizing computer program simulations. No experimental equipment was used.
17

4.0 Results and Discussion
4.1 System Design and Analysis
4.1.1 Reference Site and Conditions In December 2000, Parsons published a study of the cost of electricity of several case studies of CO2 sequestration from a PC boiler by post-combustion capture (Ref. 1). In September 2005, Foster Wheeler released a report of conceptual design of O2-fired PC boiler (Ref. 3). To provide a consistent comparison with the cases analyzed in the previous reports, the same site conditions (59ºF, 14.7 psia, 60% RH) and the same fuel (Illinois #6) were used. Site Conditions and fuel properties are presented in Table 4.1.1. Fuel HHV and LHV were estimated by a DuLong’s method and the stoichiometric air ratio of 867 lbair/lbcoal was calculated based on the fuel ultimate analysis.
Table 4.1.1 - Site Conditions Standard site: air, %v dry wet coal, Ill#6 %w sorb %welevation, ft 0 N2 78.085 77.297 C 63.75 CaCO3 100amb p, psia 14.70 O2 20.947 20.735 H 4.5amb T, F 59 Ar 0.935 0.926 O 6.88amb T, wet, F 51.5 CO2 0.033 0.033 N 1.25RH, % 60 H2O 0.000 1.010 S 2.51 P-H2O, psia 0.247 sum 100.000 100.000 A 9.99 Y-H2O, %v 1.010 M 11.12condenser P, "Hg 2.00 V 34.99
F 44.19sum 100.0
fuel HHV btu/lbgiven 11666aspen 11631
The CO2 fluid produced from the oxygen-based PC power plant is not chemically pure, but can be readily sequestered in geologic formations (depleted oil and gas reservoirs, unmineable coal seams, saline formations, and shale formations) or in oceans. The liquid CO2 exits the plant at over 2000 psia. The CO2 fluid inside pipeline under this pressure is in a liquid or a supercritical state. The other gases in the delivered CO2 are limited to H2O < 50 ppm (to avoid acid corrosion), and Ar+N2 < 3% (to avoid phase separation). The excess gases in CO2 stream either have to be purged or recycled. However, since SO2, as an acid gas, similar to CO2, it can be sent to pipeline directly under moisture free condition, and as mentioned in literature, it does not need to be separated out from CO2 product. Furthermore it is also not necessary to remove the small concentration of NOx in the CO2 effluent since it can be sequestered along with the CO2.
18

4.1.2 Air-Fired Reference Case (case-1) To study the effects of CO2 removal on the performance of the power plant, an air-fired supercritical PC boiler was been simulated in detail as a reference case. This model was used as the base, which was then extended to include the air separation unit (ASU) and CO2 compression unit for O2-fired PC cases. The reference plant employs a supercritical steam turbine with conditions, 4035psia/1076ºF/1112ºF/2.0”Hg, fires high-volatile bituminous coal, and produces 460 MWe at the generator. It employs eight feed water heaters to raise the final feed water temperature to 569ºF. It uses an auxiliary steam turbine to directly drive the high-pressure feed water pump. Case 1 is the reference air-fired supercritical PC boiler case, and the model and results shown in Figure 4.1.1 and Table 4.1.2.
Table 4.1.2 - Setup and Assumptions
ST Result Aux power MWe dP-air "H2Omain P, psia 4035 net power, MWe 430 condensed water pump 0.6 AAHX 4.0main T, F 1076 net eff, % 39.5 HP feed water pump 17.5 duct 6.0RH P, psia 823 gross @ST, MW 477 FGD pump 0.8 nozzle 10.0RH T, F 1112 aux power, MW 46.0 CT pump 3.4 sum 20.0FWHs 8 as % 9.7 PA Fan 1.1end wet, % 9.5 HHV in, mmbtu 3721 SA Fan 2.0 dp-gas "H2Oend P, "Hg 2.0 Q to st, mmbtu 3281 ID Fan 5.4 FSH 0.5
Q, cond, mmbtu 1696 FGD Fan 4.1 FRH 0.5FWH F boiler eff, % 88.2 cooling tower Fan 1.9 RH 1.0TD 5 ST cycle eff, % 47.7 coal handling 2.0 PSH 0.7DC 10 Generator eff, % 98.3 sorb handling 0.8 UECO 0.3FW T 569 ash handling + ESP 1.8 ECO 2.0
Flow others (=1%) 4.6 AAHX 1.6DeSuperheat air, klb 3270 total 46.0 Damper 4.3SH, % 5 coal, klb 319 BHG 5.5 water T, F 569 sorb, klb 26 FGD & SCR FGD 12.0
flue gas, klb 3556 L/G 10 sum 28.4Boiler O2, % 3.0 Ca/S 1.05PA, % 20 H2O, % 8.6 Excess air, % 85 dP-Fan "H2OUBC, % 1.0 CO, ppmv 14 NH3/NOx 1.0 PAFan 60radiation/margin, % 0.59 NOx, ppmv 22 DeSOx, % 98 IDFan 28EXA, % 17.9 SOx, ppmv 1979 DeNOx, % 90 SAFan 20flame T, F 3685 after FGD 37stack T, F 289 Ash, klb 33 eff %blowdown, % 0 C, % 6.0 FDFan 75miller exit T, F 219 main st, klb 2950 IDFan 70
RH st, klb 2406 CWPump 80end st, klb 1573 BFPump 80
Motor/mech 95
Setup and Result
The Aspen Plus model includes coal mills, flue gas heater, pulverized coal-fired furnace, steam generator, superheater, reheater, economizer, ash-removal unit, nitrogen oxides (NOx) selective catalytic reactor (SCR), flue gas de-sulfurization reactor (FGD), air blower, induced draft (ID) fan, feed water pump, cooling water
19
pump, feed water heaters, and a single reheat steam turbine. A coal drying function has been modeled and added into mill module to produce the correct mill exit gas temperature. The furnace was simulated by a zero dimensional model for heat and mass balances. However, all key tube banks of the heat recovery area (HRA) were individually modeled. The furnace roof heat absorption was also simulated. The high-pressure steam temperature is controlled by water spray for de-superheat. The simulation also included heat losses from the boiler and HRA enclosure, as well as from the steam pipes. Some user-defined models were included to perform emission calculations. User built-in calculations have been added to determine boiler efficiency, system net efficiency, and net power. The heat carried by exhaust streams was automatically calculated by the program. For a given steam turbine output and a fuel, Aspen Plus iterates to determine the feed rates of air, coal, etc., based on specified temperature approaches and excess air requirement. The system configuration, detailed setup parameters and summary of results for the case 1 reference case are shown in Figure 4.1.1 and Table 4.1.2. The system has a steam turbine cycle efficiency (generator power divided by heat transferred to the steam cycle) of 47.6%, a boiler efficiency (heat to steam cycle divided by heat input from fuel to boiler) of 88.2%, an unburned carbon loss (UBC) of 1.0%, and a net plant efficiency of 39.46% (net plant heat rate of 8647 Btu/kWh). It has a gross power of 460 MWe at the generator, 18 MWe from auxiliary steam expander, an auxiliary power of 46 MWe, and a net power of 430 MWe. Total heat input from the fuel is 3720 MM Btu/hr. The temperature of the flue gas exhausted to the stack is 289ºF. The flue gas exiting the boiler contains 3.0%, vol., wet O2 (18% excess air) and contains 739 klb/hr (1.72 lb/kWh) of CO2. This 3.0% O2 level is kept constant for all of the O2-fired cases. A SCR is applied to control NOx with NH3/NOx=1.0, and an FGD is used to control SOx by lime solution with Ca/S=1.05, L/G=10, and 85% excess air for aeration. The breakdown of auxiliary power for case 1 is listed in Table 4.1.2. Most of these power consumptions were simulated directly by the Aspen module. Some required user Fortran for those processes lacking Aspen modules, such as solids handling. The power consumption was based on stream flows and design data. Fan power consumption was simulated based on the pressure drops from both air side and gas side. The total auxiliary power consumption, including FGD, for case 1 is approximately 9.7% of the gross power, while it was about 9.2% for a subcritical case. Because of high temperature and high CO2 concentration, the CO concentration is high, producing a flame temperature, which is lower than the adiabatic combustion temperature. To represent this effect on boiler design, an estimation of the equilibrium flame temperature was modeled.
20
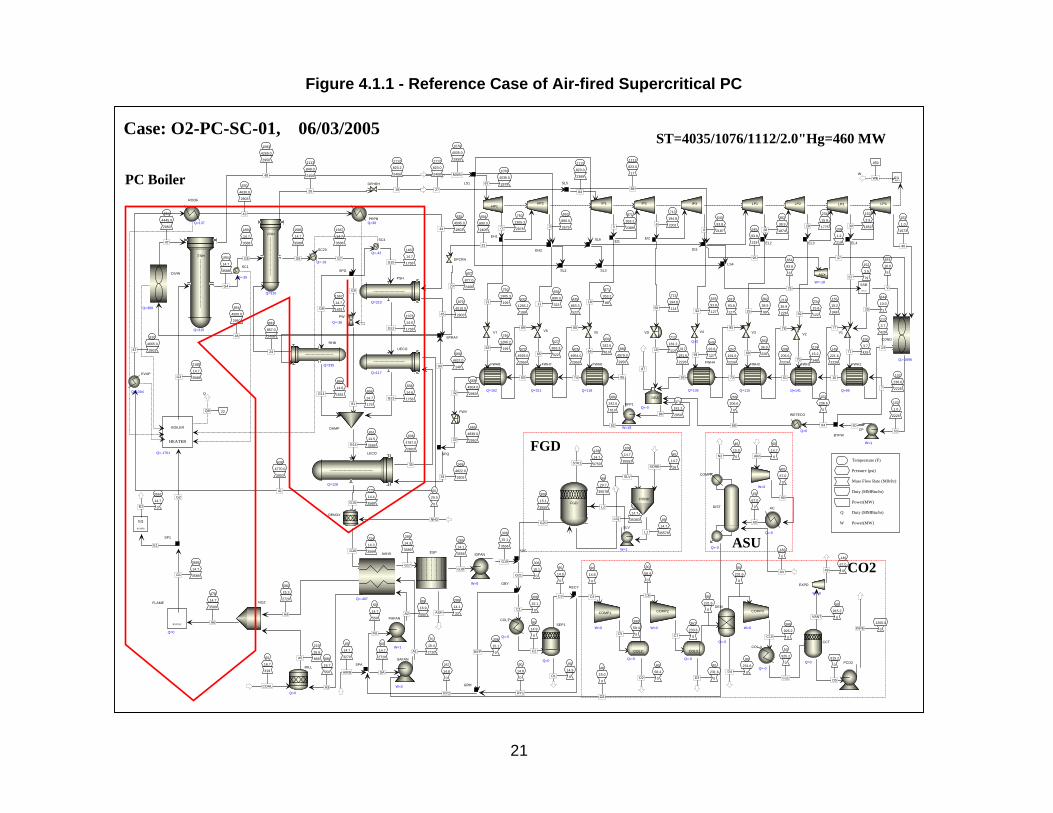
Figure 4.1.1 - Reference Case of Air-fired Supercritical PC
478
14.7
3589
A6
3685
14.7
3588G1
219
16.6
869A5
580
15.3
2720
A4
2185
14.7
3588G3
964
4445.0
2950
47
1904
14.7
3588
G4
1083
4269.0
2950
48
883
857.0
2406
24
1869
14.7
3588
G5
1585
14.7
3588
G6
1113
849.0
2406
26
1567
14.7
3588
G7
1567
14.7
1651G8
G9
1076
14.6
1758G12
606
4787.0
2803
35
838
14.6
1758G13
638
4770.0
2803
41
1487
14.7
1758G10
835
4595.0
280344
879
4510.0
280345
657
877.0
240623
864
14.6
1651G11 868
14.7
17981
851
14.5
3588G14
569
4822.0
280334
720
14.4
3588G15
60
14.7
550
PA
89
16.9
550A2
724
14.3
3589G16
70
15.4
2720A1
580
16.7
550
A3
289
14.3
3589
G17
60
20.0
0
NH3
289
14.1
3556
G18
289
14.1
33ASH
308
15.1
3556
G19
308
15.1
3555
G20
99
29.7
35578
L2
99
14.7
35578L1
109
14.7
3750STK1
109
14.7
35383LIQ
60
14.7
26SORB
100
14.7
35552
SLV
60
14.7
2720
SA46
15.0
0
O2
257
14.8
0
RY2
60
14.7
3270
AIRB
E1
G2
22QB
Q
60
16.7
319
COAL
308
15.1
0G21
308
15.1
0C1
90
14.9
0
C2
90
14.9
0
C3
90
14.9
0D1
90
14.8
0
C4
90
14.8
0
RY1
308
15.1
0BYP
60
14.7
0AIR
401
67.0
0
9060
67.0
0
A0
-183
0
AV
46
15.0
0N2
380
59.4
0C5
80
58.4
0
C6
367
233.6
0C7
80
231.6
0
368
926.2
0C10
80
231.6
0
80
231.6
0D4
80
58.4
0D2
80
231.6
0D3
50
925.2
0
C11
915.2
0
D5
1200.0
0PIPE
50
915.2
0VANT
-146
67.0
049
653
890.0
26793
1112
823.0
2389
84
871
353.2
23895
713
194.8
23016
540
93.8
21878
382
38.9
187428
234
15.8
177529
152
3.9
165230
102
1.0
1573
40
459
WEW
658
890.0
2406
22
658
890.0
32311
713
194.8
11456
1112
823.0
17
88
545
93.8
12792
545
93.8
219
96
382
38.9
9925
234
15.8
12259
152
3.9
7957
1076
4035.0
2950
MAIN 1076
4035.0
287867
644
10.0
5
9
112
3.7
429
14
108
1.2
219
17
102
1.0
2226
53
654
93.8
6
76
644
10.0
120
712
181.2
11415
871
353.2
8818
750
1305.3
19921
746
1266.2
19963
532
1266.2
199
89
527
863.3
52265
435
863.3
522
80
430
342.6
61066
267
93.8
127
95
262
36.9
22669
218
36.9
226
78
214
15.2
34870
155
15.2
348
77
150
3.7
42971
50
317
191.6
2226
93
269
206.6
0
68
396
342.6
610
52
374
181.2
295086
87
386
4979.0
2950
85 102
236.6
22267
145
221.6
2226
16
208
206.6
2226
61
257
191.6
2226
73
425
4954.0
2950
74
522
4929.0
2950
83569
4904.0
295032
3552
14.7
0E2
810
4665.0
280342
854
4500.0
2950
46
830
4630.0
2803
43
569
4839.0
295033
569
4822.0
14860
1112
823.2
2406
19
102
236.6
0
64
750
1305.3
287872
1112
823.0
2406
27
545
93.8
12794
RSTOIC
FLAME
Q=0
NOZ
FSH
Q=315
FRH
Q=310
SPG
UECO
Q=117
PSH
Q=210
RHB
Q=335
DAMP
LECO
Q=128
SC1
Q=-39
SC23
Q=-19
SC4
Q=-42
PWQ=-36
PAFAN
W=1
AAHX
Q=-407
DENOX
ESP IDFAN
W=5
PREC
SLV
W=1
FGDPOND
SAFAN
W=2
SPA
SP1
HEATER
BOILER
Q=-1751
MILL
Q=0
SPF
COL1
Q=-0
SEP1
Q=0
RECY
GRH
COMP
W=0
DIST
Q=-0
AC
Q=-0
COMP1
W=0
COMP2
W=0
GBY
COMP3
W=0
DEM
Q=-0
COL2
Q=-0
COL3
Q=-0
COL-4
Q=-0PCO2
EXPD
W=-0
CCT
Q=0
HP2 IP1 IP2 IP3 LP1 LP2 LP3 LP4
W MULTEG
EH2
EI2
EI3
EL2 EL3 EL4
LS1
COND
Q=-1696
FSPLIT
SSR
VD
EI1
SL3
V7 V6 V5 V3 V2 V1
CP
W=1
DEA
Q=-0BFP1
W=18
FWH1
Q=95
FWH2
Q=141
FWH3
Q=110
FWH6
Q=118
FWH7
Q=311
FWH8
Q=162
SL2
RGIBBS
EQ
EVAP
Q=1304
DIVW
Q=389
ROOF
Q=137PRPB
Q=36
FWV
SPQ
SPRAY
DPHRH
DPCRH
BYFW
WETECO
Q=0
HP1
EH1SL6
SL5
FWH4
Q=135
V4
Q=0
AUX
W=-18
LS4
Temperature (F)
Pressure (psi)
Mass Flow Rate (Mlb/hr)
Duty (MMBtu/hr)
Power(MW)
Q Duty (MMBtu/hr)
W Power(MW)
ST=4035/1076/1112/2.0"Hg=460 MWCase: O2-PC-SC-01, 06/03/2005
FGD
PC Boiler
ASU
CO2
21

4.1.3 Oxygen-Based PC Plant – Base Case
4.1.3.1 Boiler Plant Modifications The oxygen-based (or oxygen-fired) plant model contains essentially all the components in the conventional plant model. In addition, it also includes an air separation unit (ASU) and a flue gas cooler. In the O2-fired plant, the FGD is not needed because the SO2 is acid gas similar to CO2 and can thus be sent to pipeline together with the CO2. A substantial portion of the SOx will be removed as the flue gas is cooled down in the CO2 cooling and compression equipment. The steam side components remain very similar to the air-fired case with only some changes in heat bundle duties in the heat recover area (HRA). In O2-fired cases, flue gas is recycled to control the flame temperature inside the PC-fired boiler to minimize NOx formation, minimize ash slagging in the furnace combustion zone, and avoid the application of exotic materials. Before the flue gas is separated into a recycled and effluent stream (to the pipeline), it is cooled to 90ºF. Since this is below the acid/moisture dew point, a heat exchanger containing acid-resistant materials must be used. The recycled gas is then reheated, before the forced draft (FD) fan, by mixing it with a bypassed hot gas to avoid reaching the dew point. After the O2 from ASU plant is mixed with recycled flue gas, it is heated by the flue gas exiting the boiler in a gas-gas heat exchanger, which acts as a recuperator to improve cycle efficiency and reduce fan power requirements. It is assumed in this study that there is no tramp air ingress through the sealed boiler.
4.1.3.2 Air Separation Unit For an O2-fired PC, O2 purity is a key parameter for system performance and economics. A high purity O2 will produce a high purity of product CO2 gas, which will reduce CO2 purification and compression power. However, producing high purity O2 requires high ASU plant operational and equipment costs. Furthermore, too high O2 purity is not necessary because the fuel combustion itself will generate some gases, such as N2 and some excess O2 is required for complete combustion, in additional to CO2 as flue gas. Therefore there is a balance point to give an optimum. The method of air separation chosen for this study is the commercially available large-scale cryogenic air separation technique. A traditional cryogenic ASU plant was simplified in the simulation to include the power consumption, but without details of distillation columns and cold heat exchangers. The Aspen model does not include the air purifier, which removes moisture, hydrocarbons, CO2, and NOx in an adsorber and is located between the cold box and air compressor.
22

Although the separated N2/Ar gases could potentially be sold as byproducts, no economic credit for this is taken in this study. No heat recovery from the ASU air compressor inter-stage coolers is included, because recovery of this low grade heat is inefficient. Power consumption for different O2 purity is plotted in Figure 4.1.2. For the O2 purity of 99.5% used in this study, a power consumption of 24.5 kWh/klbair is applied. For a 460 MWe steam turbine generation, the ASU plant consumes about 70 MWe, or 15% of generated power, which is a large penalty for CO2 removal.
Figure 4.1.2 – Oxygen purity effect on ASU specific power
Power Demand vs Oxygen Purity
0.150.160.170.18
0.190.200.210.220.230.240.250.260.270.280.290.30
70 75 80 85 90 95 100
Oxygen Purity, %v
Pow
er, k
Wh/
kgO
2
Advanced air separation methods such as high temperature membrane method will be incorporated into the cycle in task 2 (Section 4.2) to reduce both operation and capital costs.
23

4.1.3.3 CO2 Compression Unit The flue gas effluent stream (mainly CO2) has to be compressed to the high pipeline pressure of 1200 to 3000 psia depending upon end user specification. The CO2 sequestration equipment is added to the system and the effluent is conservatively compressed to 3000 psia. The dominant moisture in flue gas is condensed out first during flue gas cooling before the first stage compression. The condensed water contains acid gases and has to be treated before recycle or discharge. The flue gas composition after cooling but before the first stage CO2 compressor from this base case (case-2) is:
CO2 O2 N2+Ar SOx H2O 90.4 3.3 1.3 1.1 3.6
In literature, residual O2 as low as 1.3% was used. Reducing O2 content, such as from 3.0% to 2.0% by reducing excess air, is helpful in reducing CO2 compression power, but it is judged that and oxygen content of approximately 3.0% is required for good combustion efficiency. Both CO2 and SOX are acid gases. They combine with moisture to form acid, which causes a corrosion problem along CO2 pipeline. Therefore, after the 2nd stage, a chemical method of active dehydration with TEG (Triethyleneglycol) is applied to remove the rest of moisture to a very low level of less than 50 ppm, where the TEG can be regenerated by heating. In the model, the TEG dehydration was simulated, but the TEG itself was not simulated. A four-stage compression with inter-stage cooling was applied. To reduce power, an equal compression pressure ratio of approximately 4.0 was applied.
4.1.3.4 O2-fired PC: Base Case (case-2) Figure 4.1.4 presents the base case system model. The key parameter for the base case is that the adiabatic temperature in the boiler was kept the same as the reference air case (at about 3690ºF) by adjusting the recycle gas flow. Both fuel and air feed rates were iterated to match the heat duty and 3.0%v exit O2 level. Compared to reference air-fired case, the case 2 air flow rate is reduced by 13.4% (from 3270 klb/hr to 2832 klb/hr), O2 concentration to the boiler is 28.3% (compared to 20.7% for the air-fired case) yielding an increased combustion efficiency and a lower UBC (unburned carbon). The relation of UBC and O2% has been included in modeling as shown by Figure 4.1.3 (based on FW-FIRE modeling results).
24
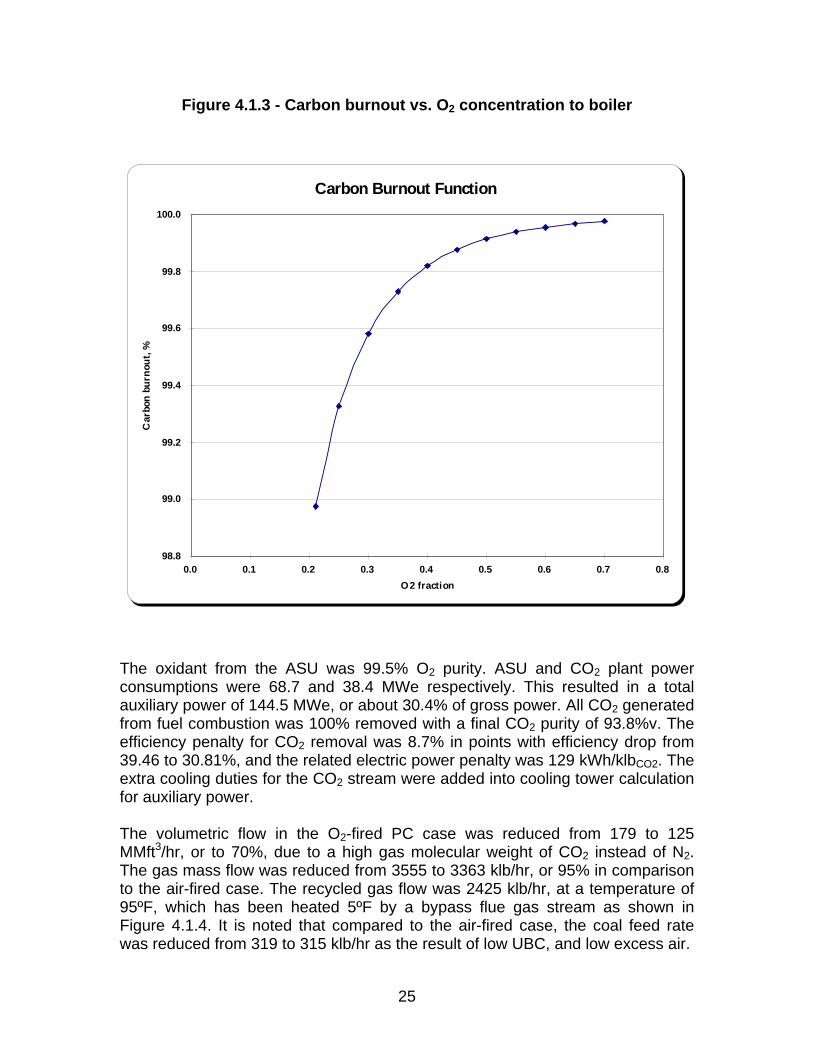
Figure 4.1.3 - Carbon burnout vs. O2 concentration to boiler
Carbon Burnout Function
98.8
99.0
99.2
99.4
99.6
99.8
100.0
0.0 0.1 0.2 0.3 0.4 0.5 0.6 0.7 0.8O2 fraction
Car
bon
burn
out,
%
The oxidant from the ASU was 99.5% O2 purity. ASU and CO2 plant power consumptions were 68.7 and 38.4 MWe respectively. This resulted in a total auxiliary power of 144.5 MWe, or about 30.4% of gross power. All CO2 generated from fuel combustion was 100% removed with a final CO2 purity of 93.8%v. The efficiency penalty for CO2 removal was 8.7% in points with efficiency drop from 39.46 to 30.81%, and the related electric power penalty was 129 kWh/klbCO2. The extra cooling duties for the CO2 stream were added into cooling tower calculation for auxiliary power. The volumetric flow in the O2-fired PC case was reduced from 179 to 125 MMft3/hr, or to 70%, due to a high gas molecular weight of CO2 instead of N2. The gas mass flow was reduced from 3555 to 3363 klb/hr, or 95% in comparison to the air-fired case. The recycled gas flow was 2425 klb/hr, at a temperature of 95ºF, which has been heated 5ºF by a bypass flue gas stream as shown in Figure 4.1.4. It is noted that compared to the air-fired case, the coal feed rate was reduced from 319 to 315 klb/hr as the result of low UBC, and low excess air.
25

Because of high CO2 content in flue gas at high flame temperature, part of CO2 dissociated and more CO slipped, the equilibrium flame temperature differed from adiabatic temperature.
26

Figure 4.1.4 - Base case of O2-fired supercritical PC
473
14.7
3395
A6
3690
14.7
3394G1
217
16.6
865A5
580
15.3
2530
A4
2185
14.7
3394G3
964
4445.0
2950
47
1902
14.7
3394
G4
1083
4269.0
2950
48
882
857.0
2406
24
1867
14.7
3394
G5
1580
14.7
3394
G6
1113
849.0
2406
26
1562
14.7
3394
G7
1562
14.7
1561G8
G9
1065
14.6
1663G12
608
4787.0
2803
35
838
14.6
1663G13
637
4770.0
2803
41
1482
14.7
1663G10
835
4595.0
280344
879
4510.0
280345
657
877.0
240623
848
14.6
1561G11 849
14.7
17081
843
14.5
3394G14
569
4822.0
280334
700
14.4
3394G15
95
14.7
550
PA
119
16.9
550A2
700
14.3
3394G16
90
15.4
2530A1
580
16.7
550
A3
302
14.3
3394
G17
60
20.0
0
NH3
302
14.1
3363
G18
302
14.1
32ASH
317
15.1
3363
G19
317
15.1
0
G20
97
29.7
0
L2
98
14.7
0L1
120
14.7
0STK1
120
14.7
0LIQ
60
14.7
0SORB
100
14.7
0
SLV
95
14.7
1875
SA46
15.0
655
O2
95
14.8
2425
RY2
60
14.7
0
AIRB
E1
G2
23QB
Q
60
16.7
315
COAL
317
15.1
3363G21
317
15.1
3312C1
90
14.9
3312
C2
90
14.9
3163
C3
90
14.9
150D1
90
14.8
788
C4
90
14.8
2375
RY1
317
15.1
50BYP
60
14.7
2832AIR
400
67.0
2832
9060
67.0
2832
A0
-183
0AV
46
15.0
2177N2
310
59.4
788C5
90
58.4
779
C6
313
233.6
779C7
90
231.6
776
323
926.2
776C10
90
231.6
777
90
231.6
1D4
90
58.4
9D2
90
231.6
2D3
90
916.2
776
12
281
3000.0
776
PIPE
916.2
0D5
653
890.0
26793
1112
823.0
2389
84
871
353.2
23895
713
194.8
23016
540
93.8
21878
382
38.9
187428
234
15.8
177529
152
3.9
165230
102
1.0
1573
40
459
WEW
658
890.0
2406
22
658
890.0
32311
713
194.8
11456
1112
823.0
17
88
545
93.8
12792
545
93.8
219
96
382
38.9
9925
234
15.8
12259
152
3.9
7957
1076
4035.0
2950
MAIN 1076
4035.0
287867
644
10.0
5
9
112
3.7
429
14
108
1.2
219
17
102
1.0
2226
53
654
93.8
6
76
644
10.0
120
712
181.2
11415
871
353.2
8818
750
1305.3
19921
746
1266.2
19963
532
1266.2
199
89
527
863.3
52265
435
863.3
522
80
430
342.6
61066
267
93.8
127
95
262
36.9
22669
218
36.9
226
78
214
15.2
34870
155
15.2
348
77
150
3.7
42971
50
317
191.6
2226
93
269
206.6
0
68
396
342.6
610
52
374
181.2
295086
87
386
4979.0
2950
85 102
236.6
22267
145
221.6
2226
16
208
206.6
2226
61
257
191.6
2226
73
425
4954.0
2950
74
522
4929.0
2950
83569
4904.0
295032
3481
14.7
0E2
810
4665.0
280342
854
4500.0
2950
46
830
4630.0
2803
43
569
4839.0
295033
569
4822.0
14860
1112
823.2
2406
19
102
236.6
0
64
750
1305.3
287872
1112
823.0
2406
27
545
93.8
12794
RSTOIC
FLAME
Q=0
NOZ
FSH
Q=315
FRH
Q=311
SPG
UECO
Q=109
PSH
Q=210
RHB
Q=333
DAMP
LECO
Q=135
SC1
Q=-39
SC23
Q=-19
SC4
Q=-42
PWQ=-36
PAFAN
W=1
AAHX
Q=-348
DENOX
ESP IDFAN
W=4
PREC
SLV
W=0
FGDPOND
SAFAN
W=1
SPA
SP1
HEATER
BOILER
Q=-1755
MILL
Q=0
SPF
COL1
Q=-341
SEP1
Q=0
RECY
GRH
COMP
W=69
DIST
Q=-3
AC
Q=-250
COMP1
W=11
COMP2
W=11
GBY
COMP3
W=10
DEM
Q=-1
COL2
Q=-49
COL3
Q=-43
COMP4
W=7
COL4
Q=-55
HP2 IP1 IP2 IP3 LP1 LP2 LP3 LP4
W MULTEG
EH2
EI2
EI3
EL2 EL3 EL4
LS1
COND
Q=-1696
FSPLIT
SSR
VD
EI1
SL3
V7 V6 V5 V3 V2 V1
CP
W=1
DEA
Q=-0BFP1
W=18
FWH1
Q=95
FWH2
Q=141
FWH3
Q=110
FWH6
Q=118
FWH7
Q=311
FWH8
Q=162
SL2
RGIBBS
EQ
EVAP
Q=1306
DIVW
Q=389
ROOF
Q=137PRPB
Q=36
FWV
SPQ
SPRAY
DPHRH
DPCRH
BYFW
WETECO
Q=0
HP1
EH1SL6
SL5
FWH4
Q=135
V4
Q=0
AUX
W=-18
LS4
Temperature (F)
Pressure (psi)
Mass Flow Rate (Mlb/hr)
Duty (MMBtu/hr)
Power(MW)
Q Duty (MMBtu/hr)
W Power(MW)
ST=4035/1076/1112/2.0"Hg=460 MWCase: O2-PC-SC-02, 06/03/2005
FGD
PC Boiler
ASU
CO2
27
4.1.4 Parametric Cases Various cases were simulated to evaluate the effects on O2-PC performance of different designs and operating conditions, as shown by Table 4.1.3, in which the red highlight shows the key parameter changed in comparing with previous cases. All these cases, including part load cases (100% to 25%), will be explained and discussed in details in the following sections. In Table 4.1.3, the efficiency drop was directly calculated from the difference between cases with and without CO2 removal. But in general, the specific power penalty for the CO2 removal cannot be calculated by difference directly, because extra power may be produced by firing more when integrated with different O2 separation techniques. In some cases, the extra power by added firing may be greater than the power required for CO2 removal. Therefore a new definition, here, is introduced as
kWh/lbCO2 = (eff drop)*(power/efficiency)air /lbCO2 (1) Equation (1) is the way to compare penalty for CO2 removal for different systems without cost estimation, especially for a complex system such as O2-PC integrated with a high temperature oxygen separation membrane method, where even more net power is produced from with CO2 removal than without.
28

Table 4.1.3 - Case Summary
case 01 02 03 04 05 06 07 08 09 10 p100 p72 p50 p25 6A 6B 9A 9BWaste heat economizer no no no no no no no yes
arall seriesyes yes
-
138 26027.8 41.1
3690 4010 4321 51783481 3669 3830 4182
2450 2185 2450666 603 5910.30 0.30
2000718
yes yes yes yes yes yes no no yes yesHRA Arrangement parallel parallel parallel parallel parallel parallel parallel p el parallel parallel series series series series series series seriesCO2 Condensation - no yes yes yes yes yes yes yes yes yes yes yes yes yes yesVent Gas Recycle - - no no no no no no no no no no no no no no noCoal flow klb/hr 319.0 315.0 315.0 312.0 310.7 309.4 308.0 308.0 308.0 308.0 308.0 229.4 168.0 98.4 309.4 309.4 308.0 308.0Oxidant flow klb/hr 3270 655 655 649 647 645 644 644 644 644 644 480 350 206 645 645 644 644Air flow klb/hr 3270 2832 2832 2806 2798 2790 2784 2784 2784 2784 2784 2074 1513 889 2790 2790 2784 2784O2 purity % - 99.5 99.5 99.5 99.5 99.5 99.5 99.5 99.5 99.5 99.5 99.5 99.5 99.5 99.5 99.5 99.5 99.5
klb/hr 0 2425 2425 2429 2046 1751 1162 1162 1166 1166 1166 1151 1072 697 1751 1751 1166 1166% 0.0 72.1 72.1 72.4 68.8 65.5 55.8 55.8 55.9 55.9 55.9 62.7 68.2 70.3 65.5 65.5 55.9 55.9
Recycle gas temperature F - 95 95 142 146 163 163 260 259 225 205 206 146 146 260 259Boiler Inlet O2 %, v 20.7 28.3 28.3 30.8 33.8 42.2 42.2 41.1 41.1 35.5 30.9 29.1 33.8 33.8 41.1 41.1Boiler Outlet O2 %, v 3.0 3.0 3.0 3.0 3.0 3.0 3.0 3.0 3.0 3.0 3.0 3.0 3.0 3.0 3.0 3.0 3.0 3.0
MM cf/hr 179 125 125 126 109 96 75 75 77 77 75 61 49 26 96 96 77 75klb/hr 3555 3363 3363 3357 2972 2675 2083 2083 2087 2087 2087 1837 1572 991 2675 2675 2087 2087
Adiabatic Temperature F 3685 3690 3678 5178 5104 5104 5104 4509 4001 3723 4321 4321 5104 5104Equilibrium Temperature F 3552 3481 3474 4182 4161 4161 4161 3919 3672 3514 3830 3830 4161 4161Gas Temp. to FSH F 2185 2185 2185 2185 2185 2185 2185 2185 2185 2185 2450 2146 1918 1458 2450Water temp. to evap. F 638 638 638 638 615 597 592 592 596 596 593 574 553 495 594UBC % 1.00 0.49 0.49 0.51 0.39 0.30 0.15 0.15 0.16 0.16 0.16 0.27 0.37 0.43 0.16 0.16Boiler Efficiency % 88.16 89.28 89.28 90.14 90.52 90.90 91.31 91.31 91.31 91.31 91.31 - - - 90.90 90.90 91.31 91.31Pipeline pressure psia 0 3000 3000 3000 3000 3000 3000 3000 3000 3000 3000 3000 3000 3000 3000 3000 3000Generated CO2 flow klb/hr 739 732 732 725 723 720 718 718 718 718 535 391 230 720 720 718 718CO2 purity %,v wet 14.0 81.3 81.3 80.0 78.7 77.5 74.2 74.2 71.3 74.2 71.3 73.9 76.2 77 77.5 77.5 71.3 71.3Removed CO2 flow klb/hr 0 732 732 725 723 720 718 718 718 718 718 535 391 230 720 720 718 718CO2 removal efficiency % 0 100 100 100 100 100 100 100 100 100 100 100 100 100 100 100 100 100CO2 purity % - 93.8 93.8 93.8 93.7 93.7 93.6 93.6 93.6 93.6 93.6 93.5 93.7 93.6 93.7 93.7 93.6 93.6Gross Power MW 476.2 476.2 476.2 476.2 476.2 476.2 476.2 483.1 486.4 486.4 486.5 349.0 239.2 119.3 476.2 476.2 486.4 486.5Auxiliary Power MW 46.0 37.4 37.6 37.6 37.1 36.6 36.9 37.5 38.1 38.1 37.7 26.1 16.5 7.2 36.6 36.6 38.1 37.7ASU power MW 0.0 68.7 68.7 68.1 67.9 67.7 67.6 67.6 67.6 67.6 67.6 50.3 36.7 21.6 67.7 67.7 67.6 67.6CO2 compression power MW 0.0 38.4 34.7 34.4 34.3 34.2 34.2 34.2 34.2 32.9 34.2 25.5 18.6 10.9 34.2 34.2 34.2 34.2Net Power MW 430.2 331.7 335.2 336.1 336.9 337.7 337.5 343.9 346.6 347.9 347.0 247.1 167.4 79.6 337.7 337.7 346.6 347.0Net Efficiency % 39.46 30.81 31.14 31.53 31.73 31.94 32.07 32.67 32.93 33.05 32.97 31.52 29.16 23.67 31.94 31.94 32.93 32.97Efficiency Drop % pts. - 8.7 8.3 7.9 7.7 7.5 7.4 6.8 6.5 6.4 6.5 7.9 10.3 15.8 7.5 7.5 6.5 6.5CO2 removal energy kWh/klbCO2 - 129 124 119 117 114 112 103 99 97 99 0 0 0 114 114 99 99
Recycle gas flow
Boiler outlet flue gas flow
29

4.1.4.1 O2-fired PC with Liquid CO2 Pump (case-3) Case-3, as shown in Figure 4.1.5, was formed from case-2 by adding the CO2 condensing process into CO2 plant. The CO2 gas is compressed first by a three-stage compressor to over 900 psia, and then is cooled down by cooling water to its dew point. Most of the CO2 is condensed out as liquid, some of the CO2 stays in gas by equilibrium partial pressure, where the gas dew point reduces from 76 to 55ºF during condensation. Both the gas stream and the liquid stream from the condenser are boosted to the pipeline pressure by a small gas compressor and a liquid pump, respectively. Thus a potentially large gas compressor is replaced by a small compressor and a liquid pump. The gas stream is cooled down to nearly same temperature as the liquid, and then mixed with the liquid CO2 stream. The final CO2 stream therefore consists of the same liquid compositions as that of the case-2.
In this way, the last stage of compression is accomplished by liquid pumping. The power saving is about 3.7 MWe, or 1.1% to the net power, while the efficiency increases from 30.81 to 31.14%. The electric power penalty is reduced from 129 in case-2 to 124 kWh/klbCO2 in case-3. Because of this power saving, this option will be applied to most of CO2 compression processes for the other cases.
30

Figure 4.1.5 - O2-fired supercritical PC with liquid CO2 pump (Case-3)
473
14.7
3395
A6
3690
14.7
3394G1
217
16.6
865A5
580
15.3
2530
A4
2185
14.7
3394G3
964
4445.0
2950
47
1902
14.7
3394
G4
1083
4269.0
2950
48
882
857.0
2406
24
1867
14.7
3394
G5
1580
14.7
3394
G6
1113
849.0
2406
26
1562
14.7
3394
G7
1562
14.7
1561G8
G9
1065
14.6
1663G12
608
4787.0
2803
35
838
14.6
1663G13
637
4770.0
2803
41
1482
14.7
1663G10
835
4595.0
280344
879
4510.0
280345
657
877.0
240623
848
14.6
1561G11 849
14.7
17081
843
14.5
3394G14
569
4822.0
280334
700
14.4
3394G15
95
14.7
550
PA
119
16.9
550A2
700
14.3
3394G16
90
15.4
2530A1
580
16.7
550
A3
302
14.3
3394
G17
60
20.0
0
NH3
302
14.1
3363
G18
302
14.1
32ASH
317
15.1
3363
G19
317
15.1
0
G20
97
29.7
0
L2
98
14.7
0L1
120
14.7
0STK1
120
14.7
0LIQ
60
14.7
0SORB
100
14.7
0
SLV
95
14.7
1875
SA 46
15.0
655
O2
95
14.8
2425
RY2
60
14.7
0
AIRB
E1
G2
23QB
Q
60
16.7
315
COAL
317
15.1
3363G21
317
15.1
3312C1
90
14.9
3312
C2
90
14.9
3163
C3
90
14.9
150D1
90
14.8
788
C4
90
14.8
2375
RY1
317
15.1
50BYP
60
14.7
2832AIR
400
67.0
2832
9060
67.0
2832
A0
-183
0AV
46
15.0
2177N2
310
59.4
788C5
90
58.4
779
C6
313
233.6
779C7
90
231.6
776
C9
323
926.2
776C10
90
231.6
777
C8
90
231.6
1D4
90
58.4
9D2
90
231.6
2D3
55
916.2
20
C11
236
3000.0
20
PIPEG
55
916.2
755
D5
97
3000.0
755
PIPEL
653
890.0
26793
1112
823.0
2389
84
871
353.2
23895
713
194.8
23016
540
93.8
21878
382
38.9
187428
234
15.8
177529
152
3.9
165230
102
1.0
1573
40
459
WEW
658
890.0
2406
22
658
890.0
32311
713
194.8
11456
1112
823.0
17
88
545
93.8
12792
545
93.8
219
96
382
38.9
9925
234
15.8
12259
152
3.9
7957
1076
4035.0
2950
MAIN 1076
4035.0
287867
644
10.0
5
9
112
3.7
429
14
108
1.2
219
17
102
1.0
2226
53
654
93.8
6
76
644
10.0
120
712
181.2
11415
871
353.2
8818
750
1305.3
19921
746
1266.2
19963
532
1266.2
199
89
527
863.3
52265
435
863.3
522
80
430
342.6
61066
267
93.8
127
95
262
36.9
22669
218
36.9
226
78
214
15.2
34870
155
15.2
348
77
150
3.7
42971
50
317
191.6
2226
93
269
206.6
0
68
396
342.6
610
52
374
181.2
295086
87
386
4979.0
2950
85 102
236.6
22267
145
221.6
2226
16
208
206.6
2226
61
257
191.6
2226
73
425
4954.0
2950
74
522
4929.0
2950
83569
4904.0
295032
3481
14.7
0E2
810
4665.0
280342
854
4500.0
2950
46
830
4630.0
2803
43
569
4839.0
295033
569
4822.0
14860
1112
823.2
2406
19
102
236.6
0
64
750
1305.3
287872
1112
823.0
2406
27
545
93.8
12794
RSTOIC
FLAME
Q=0
NOZ
FSH
Q=315
FRH
Q=311
SPG
UECO
Q=109
PSH
Q=210
RHB
Q=333
DAMP
LECO
Q=135
SC1
Q=-39
SC23
Q=-19
SC4
Q=-42
PWQ=-36
PAFAN
W=1
AAHX
DENOX
ESP IDFAN
W=4
PREC
SLV
W=0
FGDPOND
SAFAN
W=1
SPA
SP1
HEATER
BOILER
Q=-1755
MILL
Q=0
SPF
COL1
Q=-341
SEP1
Q=0
RECY
GRH
COMP
W=69
DIST
Q=-3
AC
Q=-250
COMP1
W=11
COMP2
W=11
GBY
COMP3
W=10
DEM
Q=-1
COL2
Q=-49
COL3
Q=-43
COMP4
W=0
COL4
Q=-115
CPUMP
W=3
HP2 IP1 IP2 IP3 LP1 LP2 LP3 LP4
W MULTEG
EH2
EI2
EI3
EL2 EL3 EL4
LS1
COND
Q=-1696
FSPLIT
SSR
VD
EI1
SL3
V7 V6 V5 V3 V2 V1
CP
W=1
DEA
Q=-0BFP1
W=18
FWH1
Q=95
FWH2
Q=141
FWH3
Q=110
FWH6
Q=118
FWH7
Q=311
FWH8
Q=162
SL2
RGIBBS
EQ
EVAP
Q=1306
DIVW
Q=389
ROOF
Q=137PRPB
Q=36
FWV
SPQ
SPRAY
DPHRH
DPCRH
BYFW
WETECO
Q=0
HP1
EH1SL6
SL5
FWH4
Q=135
V4
Q=0
AUX
W=-18
LS4
Temperature (F)
Pressure (psi)
Mass Flow Rate (Mlb/hr)
Duty (MMBtu/hr)
Power(MW)
Q Duty (MMBtu/hr)
W Power(MW)
ST=4035/1076/1112/2.0"Hg=460 MWCase: O2-PC-SC-03, 06/03/2005
FGD
PC Boiler
ASU
CO2
31
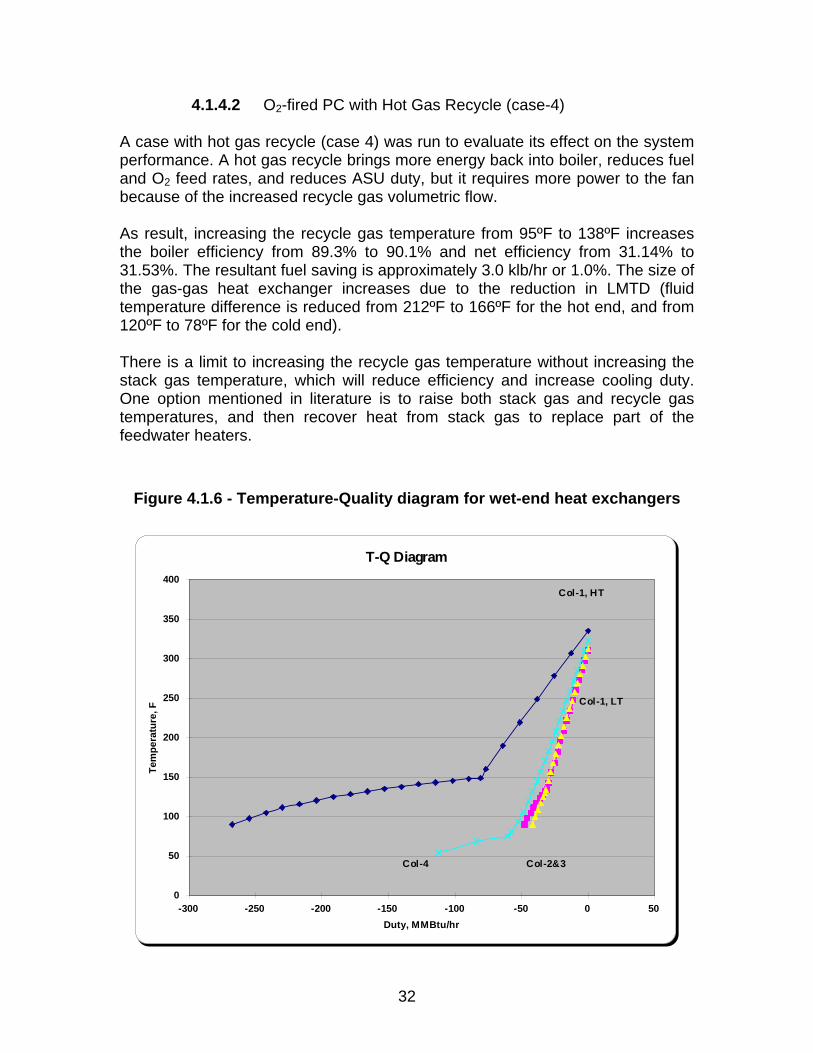
4.1.4.2 O2-fired PC with Hot Gas Recycle (case-4) A case with hot gas recycle (case 4) was run to evaluate its effect on the system performance. A hot gas recycle brings more energy back into boiler, reduces fuel and O2 feed rates, and reduces ASU duty, but it requires more power to the fan because of the increased recycle gas volumetric flow. As result, increasing the recycle gas temperature from 95ºF to 138ºF increases the boiler efficiency from 89.3% to 90.1% and net efficiency from 31.14% to 31.53%. The resultant fuel saving is approximately 3.0 klb/hr or 1.0%. The size of the gas-gas heat exchanger increases due to the reduction in LMTD (fluid temperature difference is reduced from 212ºF to 166ºF for the hot end, and from 120ºF to 78ºF for the cold end). There is a limit to increasing the recycle gas temperature without increasing the stack gas temperature, which will reduce efficiency and increase cooling duty. One option mentioned in literature is to raise both stack gas and recycle gas temperatures, and then recover heat from stack gas to replace part of the feedwater heaters.
Figure 4.1.6 - Temperature-Quality diagram for wet-end heat exchangers
T-Q Diagram
0
50
100
150
200
250
300
350
400
-300 -250 -200 -150 -100 -50 0 50Duty, MMBtu/hr
Tem
pera
ture
, F
Col-1, LT
Col-4 Col-2&3
Col-1, HT
32
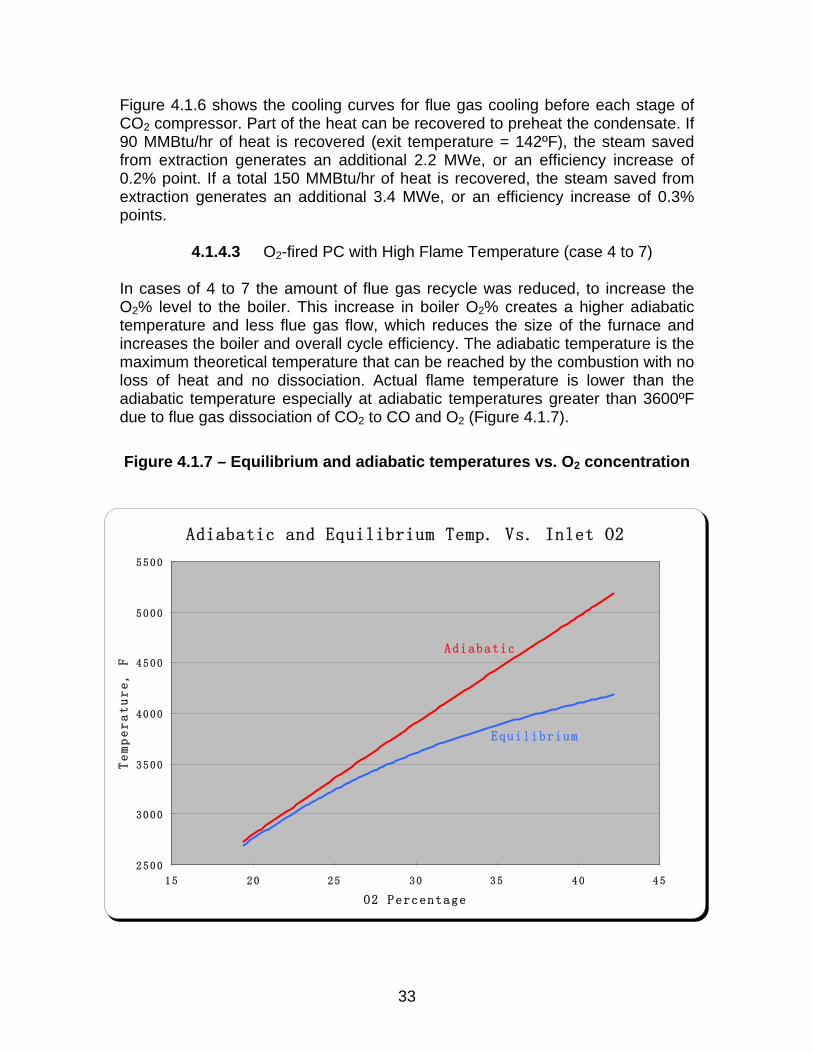
Figure 4.1.6 shows the cooling curves for flue gas cooling before each stage of CO2 compressor. Part of the heat can be recovered to preheat the condensate. If 90 MMBtu/hr of heat is recovered (exit temperature = 142ºF), the steam saved from extraction generates an additional 2.2 MWe, or an efficiency increase of 0.2% point. If a total 150 MMBtu/hr of heat is recovered, the steam saved from extraction generates an additional 3.4 MWe, or an efficiency increase of 0.3% points.
4.1.4.3 O2-fired PC with High Flame Temperature (case 4 to 7) In cases of 4 to 7 the amount of flue gas recycle was reduced, to increase the O2% level to the boiler. This increase in boiler O2% creates a higher adiabatic temperature and less flue gas flow, which reduces the size of the furnace and increases the boiler and overall cycle efficiency. The adiabatic temperature is the maximum theoretical temperature that can be reached by the combustion with no loss of heat and no dissociation. Actual flame temperature is lower than the adiabatic temperature especially at adiabatic temperatures greater than 3600ºF due to flue gas dissociation of CO2 to CO and O2 (Figure 4.1.7). Figure 4.1.7 – Equilibrium and adiabatic temperatures vs. O2 concentration
Adiabatic and Equilibrium Temp. Vs. Inlet O2
2500
3000
3500
4000
4500
5000
5500
15 20 25 30 35 40 45
O2 Percentage
Temperature, F
A diabatic
Equilibrium
33
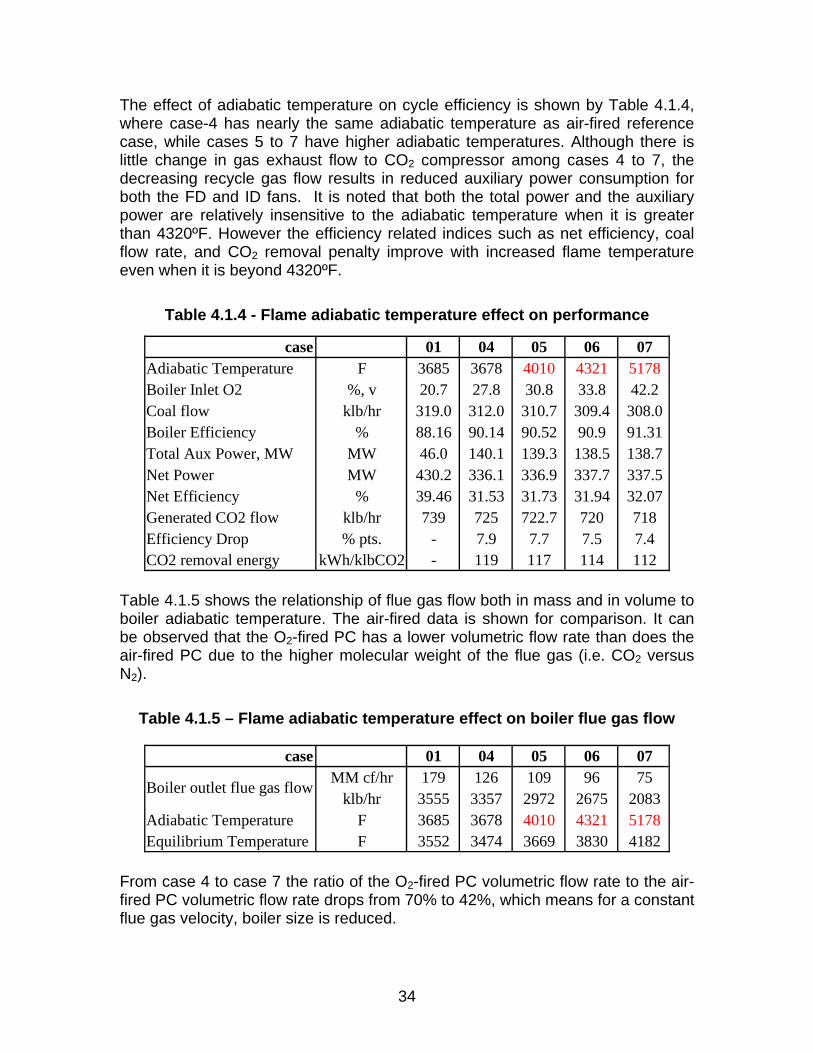
The effect of adiabatic temperature on cycle efficiency is shown by Table 4.1.4, where case-4 has nearly the same adiabatic temperature as air-fired reference case, while cases 5 to 7 have higher adiabatic temperatures. Although there is little change in gas exhaust flow to CO2 compressor among cases 4 to 7, the decreasing recycle gas flow results in reduced auxiliary power consumption for both the FD and ID fans. It is noted that both the total power and the auxiliary power are relatively insensitive to the adiabatic temperature when it is greater than 4320ºF. However the efficiency related indices such as net efficiency, coal flow rate, and CO2 removal penalty improve with increased flame temperature even when it is beyond 4320ºF.
Table 4.1.4 - Flame adiabatic temperature effect on performance
case 01 04 05 06 07Adiabatic Temperature F 3685 3678 4010 4321 5178Boiler Inlet O2 %, v 20.7 27.8 30.8 33.8 42.2Coal flow klb/hr 319.0 312.0 310.7 309.4 308.0Boiler Efficiency % 88.16 90.14 90.52 90.9 91.31Total Aux Power, MW MW 46.0 140.1 139.3 138.5 138.7Net Power MW 430.2 336.1 336.9 337.7 337.5Net Efficiency % 39.46 31.53 31.73 31.94 32.07Generated CO2 flow klb/hr 739 725 722.7 720 718Efficiency Drop % pts. - 7.9 7.7 7.5 7.4CO2 removal energy kWh/klbCO2 - 119 117 114 112
Table 4.1.5 shows the relationship of flue gas flow both in mass and in volume to boiler adiabatic temperature. The air-fired data is shown for comparison. It can be observed that the O2-fired PC has a lower volumetric flow rate than does the air-fired PC due to the higher molecular weight of the flue gas (i.e. CO2 versus N2).
Table 4.1.5 – Flame adiabatic temperature effect on boiler flue gas flow
case 01 04 05 06 07MM cf/hr 179 126 109 96 75
klb/hr 3555 3357 2972 2675 2083Adiabatic Temperature F 3685 3678 4010 4321 5178Equilibrium Temperature F 3552 3474 3669 3830 4182
Boiler outlet flue gas flow
From case 4 to case 7 the ratio of the O2-fired PC volumetric flow rate to the air-fired PC volumetric flow rate drops from 70% to 42%, which means for a constant flue gas velocity, boiler size is reduced.
34
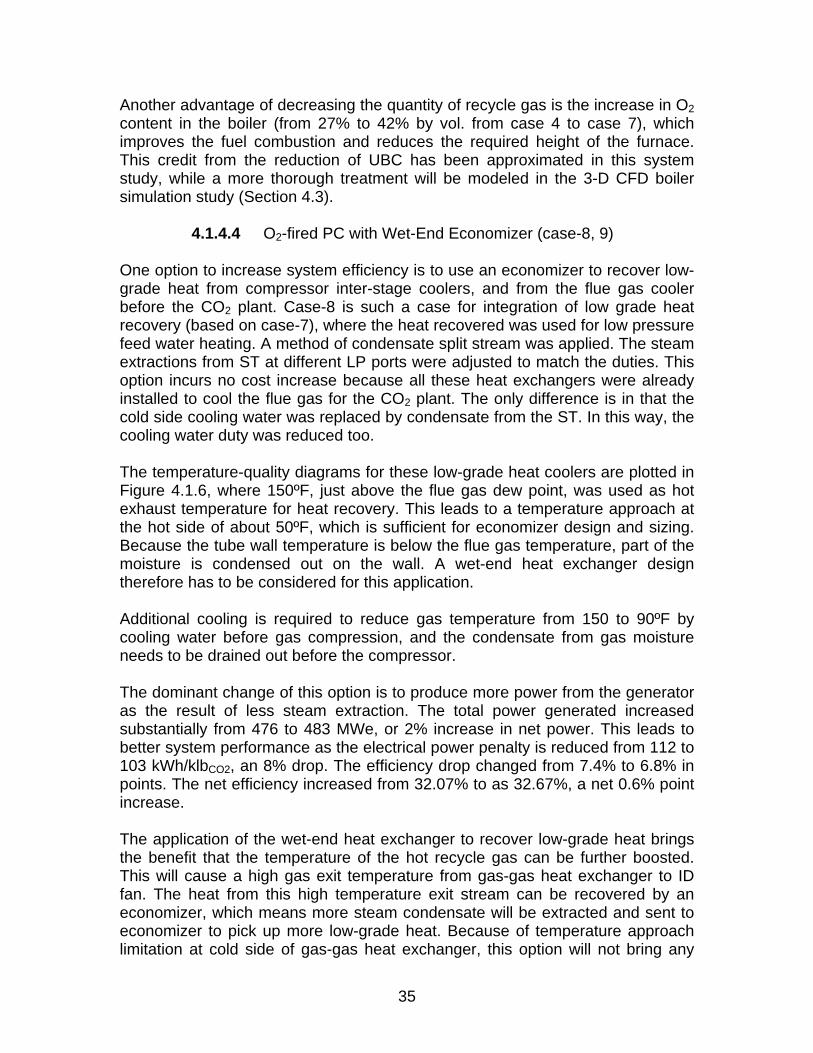
Another advantage of decreasing the quantity of recycle gas is the increase in O2 content in the boiler (from 27% to 42% by vol. from case 4 to case 7), which improves the fuel combustion and reduces the required height of the furnace. This credit from the reduction of UBC has been approximated in this system study, while a more thorough treatment will be modeled in the 3-D CFD boiler simulation study (Section 4.3).
4.1.4.4 O2-fired PC with Wet-End Economizer (case-8, 9) One option to increase system efficiency is to use an economizer to recover low- grade heat from compressor inter-stage coolers, and from the flue gas cooler before the CO2 plant. Case-8 is such a case for integration of low grade heat recovery (based on case-7), where the heat recovered was used for low pressure feed water heating. A method of condensate split stream was applied. The steam extractions from ST at different LP ports were adjusted to match the duties. This option incurs no cost increase because all these heat exchangers were already installed to cool the flue gas for the CO2 plant. The only difference is in that the cold side cooling water was replaced by condensate from the ST. In this way, the cooling water duty was reduced too.
The temperature-quality diagrams for these low-grade heat coolers are plotted in Figure 4.1.6, where 150ºF, just above the flue gas dew point, was used as hot exhaust temperature for heat recovery. This leads to a temperature approach at the hot side of about 50ºF, which is sufficient for economizer design and sizing. Because the tube wall temperature is below the flue gas temperature, part of the moisture is condensed out on the wall. A wet-end heat exchanger design therefore has to be considered for this application.
Additional cooling is required to reduce gas temperature from 150 to 90ºF by cooling water before gas compression, and the condensate from gas moisture needs to be drained out before the compressor.
The dominant change of this option is to produce more power from the generator as the result of less steam extraction. The total power generated increased substantially from 476 to 483 MWe, or 2% increase in net power. This leads to better system performance as the electrical power penalty is reduced from 112 to 103 kWh/klbCO2, an 8% drop. The efficiency drop changed from 7.4% to 6.8% in points. The net efficiency increased from 32.07% to as 32.67%, a net 0.6% point increase.
The application of the wet-end heat exchanger to recover low-grade heat brings the benefit that the temperature of the hot recycle gas can be further boosted. This will cause a high gas exit temperature from gas-gas heat exchanger to ID fan. The heat from this high temperature exit stream can be recovered by an economizer, which means more steam condensate will be extracted and sent to economizer to pick up more low-grade heat. Because of temperature approach limitation at cold side of gas-gas heat exchanger, this option will not bring any
35
more energy back to the boiler. Instead, it will discharge more heat to the economizer and to the feed water. Therefore both the system efficiency and total power will be increased.
Since this option does not bring more energy to boiler, the fuel feed rate, and the boiler efficiency were not changed. The main change is power generation, from 483 to 486 MWe in total as compared with case-8. As a result, the power penalty reduced to 99 kWh/klbCO2, and the efficiency drop to 6.5% in points. The net system efficiency changed to 32.93%.
This hot gas recycle brings back more moisture to the boiler, as 15%v, and flue gas moisture went up to 23.8%v. This moisture slightly changes the boiler performance, such as recycle gas mass and volumetric flows, adiabatic temperature, and O2%v to boiler. The high moisture content in gas tends to reduce the difference between equilibrium and adiabatic flame temperatures, which is similar to water-gas shift equilibrium, where CO is shifted by water vapor to as H2, and the generated H2 is much easier to be burned than the CO.
4.1.4.5 O2-fired PC with Reduced Pipeline pressure (case-10) This pressure change only affects the CO2 plant power. When this pressure changed from 3000 to 2000 psia, the CO2 compression power changed from 34.2 to 32.9 MWe with liquid CO2 pumping as the last stage. While the power for the last stage compression, if only gas compressor is used without CO2 liquid pumping, would change from 6.5 to 3.9 MWe. Therefore even without the requirement of CO2 purification, the CO2 condensation before last stage is important in power saving, especially for the high pipeline pressure. At the Ref. 14 specified pressure of 2200 psia, overall cycle efficiency is increased by 0.1% points versus a pressure of 3000 psia.
4.1.4.6 O2-fired PC with HRA Series Pass (case-6A/6B, 9A/9B) Because of the reduced flue gas flow and lower HRA duty for high O2 concentration operating cases, designing the HRA in series instead of parallel will produce a more compact design The modified HRA arrangement will not affect the heat balance, but will affect the mechanical design and the heat duty arrangement. Due to less heat picked up by the pre-superheater, the water spraying for steam superheat temperature control was setup before the finishing superheater. Case-6B (Figure 4.1.8) applies nearly the same HRA inlet temperature (1451 vs. 1460ºF), as the case-6, while the case-6A applies a higher HRA inlet temperature, 1732ºF, to increase the energy discharge to HRA to maintain a better temperature profile. In case-6a, part of heat duty was shifted from boiler to HRA, which was absorbed by a larger economizer resulting in a higher feed water temperature (666 vs. 603ºF), while the furnace water wall heat duty was reduced from 1441 to 1198 MMBtu/hr.
36

Because of less flue gas recycle required for the higher adiabatic temperature of case-9, there was not enough heat to maintain the same HRA temperature profile. Consequently, either the economizer water temperature can be reduced or the HRA inlet temperature can be increased. A high HRA inlet temperature was applied for case-9A to keep the water temperature from economizer at about 590ºF. The higher HRA inlet temperature also helped to shift heat duty from division wall to the finish superheater. The exit steam temperature from the division wall was about 1021ºF in case-9A, which could require expensive high-grade materials to be used. In order to reduce this temperature, a different approach was used in case-9B, where the PSH (primary superheater) was removed and its heat duty was shifted to the finishing superheater. Kept constant were the flue gas temperature to the economizer, the water temperature to the evaporator, and the LMTD of lower reheater. Consequently, the finishing superheater size increased since its duty changed from 289 to 416 MMBtu/hr.
Case-9B (Figure 4.1.9) has a modification, where the heat picked up by roof was reduced from 134 to 50 MMBtu/hr, and the difference was shifted to water wall, which leads to an increased steam exit temperature from water wall. This does not affect the heat and material balances, but only the design.
37

Figure 4.1.8 - Boiler design with HRA series pass
489
14.7
2706
A6
4321
14.7
2705G1
249
16.6
859A5
625
15.3
1846
A4
2185
14.7
2705G3
974
4462.0
2950
47
1864
14.7
2705
G4
1083
4286.0
295048
1829
14.7
2705
G5
869
857.0
2406
49
1451
14.7
2705
G6
1113
849.0
2406
26
1283
14.6
2705G11
837
4612.0
280344
1115
14.6
2705G12
863
4527.0
2803
45
1409
14.7
2705
G8
820
867.0
204541
910
857.0
2045
24
569
4822.0
2803
34
850
14.6
2705G13
695
14.5
2705G15
603
4787.0
2803
35
145
14.7
550
PA
171
16.9
550A2
695
14.4
2705G16
119
15.4
1846A1
625
16.7
550
A3
296
14.4
2705
G17
60
20.0
0
NH3
296
14.2
2674
G18
296
14.2
31ASH
309
15.1
2674
G19
309
15.1
0
G20
97
29.7
0
L2
98
14.7
0L1
122
14.7
0STK1
122
14.7
0LIQ
60
14.7
0SORB
100
14.7
0
SLV
145
14.7
1201
SA46
15.0
645
O2
145
14.8
1751
RY2
60
14.7
0
AIRB
E1
G2
20QB
Q
60
16.7
309
COAL
309
15.1
2674G21
309
15.1
2273C1
90
14.9
2273
C2
90
14.9
2126
C3
90
14.9
147D1
90
14.8
776
C4
90
14.8
1350
RY1
309
15.1
401BYP
60
14.7
2790AIR
400
67.0
2790
9060
67.0
2790
A0
-183
0AV
46
15.0
2145N2
311
59.4
776C5
90
58.4
767
C6
313
233.6
767C7
90
231.6
764
323
926.2
764C10
90
231.6
765
90
231.6
1D4
90
58.4
9D2
90
231.6
2D3
55
916.2
29
C11
236
3000.0
29
PIPEG
55
916.2
735
D5
98
3000.0
735
PIPEL
657
877.0
2045
12
653
890.0
26793
1112
823.0
2389
84
871
353.2
23895
713
194.8
23016
540
93.8
21938
382
38.9
192928
234
15.8
187029
152
3.9
179730
102
1.0
1751
40
469
WEW
658
890.0
2406
22
658
890.0
32311
713
194.8
10856
1112
823.0
17
88
545
93.8
7892
545
93.8
219
96
382
38.9
5925
234
15.8
7359
152
3.9
4757
1076
4035.0
2950
MAIN 1076
4035.0
287867
644
10.0
5
9
112
3.7
257
14
108
1.2
219
17
102
1.0
2232
53
654
93.8
6
76
644
10.0
120
712
181.2
10815
871
353.2
8818
750
1305.3
19921
746
1266.2
19963
532
1266.2
199
89
527
863.3
52265
435
863.3
522
80
430
342.6
61066
267
93.8
78
95
262
36.9
13769
218
36.9
137
78
214
15.2
21070
155
15.2
210
77
150
3.7
25771
50
318
191.6
1332
93
322
206.6
900
68
396
342.6
610
52
374
181.2
295086
87
386
4979.0
2950
85 102
236.6
13327
145
221.6
1332
16
208
206.6
1332
61
257
191.6
1332
73
425
4954.0
2950
74
522
4929.0
2950
83
569
4904.0
2950
32
3826
14.7
0E2
812
4682.0
280342
1021
4472.0
280381
832
4647.0
2803
43
569
4839.0
2950
33
569
4822.0
148
60
1112
823.2
2406
19
657
877.0
240623
102
236.6
900
64
750
1305.3
287872
1112
823.0
2406
27
545
93.8
7894
657
877.0
36155
RSTOIC
FLAME
Q=0
NOZ
FSH
Q=289
FRH
Q=329
PSH
Q=138
RHB
Q=106
LECO
Q=118
SC1
Q=-31
SC23
Q=-36
PAFAN
W=1
AAHX
Q=-282
DENOX
ESP IDFAN
W=3
PREC
SLV
W=0
FGDPOND
SAFAN
W=1
SPA
SP1
HEATER
BOILER
Q=-2042
MILL
Q=0
SPF
COL1
Q=-281
SEP1
Q=0
RECY
GRH
COMP
W=68
DIST
Q=-3
AC
Q=-246
COMP1
W=11
COMP2
W=11
GBY
COMP3
W=10
DEM
Q=-1
COL2
Q=-48
COL3
Q=-42
COMP4
W=0
COL4
Q=-113
CPUMP
W=3
RHA
Q=210
HP2 IP1 IP2 IP3 LP1 LP2 LP3 LP4
WMULTEG
EH2
EI2
EI3
EL2 EL3 EL4
LS1
COND
Q=-1860
FSPLIT
SSR
VD
EI1
SL3
V7 V6 V5 V3 V2 V1
CP
W=1
DEA
Q=-0BFP1
W=18
FWH1
Q=57
FWH2
Q=84
FWH3
Q=65
FWH6
Q=118
FWH7
Q=311
FWH8
Q=162
SL2
RGIBBS
EQ
EVAP
Q=1440
DIVW
Q=479
ROOF
Q=134PRPB
Q=36
FWV
SPQ
SPRAY
DPHRH
DPCRH
BYFW
WETECO
Q=200
HP1
EH1SL6
SL5
FWH4
Q=83
V4
Q=0
AUX
W=-18
LS4
B1
B2
Temperature (F)
Pressure (psi)
Mass Flow Rate (Mlb/hr)
Duty (MMBtu/hr)
Power(MW)
Q Duty (MMBtu/hr)
W Power(MW)
ST=4035/1076/1112/2.0"Hg=460 MWCase: O2-PC-SC-06B, 09/28/2005
PC Boiler
38

Figure 4.1.9 - Boiler design with HRA series pass (56% Flue Gas Recycle)
457
14.7
2118
A6
5104
14.7
2117G1
257
16.6
858A5
625
15.3
1260
A4
2450
14.7
2117G3
934
4532.0
2950
47
1885
14.7
2117
G4
1083
4286.0
295048
1850
14.7
2117
G5
869
857.0
2406
49
1379
14.7
2117
G6
1113
849.0
2406
26
1167
14.6
2117G11
837
4612.0
280344
1161
14.6
2117G12
837
4597.0
2803
45
1326
14.7
2117
G8
820
867.0
204541
910
857.0
2045
24
569
4822.0
2803
34
833
14.6
2117G13
695
14.5
2117G15
594
4787.0
2803
35
259
14.7
550
PA
288
16.9
550A2
695
14.4
2117G16
163
15.4
1260A1
625
16.7
550
A3
368
14.4
2117
G17
60
20.0
0
NH3
368
14.2
2087
G18
368
14.2
30ASH
383
15.1
2087
G19
383
15.1
0
G20
97
29.7
0
L2
98
14.7
0L1
126
14.7
0STK1
126
14.7
0LIQ
60
14.7
0SORB
100
14.7
0
SLV
259
14.7
616
SA46
15.0
644
O2
259
14.8
1166
RY2
60
14.7
0
AIRB
E1
G2
19QB
Q
60
16.7
308
COAL
383
15.1
2087G21
383
15.1
1461C1
90
14.9
1461
C2
90
14.9
1314
C3
90
14.9
146D1
90
14.8
774
C4
90
14.8
540
RY1
383
15.1
626BYP
60
14.7
2784AIR
400
67.0
2784
9060
67.0
2784
A0
-183
0AV
46
15.0
2140N2
311
59.4
774C5
90
58.4
766
C6
313
233.6
766C7
90
231.6
763
323
926.2
763C10
90
231.6
763
90
231.6
1D4
90
58.4
9D2
90
231.6
2D3
55
916.2
37
C11
236
3000.0
37
PIPEG
55
916.2
725
D5
98
3000.0
725
PIPEL
657
877.0
2045
12
653
890.0
26793
1112
823.0
2389
84
871
353.2
23895
713
194.8
23016
540
93.8
21938
382
38.9
192928
234
15.8
187029
152
3.9
179730
102
1.0
1751
40
469
WEW
658
890.0
2406
22
658
890.0
32311
713
194.8
10856
1112
823.0
17
88
545
93.8
7892
545
93.8
219
96
382
38.9
5925
234
15.8
7359
152
3.9
4757
1076
4035.0
2950
MAIN 1076
4035.0
287867
644
10.0
5
9
112
3.7
257
14
108
1.2
219
17
102
1.0
2232
53
654
93.8
6
76
644
10.0
120
712
181.2
10815
871
353.2
8818
750
1305.3
19921
746
1266.2
19963
532
1266.2
199
89
527
863.3
52265
435
863.3
522
80
430
342.6
61066
267
93.8
78
95
262
36.9
13769
218
36.9
137
78
214
15.2
21070
155
15.2
210
77
150
3.7
25771
50
318
191.6
1332
93
322
206.6
900
68
396
342.6
610
52
374
181.2
295086
87
386
4979.0
2950
85 102
236.6
13327
145
221.6
1332
16
208
206.6
1332
61
257
191.6
1332
73
425
4954.0
2950
74
522
4929.0
2950
83
569
4904.0
2950
32
4161
14.7
0E2
825
4682.0
280342
974
4542.0
280381
832
4647.0
2803
43
569
4839.0
2950
33
569
4822.0
148
60
1112
823.2
2406
19
657
877.0
240623
102
236.6
900
64
750
1305.3
287872
1112
823.0
2406
27
545
93.8
7894
657
877.0
36155
RSTOIC
FLAME
Q=0
NOZ
FSH
Q=416
FRH
Q=329
PSH
Q=4
RHB
Q=106
LECO
Q=84
SC1
Q=-25
SC23
Q=-36
PAFAN
W=1
AAHX
Q=-188
DENOX
ESP IDFAN
W=2
PREC
SLV
W=0
FGDPOND
SAFAN
W=1
SPA
SP1
HEATER
BOILER
Q=-2089
MILL
Q=0
SPF
COL1
Q=-269
SEP1
Q=0
RECY
GRH
COMP
W=68
DIST
Q=-3
AC
Q=-246
COMP1
W=11
COMP2
W=11
GBY
COMP3
W=10
DEM
Q=-1
COL2
Q=-48
COL3
Q=-42
COMP4
W=0
COL4
Q=-112
CPUMP
W=2
RHA
Q=210
HP2 IP1 IP2 IP3 LP1 LP2 LP3 LP4
W MULTEG
EH2
EI2
EI3
EL2 EL3 EL4
LS1
COND
Q=-1860
FSPLIT
SSR
VD
EI1
SL3
V7 V6 V5 V3 V2 V1
CP
W=1
DEA
Q=-0BFP1
W=18
FWH1
Q=57
FWH2
Q=84
FWH3
Q=65
FWH6
Q=118
FWH7
Q=311
FWH8
Q=162
SL2
RGIBBS
EQ
EVAP
Q=1558
DIVW
Q=487
ROOF
Q=50PRPB
Q=36
FWV
SPQ
SPRAY
DPHRH
DPCRH
BYFW
WETECO
Q=200
HP1
EH1SL6
SL5
FWH4
Q=83
V4
Q=0
AUX
W=-18
LS4
B1
B2
Temperature (F)
Pressure (psi)
Mass Flow Rate (Mlb/hr)
Duty (MMBtu/hr)
Power(MW)
Q Duty (MMBtu/hr)
W Power(MW)
ST=4035/1076/1112/2.0"Hg=460 MWCase: O2-PC-SC-09B, 09/28/2005
PC Boiler
39

4.1.5 Part Load
For a sliding pressure supercritical system design, part load performance has to be considered and evaluated. For this purpose, the Aspen model can be used by converting its design model to a simulation model, where all of the equipment sizes are fixed from the design case. Based on the 100% load condition, the heat transfer coefficients are functions of operating conditions, such as temperatures and Reynolds number. At full load, the heat transfer coefficients vary from 14.4 for the finishing superheater to 9.7 Btu/ft2-hr-F for economizer. In order to simulate the air-air heat exchanger, the original lumped module was replaced by two modules for both the primary air and the secondary air. The steam turbine was also converted in the simulation model such that the turbine exit parameters are floated as loading changes. The model for feedwater heaters was adjusted so that the extraction pressures were automatically calculated. The water wall absorption of boiler is difficult to be simulated by the zero dimensional Aspen model. Therefore its performance such as the gas exit temperature was calculated separately using the 3-D FW-FIRE model and iterated with Aspen. Note that in conventional air fired PC boiler, the excess air has to be increased during part load to maintain steam exit temperatures. Increasing excess air is not necessary for the oxygen-fired boiler since the quantity of flue recycle can be increased at part load to maintain steam temperatures. Increasing flue gas recycle flow rather than excess air has less adverse effect on plant performance and emissions. The 72% part load (72% generator power) is shown as Case p72 in Table 4.1.3. The amount of flue gas recycled is adjusted to produce sufficient SH and RH steam temperatures. The water spray to SH was adjusted from 5% to 4% to boost SH steam temperature. In this way, the efficiency loss is kept at a minimum when boiler is operated in part load. The loading is further reduced to 50% as shown by p50 in Table 4.1.3. At this load, the main steam pressure is 2125 psia. At this pressure, the steam turbine can be operated at a reasonably high temperature to keep the system efficiency high. Therefore the boiler was adjusted to maintain both the SH and RH steam conditions as near as possible to those at 100% load. Note that the flue gas recycle flow changes only slightly as the loading changes from 100% to 50%. The lowest part load case for this study was 25% as shown by p25. In corresponding to a sliding pressure, both SH and RH steam temperatures were adjusted through the combination of firing rate and gas circulation rate to make sure the end steam exhausted from the steam turbine at right conditions. Because of lower steam conditions, the system efficiency reduced substantially.
40

Figure 4.1.10 and Figure 4.1.11 are plots, which show the effect of part load on performance. At some loadings, the flue gas absolute recycling flow does not change much, but its ratio to boiler flow changes because of less total boiler gas flow as shown by Figure 4.1.10. Figure 4.1.11 shows the relation between part load and system efficiency.
Figure 4.1.10 - Flue gas recycle flow vs. part load operation
Part Load Performance
0
200
400
600
800
1000
1200
1400
0 20 40 60 80 100 120Load, %
Gas
recy
clin
g, k
lb/h
r
0
10
20
30
40
50
60
70
80
90
100
gas
recy
clin
g, %
Figure 4.1.11 Efficiency at part load operation
Part Load Performance
10
15
20
25
30
35
40
0 20 40 60 80 100Loading, %
Effic
ienc
y, %
120
41

4.1.6 Comparison With Post Combustion CO2 Capture CO2 cannot be captured and sequestrated without reducing both the plant power and efficiency because of the potential energy stored in the pressurized liquid CO2. A minimum of 40 kw/klbCO2 additional auxiliary power is required for CO2 compression. The difference between technologies lies in the difference in power requirements of the different CO2 or O2 separation techniques. Parsons (Ref. 1) performed studies on CO2 removal by a post capture method for a conventional PC boiler. In their study for post combustion CO2 removal, the plant efficiency drops from 40.5% to 28.9% for a supercritical (3500 psia/1050ºF/1050ºF/1050ºF/2.0”Hg) boiler, and from 42.7% to 31.0% for an ultra supercritical (5000 psia/1200ºF/1200ºF/1200ºF /2.0”Hg) boiler. In the study presented herein, the CO2 removal using an O2-fired PC is used, which relies on an ASU. At a pipeline pressure of 2000 psia (as applied in the Parsons study) the efficiency drops from 36.7% to 30.4% for the subcritical (2415psia/1000ºF/1000ºF/2.5”Hg) boiler [3], and from 39.5% to 33.1% for the supercritical (4035psia/1076ºF/1112ºF/2.0”Hg) boiler. The net efficiency drops for these cases are
11.7% points for supercritical, post combustion CO2 removal 11.7% points for ultra supercritical, post combustion CO2 removal
6.3% points for subcritical, O2 fired 6.4% points for supercritical, O2 fired
Another comparison basis is the kWh per klb CO2 removal, where the kW is power generation difference between cases with and without CO2 removal. Comparing the post CO2 capture to the O2-fired case yields:
187 kWh/lbCO2 for supercritical, 90% post combustion removal 188 kWh/lbCO2 for ultra supercritical, 90% post combustion removal 99 kWh/lbCO2 for subcritical, O2 fired 100% removal 97 kWh/lbCO2 for supercritical, O2 fired 100% removal
Thus the efficiency drop and change in power penalty for CO2 removal appears independent of steam cycle. From the above data, it is clear that the O2-PC has significant advantages over the post combustion CO2 capture.
4.1.7 Furnace Waterwall Temperature The level of radiation in the O2-fired boiler is significantly higher than an air-fired boiler due to greater concentrations of radiating gas species (CO2 and H2O) and higher flame temperature. Consequently, it is important to select the proper amount of recycled flue gas to limit the water wall temperature such that a reasonable waterwall material can be used. The maximum waterwall temperature and furnace heat flux is determined in Section 4.3.
42

4.2 Advanced O2 Separation System Integration
4.2.1 O2-Fired PC Integrated with Cryogenic ASU (case-6) The model of the oxygen-fired plant with cryogenic ASU was described in Section 4.1.3. Figure 4.2.1 presents the cryogenic ASU base case system model (case-6). Flue gas recycle flow rate is 65.5% resulting in a boiler equilibrium temperature of 3830ºF and an overall cycle efficiency of 31.94%. The oxidant from the ASU is 99.5% O2 pure. ASU and CO2 plant power consumptions is 67.7 and 34.2 MWe, respectively, resulting in a total auxiliary power of 138.5 MWe, or about 29.1% of gross power. The efficiency drop compared to the air-fired case is 7.5% in points (39.46% to 31.94%), and the associated power penalty is 114 kWh/klbCO2.
43

Figure 4.2.1 - Base case of O2-fired supercritical PC with Cryogenic ASU
44
489
14.7
2706
A6
4321
14.7
2705G1
249
16.6
859A5
625
15.3
1846
A4
2185
14.7
2705G3
970
4445.0
2950
47
1853
14.7
2705
G4
1083
4269.0
2950
48
882
857.0
2406
24
1818
14.7
2705
G5
1460
14.7
2705
G6
1113
849.0
2406
26
1442
14.7
2705
G7
1442
14.7
1758G8
G9
893
14.6
811G12
592
4787.0
2803
35
818
14.6
811G13
597
4770.0
2803
41
1362
14.7
811G10
835
4595.0
280344
855
4510.0
280345
657
877.0
240623
811
14.6
1758G11527
14.7
13581
799
14.5
2705G14
569
4822.0
280334
695
14.4
2705G15
146
14.7
550
PA
171
16.9
550A2
695
14.3
2705G16
120
15.4
1846A1625
16.7
550
A3
296
14.3
2705
60
20.0
0
NH3
296
14.1
2674
G18
296
14.1
31ASH
311
15.1
2674
311
15.1
0
G20
97
29.7
0
L2
98
14.7
0
122
14.7
0STK1
122
14.7
0LIQ
60
14.7
0SORB
100
14.7
0
146
14.7
1201
SA
46
15.0
645
O2
146
14.8
1751
RY2
60
14.7
0
AIRB
E1
G2
19QB
Q
60
16.7
309
COAL
311
15.1
2674G21
311
15.1
2273C1
90
14.9
2273
C2
90
14.9
2126
C3
90
14.9
147D1
90
14.8
776
90
14.8
1350
RY1
311
15.1
401BYP
60
14.7
2790AIR
400
67.0
2790
90
60
67.0
2790
A0
-183
0AV
46
15.0
2145N2
311
59.4
776C5
90
58.4
767
C6
313
233.6
767C7
90
231.6
764
323
926.2
764C10
90
231.6
765
90
231.6
1D4
90
58.4
9D2
90
231.6
2D3
55
916.2
29
C11
236
3000.0
29
PIPEG
55
916.2
735
D5
98
3000.0
735
PIPEL
653
890.0
26793
1112
823.0
2389
84
871
353.2
2389
713
194.8
23016
540
93.8
21878
382
38.9
1874
234
15.8
177529
152
3.9
165230
102
1.0
1573
40
459
WEW
658
890.0
2406
22
658
890.0
32311
713
194.8
11456
1112
823.0
17
88
545
93.8
12792
545
93.8
219
96
382
38.9
9925
234
15.8
12259
152
3.9
7957
1076
4035.0
2950
MAIN 1076
4035.0
287867
644
10.0
5
9
112
3.7
429
14
108
1.2
219
17
102
1.0
2226
53
654
93.8
6
76
644
10.0
120
712
181.2
11415
871
353.2
8818
750
1305.3
19921
746
1266.2
19963
532
1266.2
199
89
527
863.3
52265
435
863.3
522
80
430
342.6
61066
267
93.8
127
95
262
36.9
22669
218
36.9
226
78
214
15.2
34870
155
15.2
348
77
150
3.7
42971
50
317
191.6
2226
93
269
206.6
0
68
396
342.6
610
52
374
181.2
295086
87
386
4979.0
2950
85102
236.6
22267
145
221.6
2226
16
208
206.6
2226
61
257
191.6
2226
73
425
4954.0
2950
74
522
4929.0
2950
83569
4904.0
295032
3826
14.7
0
810
4665.0
280342
835
4500.0
2950
46
830
4630.0
2803
43
569
4839.0
2950
569
4822.0
14860
1112
823.2
2406
19
102
236.6
0
64
750
1305.3
287872
1112
823.0
2406
27
545
93.8
12794
RSTOIC
FLAME
Q=0
NOZ
FSH
Q=299
FRH
Q=311
SPG
UECO
Q=17
PSH
Q=114
RHB
Q=333
DAMP
LECO
Q=79
SC1
Q=-31
SC23
Q=-15
SC4
Q=-20
PWQ=-36
PAFAN
W=1
AAHX
Q=-282
DENOX
ESP IDFAN
W=3
PREC
SLV
W=0
FGDPOND
SAFAN
W=1
SPA
SP1
HEATER
BOILER
Q=-2042
MILL
Q=0
SPF
COL1
Q=-282
SEP1
Q=0
RECY
GRH
COMP
W=68
DIST
Q=-3
AC
Q=-246
COMP1
W=11
COMP2
W=11
GBY
COMP3
W=10
DEM
Q=-1
COL2
Q=-48
COL3
Q=-42
COMP4
W=0
COL4
Q=-113CPUMP
W=3
HP2 IP1 IP2 IP3 LP1 LP2 LP3 LP4
WMULT
EG
EH2
EI2
EI3EL2 EL3 EL4
LS1
COND
Q=-1696
FSPLIT
SSR
VD
EI1
SL3
V7 V6 V5 V3 V2 V1
CP
W=1
DEA
Q=-0BFP1
W=18
FWH1
Q=95
FWH2
Q=141
FWH3
Q=110
FWH6
Q=118
FWH7
Q=311
FWH8
Q=162
SL2
RGIBBS
EQ
EVAP
Q=1453
DIVW
Q=501
ROOF
Q=137PRPBQ=36
FWV
SPQ
SPRAY
DPHRH
DPCRH
BYFW
WETECO
Q=0
HP1
EH1SL6
SL5
FWH4
Q=135
V4
Q=0
AUX
W=-18
LS4
Temperature (F)
Pressure (psi)
Mass Flow Rate (Mlb/hr)
Duty (MMBtu/hr)
Power(MW)
Q Duty (MMBtu/hr)
W Power(MW)
ST=4035/1076/1112/2.0"Hg=460 MWCase: O2-PC-SC-06, 06/03/2005
FGD
PC Boiler
ASU
CO2

4.2.2 O2-Fired PC Integrated with OITM Advanced oxygen separation through high temperature membranes such as OITM is currently under development [2, 4, 5, 7]. Oxygen ion transport membranes have the potential to provide a major reduction in oxygen separation capital and energy consumption. Oxygen ion transport is driven by the difference in oxygen partial pressure across a membrane. Oxygen atoms adsorb on the cathode (high oxygen partial pressure side of the membrane) and dissociate into ions as they pick electrons. These ions travel from cathode to anode (the low oxygen partial pressure) by jumping through lattice sites and vacancies until they reach the anode side of the membrane. On the anode side, the oxygen ions yield their electrons to become atoms/molecules, which are then desorbed into the gas phase. Electrons from the anode side are carried through the membrane to the cathode side to complete the circuit. The rate of oxygen transport through such membranes is temperature sensitive, and can be very fast at high temperatures. These membranes have infinite selectivity for oxygen over other gases, because only oxygen ions can occupy the lattice positions. A typical schematic of the oxygen ion transport membrane process is presented in Figure 4.2.2. The OITM process and design data are based on Reference 7. A schematic of the OITM process incorporated within the O2-PC plant is shown in Figure 4.2.3. To integrate the OITM into the O2-fired PC, air is pressurized by a compressor, and then heated to a high temperature. High pressure air provides a high oxygen partial pressure on the airside of the OITM to reduce the size and cost of the OITM. Air enters the compressor at 60ºF and 14.7 psia and is compressed at 85% efficiency to 215 psia and 743ºF. The compressed air is heated to 1652ºF by a tubular air heater inside the PC furnace. This hot pressurized air is fed to the OITM, where about 85% of its O2 is separated through the membrane to an exit pressure of 16 psia, and the rest of the vitiated air or O2-depleted air is sent to a gas expander to generate power at 86% turbine efficiency. Power generated from the expander is used to drive the air compressor. Since the power generated in the gas expander is greater than the air compressor power the OITM system produces a net power output. The separated O2 from the membrane is carried by a heated sweep gas. The use of a sweep gas reduces the oxygen partial pressure on the low-pressure side of the membrane and consequently reduces the size and cost of the OITM. A recuperator is applied between inlet and outlet sweep gas flows to reduce the heat requirement. Heat transfer from the sweep gas to the membrane to the air is neglected as it is expected to be relatively small (it was also neglected in Reference 7). The mixture of sweep gas and O2 is then injected into the furnace. In this design, the OITM does not consume electrical power; instead, it absorbs heat, generates power, and separates O2 from air. Therefore it is expected to reduce ASU operating and capital costs.
45

From a heat and mass balance point of view, if there is no heat transfer between the air and sweep gas, the model can be simplified by directly mixing the separated O2 with the sweep gas. Thus, to simplify the model, the recuperator and OITM are combined into a single module in the Aspen model. The operational details of the OITM, such as the O2 flux through the membrane as a function of OITM temperature and pressure, were not included in the Aspen model. These details are necessary only for OITM size and cost estimations. Moreover, the Aspen model does not directly model the recuperator, but the recuperator design and configuration is required for the economic analysis. Without performing a detailed economic study, it is difficult to determine the optimum OITM operating pressure. However, Reference 8 specifies that for an economic design, the ratio of oxygen partial pressures of the feed gas (air) to the permeate stream (sweep gas) should be approximately 7. The base case OITM design has an oxygen partial pressure ratio of 4.9 at the air inlet and 10.2 at the air outlet, yielding an approximate average ratio of 7.5. Reference 8 specifies that an 85% O2 recovery and an operating temperature of 1652ºF is within the operating range of the OITM. The effect of O2 recovery and OITM operating pressure on system performance and OITM design is examined in Section 4.2.2.3.1 and Section 4.2.2.3.2, respectively. Several cases incorporating an OITM ASU into the O2-PC have been simulated to evaluate the effect of different conceptual designs and operating conditions on power plant performance.
46

Figure 4.2.2 - A Typical Oxygen Ion Transport Membrane Schematic [4]
47

Figure 4.2.3 – Integration of Oxygen Ion Transport Membrane into O2-PC
48

4.2.2.1 Process Gains
The inclusion of a gas turbine expander in the O2-PC power plant utilizing the OITM increases the overall system efficiency by allowing work to be done in the gas turbine at a higher temperature than can be achieved by the steam from the boiler. This principle has been applied by FW in its 1st generation Pressurized Fluidized Bed Combustor (PFBC) design. A further enhancement is the 2nd generation PFBC design (similar to IGCC) in which the turbine entrance temperature is increased by syngas combustion. This concept was also applied in the FW High Performance Power System (HIPPS) design, which includes an in-furnace high temperature air heater similar to the one required for the O2-PC OITM concept.
4.2.2.2 Base Case (case-11)
Figure 4.2.3 shows a schematic of the OITM ASU integrated with the O2-fired PC power plant. The OITM system includes a sweep gas system, and an air supply system. The pressurized vent gas from the CO2 plant is recycled back to the air separation unit, where it is mixed with the compressed air. In this way the rich O2 in the vent gas can be recovered, and the air to compressor can be reduced. Therefore this vent gas recycling increases system efficiency and reduces the operating cost. Figure 4.2.4 (case-11) is a process flow diagram generated by Aspen Plus for the OITM ASU integration. Air is compressed to about 200 psia by a compressor, and then heated within the boiler to about 1650ºF. This hot pressurized air is fed to OITM, where about 85% of its O2 is separated through a membrane, and the rest of vitiated air is sent to an expander. The separated O2 from the membrane is carried by a heated recycled flue gas after gas-to-gas heat exchange. A recuperator is applied between inlet and exit sweep gas flows (not shown in Figure 4.2.4 since it lumped inside the OITM module). The mixture of sweep gas and O2 is fed directly to the boiler. The exhaust gas from the expander passes through an economizer to release its heat for feedwater heating. Power generated from the expander is used to drive the air compressor. The O2 obtained from the OITM is swept with recycled flue gas. Since the compressed air is heated to 1650ºF inside the boiler, a special heat exchanger and boiler design has to be used for the OITM application (Sections 4.3.2.2.3 and 4.3.5.4). The boiler air heater duty is 974 MMBtu/hr. The coal feed rate is 377 klb/hr as compared with 319 klb/hr for the air-fired case-1, and 309 klb/hr for the O2-fired (cryogenic ASU) case-6. The corresponding flue gas flow increased to 3497 klb/hr, nearly approaching the air-fired flow of 3552 klb/hr. The boiler O2 concentration is 31%v, which is nearly the same as case-6. Because of increased flue gas flow created by greater coal-firing, more heat is carried to the boiler HRA in case-11 than in case-6. As result, distribution of heat
49

duty shifts: the heat duty of the division wall reduces from 501 MMBtu/hr in case-6 to 396 MMBtu/hr in case-11, while the sum of the primary superheater and upper economizer duties increases from 131 MMBtu/hr in case-6 to 411 MMBtu/hr in case-11. Consequently, the inlet furnace feedwater temperature increases from 597ºF in case-6 to 666ºF in case-11. The total furnace duty for case-11 increases because of the 974 MMBtu/hr air heater duty, although the heat to waterwalls is reduced from 2042 to 1583 MMBtu/hr. Because more low-grade heat is released from the gas turbine (GT) exhaust and from boiler, all low-pressure feedwater heaters are shut off. The low-pressure feedwater heating is provided in parallel by the GT economizer and a HRA flue gas exhaust economizer (in parallel to flue gas heat recuperator), as well as by part of the compressor inter-stage coolers.
The OITM O2-PC incorporates the recycling of vent gas from the CO2 compression system back to the OITM. The high-pressure vent gas from the CO2 plant is heated with GT exhaust gas before it is expanded for power recovery. After the expansion to the OITM operation pressure, the O2-rich vent gas is mixed with compressed air and sent to the OITM. Consequently, the compressor air flow and power is reduced. The emission control equipment treats the vent gas prior to the OITM requiring smaller equipment sizes due to the high pressure of the vent gas.
The replacement of the cryogenic ASU with the OITM greatly reduces the efficiency loss penalty. This is caused by lower equivalent ASU power, better system integration, increased power from the OITM GT, and more low-grade heat recovery from cooling. As shown in Table 4.2.1 the OITM reduces the efficiency drop by 52% and the CO2 removal power penalty by 61%.
Table 4.2.1 – Comparison of O2PC with Cryogenic and OITM ASU
Air-fired O2-fired O2-firedASU - cryogenic OITM
Main steam flow, klb/hr 2950 2950 2950Coal flow, klb/hr 319 309.4 377Net power, MW 430 338 462Net efficiency, % 39.5 31.9 35.8ASU Power, MW 0 67.7 -26.7CO2 Compression Power, MW 0 34.2 41.3CO2 removal flow, klb/hr 0 720 874Efficiency penalty, % points 0 7.5 3.6CO2 removal penalty, kWh/klbCO2 0 114 45
50
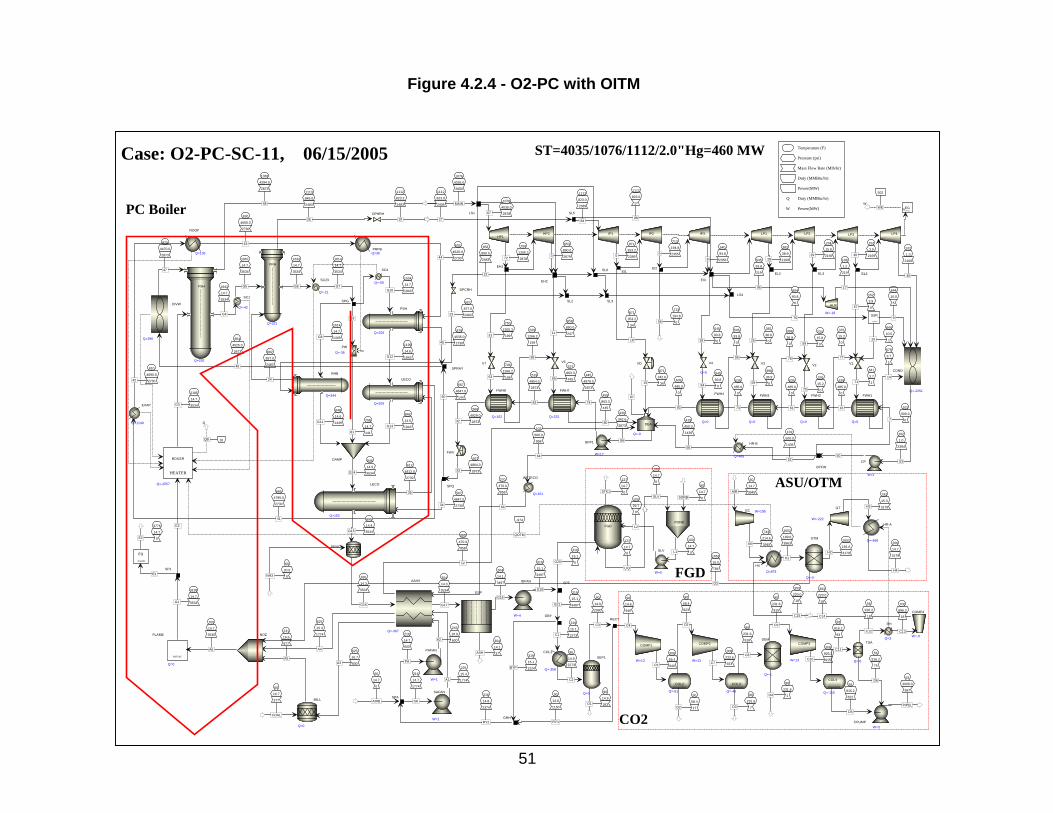
Figure 4.2.4 - O2-PC with OITM
705
14.7
3535
A6
4199
14.7
3534G1
231
16.6
977
A5
625
15.3
1774
A4
1652
16.0
784
O2
2185
14.7
3534G3
970
4470.0
2873
47
1942
14.7
3534
G4
1083
4294.0
2873
48
882
857.0
2483
24
1907
14.7
3534
G5
1632
14.7
3534
G6
1113
849.0
2483
26
1614
14.7
3534
G7
1614
14.7
1449G8
G9
1199
14.6
1943G12
612
4812.0
2730
35
848
14.6
1943G13
666
4795.0
2730
41
1534
14.7
1943G10
835
4620.0
273044
879
4535.0
273045
657
877.0
248323
848
14.6
1449G11 798
14.7
14181
846
14.5
3534G14
567
4847.0
273034
695
14.4
3534G15
216
14.7
600
PA
243
16.9
600A2
695
14.3
3534
G16
225
15.4
1774A1
270
470.0
958
68
625
16.7
600A3
304
14.3
3534
G17
400
470.0
958
1260
20.0
0NH3
304
14.1
3497
G18
304
14.1
37ASH
319
15.1
3497
G19
319
15.1
0G20
100
29.7
0
L2
100
14.7
0L1
127
14.7
0STK1
127
14.7
0
LIQ
60
14.7
0SORB
100
14.7
0
SLV
216
14.7
1774
SA
216
14.8
2374
RY2
60
14.7
0
AIRB
E1
G2-974
QOTM
16QB
Q
60
16.7
377
COAL
319
15.1
3497G21
319
15.1
2273C1
90
14.9
2273
C2
90
14.9
2090
C3
90
14.9
183D1
90
14.8
940
C4
90
14.8
1150
RY1
319
15.1
1224BYP
60
14.7
3945AIR
743
214.6
3945A0
1652
199.6
3963
H1
309
59.4
940C5
90
58.4
923
C6
308
233.6
923C7
90
231.6
915
C9
308
926.2
915C10
90
231.6
916
C8
90
231.6
1D4
90
58.4
17D2
90
231.6
7D3
56
916.2
93
C11
393
220.0
18
C14
56
916.2
822
D5
63
3000.0
897
PIPEL
1652
191.6
3179H2
782
15.3
3179H3
200
14.7
3179
H4
653
890.0
26793
1112
823.0
2389
84
871
353.2
23895
713
194.8
23556
540
93.8
23558
382
38.9
216928
234
15.8
216929
152
3.9
216930
102
1.0
2169
40
502
WEW
658
890.0
2483
22
658
890.0
24711
713
194.8
056
1112
823.0
17
88
545
93.8
092
545
93.8
219
96
382
38.9
025
234
15.8
059
152
3.9
057
1076
4035.0
2950
MAIN 1076
4035.0
287867
644
10.0
5
9
579
3.7
1
14
108
1.2
219
17
102
1.0
2394
53
654
93.8
6
76
644
10.0
120
871
353.2
34
18
871
342.6
3415
750
1305.3
19921
746
1266.2
19963
529
1266.2
199
89
527
863.3
44565
545
93.8
0
95
398
36.9
069
398
36.9
0
78
376
15.2
070
376
15.2
0
77
641
3.7
171
50
639
485.0
0
93
455
863.3
445
80419
450.0
1436
66
430
342.6
2873
86
87
445
4979.0
2873
74102
500.0
07
639
485.0
0
16
639
485.0
0
61
639
485.0
0
73
519
4954.0
2873
83
568
4929.0
287332
3776
14.7
0E2
810
4690.0
273042
854
4525.0
2873
46
830
4655.0
2730
43
567
4864.0
287333
567
4847.0
14460
1112
823.2
2483
19
102
500.0
958
64
102
500.0
1436
52
750
1305.3
287872
1112
823.0
2406
27
545
93.8
094
RSTOIC
FLAME
Q=0
NOZ
FSH
Q=292
FRH
Q=321
SPG
UECO
Q=205
PSH
Q=206
RHB
Q=344
DAMP
LECO
Q=152
SC1
Q=-42
SC23
Q=-21
SC4
Q=-50
PWQ=-36
PAFAN
W=1
AAHX
Q=-367
DENOX
ESP
IDFAN
W=4
PREC
SLV
W=0
FGDPOND
SAFAN
W=1
SPA
SP1
HEATER
BOILER
Q=-2557
MILL
Q=0
SPF
COL1
Q=-308
SEP1
Q=0
RECY
GRH
GC W=195
HX
Q=974
COMP1
W=13
COMP2
W=13
GBY
COMP3
W=13
DEM
Q=-1
COL2
Q=-61
COL3
Q=-48
COMP4
W=-0
COL4
Q=-115
CPUMPW=3
OTM
Q=-0
GT
W=-222HR-A
Q=-468
HP2 IP1 IP2 IP3 LP1 LP2 LP3 LP4
WMULTEG
EH2
EI2
EI3
EL2 EL3 EL4
LS1
COND
Q=-2251
FSPLIT
SSR
VD
EI1
SL3
V7 V6 V3 V2 V1
CP
W=1
DEA
Q=-0
BFP1
W=17
FWH1
Q=0
FWH2
Q=0
FWH3
Q=0
FWH7
Q=232
FWH8
Q=162
SL2
RGIBBS
EQ
EVAP
Q=1149
DIVW
Q=396
ROOF
Q=135PRPB
Q=36
FWV
SPQ
SPRAY
DPHRH
DPCRH
BYFW
WETECO
Q=161
HP1
EH1SL6
SL5
FWH4
Q=0
V4
Q=0
AUX
W=-18
LS4
HR-B
Q=465
Temperature (F)
Pressure (psi)
Mass Flow Rate (Mlb/hr)
Duty (MMBtu/hr)
Power(MW)
Q Duty (MMBtu/hr)
W Power(MW)
ST=4035/1076/1112/2.0"Hg=460 MWCase: O2-PC-SC-11, 06/15/2005
FGD
PC Boiler
ASU/OTM
CO2
TSA
Q=-6
56
916.2
75
D6
56
916.2
18
C12
RH
Q=3
700
896.2
18
C13
393
220.0
18
C15
51
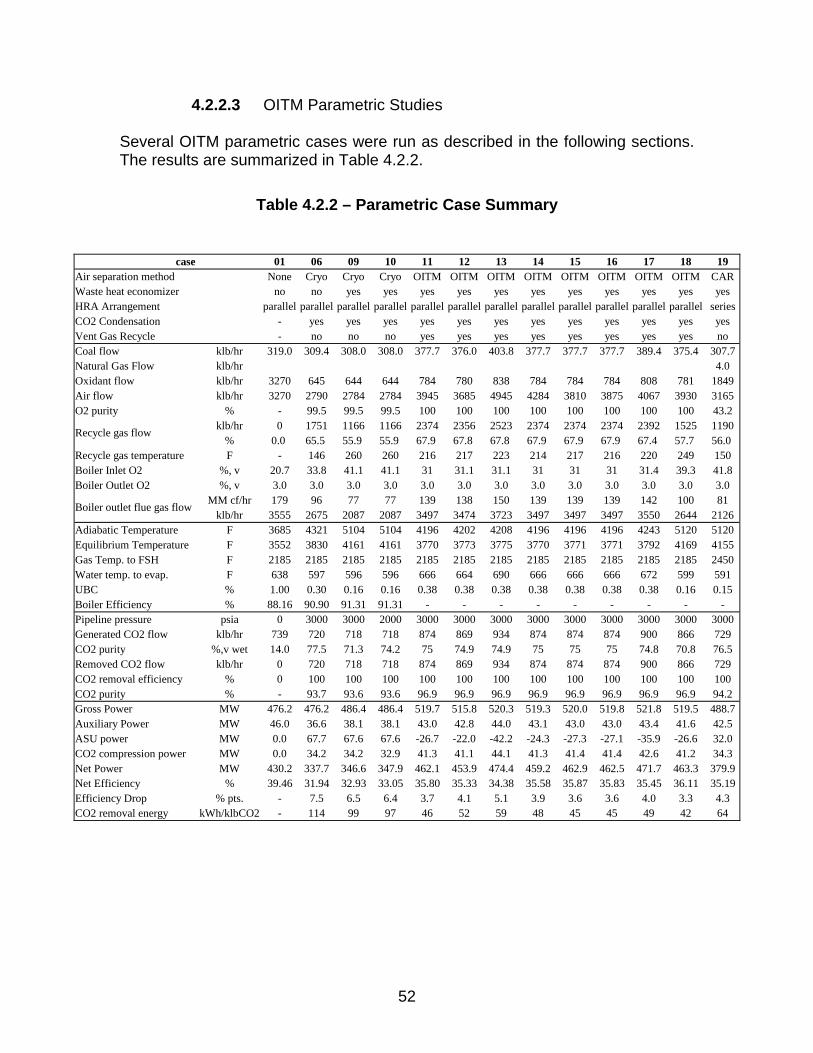
4.2.2.3 OITM Parametric Studies Several OITM parametric cases were run as described in the following sections. The results are summarized in Table 4.2.2.
Table 4.2.2 – Parametric Case Summary
case 01 06 09 10 11 12 13 14 15 16 17 18 19Air separation method None Cryo Cryo Cryo OITM OITM OITM OITM OITM OITM OITM OITM CARWaste heat economizer no no yes yes yes yes yes yes yes yes yes yes yesHRA Arrangement parallel parallel parallel parallel parallel parallel parallel parallel parallel parallel parallel parallel seriesCO2 Condensation - yes yes yes yes yes yes yes yes yes yes yes yesVent Gas Recycle - no no no yes yes yes yes yes yes yes yes noCoal flow klb/hr 319.0 309.4 308.0 308.0 377.7 376.0 403.8 377.7 377.7 377.7 389.4 375.4 307.7Natural Gas Flow klb/hr 4.0Oxidant flow klb/hr 3270 645 644 644 784 780 838 784 784 784 808 781 1849Air flow klb/hr 3270 2790 2784 2784 3945 3685 4945 4284 3810 3875 4067 3930 3165O2 purity % - 99.5 99.5 99.5 100 100 100 100 100 100 100 100 43.2
klb/hr 0 1751 1166 1166 2374 2356 2523 2374 2374 2374 2392 1525 1190% 0.0 65.5 55.9 55.9 67.9 67.8 67.8 67.9 67.9 67.9 67.4 57.7 56.0
Recycle gas temperature F - 146 260 260 216 217 223 214 217 216 220 249 150Boiler Inlet O2 %, v 20.7 33.8 41.1 41.1 31 31.1 31.1 31 31 31 31.4 39.3 41.8Boiler Outlet O2 %, v 3.0 3.0 3.0 3.0 3.0 3.0 3.0 3.0 3.0 3.0 3.0 3.0 3.0
MM cf/hr 179 96 77 77 139 138 150 139 139 139 142 100 81klb/hr 3555 2675 2087 2087 3497 3474 3723 3497 3497 3497 3550 2644 2126
Adiabatic Temperature F 3685 4321 5104 5104 4196 4202 4208 4196 4196 4196 4243 5120 5120Equilibrium Temperature F 3552 3830 4161 4161 3770 3773 3775 3770 3771 3771 3792 4169 4155Gas Temp. to FSH F 2185 2185 2185 2185 2185 2185 2185 2185 2185 2185 2185 2185 2450Water temp. to evap. F 638 597 596 596 666 664 690 666 666 666 672 599 591UBC % 1.00 0.30 0.16 0.16 0.38 0.38 0.38 0.38 0.38 0.38 0.38 0.16 0.15Boiler Efficiency % 88.16 90.90 91.31 91.31 - - - - - - - - -Pipeline pressure psia 0 3000 3000 2000 3000 3000 3000 3000 3000 3000 3000 3000 3000Generated CO2 flow klb/hr 739 720 718 718 874 869 934 874 874 874 900 866 729CO2 purity %,v wet 14.0 77.5 71.3 74.2 75 74.9 74.9 75 75 75 74.8 70.8 76.5Removed CO2 flow klb/hr 0 720 718 718 874 869 934 874 874 874 900 866 729CO2 removal efficiency % 0 100 100 100 100 100 100 100 100 100 100 100 100CO2 purity % - 93.7 93.6 93.6 96.9 96.9 96.9 96.9 96.9 96.9 96.9 96.9 94.2Gross Power MW 476.2 476.2 486.4 486.4 519.7 515.8 520.3 519.3 520.0 519.8 521.8 519.5 488.7Auxiliary Power MW 46.0 36.6 38.1 38.1 43.0 42.8 44.0 43.1 43.0 43.0 43.4 41.6 42.5ASU power MW 0.0 67.7 67.6 67.6 -26.7 -22.0 -42.2 -24.3 -27.3 -27.1 -35.9 -26.6 32.0CO2 compression power MW 0.0 34.2 34.2 32.9 41.3 41.1 44.1 41.3 41.4 41.4 42.6 41.2 34.3Net Power MW 430.2 337.7 346.6 347.9 462.1 453.9 474.4 459.2 462.9 462.5 471.7 463.3 379.9Net Efficiency % 39.46 31.94 32.93 33.05 35.80 35.33 34.38 35.58 35.87 35.83 35.45 36.11 35.19Efficiency Drop % pts. - 7.5 6.5 6.4 3.7 4.1 5.1 3.9 3.6 3.6 4.0 3.3 4.3CO2 removal energy kWh/klbCO2 - 114 99 97 46 52 59 48 45 45 49 42 64
Recycle gas flow
Boiler outlet flue gas flow
52

4.2.2.3.1 Effect of O2 Recovery Efficiency (case 11 to 13)
As described in Section 4.2.2.1, shifting more duty to the GT will increase system efficiency. Increasing OITM O2 recovery efficiency reduces the required air flow rate and decreases the GT mass flow and power generated.
In Case-12 the O2 recovery is increased from 85% to 90.5%. As a result of high O2 recovery, less air is required to be fed to the system, and so less power is generated in the GT. This leads to a reduction of system efficiency from 35.8% to 35.3%.
In Case-11 and Case-12 the low-grade heat released from GT exhaust, flue gas cooling before CO2 compression, and CO2 compressor inter-stage cooling is recovered to heat the low-pressure feedwater. In Case-13, when the O2 recovery is reduced from 85% to 73%, more air has to be fed to OITM (4945 vs. 3945 klb/hr) and so more heat is required by the OITM. The system fires more coal (404 vs. 378 klb/hr) and as result, the system generates more low-grade heat than can be recovered, which results in an increase of GT exhaust temperature from 200ºF to 330ºF. This reduces the system efficiency even with increased extra power from the GT. It is clear that the two opposing effects, more GT power and more low grade heat from increased air flow, form a system with an optimum performance for a given air side pressure as shown by Figure 4.2.5, where the system efficiency is maximum when the O2 recovery is approximately 85%. Note that recovering additional low-grade heat as through the use of a high-pressure economizer will shift the optimum O2 recovery efficiency. As more of the low grade heat is recovered by the use of more complex heat integration schemes or by co-generation heat export, then the optimum O2 recovery efficiency is reduced and the maximum system efficiency is increased. Such a reduction in O2 recovery efficiency reduces the size of the OITM because of increased logarithm mean pressure difference (LMPD). Table 4.2.3 shows a comparison of different cases under the same airside pressure, including a case published by Alstom [7]. It is obvious that the higher is the O2 recovery efficiency, the lower is the LMPD, and the larger is the OITM size.
53

Figure 4.2.5 – Effect of OITM O2 Recovery Efficiency on Efficiency
34.0
34.5
35.0
35.5
36.0
70 75 80 85 90 95
O2 recovery, %
Efficiency, %
Table 4.2.3 - Effect of OITM O2 Recovery Efficiency on LMPD
Ca s e Al s t o m Ca s e - 1 1 Ca s e - 1 2 Ca s e - 1 3O2 r e c o v e r y , % 8 5 8 5 9 0 7 3
O2 t o b o i l e r , % 7 0 3 1 3 1 3 1L MPD 1 4 . 7 1 6 . 5 1 3 . 9 2 0 . 9
54

4.2.2.3.2 Effect of LMPD Across the Membrane (cases 14-16)
The performance of the OITM relies on the O2 partial pressure difference across the OITM membrane. Similar to the LMTD used in a heat transfer process, a LMPD is a key design parameter for a mass transfer process. The LMPD can be used to compare the design size of different options.
An increase in the O2 level to the boiler increases the sweep gas outlet O2 partial pressure resulting in a reduced LMPD as shown in Table 4.2.3 (compare Alstom to case-11). Similarly an increase in sweep gas total pressure reduces the LMPD as shown in Figure 4.2.6. The effect is fairly small because of the limited operating pressure variation of the sweep gas.
Figure 4.2.6 – Effect of Sweep Gas Pressure on LMPD
02468101214161820
0 5 10 15 20 25 30
Sweep gas pressure, psia
LMPD, psia
The air side pressure directly affects the OITM performance. Increasing the air side pressure (OITM operating pressure) will:
(1) Increase LMPD, and so reduce OITM size (2) Increase compressor discharge temperature (CDT), and require less heat
from the boiler (3) Reduce turbine exhaust temperature (TET), and so release less low grade
heat and reduce the optimum O2 recovery efficiency (4) Increase equipment thickness
55

In Case-14 the OITM operating pressure is raised from 200 psia to 250 psia with constant coal feed rate and furnace air heater duty. This 250 psia OITM pressure requires the compressor discharge pressure to be increased from 214 to 265 psia, which raises the compressor discharge temperature. Thus, for the same operating temperature the OITM needs less heat per unit mass of air, and so the air to the OITM is increased to balance the heat released from the boiler. Because the amount of the O2 required is fixed, the O2 recovery is adjusted for the increased air flow through the OITM. Figure 4.2.7 shows that raising the air side pressure from 200 psia to 250 psia results in a small reduction in system efficiency (from 35.8 to 35.6%) and an attendant small increase in the CO2 removal specific power penalty (from 46 to 48 kWh/klbCO2). The system efficiency decreases with increased OITM pressure because of less heat being carried to the OITM per unit air. However, due to the increased air flow to the OITM, the LMPD is increased from 16.5 to 24.9 psia, which results in a decrease in OITM size of 34%. Opposite to the case-14, cases 15 and 16 were run with reduced OITM pressures of 180 psia and 190 psia, respectively. As shown in Figure 4.2.7, lower OITM operating pressure (for a given operation temperature) increases system efficiency because more heat is transferred from the boiler to the OITM cycle per unit mass of air. However, as the OTM pressure is reduced the LMPD decreases requiring a larger OITM size. In this scenario, the oxygen recovery is adjusted to changes on the airside pressure, which results in an indirect relationship between system efficiency and the O2 recovery as shown in Figure 4.2.8. Figure 4.2.8 presents a linear correlation for which each percent change in O2 recovery causes a 0.03 percent point change in efficiency. Figure 4.2.9 shows the effect of OITM pressure on LMPD when the O2 recovery efficiency is constant and O2 flow rate is variable (as in Figure 4.2.7). This is compared in Figure 4.2.9 with the effect of OITM on LMPD when the O2 flow rate is constant and the O2 recovery efficiency is variable (as in Figure 4.2.7). The selection of the OITM operating pressure is a trade-off between the cost of OITM and the system efficiency. If the OITM cost is not too high in future commercial application, the optimum OITM operating pressure will be relatively low. Furthermore, a higher OITM operation temperature will be better for the system efficiency. However, the magnitude of this temperature is constrained by material limitations.
56
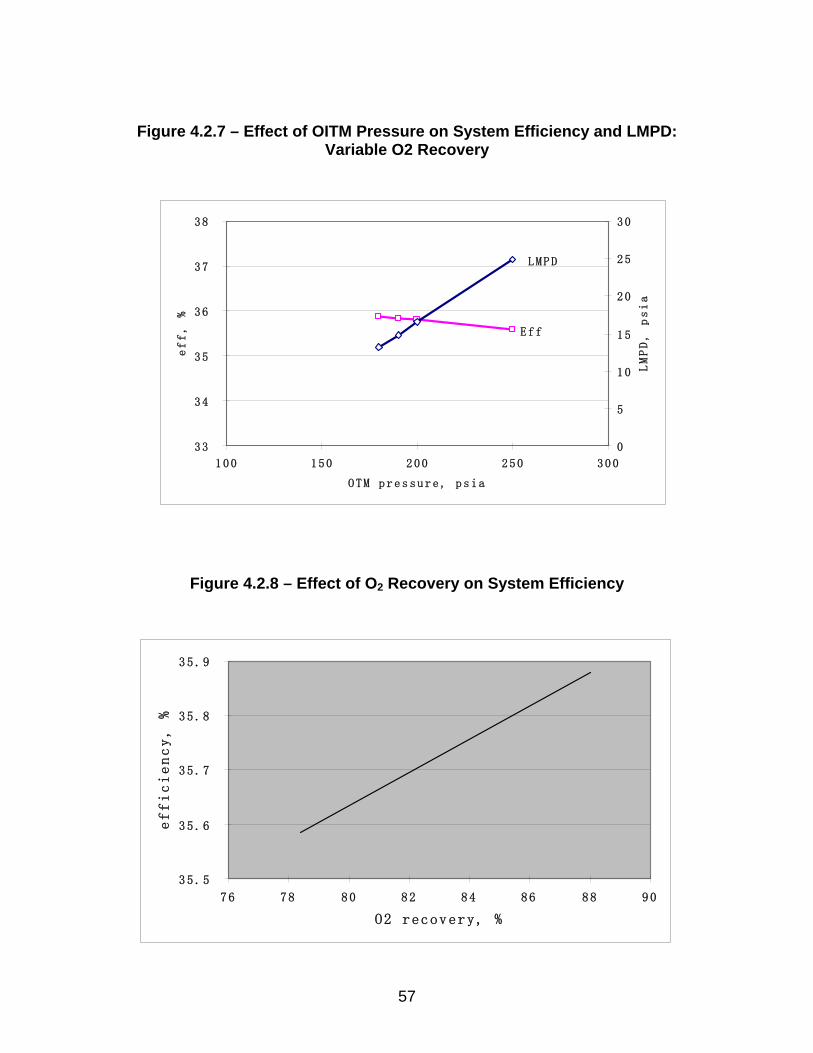
Figure 4.2.7 – Effect of OITM Pressure on System Efficiency and LMPD:
Variable O2 Recovery
33
34
35
36
37
38
100 150 200 250 300
OTM pressure, psia
eff, %
0
5
10
15
20
25
30
LMPD, psia
L M P D
Eff
Figure 4.2.8 – Effect of O2 Recovery on System Efficiency
35.5
35.6
35.7
35.8
35.9
76 78 80 82 84 86 88 90
O2 recovery, %
efficiency, %
57

Figure 4.2.9 – Effect of OITM Pressure on System Efficiency and LMPD: Constant and Variable O2 Recovery
0
5
10
15
20
25
30
35
100 150 200 250 300 350 400
air pressure, psia
LMPD, psia
O2 recovery constant, O2 flow variable
O2 recovery variable, O2 flow constant
4.2.2.3.3 Effect Of Compressor Discharge Temperature (case 17) Another way to boost the system efficiency is to transfer more heat to the gas turbine by increasing the temperature difference between the compressor discharge temperature (CDT) and the turbine inlet temperature (TIT). Increasing the TIT results in an increase in OITM operating temperature, which may be restricted due to material limitations. Without increasing the pressure, the increase of TIT will increase turbine exhaust temperature, which results in more low-grade heat that can be recovered in the HRSG. Another approach is to reduce CDT by the use of a compressor with inter-stage cooling. This will reduce compressor power, and let more heat be transferred from the boiler to the turbine, but it releases more low-grade heat from inter-stage cooling. If this heat cannot be recovered, system efficiency would be reduced. As discussed before, for the present configuration and integration, there was no margin to recover more low-grade heat. Therefore the inter-stage cooler will be applicable only for co-generation of heat and power, where low-grade heat could be recovered by low-pressure steam export.
Case-17 employs an alternative method to reduce compressor power by inter-stage water quench to avoid the need for low-grade heat recovery. This quench (20 klb/hr of water) reduced the CDT from 743 to 698ºF, and therefore more heat flowed from the boiler to the gas turbine. As a result, the coal to boiler increased from 377.7 to 389.4 klb/hr, and the corresponding air to the OITM increased from 3945 to 4067 klb/hr (for the same OITM O2 recovery efficiency). The power from
58
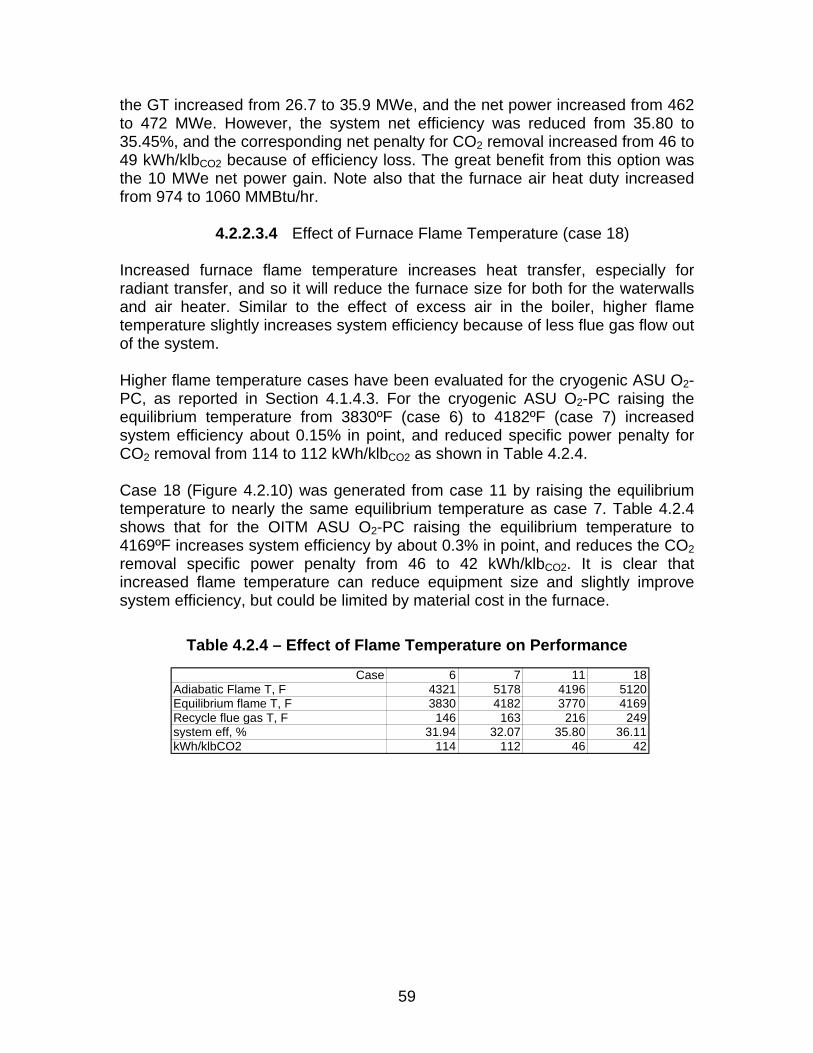
the GT increased from 26.7 to 35.9 MWe, and the net power increased from 462 to 472 MWe. However, the system net efficiency was reduced from 35.80 to 35.45%, and the corresponding net penalty for CO2 removal increased from 46 to 49 kWh/klbCO2 because of efficiency loss. The great benefit from this option was the 10 MWe net power gain. Note also that the furnace air heat duty increased from 974 to 1060 MMBtu/hr.
4.2.2.3.4 Effect of Furnace Flame Temperature (case 18) Increased furnace flame temperature increases heat transfer, especially for radiant transfer, and so it will reduce the furnace size for both for the waterwalls and air heater. Similar to the effect of excess air in the boiler, higher flame temperature slightly increases system efficiency because of less flue gas flow out of the system. Higher flame temperature cases have been evaluated for the cryogenic ASU O2-PC, as reported in Section 4.1.4.3. For the cryogenic ASU O2-PC raising the equilibrium temperature from 3830ºF (case 6) to 4182ºF (case 7) increased system efficiency about 0.15% in point, and reduced specific power penalty for CO2 removal from 114 to 112 kWh/klbCO2 as shown in Table 4.2.4. Case 18 (Figure 4.2.10) was generated from case 11 by raising the equilibrium temperature to nearly the same equilibrium temperature as case 7. Table 4.2.4 shows that for the OITM ASU O2-PC raising the equilibrium temperature to 4169ºF increases system efficiency by about 0.3% in point, and reduces the CO2 removal specific power penalty from 46 to 42 kWh/klbCO2. It is clear that increased flame temperature can reduce equipment size and slightly improve system efficiency, but could be limited by material cost in the furnace.
Table 4.2.4 – Effect of Flame Temperature on Performance Case 6 7 11 18
Adiabatic Flame T, F 4321 5178 4196 5120Equilibrium flame T, F 3830 4182 3770 4169Recycle flue gas T, F 146 163 216 249system eff, % 31.94 32.07 35.80 36.11kWh/klbCO2 114 112 46 42
59
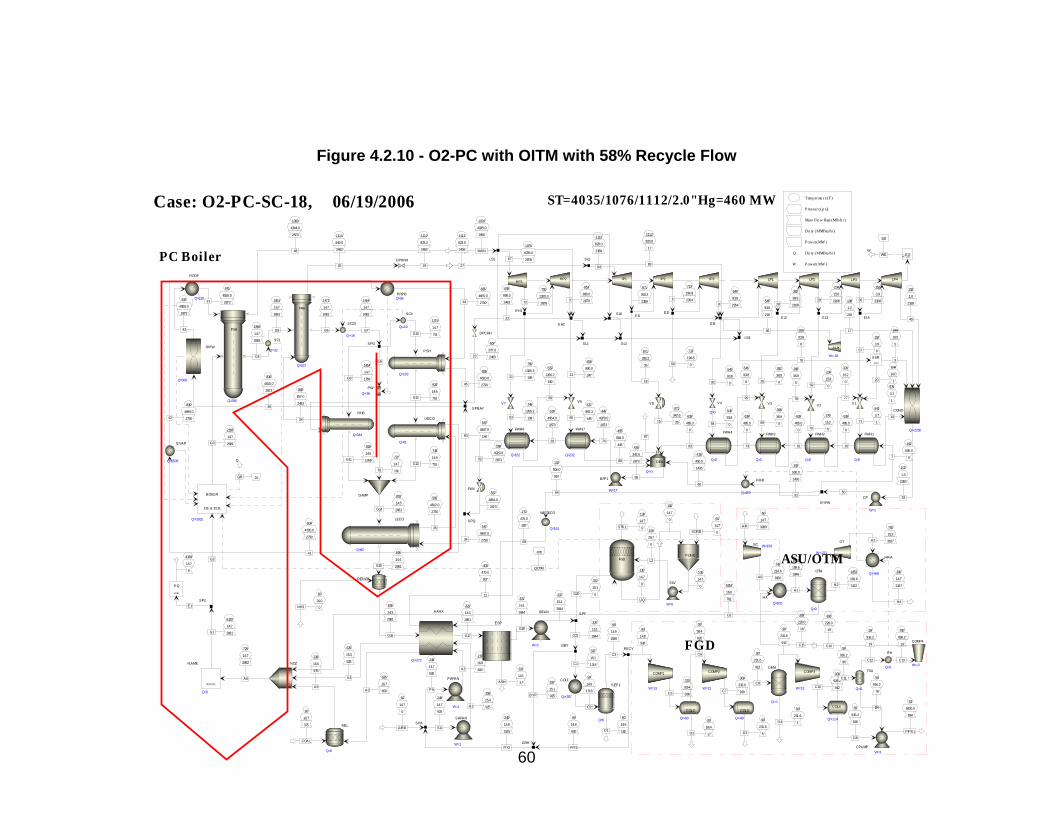
Figure 4.2.10 - O2-PC with OITM with 58% Recycle Flow
60
726
14.7
2682
A6
5120
14.7
2681G1
236
16.6
975
A5
625
15.3
925
A4
1652
16.0
781
O2
2185
14.7
2681G3
970
4520.0
287347
1866
14.7
2681
G4
1083
4344.0
2873
48
882
857.0
2483
24
1831
14.7
2681
G5
1472
14.7
2681
G6
1113
849.0
2483
26
1454
14.7
2681
G7
1454
14.7
1769G8
G9
934
14.6
751G12
592
4812.0
2730
35
748
14.6
751G13
604
4795.0
2730
41
1374
14.7
751G10
835
4655.0
273044
855
4620.0
273045
657
877.0
248323
829
14.6
1769G11 727
14.7
16181
801
14.5
2681G14
567
4847.0
273034
695
14.4
2681G15
249
14.7
600
PA
278
16.9
600A2
695
14.3
2681
G16
258
15.4
925A1
270
470.0
957
68
625
16.7
600A3
321
14.3
2681
G17
400
470.0
957
1260
20.0
0NH3
321
14.1
2644
G18
321
14.1
37ASH
337
15.1
2644
337
15.1
0G20
100
29.7
0
L2
100
14.7
0
130
14.7
0STK1
130
14.7
0
LIQ
60
14.7
0SORB
100
14.7
0
249
14.7
925
SA
249
14.8
1525
RY2
60
14.7
0
AIRB
E1
G2
-970
QOTM
20QB
Q
60
16.7
375
COAL
337
15.1
2644G21
337
15.1
1718C1
90
14.9
1718
C2
90
14.9
1536
C3
90
14.9
182D1
90
14.8
936
90
14.8
600
RY1
337
15.1
925BYP
60
14.7
3930AIR
743
214.6
3930A0
393
220.0
18
C15
1652
199.6
3948
H1
310
59.4
936C5
90
58.4
920
C6
309
233.6
920C7
90
231.6
912
308
926.2
912C10
90
231.6
913
C8
90
231.6
1D4
90
58.4
17D2
90
231.6
6D3
700
896.2
19
C13
393
220.0
19
C14
56
916.2
96
C11
56
916.2
816
D5
56
916.2
78
D663
3000.0
894
PIPEL
1652
191.6
3167H2
782
15.3
3167H3
200
14.7
3167
H4
56
916.2
19
C12
653
890.0
26793
1112
823.0
2389
84
871
353.2
2389
713
194.8
23546
540
93.8
23548
382
38.9
216828
234
15.8
216829
152
3.9
216830
102
1.0
2168
40
502
WEW
658
890.0
2483
22
658
890.0
24711
713
194.8
056
1112
823.0
17
88
545
93.8
092
545
93.8
219
96
382
38.9
025
234
15.8
059
152
3.9
057
1076
4035.0
2950
MAIN 1076
4035.0
287867
644
10.0
5
9
579
3.7
1
14
108
1.2
219
17
102
1.0
2393
53
654
93.8
6
76
644
10.0
120
871
353.2
35
18
871
342.6
3515
750
1305.3
19921
746
1266.2
19963
529
1266.2
199
89
527
863.3
44565
545
93.8
0
95
398
36.9
069
398
36.9
0
78
376
15.2
070
376
15.2
0
77
641
3.7
171
50
639
485.0
0
93
455
863.3
445
80
418
450.0
1436
66
430
342.6
2873
86
87
445
4979.0
2873
74102
500.0
07
639
485.0
0
16
639
485.0
0
61
639
485.0
0
73
519
4954.0
2873
83568
4929.0
287332
4169
14.7
0
830
4690.0
273042
836
4610.0
2873
46
925
4555.0
2873
43
567
4864.0
2873
567
4847.0
14460
1112
823.2
2483
19
102
500.0
957
64
102
500.0
1436
52
750
1305.3
287872
1112
823.0
2406
27
545
93.8
094
RSTOIC
FLAME
Q=0
NOZ
FSH
Q=296
FRH
Q=321
SPG
UECO
Q=41
PSH
Q=103
RHB
Q=344
DAMP
LECO
Q=82
SC1
Q=-32
SC23
Q=-16
SC4
Q=-19
PWQ=-36
PAFAN
W=1
AAHX
Q=-272
DENOX
ESP
IDFAN
W=3
PREC
SLV
W=0
FGDPOND
SAFAN
W=1
SPA
SP1
HEA TER
BOILER
Q=-2931
MILL
Q=0
SPF
COL1
Q=-287
SEP1
Q=0
RECY
GRH
GC W=194
HXQ=970
COMP1
W=13
COMP2
W=13
GBY
COMP3
W=13
DEM
Q=-1
COL2
Q=-60
COL3
Q=-48
COMP4
W=-0
COL4
Q=-114
CPUMPW=3
OTM
Q=0
GT
W=-221HR-A
Q=-466
RH
Q=3TSA
Q=-6
HP2 IP1 IP2 IP3 LP1 LP2 LP3 LP4
W M ULTEG
EH2
EI2
EI3EL2 EL3 EL4
LS1
COND
Q=-2250
FSPLI T
SSR
VD
EI1
SL3
V7 V6 V3 V2 V1
CP
W=1
DEA
Q=-0
BFP1
W=17
FWH1
Q=0
FWH2
Q=0
FWH3
Q=0
FWH7
Q=232
FWH8
Q=162
SL2
RGI BBS
EQ
EVAP
Q=1508
DIVW
Q=366
ROOF
Q=135PRPBQ=36
FWV
SPQ
SPRAY
DPHRH
DPCRH
BYFW
WETECO
Q=161
HP1
EH1SL6
SL5
FWH4
Q=0
V4
Q=0
AUX
W=-18
LS4
HR-B
Q=463
Temperatu re (F)
Pressure (p si)
Mass Flo w Rate (Mlb/h r )
Du ty (MMBtu/h r)
Pow er(MW )
Q Du ty (MMBtu/h r)
W Pow er(MW )
Case: O2-PC-SC-18, 06/19/2006 ST=4035/1076/1112/2.0"Hg=460 MW
FGD
PC Boiler
ASU/OTM
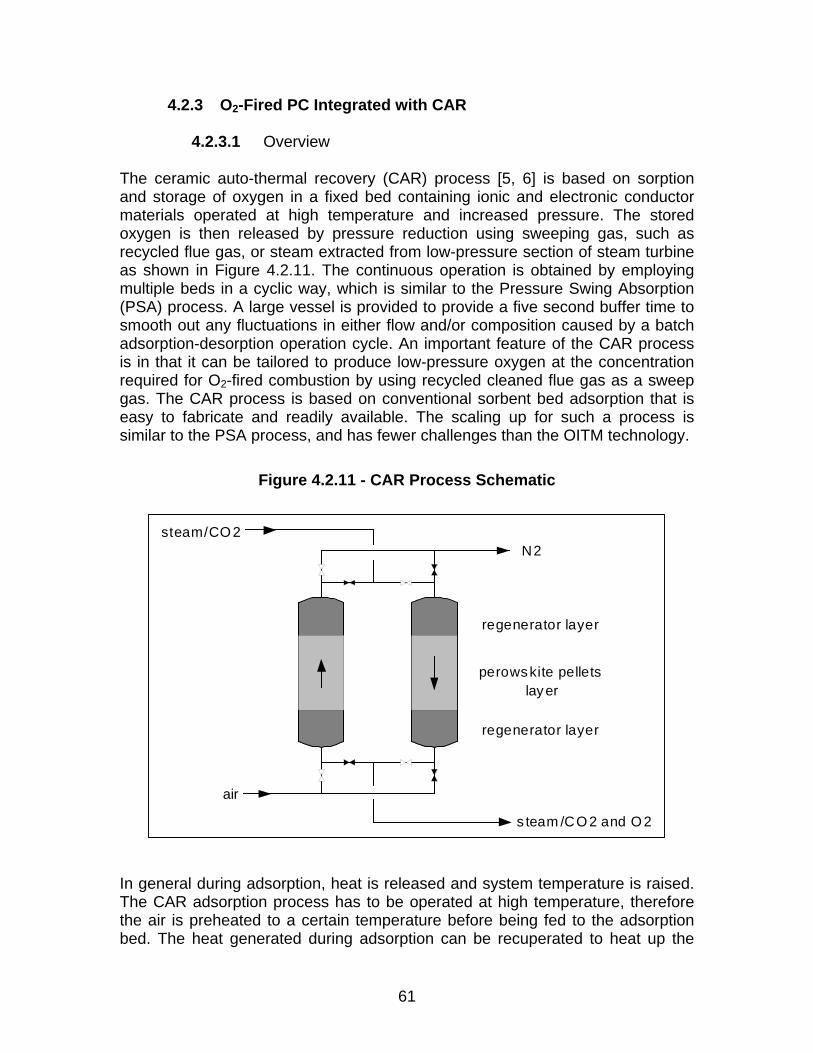
4.2.3 O2-Fired PC Integrated with CAR
4.2.3.1 Overview The ceramic auto-thermal recovery (CAR) process [5, 6] is based on sorption and storage of oxygen in a fixed bed containing ionic and electronic conductor materials operated at high temperature and increased pressure. The stored oxygen is then released by pressure reduction using sweeping gas, such as recycled flue gas, or steam extracted from low-pressure section of steam turbine as shown in Figure 4.2.11. The continuous operation is obtained by employing multiple beds in a cyclic way, which is similar to the Pressure Swing Absorption (PSA) process. A large vessel is provided to provide a five second buffer time to smooth out any fluctuations in either flow and/or composition caused by a batch adsorption-desorption operation cycle. An important feature of the CAR process is in that it can be tailored to produce low-pressure oxygen at the concentration required for O2-fired combustion by using recycled cleaned flue gas as a sweep gas. The CAR process is based on conventional sorbent bed adsorption that is easy to fabricate and readily available. The scaling up for such a process is similar to the PSA process, and has fewer challenges than the OITM technology.
Figure 4.2.11 - CAR Process Schematic
air
steam/CO2N2
s team /CO2 and O2
regenerator layer
regenerator layer
perowskite pelletslayer
In general during adsorption, heat is released and system temperature is raised. The CAR adsorption process has to be operated at high temperature, therefore the air is preheated to a certain temperature before being fed to the adsorption bed. The heat generated during adsorption can be recuperated to heat up the
61

fresh air to reduce heat loading. For this purpose, a recuperator is employed to transfer heat between exhaust oxygen depleted air and the fresh air, where the heat generation during adsorption raises the exhaust air temperature. As result, the fresh air needs less preheating (i.e. 1020ºF) for the CAR process, compared to 1650ºF for the OITM process. On the other hand, the desorption process is associated with heat absorption, where heat has to be transferred to the bed during oxygen release. This is done by direct injection of natural gas into bed to combust with oxygen and by pre-stored heat in the sorbent bed during adsorption. The CAR process is so designed that it also stores the energy in the bed during the heat release in the adsorption cycle and releases this heat during the stripping cycle, by means of installation of inert layers on both ends of sorbent bed for heat storage. In this so called “auto-thermal recovery”, more heat is stored in bed, less heat is carried out by oxygen-depleted air, and less heat is required from fuel combustion to strip oxygen. High oxygen concentration can be obtained by steam striping providing that the steam is condensed out downstream. Oxygen concentration is limited to about 30-40% if the flue gas is applied as a sweep gas. As reported in the BOC study [5] with steam as sweeping gas, the air-to-steam molar ratio is about 2.66 with O2 recovery over 90%, which leads to an oxygen concentration in the sweeping gas of about 33-36%v before steam condensing. Simulated integration of the CAR process to the O2-PC has been reported by BOC to determine the technical and economical feasibility [5]. The air-fired reference plant is an existing ultra-supercritical lignite-fired 865 MWe Lippendorf power plant near Leipzig, Germany. A simulation of an oxyfuel power plant with cryogenic air separation was employed for comparison. The same plant was then applied for integration study with CAR process, where low-pressure steam extracted from steam turbine was applied as a sweep gas. Table 4.2.5 summarizes the key results.
Table 4.2.5 - Comparison for CAR with Cryogenic ASU
Case Air ASU CARNet Power, MWe 865 687 726Net efficiency, %(LHV) 42.6 33.3 34.0Efficiency drop, % point - 9.3 8.6
Comparing the CAR to the cryogenic process, the efficiency drop reduced from 9.3 to 8.6% points, and the net power increased from 687 to 726 MWe. As reported, it is clear from the results of study that the steam consumption is a critical variable for this option. The steam extraction required for oxygen stripping is about 200 kg/s in comparison with the main steam flow as 692 kg/s. The reason recycled flue gas was not used as sweep gas was that the flue gas has to be cleaned up to avoid any contaminates to the sorbent bed, and the
62

effects of contaminates have not yet been studied in detail. In general, to be economic, recycle gas clean up should be avoided because the clean gas will be sent back to boiler, where it mixes with combustion gases to become dirty gas again. Optimally, the gas clean up process should be applied to the flue gas exiting from system and flowing to the CO2 plant. Moreover, this stream has much less flow to be treated than does the recycled flue gas. Since the CAR process is based on swings in the partial pressure of oxygen, it will be affected by pressure, and LMPD (logarithmic mean pressure difference). Increased adsorption pressure will enhance oxygen adsorption from air, and a low desorption pressure will favor adsorbed oxygen release. However too high a pressure will require more power for air compression. If steam is used as a sweep gas, heat carried by the sweep gas can be recovered through feedwater heating during steam cooling and condensing. If flue gas is used as a sweep gas, hot sweep gas can be directly fed to boiler. In order to explore the advantage of integration with CAR process for O2-fired combustion, an Aspen simulation has been made for the CAR process operated with recycled flue gas sweep gas. The difference in principle between steam and flue gas sweep gases is their pressure ratios, where steam extracted at 1.6 bar could continuously expand to a pressure as low as 0.038 bar to generate more power with a pressure ratio of 1.6/0.038, while the flue gas has to be compressed from about 1.0 bar to 1.6 bar to consume power with pressure ratio as 1.6/1.0. Thus, the substitution of flue gas by extracted steam reduces power because the low pressure ratio of the flue gas is replaced by the high pressure ratio of steam for the same amount of gas volumetric flow. The reduced power can be calculated by difference between power from steam expansion and power for recycle gas compression, without including the changes in auxiliary power and low grade heat integration. The net result is shown by Table 4.2.6.
Table 4.2.6 – Comparison for CAR Using Different Sweep Gases
Oxidant AirAir Separation Method - Cryo CAR CARSweep Gas - - steam flue gasNet Power, MWe 865 687 726 767Net Efficiency, % (LHV) 42.6 33.3 34.0 35.9Efficiency Drop, % point - 9.3 8.6 6.7
O2
As can be seen in Table 4.2.6, the system efficiency increases about 1.9% points when steam is replaced by recycled flue gas as the sweep gas. As compared with the cryogenic ASU, the CAR process with gas recycle sweep gas has an increased system efficiency of 2.6% in points, which is close to 3.2% points achieved by the OITM. It is obvious from the standpoint of system efficiency that the future of the CAR process is to use recycle flue gas as a sweep gas.
63
Note that in the CAR process, natural gas is fired to provide a portion of the heat for stripping out the adsorbed oxygen from sorbent bed, which is similar to the gas absorption-regeneration cycle. Because of auto-thermal recovery process, the ratio of energy input from the natural gas to coal is only about 3.2%, which is much less than the heat requirement by the OITM process.
4.2.3.2 Optimized Integration of CAR in O2-PC Advanced oxygen separation CAR process has been integrated into the oxygen fired PC as shown in the Figure 4.2.12 schematic. A multi-bed adsorption-desorption batch operation cycle is simulated by a quasi-continuous operation of moving bed system, where the oxygen sorbent is circulated between two beds. The Aspen model of the O2-PC CAR power plant is presented in Figure 4.2.13. Flue gas, instead of steam extracted from steam turbine, is used as a sweep gas to strip out oxygen from desorption bed. Note that flue gas contains many contaminants such as fly ash, SOx, NOx, etc. that may be harmful to the perovskite sorbents used in the CAR process and future experimental studies will be required to quantify this effect. The flue gas from the boiler transfers heat to the oxygenated flue gas in an air-to-air heat exchanger and then is further cooled down to 150ºF by feedwater economizers. After cooling, the flue gas is boosted to a pressure to overcome the pressure drop across the CAR oxygen desorption equipment. Exit gas from desorption bed, containing about 25-45% of oxygen, is then cooled down to 280ºF through the sweep gas recuperator. This oxygen containing flue gas is then sent to air-to-air heat exchanger to be heated up to 625ºF, and then fed to boiler. Air is compressed to a pressure of 30 psia and then fed to the adsorption bed after pre-heating in the air recuperator. About 90% of O2 in the air is adsorbed by solids in the bed. The heat released from adsorption increases the system temperature. Adsorption bed exit gas or vitiated air is cooled down to 280ºF in the air recuperator before being discharged to the stack. The solids circulated between two the moving beds adsorb and release oxygen nearly reversibly. The system net efficiency for the CAR integrated with the O2-PC power plant is 35.2%. Heat input from natural gas is about 2.7% of the total heat input. Table 4.2.7 lists a comparison among different air separation technologies in efficiency drop and CO2 energy removal penalty. OITM has less energy penalty than CAR due to the process gain associated with the gas turbine expander (see 4.2.2.1).
Table 4.2.7 – O2 PC Efficiency with Different O2 Separation Techniques Air separation method Cryo OITM CAR
Efficiency Drop % pts. 6.5 3.3 4.3CO2 removal energy kWh/klbCO2 99 42 64
64

Figure 4.2.12 – Integration of CAR Process into O2-PC
65

Figure 4.2.13 - O2-PC with CAR
66
457
14.7
2157
A6
5120
14.7
2156G1
247
16.4
862A5
625
16.5
1294
A4
2450
14.7
2156G3
974
4462.0
2950
47
2057
14.7
2156
G4
1083
4286.0
2950
48
2022
14.7
2156
G5
869
857.0
2406
49
1559
14.7
2156
G6
1113
849.0
2406
26
1353
14.6
2156G11
837
4612.0
280244
1145
14.6
2156G12
863
4527.0
2802
45
1508
14.7
2156
G8
820
867.0
204541
910
857.0
2045
24
569
4822.0
2802
34
816
14.6
2156G13
695
14.5
2156G15
591
4787.0
2802
35
150
14.9
1190
G22
242
23.0
1190G23
695
14.4
2156G16
254
206.6
111568
280
16.5
1849
G28
290
14.4
2156
G17
320
156.6
1115108
625
16.5
1849G29
60
20.0
0
NH3
290
14.2
2126
G18
290
14.2
30ASH
303
15.1
2126
G19
303
15.1
0
G20
97
29.7
0
L2
98
14.7
0
L1
123
14.7
0STK1
123
14.7
0
LIQ
60
14.7
0SORB
100
14.7
0
625
16.5
555A3
E1
G2
16QB
Q
60
16.7
308
COAL
303
15.1
842
C1
303
15.1
1284
G21
90
14.9
842
C2
90
14.9
781
C3
90
14.9
61D1
60
14.7
3165AIR
203
30.0
3165
A1
310
59.5
781C5
90
58.5
772
C6
312
234.1
772C7
90
232.1
769
C9
323
928.5
769C10
90
232.1
770
C8
90
232.1
1D4
90
58.5
9D2
90
232.1
2D3
918.5
0
C11
918.5
0
PIPEG
55
918.5
769
D5
98
3000.0
769
PIPEL
657
877.0
2045
12
PV1
1022
29.0
3165
A2
PV2
1124
22.5
2510
A8
PV3
PV4
995
17.5
1849
G36
PV5
59
300.0
4NG
986
22.0
1190
G24280
21.5
2510VA
280
16.5
1849
G27
150
14.9
94110
653
890.0
26793
1112
823.0
2389
84
871
353.2
2389
5
713
194.8
23016
540
93.8
21908
382
38.9
194228
234
15.8
189329
152
3.9
183130
102
1.0
1791
40
471
WEW
658
890.0
2406
22
658
890.0
32311
713
194.8
11056
1112
823.0
17
88
545
93.8
6292
545
93.8
219
96
382
38.9
4925
234
15.8
6259
152
3.9
4057
1076
4035.0
2950
MAIN 1076
4035.0
287867
644
10.0
5
9
112
3.7
215
14
108
1.2
219
17
102
1.0
2229
53
654
93.8
6
76
644
10.0
120
712
181.2
11015
871
353.2
8818
750
1305.3
19921
746
1266.2
19963
532
1266.2
199
89
527
863.3
52265
435
863.3
522
80
430
342.6
61066
268
93.8
62
95
262
36.9
11169
221
36.9
111
78
214
15.2
17370
156
15.2
173
77
150
3.7
21571
50
316
191.6
1115
93
396
342.6
610
52 374
181.2
295086
87
386
4979.0
2950
85102
236.6
11157
146
221.6
1115
16
211
206.6
1115
61
258
191.6
1115
73
425
4954.0
2950
74
522
4929.0
2950
83
569
4904.0
2950
32
4155
14.7
0
E2
812
4682.0
280242
1021
4472.0
280281
832
4647.0
2802
43
569
4839.0
2950
33
569
4822.0
147
60
1112
823.2
2406
19
657
877.0
240623
102
236.6
1115
64
750
1305.3
287872
1112
823.0
2406
27
545
93.8
6294
657
877.0
36155
RSTOIC
FLAME
Q=0
NOZ
FSH
Q=289
FRH
Q=329
PSH
Q=138
RHB
Q=106
LECO
Q=74
SC1
Q=-25
SC23
Q=-36
PAFAN
W=7
AAHX
Q=75
DENOX
ESP
IDFAN
W=2
PREC
SLV
W=0
FGDPOND
SPA
SP1
HEATER
BOILER
Q=-2088
MILL
Q=0
SPF
COL1
Q=-111
SEP1
Q=0
COMP
W=32
COMP1
W=11
COMP2
W=11
COMP3
W=10
DEM
Q=-1
COL2
Q=-48
COL3
Q=-42
COMP4
COL4
Q=-116CPUMP
W=3
RHA
Q=210
ADS
Q=-1
SPVASPO
DES
Q=-1
HX
Q=883
COOL
Q=-142
HP2 IP1 IP2 IP3 LP1 LP2 LP3 LP4
WMULT
EG
EH2
EI2
EI3EL2 EL3 EL4
LS1
COND
Q=-1897
FSPLIT
SSR
VD
EI1
SL3
V7 V6 V5 V3 V2 V1
CP
W=1
DEA
Q=-0
BFP1
W=18
FWH1
Q=49
FWH2
Q=72
FWH3
Q=53
FWH6
Q=118
FWH7
Q=311
FWH8
Q=162
SL2
RGIBBS
EQ
EVAP
Q=1485
DIVW
Q=479
ROOF
Q=134PRPBQ=36
FWV
SPQ
SPRAY
DPHRH
DPCRH
BYFW
WETECO
Q=170
HP1
EH1SL6
SL5
FWH4
Q=66
V4
Q=0
AUX
W=-18
LS4
B1
B2
ECOW
Q=0
Temperature (F)
Pressure (psi)
Mass Flow Rate (Mlb/hr)
Duty (MMBtu/hr)
Power(MW)
Q Duty (MMBtu/hr)
W Power(MW)
ST=4035/1076/1112/2.0"Hg=460 MWCase: O2-PC-SC-19, 07/19/2006
FGD
PC Boiler
ASU/CAR
CO2
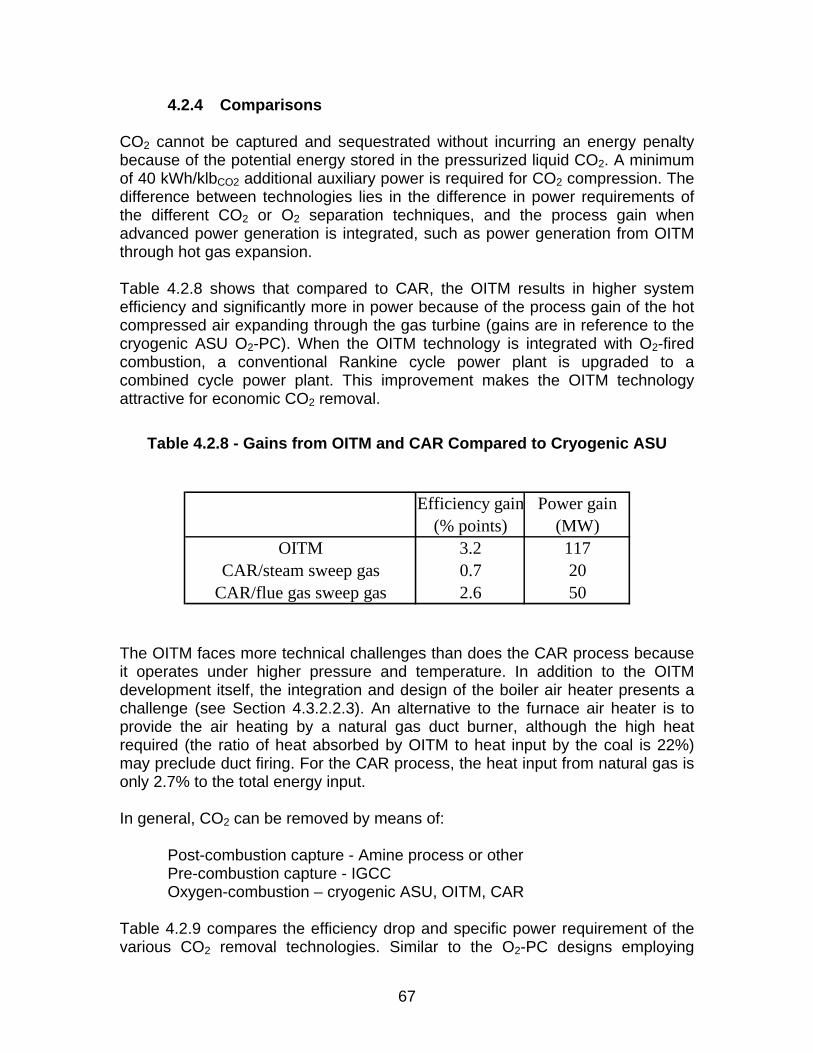
4.2.4 Comparisons CO2 cannot be captured and sequestrated without incurring an energy penalty because of the potential energy stored in the pressurized liquid CO2. A minimum of 40 kWh/klbCO2 additional auxiliary power is required for CO2 compression. The difference between technologies lies in the difference in power requirements of the different CO2 or O2 separation techniques, and the process gain when advanced power generation is integrated, such as power generation from OITM through hot gas expansion. Table 4.2.8 shows that compared to CAR, the OITM results in higher system efficiency and significantly more in power because of the process gain of the hot compressed air expanding through the gas turbine (gains are in reference to the cryogenic ASU O2-PC). When the OITM technology is integrated with O2-fired combustion, a conventional Rankine cycle power plant is upgraded to a combined cycle power plant. This improvement makes the OITM technology attractive for economic CO2 removal.
Table 4.2.8 - Gains from OITM and CAR Compared to Cryogenic ASU
Efficiency gain Power gain(% points) (MW)
OITM 3.2 117CAR/steam sweep gas 0.7 20
CAR/flue gas sweep gas 2.6 50
The OITM faces more technical challenges than does the CAR process because it operates under higher pressure and temperature. In addition to the OITM development itself, the integration and design of the boiler air heater presents a challenge (see Section 4.3.2.2.3). An alternative to the furnace air heater is to provide the air heating by a natural gas duct burner, although the high heat required (the ratio of heat absorbed by OITM to heat input by the coal is 22%) may preclude duct firing. For the CAR process, the heat input from natural gas is only 2.7% to the total energy input. In general, CO2 can be removed by means of: Post-combustion capture - Amine process or other Pre-combustion capture - IGCC Oxygen-combustion – cryogenic ASU, OITM, CAR Table 4.2.9 compares the efficiency drop and specific power requirement of the various CO2 removal technologies. Similar to the O2-PC designs employing
67

cryogenic ASU and OITM, the O2-PC CAR power plant is designed to include liquid CO2 pumping, wet-end heat recovery, increased flame temperature, and hot gas recycle.
Table 4.2.9 – Comparison of CO2 Removal Technologies
Boiler Type IGCCRemoval Technique post comb. pre comb.
cryo. ASU OITM CAREfficiency drop % ponts 11.6 6.5 3.3 4.3 7.2CO2 removal penalty kWh/klbCO2 188 99 42 64 116
PCO2 fired
From Table 4.2.9, it is clear that the O2-fired PC integrated with advanced oxygen separation technology has significant advantages over both the post combustion and pre-combustion CO2 techniques since the separation of oxygen from air is a physical process and involves less energy than the chemical separation of CO2 from flue gas or syngas.
68

4.3 Furnace and Heat Recovery Area Design and Analysis
4.3.1 Furnace Design and Analysis
4.3.1.1 FW-FIRE Computer Program Description
FW-FIRE (Fossil fuel, Water-walled Furnace Integrated Reaction and Emission Simulation) simulates furnace combustion, heat transfer and pollutant formation based on fundamental principles of mass, momentum, and energy conservation [9]. FW-FIRE is an extended and enhanced version of PCGC-3, which was developed over a period of ten years by the Advanced Combustion Engineering Research Center (ACERC), operated jointly by Brigham Young University and the University of Utah. The FW-FIRE computer program incorporates the latest state-of-art coal combustion/gasification, pollutant formation, and physical analysis techniques based on extensive empirical research. The FW-FIRE code performs general three dimensional multiphase gas combustion steady state analysis of reactive fluid flows. The program is fully capable of analyzing gas-fired and coal-fired boilers although FW-FIRE was initially tailored for pulverized coal combustion and gasification. The FW-FIRE program models the gas flow field as a three dimensional (Cartesian or cylindrical) turbulent reacting continuum that is described locally by the Newtonian form of the Navier-Stokes equations coupled with the energy equation and other appropriate constitutive equations. These equations are solved in Eulerian framework to predict gas properties such as pressure, temperature, velocity, and pollutants and other species concentrations. The Reynolds stress terms, which result from Favre-averaging of the conservation equations, are approximated using the Boussinesq assumption and effective eddy viscosity. The value of the eddy viscosity and subsequent closure of the turbulence equations is made using either a linear or non-linear k-ε two-equation model. The effects of turbulence of the flow field on the combustion reactions are included. The turbulent flow field is also coupled with the combustion chemistry. Since gaseous reactions are limited by mixing rates and not reaction kinetics, the process chemistry is calculated using locally instantaneous equilibrium based on the degree of mixing of the species. Rate constants for processes such as devolatilization (two step process) and char oxidation are built-in to the program based on empirical testing. A Lagrangian model of the particle conservation equations is used to predict particle transport by characterizing the particle field as a series of discrete particle trajectories through the gas continuum. Particles interact with the gas
69

field via mass, momentum, and energy exchange. Particle properties such as burnout, velocities, temperatures, and particle component compositions are obtained by integrating the governing equations along the trajectory paths. The program possesses the capability to input a particle size distribution and chemical composition. In a pulverized coal flame, the radiation field is a multi-component, non-uniform, emitting, absorbing, gas-particle system. The coal particles cause anisotropic and multiple scattering, and the flame is surrounded by non-uniform, emitting, reflecting, absorbing surfaces. The radiation field calculations are based on an energy balance on a beam of radiation passing through a volume element containing the absorbing-reflecting-emitting medium. An Eulerian framework using a discrete-ordinates approach is used to model this process. Heat transfer via radiation and convection to waterwall and tube banks is determined by specifying a local wall temperature and emissivity. The set of non-linear differential equations is discretized and combined by a upwind and weighted central-differencing scheme. The resulting gas flow field finite difference equations are solved using variations of the SIMPLE/SIMPER algorithm. FW-FIRE contains a sub-model for the prediction of nitrogen pollutant emissions. This sub-model has the capability of predicting both fuel and thermal NOx formation. Fuel NO formation can proceed directly to N2 and NO (such as in the case of char) or through HCN and NH3 which are oxidized to form NO and reduced to N2 (such as in the case of volatiles). Global reaction rates are based on work by de Soete and Bose. Thermal NO formation is governed by the extended Zel=dovich mechanism.
4.3.1.2 Model Geometry A simulation was made for both the reference air-fired case and for the oxygen-fired case. The FW-FIRE model simulates the furnace, in height from the bottom of the hopper to the roof, in depth from the front wall to the rear wall, and in width from the left side wall to the right side wall. Furnace partial division walls are also included in the model. Finer meshes are used to model the burners and over-fire air (OFA) ports. The air-fired model contains 528,840 (117x113x40) nodes and is shown in Figure 4.3.1. The oxygen-fired model contains 484,160 (136x89x40) nodes and is shown in Figure 4.3.2.
70

4.3.2 Boundary Conditions Boundary conditions are based on ASPEN simulations of the power plant [Sect. 4.1 and Sect. 4.2]. The air-fired, oxygen-fired with ASU and oxygen-fired with OITM ASPEN reference cycle diagrams are presented in Figure 4.1.1, Figure 4.1.9, and Figure 4.2.10, respectively The input data required by FW-FIRE include fuel analysis, coal particle size distribution (mass percentage for each size bin), waterwall fluid temperatures, and the velocities, flow rates and temperatures of primary and secondary gas streams. Boundary conditions are detailed in Figure 4.3.3, Figure 4.3.4, and Figure 4.3.5 The waterwalls of the furnace are assumed to be gray and diffusive. The wall temperature at each location is calculated based on the fluid temperature and the heat flux at the wall cell. For coal devolatilization kinetic properties, Ubhayakar rate parameters were employed for bituminous coal. For bituminous char oxidation, Sandia kinetic and burning mode parameters were applied for Illinois #6 coal. The selected quantity of flue gas recycle produces a 600ºF higher equilibrium temperature in O2-firing than air-firing. This may increase the potential for slagging in the furnace depending on the ash fusion characteristics. Consequently, for a dry bottom furnace design a minimum flue gas recycling flow may be required to avoid slagging depending on fuel type. Alternatively a wet-bottom or slag type furnace could be used to resolve ash deposition and removal problems.
4.3.2.1 Air-Fired Reference Case The general layout drawing of the air-fired reference case is shown in Figure 4.3.6. The furnace has a total 24 opposed wall-fired burners (3 vertical x 4 horizontal x 2 walls) and 10 overfire air ports. 30% of the total combustion air is injected through the over-fire air ports located at one burner pitch above the top burner row. The radiant heat transfer surface consists of 2.75” OD tube waterwalls and five 2.0” OD tube partial divisional wall panels. Water is circulated in the furnace by forced circulation. The boundary conditions were applied to the computational model and FW-FIRE was run until steady state conditions were achieved. The modeling results are summarized in Figure 4.3.7. The coal burnout shown in the table is the percentage of dry ash-free based coal burned. The furnace exit gas temperature (FEGT) shown in the table is the average temperature of flue gas before the platen superheater. The energy absorption listed is the total energy absorbed by water walls and partial division walls prior to the platen superheater. Total furnace absorption and FEGT predicted by FW-FIRE and ASPEN match closely.
71
Figure 4.3.8 is a plot of the flue gas velocity magnitude in a vertical plane through the second burner column. It can be seen that the gas velocity near the burners accelerates to greater than 130 ft/s due to the reduced gas density after particle ignition. Figure 4.3.9 presents a plot of gas temperature in a vertical plane through the second burner column. The maximum flue gas temperature is approximately 3350oF. The mole fraction of O2 through the second burner column is presented in Figure 4.3.10. The heat flux at the furnace water wall is shown in Figure 4.3.11. The maximum heat flux is approximately 70,000 Btu/hr-ft2 and is located on the side wall at the top of the burner zone. The total heat absorbed by the furnace walls before the furnace exit is 1770 MM Btu/hr. Figure 4.3.12 displays temperatures of the furnace walls and roof. The maximum temperature of the waterwalls is approximately 870oF and of the division walls is approximately 1000oF. Figure 4.3.13 presents the CO concentration at the wall, peaks at approximately 10% due to the sub-stoichiometric conditions of the lower furnace (without overfire air the wall CO would be below 2%). The trajectories of the 72-micron particles are plotted in Figure 4.3.14 with colors in each trajectory representing the mass fraction of char in the particle. Char is formed from devolatilization and consumed by oxidation. The maximum char mass fraction is usually less than the mass fraction of fixed carbon in a proximate analysis. Figure 4.3.14 shows that all of the 72-micron particles are completely burned before the furnace exit. The trajectories of 176-micron particles are plotted in Figure 4.3.15. It can be observed from Figure 4.3.15 that some particles are not completely burned at the exit of the furnace, causing unburned carbon in the fly ash. Total burnout of all particle sizes is 99.66% (2.61% LOI). Average NOx concentration at the furnace outlet is 276 ppmvw (0.38 lb/MMBtu).
4.3.2.2 Oxygen-Fired Design Case The preliminary size of the furnace heat transfer area was based on a calculation of average wall heat flux using the Foster Wheeler computer program, EMISS [11]. The EMISS computer program calculates radiative heat flux of CO2 and H2O gases. A three dimensional CFD run was then made using FW-FIRE to more accurately determine the total heat absorption. Based on the CFD results, the height of the furnace model was adjusted until the total heat absorption approximately matched that required in the ASPEN oxygen-fired design case. Figure 4.3.16 shows a comparison between the sizes of the resultant oxygen-fired furnace and the air-fired reference furnace. Compared to the air-fired furnace, the oxygen furnace has only approximately 65% of the surface area and approximately 45% of the volume. Figure 4.3.17 presents the oxygen-fired design general layout drawing for the cryogenic ASU design and Figure 4.3.18 for the OITM design.
72

The oxygen-fired furnace has a total 24 opposed wall-fired burners (4 vertical x 3 horizontal x 2 walls) and 8 overfire gas ports. The burner designs (including 0.5 primary air swirl) are based on the subcritical O2-PC burner design [3]. The radiant heat transfer surface consists of 2.75” OD tube waterwalls and ten 2.0” OD tube partial divisional wall panels. Water is circulated in the furnace by forced circulation. Two designs were simulated: 1) with cryogenic ASU and 2) with OITM. The designs differ as follows:
Radiant Superheater: In the cryogenic ASU design, radiant superheat (downstream of the primary superheater) is provided by the partial division walls, whereas in the OITM design radiant superheat is provided by the waterwalls above 100’ and the furnace roof. No division wall surface is required in the OITM design due to the increased coal-firing such that less evaporator surface (below 100’) is required (in addition, in the OITM design the overall furnace height is reduced by 5’). Air Heater: A tubular convective air heater is included in the OITM to provide the necessary air heating for the membrane separation process.
The modeling results are summarized in Figure 4.3.7. The coal burnout for the oxygen-fired cases is 100% due to the high furnace temperature and high concentration of O2. Total furnace absorption and FEGT predicted by FW-FIRE and ASPEN match well. NOx is reduced by oxygen firing (compared to air-firing) by about a factor of two from 0.38 lb/MMBtu to 0.18 lb/MMBtu.
4.3.2.2.1 Cryogenic ASU – Full Load Figure 4.3.19 is a plot of the flue gas velocity magnitude in a vertical plane through the middle burner column. It can be seen that the gas velocity near the burners accelerates to nearly 150 ft/s due to the reduced gas density after particle ignition. Figure 4.3.20 presents a plot of gas temperature in a vertical plane through the middle burner column. The maximum flue gas temperature is approximately 3900oF. The mole fraction of O2 through the middle burner column is presented in Figure 4.3.21. The mixed primary/secondary gas O2 content (before combustion) is 41%. The heat flux at the furnace water wall is shown in Figure 4.3.22. The maximum heat flux is approximately 171,000 Btu/hr-ft2 and is located on the side wall at the top of the burner zone. This maximum heat flux is approximately 2.5 times the air-fired case due to the higher flame temperature and higher H2O and CO2 concentrations. The total heat absorbed by the furnace walls before the furnace exit is 2287 MM Btu/hr. Figure 4.3.23 displays temperatures of the furnace walls and roof. The maximum temperature of the waterwalls is approximately 1035oF
73

and of the division walls is approximately 1050oF. Because of the higher temperature of the oxygen-fired case compared to the air-fired case, furnace water wall material was upgraded from 0.22” thick SA-213-T2 to 0.20” thick SA-213-T92. Figure 4.3.24 presents the CO concentration at the wall, which is significantly greater than for the air-fired case (Figure 4.3.13) and its effects on corrosion are modeled analytically in Section 4.3.4, but will also need to be measured empirically in future work. The trajectories of the 69-micron particles are plotted in Figure 4.3.25 with colors in each trajectory representing the mass fraction of char in the particle. Figure 4.3.25 shows that all of the 69-micron particles are completely burned before the furnace exit. The trajectories of 169-micron particles are plotted in Figure 4.3.26. Note that due to the higher temperature and O2 concentration all the 169-micron particles are completely burned as compared to the air-fired case (Figure 4.3.15) where there is some residual unburned char at the outlet.
4.3.2.2.2 Cryogenic ASU – Part Load Since the boiler is a supercritical once-through sliding pressure unit, part load operation must be evaluated with thermal/hydraulic and structural criteria. Three part loads were selected for evaluation: 72%, 50%, and 25% (minimum BENSON load). Boundary conditions were based on the ASPEN System Analysis. Figure 4.3.27 presents the corresponding recycle flow versus load. The modeling results are summarized in Figure 4.3.28. Figure 4.3.29 presents the gas temperature in a vertical plane through the middle burner column for the part load cases. The heat flux at the furnace water wall is shown for the part load cases in Figure 4.3.30. The average and peak heat flux versus height is presented in Figure 4.3.31.
4.3.2.2.3 Integration of Oxygen Ion Transport Membrane Figure 4.3.32 is a plot of the flue gas velocity magnitude in a vertical plane through the middle burner column. It can be seen that the gas velocity near the burners accelerates to nearly 150 ft/s due to the reduced gas density after particle ignition. Figure 4.3.33 presents a plot of gas temperature in a vertical plane through the middle burner column. The maximum flue gas temperature is approximately 3850oF. The mole fraction of O2 through the middle burner column is presented in Figure 4.3.34. The mixed primary/secondary gas O2 content (before combustion) is 39%.
The heat flux at the furnace water wall is shown in Figure 4.3.35. The maximum heat flux is approximately 180,000 Btu/hr-ft2 and is located on the side wall at the top of the burner zone. This maximum heat flux is approximately 2.5 times the air-fired case due to the higher flame temperature and higher H2O and CO2 concentrations. The total heat absorbed by the furnace walls before the furnace
74

exit is 2029 MM Btu/hr. Figure 4.3.36 displays temperatures of the furnace walls and roof. The maximum temperature of the evaporator waterwalls is approximately 1060oF, of the radiant superheater is approximately 1100oF, and of the air heater is approximately 1800 oF. Because of the higher temperature of the oxygen-fired case compared to the air-fired case, furnace water wall material was upgraded from 0.22” thick SA-213-T2 to 0.23” thick SA-213-T92. The air heater, which constructed from Incoloy MA956 material, is described in detail in Section 4.3.5.4. Figure 4.3.37 presents the CO concentration at the wall, which is significantly greater than for the air-fired case (Figure 4.3.13) and its effects on corrosion will need to be studied in future work. The trajectories of the 69-micron particles are plotted in Figure 4.3.38 with colors in each trajectory representing the mass fraction of char in the particle. Figure 4.3.38 shows that all of the 69-micron particles are completely burned before the furnace exit. The trajectories of 169-micron particles are plotted in Figure 4.3.39. Note that due to the higher temperature and O2 concentration all the 169-micron particles are completely burned as compared to the air-fired case (Figure 4.3.15) where there is some residual unburned char at the outlet.
75

Figure 4.3.1 – Computational Model of Air-Fired Furnace (with right side
wall removed)
Burners
OFA ports
Partial division walls
76

Figure 4.3.2 – Computational Model of Oxygen-Fired Furnace With OFA
Burners
Partial division walls
Cryogenic ASU
OFA ports
Superheater
Evaporator
Air Heater
OITM
77
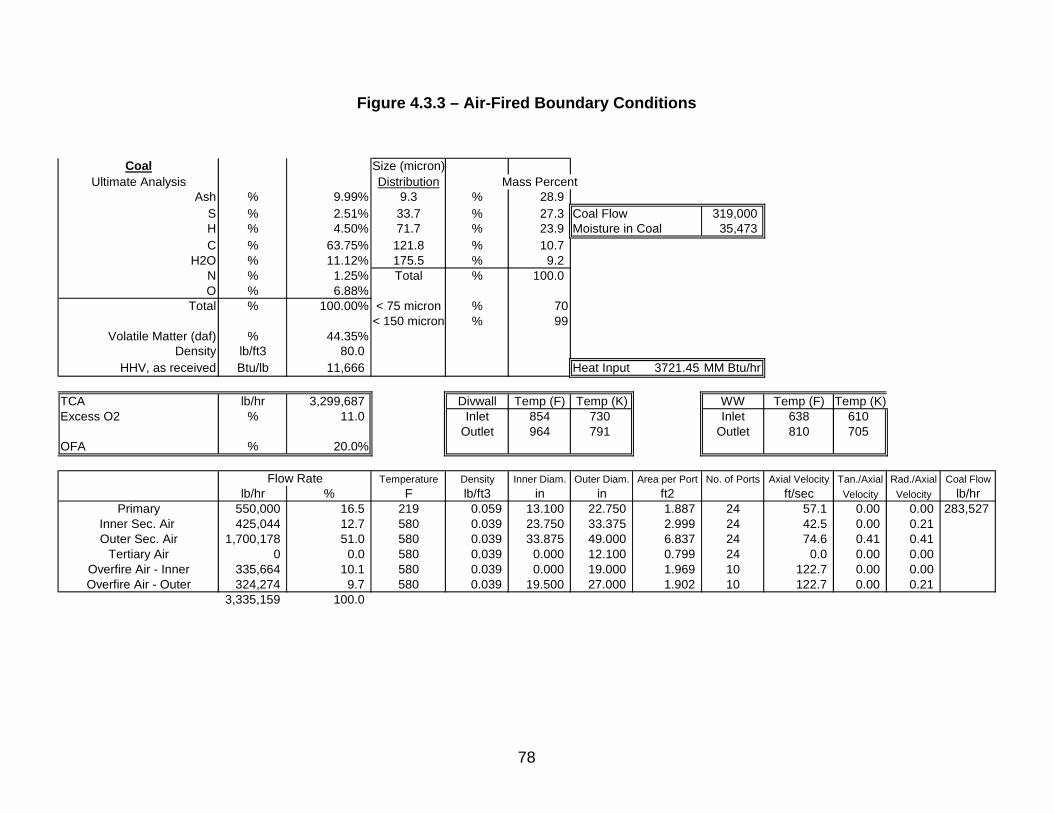
Figure 4.3.3 – Air-Fired Boundary Conditions
Coal Size (micron)Ultimate Analysis Distribution Mass Percent
Ash % 9.99% 9.3 % 28.9S % 2.51% 33.7 % 27.3 Coal Flow 319,000H % 4.50% 71.7 % 23.9 Moisture in Coal 35,473C % 63.75% 121.8 % 10.7
H2O % 11.12% 175.5 % 9.2N % 1.25% Total % 100.0O % 6.88%
Total % 100.00% < 75 micron % 70< 150 micron % 99
Volatile Matter (daf) % 44.35%Density lb/ft3 80.0
HHV, as received Btu/lb 11,666 Heat Input 3721.45 MM Btu/hr
TCA lb/hr 3,299,687 Divwall Temp (F) Temp (K) WW Temp (F) Temp (K)Excess O2 % 11.0 Inlet 854 730 Inlet 638 610
Outlet 964 791 Outlet 810 705OFA % 20.0%
Flow Rate Temperature Density Inner Diam. Outer Diam. Area per Port No. of Ports Axial Velocity Tan./Axial Rad./Axial Coal Flowlb/hr % F lb/ft3 in in ft2 ft/sec Velocity Velocity lb/hr
Primary 550,000 16.5 219 0.059 13.100 22.750 1.887 24 57.1 0.00 0.00 283,527Inner Sec. Air 425,044 12.7 580 0.039 23.750 33.375 2.999 24 42.5 0.00 0.21Outer Sec. Air 1,700,178 51.0 580 0.039 33.875 49.000 6.837 24 74.6 0.41 0.41
Tertiary Air 0 0.0 580 0.039 0.000 12.100 0.799 24 0.0 0.00 0.00Overfire Air - Inner 335,664 10.1 580 0.039 0.000 19.000 1.969 10 122.7 0.00 0.00Overfire Air - Outer 324,274 9.7 580 0.039 19.500 27.000 1.902 10 122.7 0.00 0.21
3,335,159 100.0
78

Figure 4.3.4 – Oxygen-Fired Boundary Conditions (Cryogenic ASU)
Coal Size (micron)Ultimate Analysis Distribution Mass Percent
Ash % 9.99% 10.7 % 29.5S % 2.51% 33.7 % 38.2 Coal Flow 308,000H % 4.50% 69.3 % 25.9 Moisture in Coal 34,250C % 63.75% 118.2 % 5.5
H2O % 11.12% 169.2 % 1.0N % 1.25% Total % 100.0O % 6.88%
Total % 100.00% < 75 micron % 85< 150 micron % 99
Volatile Matter (daf) % 44.35%Density lb/ft3 80.0
HHV, as received Btu/lb 11,666 Heat Input 3593.13 MM Btu/hr
TCA lb/hr 1,809,811 Divwall Temp (F) Temp (K) WW Temp (F) Temp (K)Excess O2 % 11.0 Inlet 837 720 Inlet 593 585
Outlet 974 796 Outlet 825 714OFA % 20.0%
Flow Rate Temperature Density Inner Diam. Outer Diam. Area per Port No. of Ports Axial Velocity Tan./Axial Rad./Axial Coal Flowlb/hr % F lb/ft3 in in ft2 ft/sec Velocity Velocity lb/hr
Primary 495,000 26.8 257 0.073 9.500 15.000 0.735 24 106.3 0.50 0.00 273,750Inner Sec. Air 197,420 10.7 625 0.046 16.000 20.750 0.952 24 52.6 0.00 0.21Outer Sec. Air 789,679 42.8 625 0.046 21.750 29.000 2.007 24 99.8 0.41 0.41
Tertiary Air 0 0.0 625 0.046 0.000 8.500 0.394 24 0.0 0.00 0.00Overfire Air - Inner 170,790 9.3 625 0.046 0.000 13.500 0.994 8 130.8 0.00 0.00Overfire Air - Outer 191,172 10.4 625 0.046 14.000 20.000 1.113 8 130.8 0.00 0.21
1,844,061 100.0
79

Figure 4.3.5 – Oxygen-Fired Boundary Conditions (OITM)
Coal Size (micron)Ultimate Analysis Distribution Mass Percent
Ash % 9.99% 10.7 % 29.5S % 2.51% 33.7 % 38.2 Coal Flow 375,400H % 4.50% 69.3 % 25.9 Moisture in Coal 41,744C % 63.75% 118.2 % 5.5
H2O % 11.12% 169.2 % 1.0N % 1.25% Total % 100.0O % 6.88%
Total % 100.00% < 75 micron % 85< 150 micron % 99
Volatile Matter (daf) % 44.35%Density lb/ft3 80.0
HHV, as received Btu/lb 11,666 Heat Input 4379.42 MM Btu/hr
TCA lb/hr 2,306,255 Divwall Temp (F) Temp (K) WW Temp (F) Temp (K)Excess O2 % 11.0 Inlet 837 721 Inlet 599 588Drum Pressure psia Outlet 970 794 Outlet 830 716OFA % 20.0%
Flow Rate Temperature Density Inner Diam. Outer Diam. Area per Port No. of Ports Axial Velocity Tan./Axial Rad./Axial Coal Flowlb/hr % F lb/ft3 in in ft2 ft/sec Velocity Velocity lb/hr
Primary 600,000 25.6 236 0.076 9.500 15.000 0.735 24 125.1 0.50 0.00 333,656Inner Sec. Air 257,350 11.0 625 0.046 16.000 20.750 0.952 24 68.6 0.00 0.21Outer Sec. Air 1,029,399 43.8 625 0.046 21.750 29.000 2.007 24 130.1 0.41 0.41
Tertiary Air 0 0.0 625 0.046 0.000 8.500 0.394 24 0.0 0.00 0.00Overfire Air - Inner 217,639 9.3 625 0.046 0.000 13.500 0.994 8 166.6 0.00 0.00Overfire Air - Outer 243,612 10.4 625 0.046 14.000 20.000 1.113 8 166.6 0.00 0.21
2,347,999 100.0
80
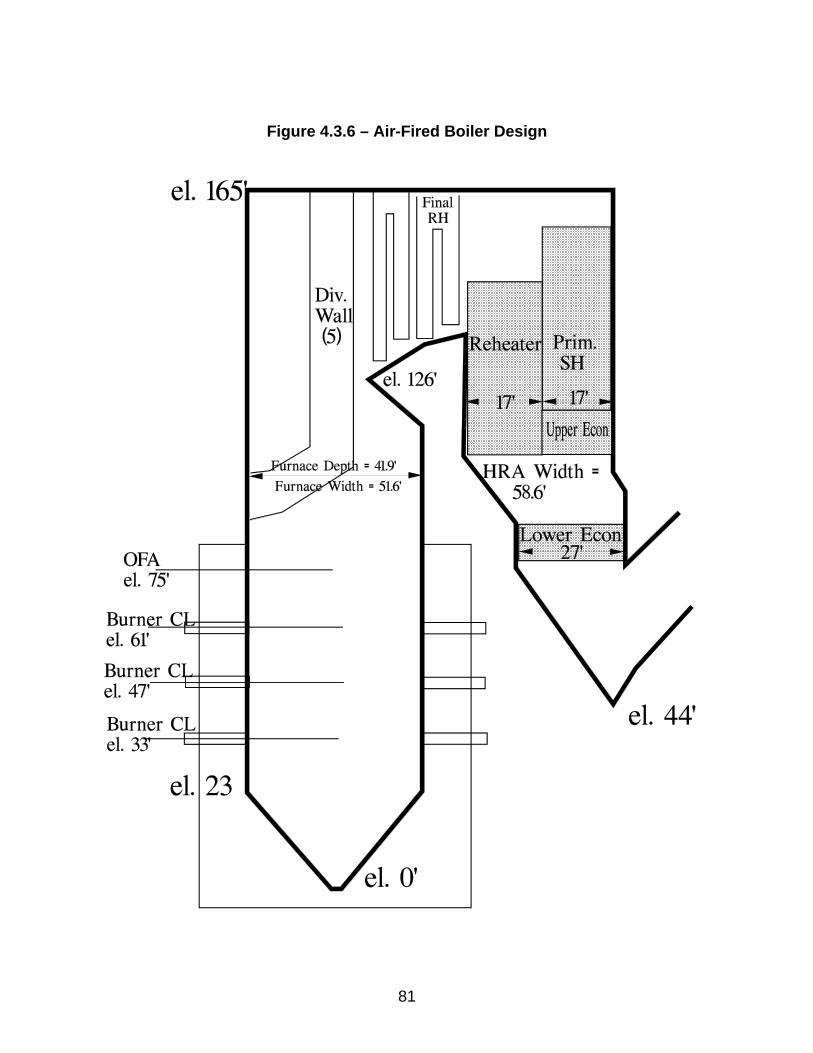
Figure 4.3.6 – Air-Fired Boiler Design
81

Figure 4.3.7 – Summary of FW-FIRE Furnace Modeling Results Air-Fired FW-FIRE ASPEN
Burnout % 99.6 99.0LOI % 2.76 7.32
Total Furnace Absorption M Btu/hr 1770 1751Division Wall Absorption M Btu/hr 445 451
FEGT F 2107 2185NOx ppmvw 276
lb/MMBtu 0.38
Oxygen-Fired (Cryogenic ASU) FW-FIRE ASPEN
Burnout % 100.0 99.9LOI % 0.00 0.78
Total Furnace Absorption M Btu/hr 2096 2089Division Wall Absorption M Btu/hr 548 485
FEGT F 2266 2450NOx ppmvw 261
lb/MMBtu 0.18
Oxygen-Fired (OITM) FW-FIRE ASPEN
Burnout % 100.0 99.9LOI % 0.00 0.78
Total Furnace Absorption M Btu/hr 2029 1961Radiant SH Absorption M Btu/hr 458 502
Air Heater Absorption M Btu/hr 935 970FEGT F 1822 2185
NOx ppmvw 273lb/MMBtu 0.20
82

Figure 4.3.8 – Gas Velocity for Air-Fired Case
83

Figure 4.3.9 – Gas Temperature for Air-Fired Case
84

Figure 4.3.10 – O2 Mole Fraction for Air-Fired Case
85

Figure 4.3.11 – Wall Heat Flux for Air-Fired Case
86

Figure 4.3.12 – Wall Temperature for Air-Fired Case
87

Figure 4.3.13 – Wall CO for Air-Fired Case
88

Figure 4.3.14 – Char Mass Fraction (72 microns) for Air-Fired Case
89

Figure 4.3.15 – Char Mass Fraction (176 microns) for Air-Fired Case
90

Figure 4.3.16 – Air-Fired and Oxygen-Fired Boiler Outlines
(Black = Air-Fired, Red = Oxygen Fired)
91
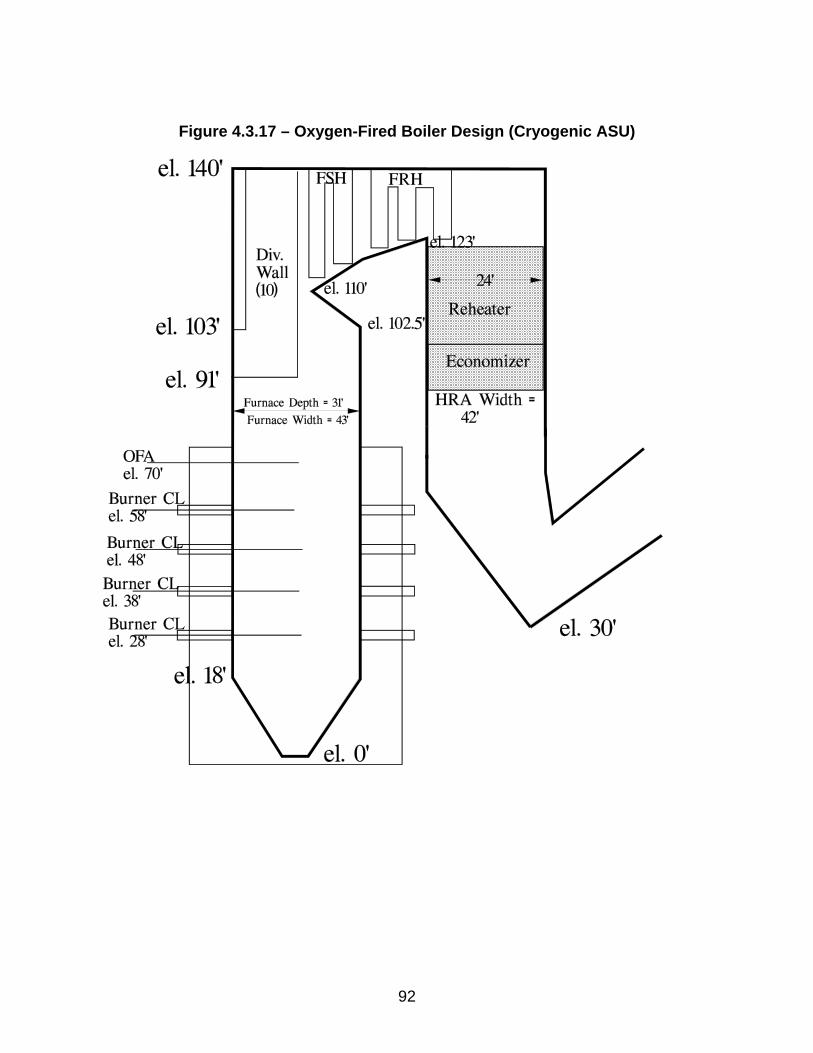
Figure 4.3.17 – Oxygen-Fired Boiler Design (Cryogenic ASU)
92

Figure 4.3.18 – Oxygen-Fired Boiler Design (OITM)
93

Figure 4.3.19 – Gas Velocity for O2-Fired Case
94

Figure 4.3.20 – Gas Temperature for O2-Fired Case
95

Figure 4.3.21 – O2 Mole Fraction for O2-Fired Case
96

Figure 4.3.22 – Wall Heat Flux for O2-Fired Case
97
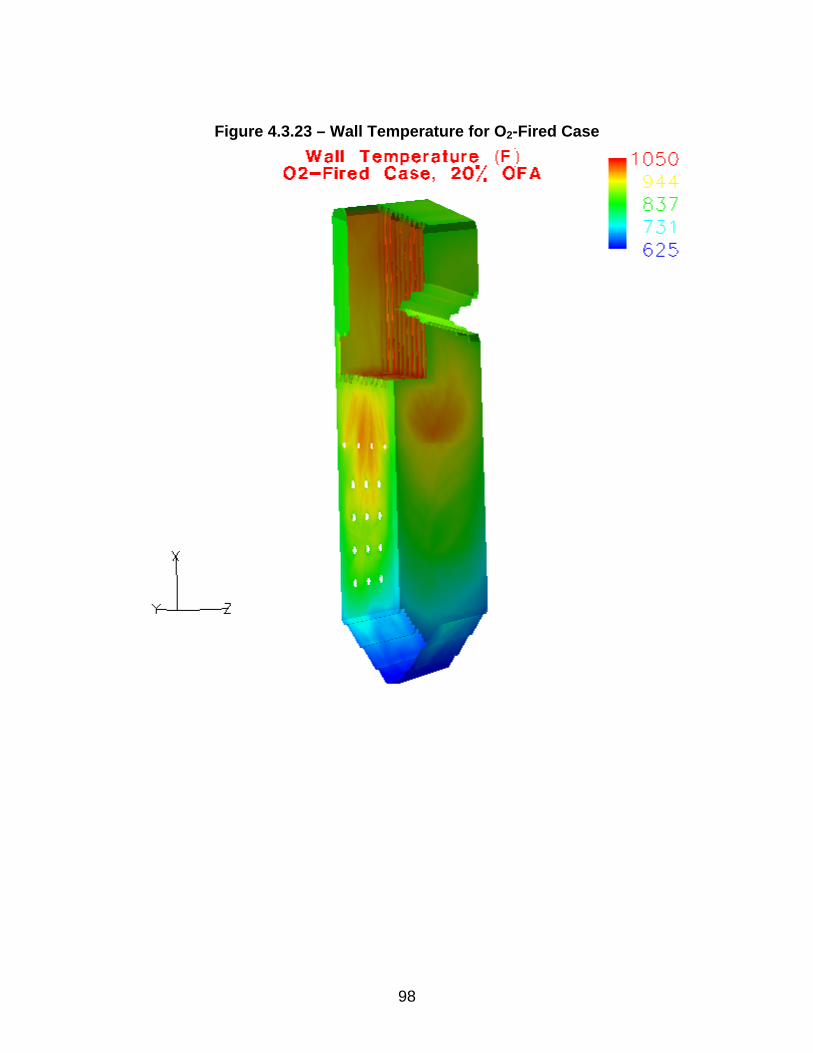
Figure 4.3.23 – Wall Temperature for O2-Fired Case
98

Figure 4.3.24 – Wall CO for O2-Fired Case
99

Figure 4.3.25 – Char Mass Fraction (69 micron) for O2-Fired Case
100

Figure 4.3.26 – Char Mass Fraction (169 micron) for O2-Fired Case
101

Figure 4.3.27 - Flue gas recycle flow vs. part load operation
Part Load Performance
0
200
400
600
800
1000
1200
1400
0 20 40 60 80 100 120Load, %
Gas
recy
clin
g, k
lb/h
r
0
10
20
30
40
50
60
70
80
90
100
gas
recy
clin
g, %
102

Figure 4.3.28 – Summary of O2-Fired Part Load Results, Cryogenic ASU
100% Load 72% Load 50% Load 25% LoadBurnout % 100.00 100.00 100.00 99.81
LOI % 0.00 0.00 0.00 1.48Total Furnace Absorption MM Btu/hr 2096 1572 1073 747Division Wall Absorption MM Btu/hr 548 380 248 193
FEGT F 2266 2069 1912 1658
103

Figure 4.3.29 – Gas Temperature for O2-Fired Part Load, Cryogenic ASU
25 %50 %72 %
104

Figure 4.3.30 – Wall Heat Flux for O2-Fired Part Load, Cryogenic ASU
72 %
50 %105
25 %

Figure 4.3.31 – Average and Peak Heat Flux in Waterwalls
Average Flux Vs. Height
0
20000
40000
60000
80000
100000
120000
140000
160000
0 20 40 60 80 100 120 140 160
Height (ft)
Hea
t Flu
x (B
tu/h
r-ft2
)
no ofa, 100% ofa, 100% ofa, 25% ofa, 72% ofa, 50% OTM, 100% air-fired
Peak Flux Vs. Height
020000400006000080000
100000120000140000160000180000200000
0 20 40 60 80 100 120 140 160
Height (ft)
Hea
t Flu
x (B
tu/h
r-ft
2)
no ofa, 100% ofa, 100% ofa, 25% ofa, 72% ofa, 50% OTM, 100% air-fired
106
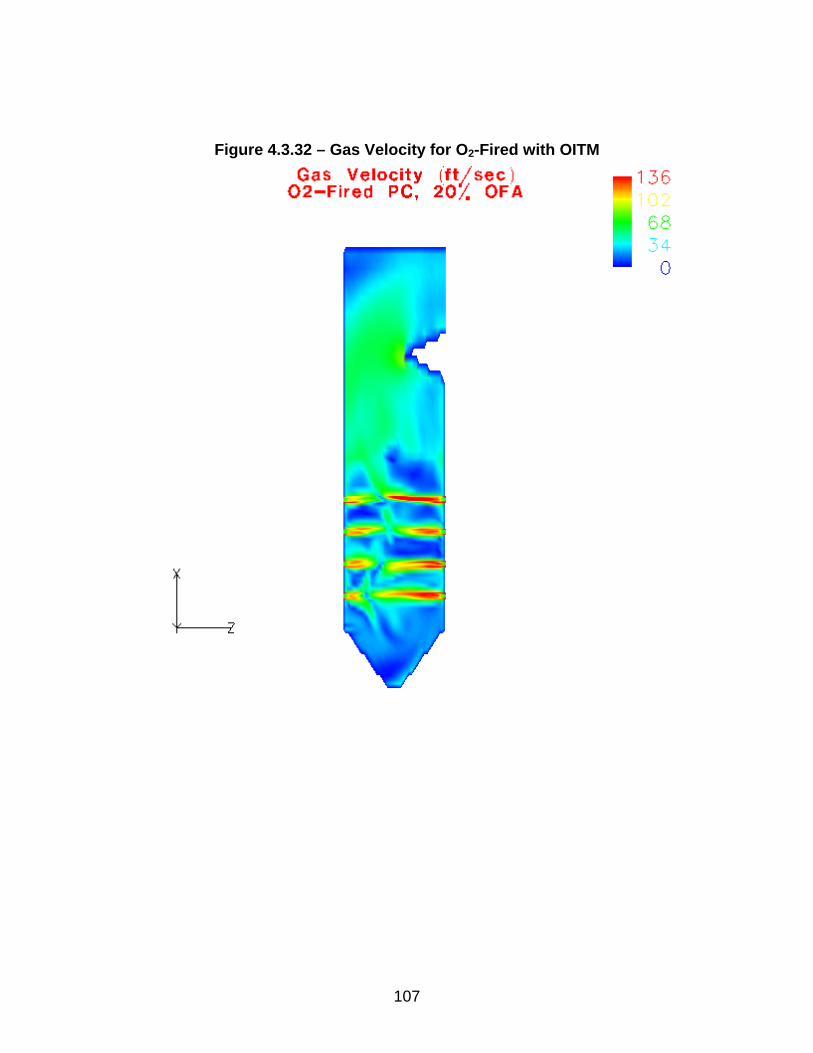
Figure 4.3.32 – Gas Velocity for O2-Fired with OITM
107
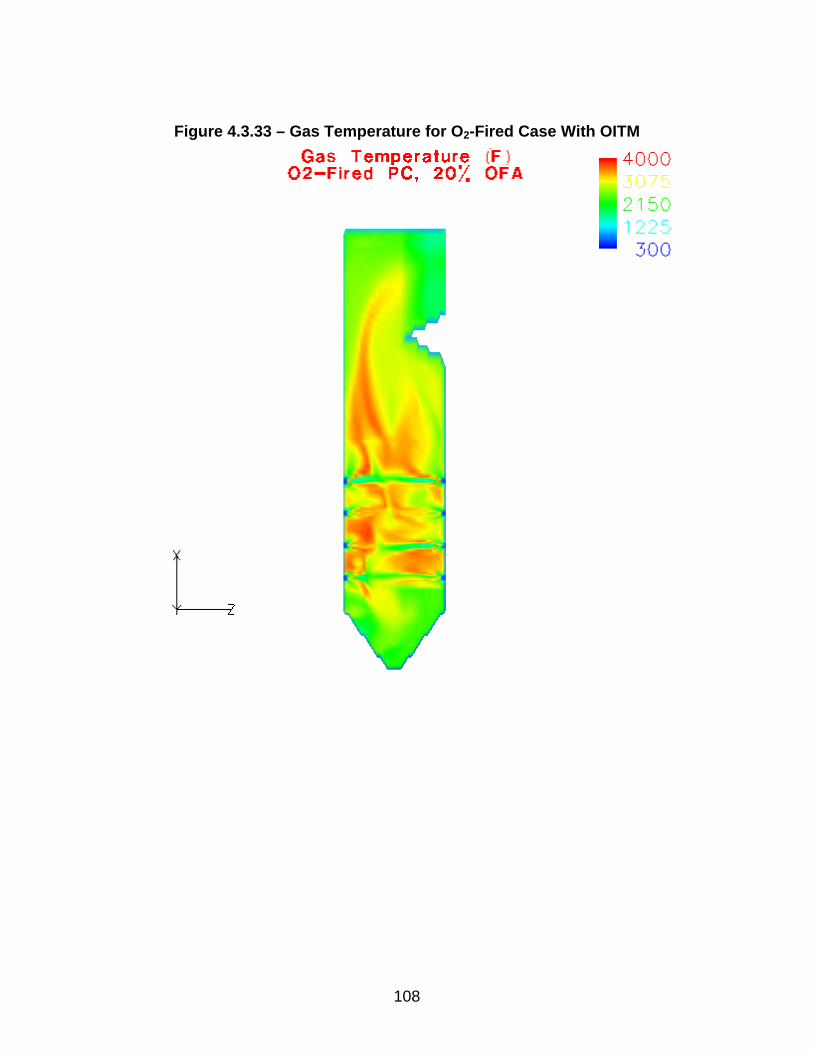
Figure 4.3.33 – Gas Temperature for O2-Fired Case With OITM
108

Figure 4.3.34 – O2 Mole Fraction for O2-Fired Case With OITM
109

Figure 4.3.35 – Wall Heat Flux for O2-Fired Case With OITM
110
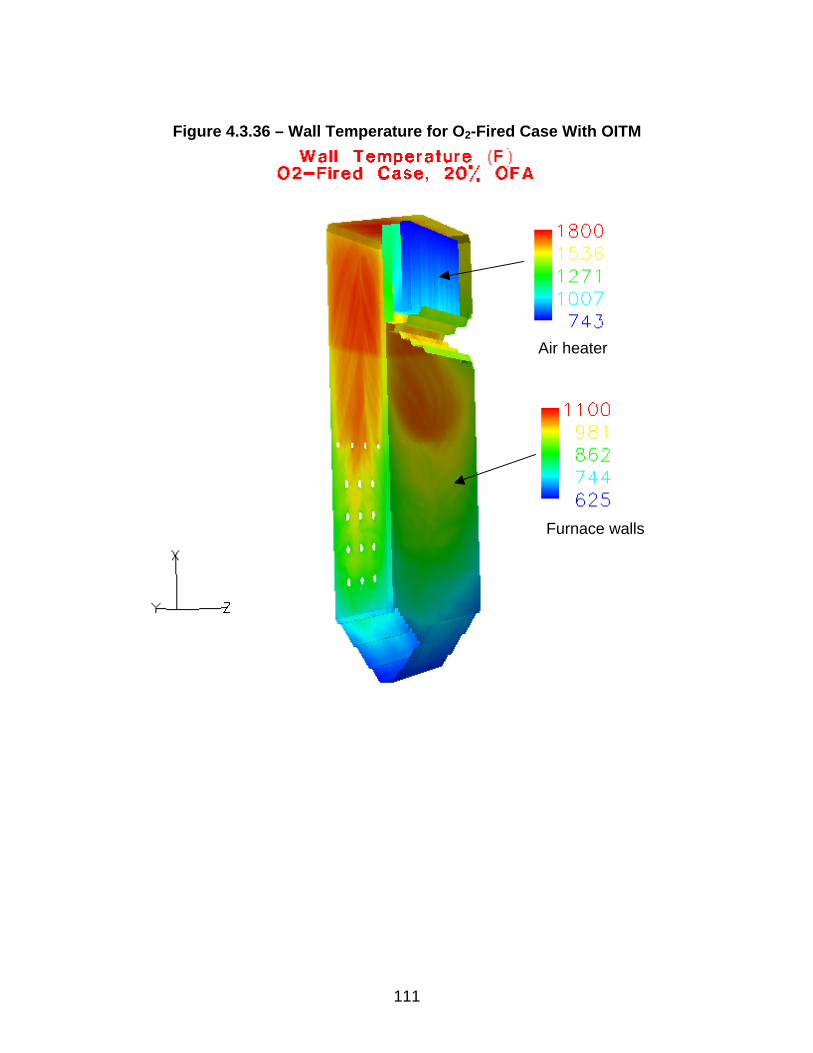
Figure 4.3.36 – Wall Temperature for O2-Fired Case With OITM
Air heater
Furnace walls
111
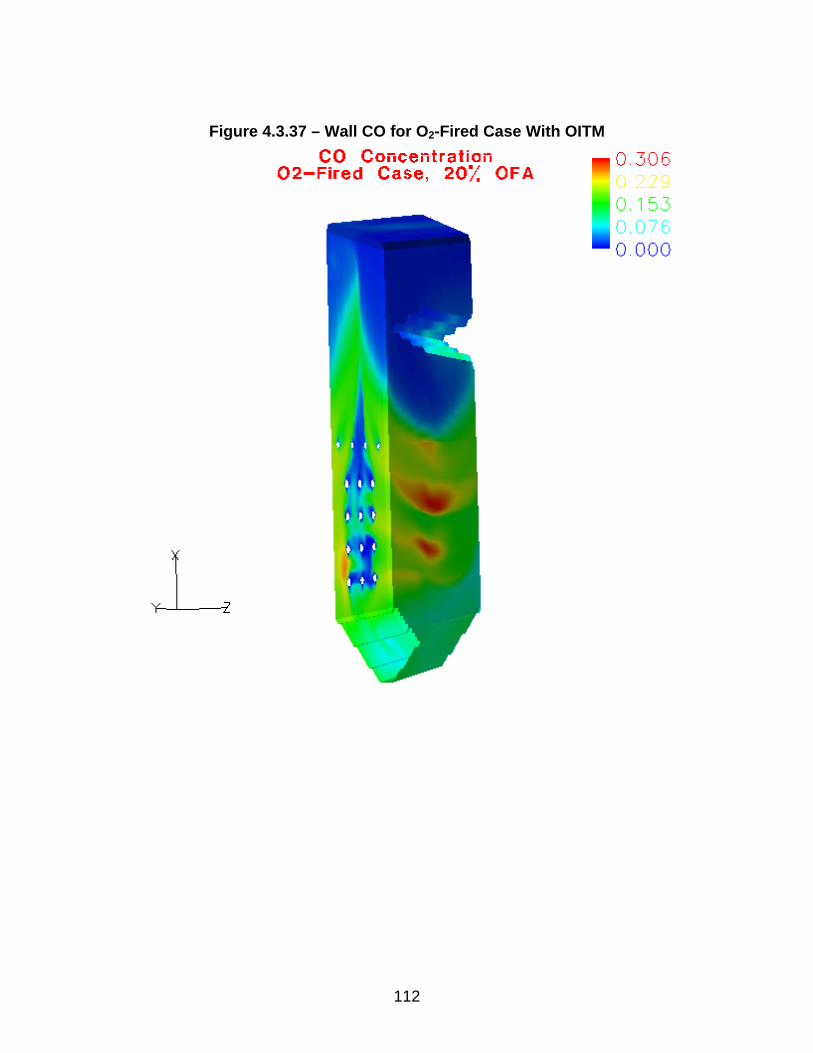
Figure 4.3.37 – Wall CO for O2-Fired Case With OITM
112

Figure 4.3.38 – Char Mass Fraction (69 micron) for O2-Fired Case, OITM
113

Figure 4.3.39 – Char Mass Fraction (169 micron) for O2-Fired Case, OITM
114

4.3.3 Furnace Waterwall and Division Wall Design
The O2-PC supercritical boiler incorporates the state-of-the-art once-through utility (OTU) BENSON Vertical technology, which uses low fluid mass flow rates in combination with optimized rifled tubing and offers the following advantages:
“Natural Circulation” Flow Characteristic: By designing for low mass flow rates that minimize frictional pressure losses, high heat flux tubes receive more flow to minimize temperature unbalances (see Figure 4.3.40).
Improved Heat Transfer Coefficient: By using optimized rifled tubing, departure from nucleate boiling (DNB) when operating near the critical pressure can be suppressed, even with relatively low fluid mass flow rates, and dryout can be prevented from occurring until steam qualities of greater than 90% are achieved. This lowers the wall temperature permitting the use of thinner wall less expensive materials (see Figure 4.3.41). Simple Configuration: A standard, simple support system can be used to support the vertical tube panels so that interconnecting piping and headers between multiple passes are not required. Low Pressure Losses: The low mass flow rates significantly reduce pressure loss, which reduces auxiliary power and therefore increases cycle efficiency. The boiler design pressure can also be lowered.
The furnace heat transfer tube design utilizing optimized rifled tubes is summarized in Figure 4.3.42.
4.3.3.1 Tube Wall Temperature and Pressure Loss Thermal/hydraulic modeling of the waterwalls and division walls was performed using the Siemens computer program, Stade2 [12]. Stade2 creates a one-dimensional model of the tube panels to determine inside heat transfer, wall temperatures, and pressure loss and to perform linear dynamic and static stability analyses. Stade2 models of the waterwalls and division walls were created and the average heat flux (Figure 4.3.31) and average mass flow were applied to establish the net pressure difference between the inlet and outlet headers. Models of the peak heat flux tubes were then created and Stade2 was used to determine the increased mass flow rate corresponding to the average pressure drop (due to the natural circulation characteristic of the optimized rifled tube geometry). For example, for the cryogenic O2-PC design, the average heat flux and average mass flux (832 kg/m2-sec) produced a pressure loss of 33.7 psi. To match this pressure loss for the peak heat flux tube requires a mass flux of 966 kg/m2-sec (0.71 MM lb/ft2-hr). Due to the increased mass flow rate the maximum tube wall temperature of the peak heat flux tube is reduced. Figure 4.3.43 presents the
115

outside wall temperature of the peak heat flux waterwalls and division walls for the air-fired and O2-fired designs. Based on the maximum outside wall temperatures of Figure 4.3.43 the minimum tube wall thickness is computed using stress allowables from the ASME Boiler and Pressure Vessel Code as follows (design pressure = 5000 psi):
Air-Fired: Material = SA-213-T2, min. wall thickness = 0.22” O2-Fired Cryo.: Material = SA-213-T92, min. wall thickness = 0.20” O2-Fired OITM: Material = SA-213-T92, min. wall thickness = 0.23”
4.3.3.2 Tube Panel Stability
The waterwall and division wall designs were determined by Stade2 to be statically and linearly dynamically stable at full and part loads (although the 25% load case appears to be near the dynamically unstable region). A more thorough treatment of dynamic stability was performed using the Siemens program, Dynastab [13]. Dynastab performs calculations for a single tube within a greater number of parallel tubes. The calculation starts from steady state and compares the flow behavior of a single tube, with slightly changed conditions (e.g. heat input, tube geometry), with the mean tubes of the heating surface. The mass flow of the single tube is stimulated by a distinct disturbance (e. g. global or local heating factor, inlet enthalpy), while pressure drop is kept constant. If this disturbance causes continuous oscillations, the tube is dynamically unstable; whereas if the disturbance results in a (new) steady state condition, the tube is dynamically stable. A 10% step increase in heat flux was applied to the single tube model. Figure 4.3.44 presents the transient results of inlet mass flow versus time (although a single tube was modeled the flow per entire furnace is presented). The 100% and 72% loads are stable, the 50% load is marginally stable, and the 25% load is unstable. To ensure stable operation at low loads, a pressure equalization header is added to the design at an elevation of 80’ and the resultant dynamic stability response is shown in Figure 4.3.45. With the pressure equalization header all loads are dynamically stable.
116
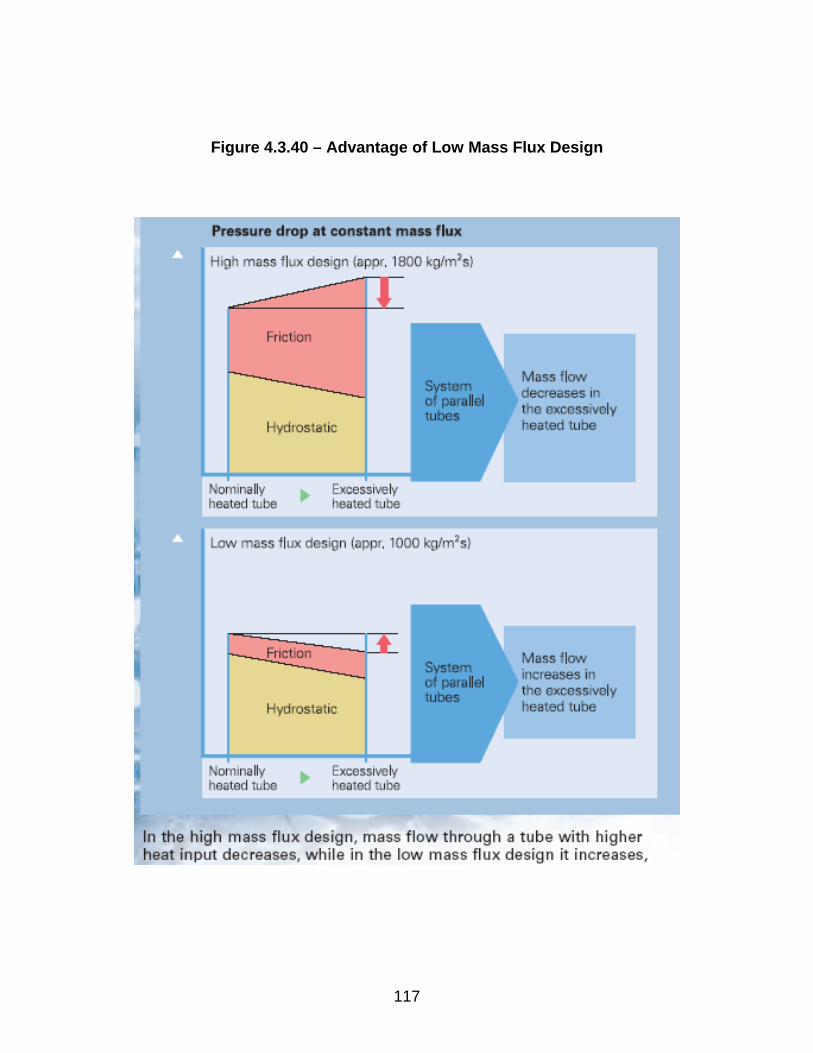
Figure 4.3.40 – Advantage of Low Mass Flux Design
117
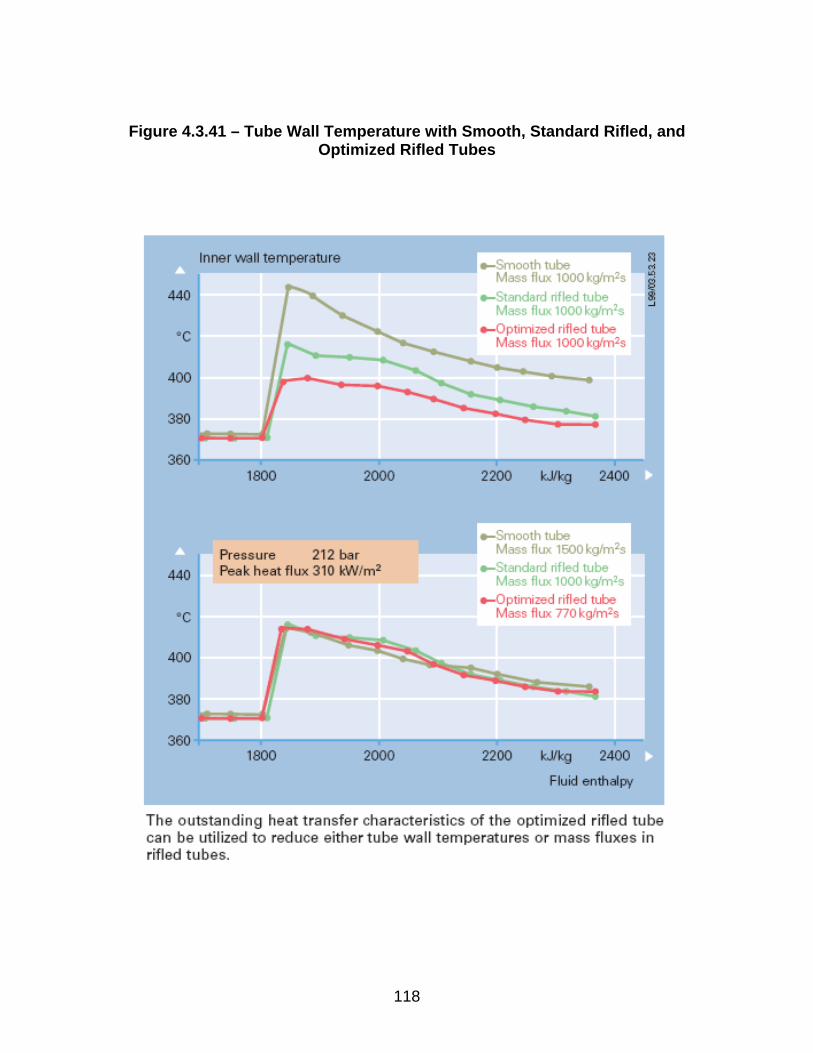
Figure 4.3.41 – Tube Wall Temperature with Smooth, Standard Rifled, and
Optimized Rifled Tubes
118

Figure 4.3.42 – Rifled Tube Design
Air-Fired O2 PC SC O2 PC SCCryogenic OITM
Material SA-213-T2 SA-213-T92 SA-213-T92OD in 1.40 1.40 1.40
twall in 0.22 0.20 0.23ID in 0.96 1.00 0.94
Pitch in 2.00 2.00 2.00Ligament in 0.60 0.60 0.60
Ligament Width in 0.25 0.25 0.25Number of waterwall tubes 1218 888 888
Number of radiant superheater tubes 618 720 666Number of ribs 6 6 6
Rib Height in 0.048 0.050 0.048
119
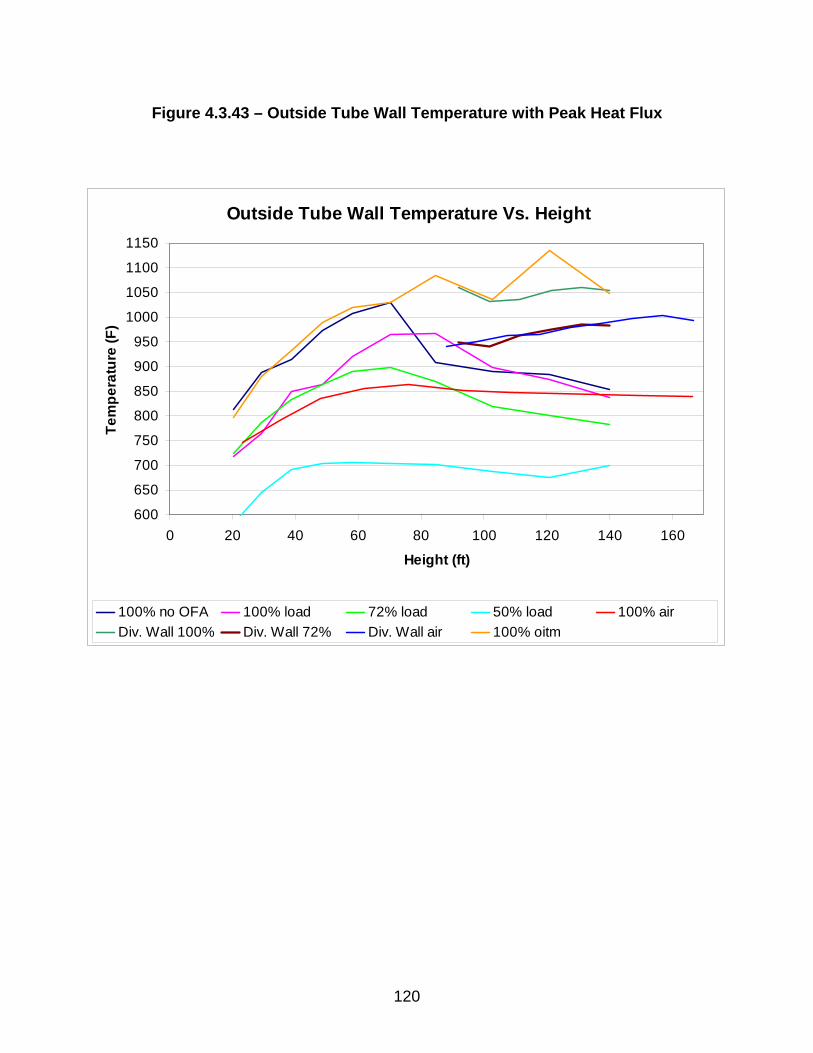
Figure 4.3.43 – Outside Tube Wall Temperature with Peak Heat Flux
Outside Tube Wall Temperature Vs. Height
600
650
700
750
800
850
900
950
1000
1050
1100
1150
0 20 40 60 80 100 120 140 160
Height (ft)
Tem
pera
ture
(F)
100% no OFA 100% load 72% load 50% load 100% airDiv. Wall 100% Div. Wall 72% Div. Wall air 100% oitm
120

Figure 4.3.44 – Tube Inlet Mass Flow With a 10% Heat Flux Step Increase (No
Pressure Equalization Header)
Flow Vs. Time: No Pressure Equilization Header
-2
-1
0
1
2
3
4
5
6
0 20 40 60 80 100 120 140 160 180 200
Time (sec)
Flow
Rat
e (M
M lb
/hr)
100% 72% 50% 25%
121

Figure 4.3.45 – Tube Inlet Mass Flow With a 10% Heat Flux Step Increase (With
Pressure Equalization Header at 80’)
Flow Vs. Time: With Pressure Equilization Header at 80'
0
0.5
1
1.5
2
2.5
3
3.5
0 20 40 60 80 100 120 140 160 180 200
Time (sec)
Flow
Rat
e (M
M lb
/hr)
100% 72% 50% 25%
122

4.3.4 Furnace Waterwall Corrosion Waterwall corrosion is caused by sulfidation from a sub-stoichiometric gas containing H2S and from deposits containing carbon and iron sulfide. Corrosion is especially significant at the high waterwall surface temperatures of a supercritical and ultra-supercritical boiler. In the O2-PC without FGD, recycling of the flue gas will increase the H2S concentration of the furnace by a factor of 1/(1 – recycle fraction). For example for a recycle flow rate of 55%, the H2S concentration is increased by a factor of 2.2. An empirical EPRI formula was developed to predict the magnitude of waterwall corrosion due to the presence of H2S as follows:
[ ]( ) 234.1
574.05
5.10%1
987.115818exp102.3
+⎟⎠⎞
⎜⎝⎛−=
CrSH
TxCR s (Cr wt% < 10)
[ ]( ) 37.1
29.07
40.1%1
987.119230exp1004.1
−⎟⎠⎞
⎜⎝⎛−=
CrSH
TxCR s (Cr wt% > 16)
where, CR = corrosion rate (mil/year) T = metal temperature, K H2S = H2S flue gas concentration, ppm Cr% = Cr concentration of the metal
Figure 4.3.46 shows the predicted corrosion rate for the air-fired and O2-fired cases. For the air-fired case the maximum corrosion on the waterwalls is 12 mil/yr and on the division walls is 18 mil/yr (maximum H2S concentration is 1600 ppm). For the oxygen-fired case maximum corrosion on the waterwalls is 35 mil/yr and on the division walls is 45 mil/yr (maximum H2S concentration is 5600 ppm). Note that for the O2-fired case the corrosion is increased by the higher water wall temperature, higher concentration of H2S, but is reduced by the higher chromium content of T92 vs. T2. To reduce the corrosion in the O2-PC, weld overlays with high Nickel and Chromium contents are proposed. This will be much more cost-effective than adding an FGD system, which will be substantially more costly and reduce the corrosion by only a factor of 1.6 (by reducing the H2S by a factor of 2.2). Applying alloy 622 (20% Cr) as a weld overlay significantly reduces the corrosion rate as shown in Figure 4.3.46 to less than 10 mil/yr. Note that other alternatives to weld overlays include upgrading the base tube metal and thermal spray coatings.
123
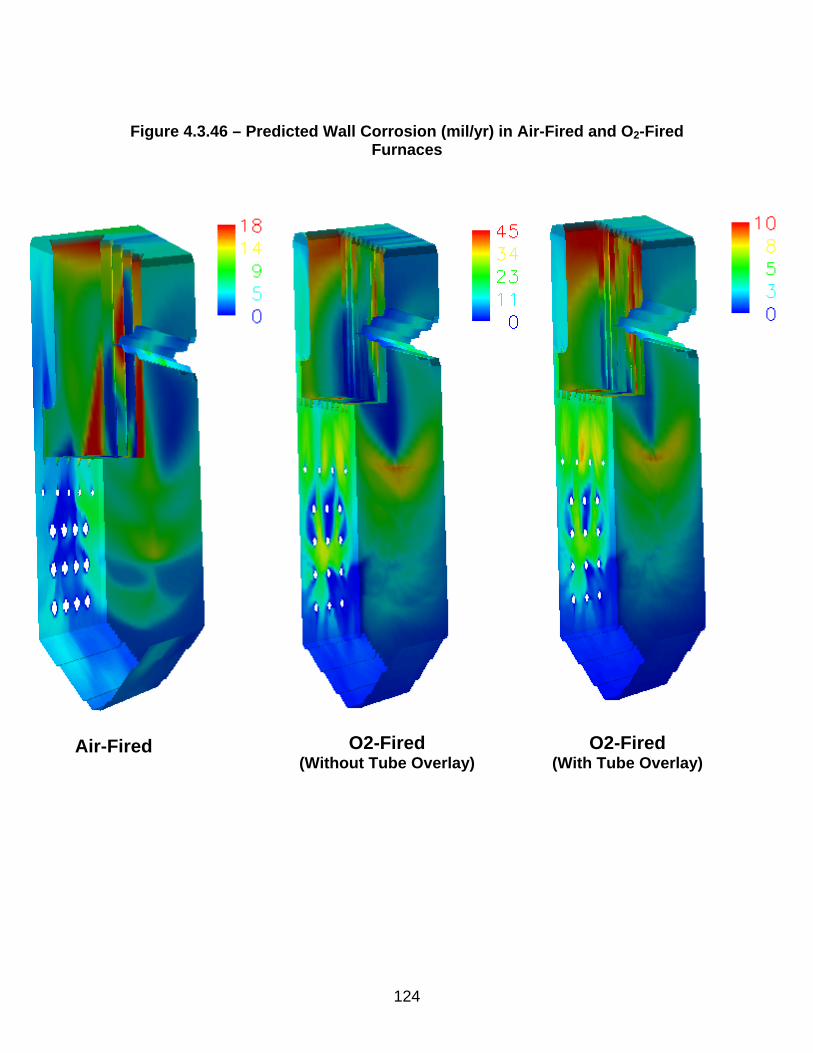
Figure 4.3.46 – Predicted Wall Corrosion (mil/yr) in Air-Fired and O2-Fired
Furnaces
O2-Fired (Without Tube Overlay)
O2-Fired (With Tube Overlay)
Air-Fired
124

4.3.5 Heat Recovery Area Design and Analysis
4.3.5.1 HEATEX Program Description
HEATEX [10] is a Foster Wheeler general-purpose program for thermal/hydraulic analysis of tube banks. The program performs heat transfer calculations on a local basis by dividing the tube bundle into a number of small heat transfer elements.
4.3.5.2 Air-Fired Reference Case HEATEX was used to determine the heat recovery area (HRA) design of the convective tube banks between the furnace exit and the SCR/air heater. These tube banks include the finishing superheater, finishing reheater, primary superheater, primary reheater, upper economizer, and lower economizer. Flue gas exits the furnace at 2185ºF and flows over the finishing superheater and finishing reheater tube bundles where it heats the main steam and reheat steam to 1083ºF and 1113ºF, respectively. The gas flow is then split into two parallel flows: one passing over the primary reheater and the other passing over the primary superheater and upper economizer. The gas split is controlled by dampers to achieve the proper reheater outlet temperature. Attemperating spray is used to control superheat temperature. The flue gas is combined downstream of the dampers and flows over the lower economizer, which receives water from the last feedwater heater stage. Flue gas exits the lower economizer at 720ºF and is sent to the SCR and then to the air heater. Figure 4.1.1 presents the heat transfer requirements of the HRA banks. Figure 4.3.47 presents the corresponding design of the HRA banks. Total surface area of all convective banks is 335,025 ft2. The performance of HRA tube banks is shown in Figure 4.3.48. The total heat transferred to the water/steam is 1431 MM Btu/hr as 3.59 MM lb/hr of flue gas is cooled from 2185ºF to 720ºF.
4.3.5.3 Oxygen-Fired Case, Cryogenic ASU Due to the 40% lower flue gas flow rate of the cryogenic ASU oxygen-fired case versus the air-fired case, the cross sectional area of the HRA is reduced to maintain the same gas side velocity (and pressure drop). HEATEX was used to determine the heat recovery area design of the convective tube banks between the furnace exit and the gas recuperator. These tube banks include the finishing superheater, finishing reheater, primary reheater, and lower economizer. Flue gas exits the furnace at 2450ºF and flows over the finishing superheater and finishing reheater tube bundles where it heats the main steam and reheat steam to 1083ºF and 1113ºF, respectively. Because of the reduced flue gas flow and lower HRA duty, the HRA is designed in series instead of parallel to produce a more compact design After exiting the finishing reheater the flue gas flows over the primary reheater and then the lower economizer, which receives water from the last feedwater heater stage. Flue gas exits the lower economizer at 695ºF and is sent to the gas recuperator.
125

Figure 4.1.9 presents the heat transfer requirements of the HRA banks. Figure 4.3.47 presents the corresponding design of the HRA banks. Total surface area of all convective banks is 218,693 ft2. The performance of HRA tube banks is shown in Figure 4.3.48. The total heat transferred to the water/steam is 1151 MM Btu/hr as 2.12 MM lb/hr of flue gas is cooled from 2450ºF to 695ºF. The total heat transfer surface required in the oxygen-fired HRA is 35% less than the air-fired HRA due to the following main reasons:
1. More heat is absorbed in the oxygen-fired furnace (2089 MM Btu/hr) than the air-fired furnace (1751 MM Btu/hr) due to the higher adiabatic temperature and the greater specific heat of the oxygen-fired furnace flue gas. This requires less heat transfer duty in the HRA (as a consequence the upper economizer is not needed)
2. A higher heat transfer coefficient can be achieved in the oxygen-fired HRA
than the air-fired HRA for the same flue gas pressure loss due to greater molecular weight (38 mol/lb-mol vs. 29 mol/lb-mol) of the oxygen-fired flue gas.
The HRA tube materials and wall thicknesses are nearly the same for the air-fired and oxygen-fired design (except for the finishing superheater where the 0.42” wall thickness of the air-fired case is increased to 0.46” for the oxygen-fired case) since the flue gas and water/steam temperature profiles encountered by the heat transfer banks are very similar.
4.3.5.4 Oxygen-Fired Case, OITM Due to the 25% lower flue gas flow rate of the OITM oxygen-fired case versus the air-fired case, the cross sectional area of the HRA is reduced to maintain the same gas side velocity (and pressure drop). HEATEX was used to determine the heat recovery area design of the convective tube banks between the furnace exit and the gas recuperator. These tube banks include the finishing superheater, finishing reheater, primary superheater, primary reheater, upper economizer, and lower economizer. Flue gas exits the furnace at 2185ºF and flows over the finishing superheater and finishing reheater tube bundles where it heats the main steam and reheat steam to 1083ºF and 1113ºF, respectively. The flue gas is then used to heat the air used for the OITM process. The gas flow is then split into two parallel flows: one passing over the primary reheater and the other passing over the primary superheater and upper economizer. The gas split is controlled by dampers to achieve the proper reheater outlet temperature. Attemperating spray is used to control superheat temperature. The flue gas is combined downstream of the dampers and flows over the lower economizer, which receives water from the last feedwater heater stage. Flue gas exits the lower economizer at 695ºF and is sent to the gas recuperator. Figure 4.2.10 presents the heat transfer requirements of the HRA banks. Figure 4.3.47 presents the corresponding design of the HRA banks. Total surface area of all
126

convective banks is 291,150 ft2 (242,510 ft2 without the air heater). The total heat transfer surface required in the oxygen-fired OITM HRA is 13% less than the air-fired HRA (28% less not including the air heater). The performance of HRA tube banks is shown in Figure 4.3.48. The total heat transferred to the water/steam is 1181 MM Btu/hr and to the air is 990 MMBtu/hr as 2.68 MM lb/hr of flue gas is cooled to 695ºF. The total furnace + HRA heat transfer surface area for the OITM O2-PC is 309,799 ft2 as compared to 382,574 ft2 for the air-fired PC and 252,002 ft2 for the cryogenic ASU O2-PC. The HRA tube materials and wall thicknesses are nearly the same for the air-fired and OITM oxygen-fired design (except for the finishing superheater where the 0.42” wall thickness of the air-fired case is increased to 0.46” for the oxygen-fired case) since the flue gas and water/steam temperature profiles encountered by the heat transfer banks are very similar. The air heater is constructed Incoloy MA956 which is an iron-chromium-aluminum alloy. Incoloy MA956 has been used in advanced gas turbine engines and is resistant to creep, oxidation, and corrosion at temperatures up to 2200ºF. The furnace air heater is a three pass tubular design situated above the furnace nose to reduce radiation and maximum metal temperature. Air is heated from 745 to 1650ºF as the flue gas is cooled from 2950 to 2185ºF. Maximum metal temperature is approximately 1900ºF.
127
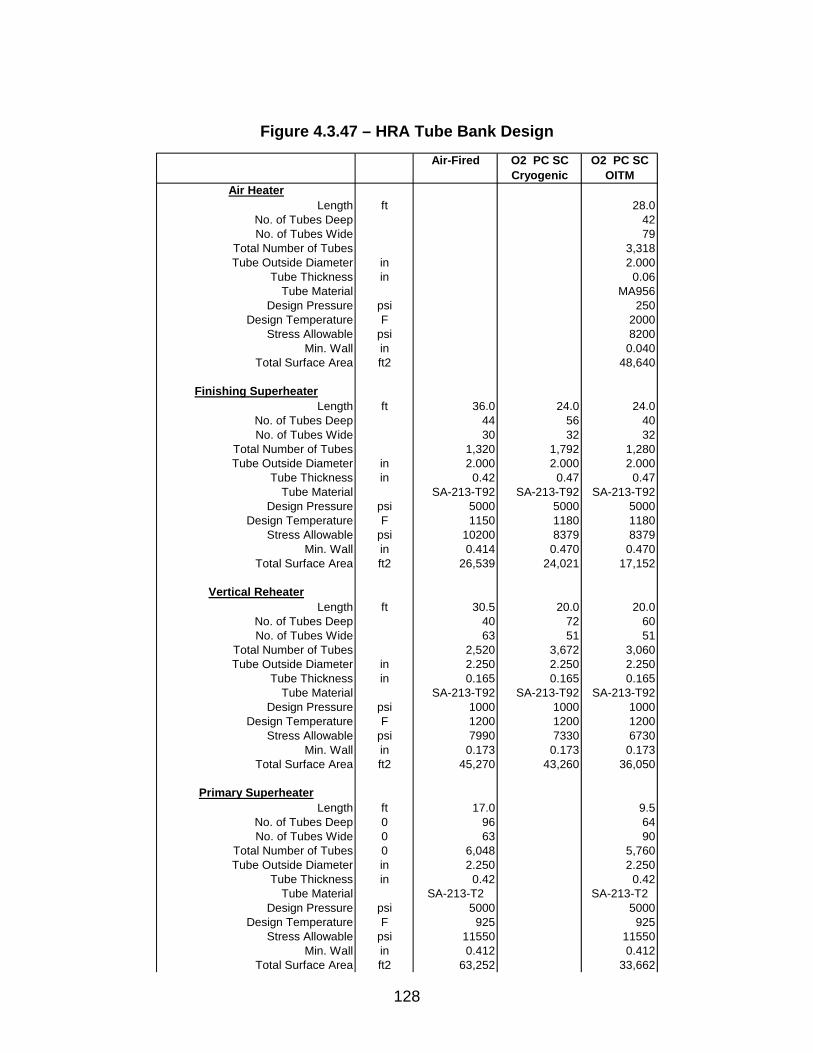
Figure 4.3.47 – HRA Tube Bank Design
Air-Fired O2 PC SC O2 PC SCCryogenic OITM
Air HeaterLength ft 28.0
No. of Tubes Deep 42No. of Tubes Wide 79
Total Number of Tubes 3,318Tube Outside Diameter in 2.000
Tube Thickness in 0.06Tube Material MA956
Design Pressure psi 250Design Temperature F 2000
Stress Allowable psi 8200Min. Wall in 0.040
Total Surface Area ft2 48,640
Finishing SuperheaterLength ft 36.0 24.0 24.0
No. of Tubes Deep 44 56 40No. of Tubes Wide 30 32 32
Total Number of Tubes 1,320 1,792 1,280Tube Outside Diameter in 2.000 2.000 2.000
Tube Thickness in 0.42 0.47 0.47Tube Material SA-213-T92 SA-213-T92 SA-213-T92
Design Pressure psi 5000 5000 5000Design Temperature F 1150 1180 1180
Stress Allowable psi 10200 8379 8379Min. Wall in 0.414 0.470 0.470
Total Surface Area ft2 26,539 24,021 17,152
Vertical ReheaterLength ft 30.5 20.0 20.0
No. of Tubes Deep 40 72 60No. of Tubes Wide 63 51 51
Total Number of Tubes 2,520 3,672 3,060Tube Outside Diameter in 2.250 2.250 2.250
Tube Thickness in 0.165 0.165 0.165Tube Material SA-213-T92 SA-213-T92 SA-213-T92
Design Pressure psi 1000 1000 1000Design Temperature F 1200 1200 1200
Stress Allowable psi 7990 7330 6730Min. Wall in 0.173 0.173 0.173
Total Surface Area ft2 45,270 43,260 36,050
Primary SuperheaterLength ft 17.0 9.5
No. of Tubes Deep 0 96 64No. of Tubes Wide 0 63 90
Total Number of Tubes 0 6,048 5,760Tube Outside Diameter in 2.250 2.250
Tube Thickness in 0.42 0.42Tube Material SA-213-T2 SA-213-T2
Design Pressure psi 5000 5000Design Temperature F 925 925
Stress Allowable psi 11550 11550Min. Wall in 0.412 0.412
Total Surface Area ft2 63,252 33,662
128

Figure 4.49 – HRA Tube Bank Design (Continued)
Air-Fired O2 PC SC O2 PC SCCryogenic OITM
Horizontal ReheaterLength ft 17.0 24.0 21.0
No. of Tubes Deep 70 75 75No. of Tubes Wide 125 90 90
Total Number of Tubes 8,750 6,750 6,750Tube Outside Diameter in 2.250 2.250 2.250
Tube Thickness in 0.165 0.165 0.165Tube Material SA-213-T2 SA-213-T2 SA-213-T2
Design Pressure psi 1000 1000 1000Design Temperature F 950 950 950
Stress Allowable psi 9200 9200 9200Min. Wall in 0.127 0.127 0.127
Total Surface Area ft2 93,461 101,792 89,067
Upper EconomizerLength ft 17.0 0.0 9.5
No. of Tubes Deep 30 0 36No. of Tubes Wide 126 0 90
Total Number of Tubes 3,780 0 3,240Tube Outside Diameter in 2.250 0.000 2.250
Tube Thickness in 0.34 0 0.32Tube Material SA-210-A1 0 SA-210-A1
Design Pressure psi 5000 0 5000Design Temperature F 700 0 650
Stress Allowable psi 15600 0 17100Min. Wall in 0.322 0 0.298
Total Surface Area ft2 40,373 0 19,339
Lower EconomizerLength ft 27.0 24.0 27.0
No. of Tubes Deep 33 39 33No. of Tubes Wide 126 90 90
Total Number of Tubes 4,158 3,510 2,970Tube Outside Diameter in 2.250 2.250 2.250
Tube Thickness in 0.32 0.32 0.32Tube Material SA-210-A1 SA-210-A1 SA-210-A1
Design Pressure psi 5000 5000 5000Design Temperature F 650 650 650
Stress Allowable psi 17100 17100 17100Min. Wall in 0.298 0.298 0.298
Total Surface Area ft2 66,130 49,620 47,240
Total HRA Surface Area ft2 335,025 218,693 291,150Total Furnace + HRA Surface Area ft2 382,574 252,002 309,799
129
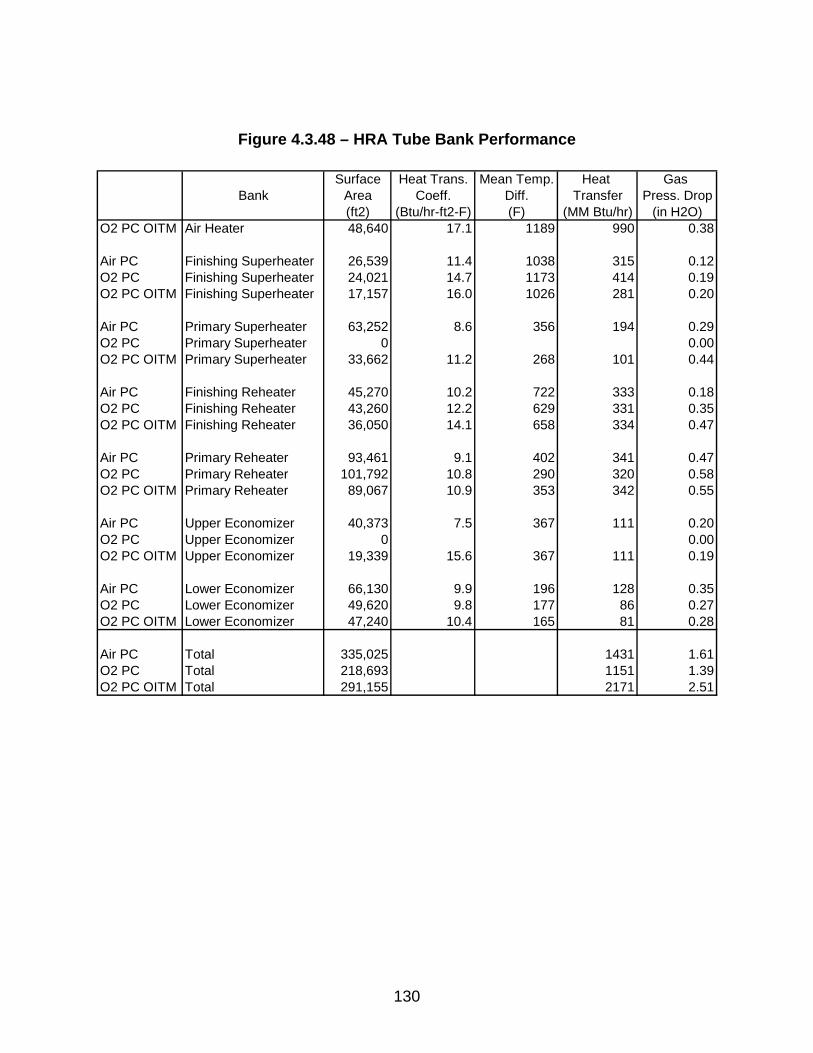
Figure 4.3.48 – HRA Tube Bank Performance
Surface Heat Trans. Mean Temp. Heat Gas Bank Area Coeff. Diff. Transfer Press. Drop
(ft2) (Btu/hr-ft2-F) (F) (MM Btu/hr) (in H2O)O2 PC OITM Air Heater 48,640 17.1 1189 990 0.38
Air PC Finishing Superheater 26,539 11.4 1038 315 0.12O2 PC Finishing Superheater 24,021 14.7 1173 414 0.19O2 PC OITM Finishing Superheater 17,157 16.0 1026 281 0.20
Air PC Primary Superheater 63,252 8.6 356 194 0.29O2 PC Primary Superheater 0 0.00O2 PC OITM Primary Superheater 33,662 11.2 268 101 0.44
Air PC Finishing Reheater 45,270 10.2 722 333 0.18O2 PC Finishing Reheater 43,260 12.2 629 331 0.35O2 PC OITM Finishing Reheater 36,050 14.1 658 334 0.47
Air PC Primary Reheater 93,461 9.1 402 341 0.47O2 PC Primary Reheater 101,792 10.8 290 320 0.58O2 PC OITM Primary Reheater 89,067 10.9 353 342 0.55
Air PC Upper Economizer 40,373 7.5 367 111 0.20O2 PC Upper Economizer 0 0.00O2 PC OITM Upper Economizer 19,339 15.6 367 111 0.19
Air PC Lower Economizer 66,130 9.9 196 128 0.35O2 PC Lower Economizer 49,620 9.8 177 86 0.27O2 PC OITM Lower Economizer 47,240 10.4 165 81 0.28
Air PC Total 335,025 1431 1.61O2 PC Total 218,693 1151 1.39O2 PC OITM Total 291,155 2171 2.51
130

4.4 Economic Analysis Economic analysis was performed for three cases: air-fired (reference), O2-fired with cryogenic ASU, and O2-fired with OITM. Economic analysis was not performed for the O2-fired PC with CAR since detailed cost information on the CAR process was not available in the literature nor was it provided by the vendor (BOC).
4.4.1 Main Assumptions The economic analysis was performed based on the DOE/NETL guidelines [14] using the EPRI Technical Assessment Guide (TAG) methodology. Plant capital costs were compiled under the Code of Accounts developed by EPRI. The estimate basis and major assumptions are listed below:
• Total plant costs were estimated in January 2006 dollars.
• Plant book life was assumed to be 20 years.
• The net power output of the reference air-fired plant is 430.2 MWe versus 347.0 MWe for the ASU oxygen-based plant and 463.3 MWe for the OITM oxygen-based plant.
• The plants operate with a capacity factor of 85 per cent (Plant operates at 100
per cent load 85 per cent of the time).
• Cost of electricity (COE) was determined on a levelized constant dollar basis.
• Average annual ambient air conditions for material balances, thermal efficiencies and other performance related parameters are at a dry bulb temperature of 60ºF and an air pressure of 14.7 psia.
• The coal is 2.5 per cent sulfur Illinois #6 coal (see Table 4.4.1 for analysis).
• Design CO2 effluent purity is presented in Table 4.4.2
• Terms used are consistent with the EPRI TAG.
Economic study assumptions are detailed in Table 4.4.3.
131

Table 4.4.1 - Coal Properties Illinois No. 6 Coal
C % 63.75%H % 4.50%O % 6.88%N % 1.25%Cl % 0.29%S % 2.51%
Ash % 9.70%H2O % 11.12%Total % 100.00%
LHV Btu/lb 11,283HHV Btu/lb 11,631
Table 4.4.2 - CO2 Effluent Purity Design Conditions
Constituent Units ValueN2 vppm < 300
H2O vppm < 20O2 vppm < 50
132

Table 4.4.3 – Economic Study Assumptions
GENERAL DATA/CHARACTERISTICS
Levelized Capacity Factor / Preproduction (equivalent months): 85%Capital Cost Year Dollars (Reference Year Dollars): 2006 (January)Design/ Construction Period: 4 yearsPlant Start-up Date (1st year Dollars): 2010 (January)Land Area/Unit Cost: 100 acres $1,600 / Acre
FINANCIAL CRITERIAProject Book Life: 20 yearsBook Salvage Value: 0 %Project Tax Life: 20 yearsTax Depreciation Method: Accel. Based on ACRS ClassInflation Rate 3.0 %Property Tax Rate: 1.0 %Insurance Tax Rate: 1.0 %Federal Income Tax Rate: 35.0 %State Income Tax Rate: 4.0 %Investment Tax Credit/% Eligible 0 %
Economic Basis: Over Book Constant Dollars
Capital Structure % of Total Cost (%)Common Equity 20 12Preferred Stock 0Debt 80 6.5
Weighted Cost of Capital: (after tax) 5.57%
Coal Price Escalation Rate 3.0% (same as general escalation)
Total Capital RequirementInitial Chemical Inventory 30 days
Startup Costs2% TPI30 days of fuel and chemicalslabor and miscellaneous items
Spare Parts 0.5% TPC
Working Capital30 days fuel and consumables30 days direct expenses
Consumable CostsCoal, $/MMBtu $1.34Limestone, $/ton $15.00Water, $/kgal $1.00Water Treatment Chemicals, $/kgal $0.50Ash/Slag Disposal, $/ton $10.00
Plant LaborOperating labor
Labor Rate 42.25 $/hr (includes labor burden)personnel 14 per shift
Supervisory/clerical 30% of operating + maintenance labor cost
Maintenance CostsLabor 0.88% TPC
Materials 1.32% TPC
133

4.4.2 Plant Cost Basis
For each of the plants, heat and material balances (Aspen simulations) were prepared that identified the flow rates and operating conditions of all major flow streams (Sect. 4.1 and Sect. 4.2). These balances also identified each boiler’s operating requirements and enabled design calculations to be performed that established the overall boiler dimensions, tube surface areas, materials of construction, weights, and auxiliary equipment requirements. With this information defined, the cost of each boiler, which together with its auxiliary equipment constitutes the plant “boiler island”, was determined from Foster Wheeler’s cost estimating database.
4.4.2.1 Air-Fired Reference Plant Cost In [15] Parsons presents a conceptual design of a supercritical pressure PC plant with a net power output of 550.2 MWe. Similar to the air-fired reference plant of this study, the Parsons plant burned 2.5 per cent sulfur Illinois No. 6 coal with air and, to control emissions, the boiler was provided with low NOx burners, SCR, wet flue gas desulfurization, and a baghouse filter. A detailed EPRI TAG cost estimate of the plant totaled $745.7 million or $1355/kW in year 2006 dollars and was broken down into 14 accounts, one of which (Account 4 entitled, “PC Boiler and Accessories”) included the cost of the PC boiler and its auxiliaries. Since the primary difference between the Parsons and the FW air-fired reference plant is size, the Parsons balance of plant costs (excluding the boiler island) were scaled down on an account-by-account basis to obtain the reference plant balance of plant costs. As recommended in [16] a scaling exponent of 0.65 applied to flow rate/output was used and a small adjustment to the PC plant’s feedwater and steam turbine accounts was made for the slightly higher operating pressure. Boiler island costs were estimated directly by FW based on designs generated in Task 3 (Sect. 4.3). To validate the scaling process, Parsons Account 4 boiler costs were scaled down and determined to be within 6 per cent of Foster Wheeler’s directly estimated costs. The results of the scaling, together with Foster Wheeler’s determined Account 4 (boiler island) costs, yielded a total plant cost of $633.0 million or $1471/kW for the 430.2 MWe reference plant. The account-by-account costs of the air-fired reference plant (case-1, Figure 4.1.1) are presented in Table 4.4.4. The total plant cost (TPC), also referred to as the plant capital cost is comprised of the following elements:
1. Bare erected plant cost (includes equipment supply and erection) 2. Architect engineering, construction management, and fee 3. Project and process contingencies
The reference plant estimate uses the same erection factors, fees, and contingencies as the Parsons plant estimate (i.e. boiler erection at 80 per cent of equipment supply costs, architect engineering/construction management/home office/fees at 10 per cent
134

of bare erected costs, and contingency, totaling 10 per cent, applied to the sum of items 1 and 2).
4.4.2.2 Oxygen Based PC Plant Costs In [7] Parsons presents conceptual designs of two plants that burned 2.5 per cent sulfur Illinois No. 6 coal with oxygen to facilitate CO2 capture/removal for pipeline transport to a sequestering site. Both plants used flue gas recirculation to control their boiler combustion temperatures and their CO2 rich exhaust gases were dried and compressed for pipeline transport. The first plant had a net power output of 132.2 MWe; its oxygen was supplied by a conventional, cryogenic ASU, and the gas flow to the CO2 processing unit totaled 422.3 Klb/hr. The oxygen was 99 per cent pure and it was delivered to an “air heater” at the boiler where 660ºF flue gas heated the oxygen to 610ºF for delivery to the boiler at a rate of 327.1 Klb/hr. In the FW study’s ASU based plant, the oxygen from the ASU is also heated by an “air heater” at the boiler but to 625ºF with 695ºF flue gas; aside from some slight temperature differences, the plant arrangements are similar and their ASUs differ primarily in size/through put. The second Parsons plant had a net output of 197.4 MWe; its oxygen was supplied at a rate of 398.8 Klb/hr by an ion transport membrane, and the gas flow to CO2 processing was 515.8 Klb/hr. The OITM operated with 200 psia air that was heated to 1652ºF via heat transfer surface placed in the boiler; the hot air was then delivered to the OITM for separation of the oxygen and nitrogen. The oxygen, with a purity of 100 per cent, was then delivered to the boiler, whereas, the nitrogen was passed through a hot gas expander followed by a heat recovery steam generator for power recovery. Excepting for differences in flow rates, the operating conditions of the Parsons OITM plant are essentially identical to the OITM based plant of the FW study. Praxair Inc, a developer of oxygen transport membranes, participated in the detailed Alstom/Parsons study [7] and, per the Acknowledgement section of their study report, provided detailed design, performance, and cost information on the OITM system. Aside from a difference in flow rate, the FW OITM operates at essentially the same pressure and temperature as that used in the Alstom/Parsons study and, hence, the FW system cost estimate was obtained by scaling their system capital costs. Consequently, individual OITM component designs were not developed in the FW study. It is assumed that Parsons/Praxair selected the operating conditions of the OITM to minimize the overall system cost. Such a sensitivity/optimization cost evaluation of the OITM plant design is beyond the scope of the FW study. Note that there are several variables, which have direct influence on the OITM plant cost and performance (see Sect. 4.2.2.3 for more details). These variables include
O2 Recovery Percentage: CO2 removal power penalty is minimum at an O2 recovery of 85% (The Alstom/Parsons study uses a O2 recovery of 85%).
135

Air Pressure: Increasing air pressure reduces OITM size, but also reduces system efficiency. Optimum pressure depends on the relative cost of the OITM. OITM Temperature: Increasing OITM operating temperature will increase system efficiency, but will increase boiler air heater cost and presumably OITM cost.
A detailed 14 account EPRI TAG cost estimate in year 2003 dollars was prepared by Parsons for each of the two plants; in these estimates the oxygen (ASU or OITM) and CO2 processing system costs appear, respectively, as separate sub-accounts under the Boiler and Accessories and Flue Gas Clean Up Accounts. Since the arrangement and scope of supply of these systems is essentially identical to that of the FW study’s O2-fired plants, the Parsons costs were used to estimate the costs of Foster Wheeler’s two plants. The Parsons ASU system costs were scaled up based on oxygen flow rate raised to the 0.65 exponent and escalated to year 2006 dollars; comparison of the scaled up costs with a vendor supplied budget price yielded good agreement further validating the scale up exponent. Comparison of the gas processing system costs given for Parsons’ two plants, however, revealed a greater sensitivity to flow rate and resulted in a scaling exponent of 0.87; this exponent was then used to calculate the CO2 gas processing system costs of Foster Wheeler’s plants. The Table 4.4.4 air-fired reference plant cost estimate served as a starting point for the determination of O2 based plant costs. The cost of the air-fired PC boiler package was removed from the Parsons cost estimate and the new value, determined by Foster Wheeler for the particular plant configuration under study, was inserted. Then each balance of plant account and or component was individually scaled based on flow rate/output and adjusted, where necessary, to reflect design differences. Some examples of the changes that were made are removal of SCR systems, limestone systems, flue gas desulfurization systems, etc. and elimination of the stack from the ASU based plant. Table 4.4.5 and Table 4.4.6 present a detailed cost breakdown of the ASU based O2 plant (case-9B, Figure 4.1.9) and the OITM based O2-PC plant (case-18, Figure 4.2.10) and Table 4.4.7 compares the total costs of all three plants. Although the oxygen-based plants use flue gas recirculation to control the boiler combustion temperature, they operate with higher oxygen concentrations than the air-fired reference plant boiler. As a result they produce a higher combustion temperature and a lower flue gas flow rate, which reduce the size of the boiler and its downstream flue gas components. With the SCR eliminated and the flue gas flow rate reduced, the PC boiler cost of the ASU based plant is about $32 million less than that of the air-fired case. Despite additional savings associated with elimination of some systems/components (e.g. SCR, limestone, FGD, and stack plus a reduction in size of other components, i.e. baghouse filter, ducting, foundations, etc.), the total cost of the cryogenic ASU based plant is approximately $91 million higher than the air-fired plant because of the high cost of the ASU ($115.0 million) and CO2 processing systems ($111.5 million).
136
In the OITM based plant, the PC boiler not only meets the steam generation and heating needs of the steam cycle, but it also contains tubing that heats air to 1600ºF for delivery to the OITM. Although the boiler flue gas flow rate of the OITM based plant is about 25 per cent less than the air-fired plant, the cost savings it provides is more than negated by the high cost of the air heater tubing; as a result, the OITM based PC boiler costs $18 million more than that of the air-fired plant. The compressor required to pressurize OITM air to 200 psia, the OITM, the OITM associated heat exchangers and piping, the OITM power recovery system (hot gas expander and HRSG), and a larger CO2 gas processing system add additional costs to the plant; as a result, the OITM plant costs approximately 50 per cent more than the air-fired reference plant ($953.0 million versus $633.0 million) and approximately 32 per cent more than the cryogenic ASU based plant ($953.0 million versus $723.3 million). Since the OITM based plant operates with a higher electrical output than the cryogenic ASU based plant (463.3 MWe versus 347.0 MWe), its total plant costs on a dollar per kilowatt basis are slightly lower ($2.057/kW versus $2,084/kW) but much higher than the air-fired plant ($2,057/kW versus $1,471/kW).
137
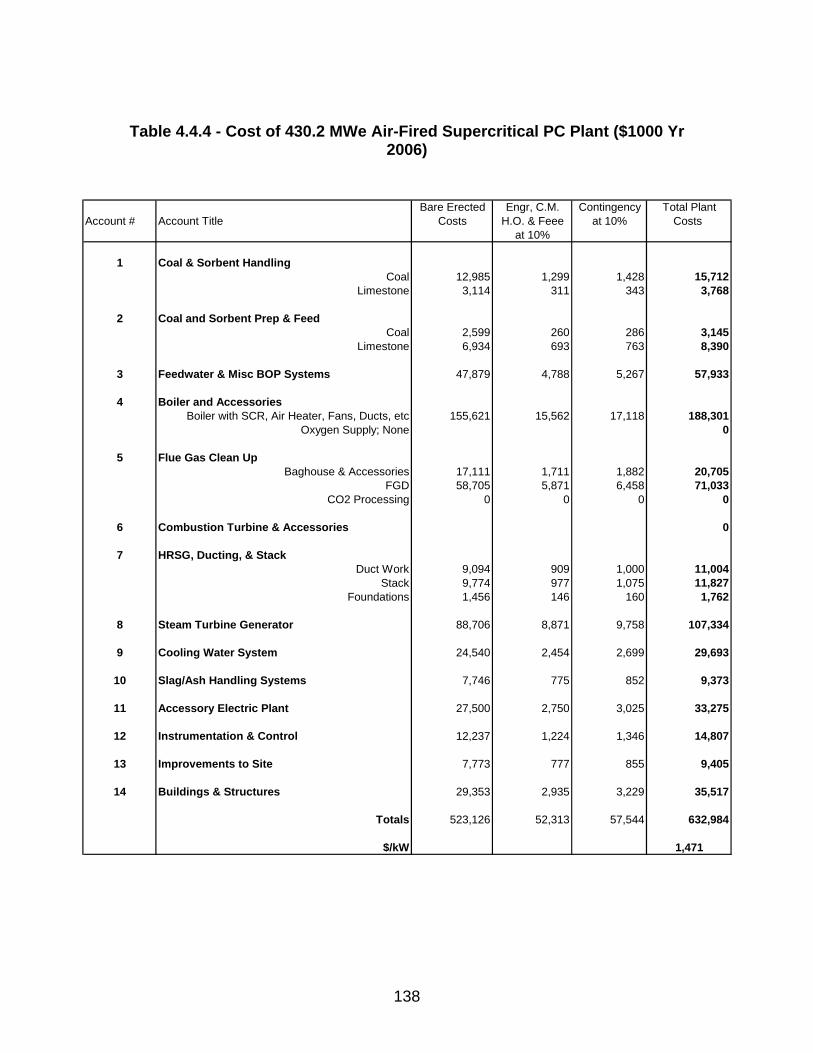
Table 4.4.4 - Cost of 430.2 MWe Air-Fired Supercritical PC Plant ($1000 Yr
2006)
Bare Erected Engr, C.M. Contingency Total PlantAccount # Account Title Costs H.O. & Feee at 10% Costs
at 10%
1 Coal & Sorbent HandlingCoal 12,985 1,299 1,428 15,712
Limestone 3,114 311 343 3,768
2 Coal and Sorbent Prep & FeedCoal 2,599 260 286 3,145
Limestone 6,934 693 763 8,390
3 Feedwater & Misc BOP Systems 47,879 4,788 5,267 57,933
4 Boiler and AccessoriesBoiler with SCR, Air Heater, Fans, Ducts, etc 155,621 15,562 17,118 188,301
Oxygen Supply; None 0
5 Flue Gas Clean UpBaghouse & Accessories 17,111 1,711 1,882 20,705
FGD 58,705 5,871 6,458 71,033CO2 Processing 0 0 0 0
6 Combustion Turbine & Accessories 0
7 HRSG, Ducting, & StackDuct Work 9,094 909 1,000 11,004
Stack 9,774 977 1,075 11,827Foundations 1,456 146 160 1,762
8 Steam Turbine Generator 88,706 8,871 9,758 107,334
9 Cooling Water System 24,540 2,454 2,699 29,693
10 Slag/Ash Handling Systems 7,746 775 852 9,373
11 Accessory Electric Plant 27,500 2,750 3,025 33,275
12 Instrumentation & Control 12,237 1,224 1,346 14,807
13 Improvements to Site 7,773 777 855 9,405
14 Buildings & Structures 29,353 2,935 3,229 35,517
Totals 523,126 52,313 57,544 632,984
$/kW 1,471
138

Table 4.4.5 - Cost of 347.0 MWe ASU Based Supercritical PC Plant ($1000 Yr
2006)
Bare Erected Engr, C.M. Contingency Total PlantAccount # Account Title Costs H.O. & Feee at 10% Costs
at 10%
1 Coal Handling 12,692 1,269 1,396 15,357
2 Coal Prep & Feed 2,540 254 279 3,074
3 Feedwater & Misc BOP Systems 47,879 4,788 5,267 57,933
4 Boiler and AccessoriesBoiler with Air Heater, Fans, Ducts, etc 129,052 12,905 14,196 156,153
Oxygen Supply: ASU 115,005 *
5 Flue Gas Clean UpBaghouse & Accessories 12,102 1,210 1,331 14,643
FGD 0CO2 Processing 111,493 *
6 Combustion Turbine & Accessories 0
7 HRSG, Ducting, & StackDuct Work and Foundations 6,432 643 707 7,782
Stack 0HRSG 0
8 Steam Turbine Generator 88,706 8,871 9,758 107,334
9 Cooling Water System 25,966 2,597 2,856 31,419
10 Slag/Ash Handling Systems 7,281 728 801 8,810
11 Accessory Electric Plant 27,885 2,789 3,067 33,741
12 Instrumentation & Control 12,408 1,241 1,365 15,014
13 Improvements to Site 7,882 788 867 9,537
14 Buildings & Structures 29,764 2,976 3,274 36,014
Totals 41,059 45,165 723,310
$/kW 2,084
*Values Scaled from Parsons /Alstom Year 2003 Study and Escalated to 2006 at 5% per Year
139

Table 4.4.6 - Cost of 463.3 MWe OITM Based Supercritical PC Plant ($1000 Yr 2006)
Bare Erected Engr, C.M. Contingency Total PlantAccount # Account Title Costs H.O. & Feee at 10% Costs
at 10%
1 Coal Handling 14,434 1,443 1,588 17,465
2 Coal Prep & Feed 2,889 289 318 3,496
3 Feedwater & Misc BOP Systems 47,879 4,788 5,267 57,933
4 Boiler and AccessoriesBoiler, Air Heater, Fans, Ducts, etc 170,902 17,090 18,799 206,791
Oxygen Supply: OTM 188,031 *
5 Flue Gas Clean UpBaghouse & Accessories 14,113 1,411 1,552 17,077
FGD 0CO2 Processing 131,662 *
6 Combustion Turbine & Accessories 48,627 *
7 HRSG, Ducting, & StackDuct Work 7,501 750 825 9,076
Stack 2,680 *Foundations 205 *
HRSG 18,420 *
8 Steam Turbine Generator 88,706 8,871 9,758 107,334
9 Cooling Water System 29,489 2,949 3,244 35,682
10 Slag/Ash Handling Systems 8,344 834 918 10,097
11 Accessory Electric Plant 29,101 2,910 3,201 35,212
12 Instrumentation & Control 12,949 1,295 1,424 15,668
13 Improvements to Site 8,225 823 905 9,953
14 Buildings & Structures 31,061 3,106 3,417 37,584
Totals 46,559 51,215 952,993
$/kW 2,057
*Values Scaled from Parsons /Alstom Year 2003 Study and Escalated to 2006 at 5% per Year
140
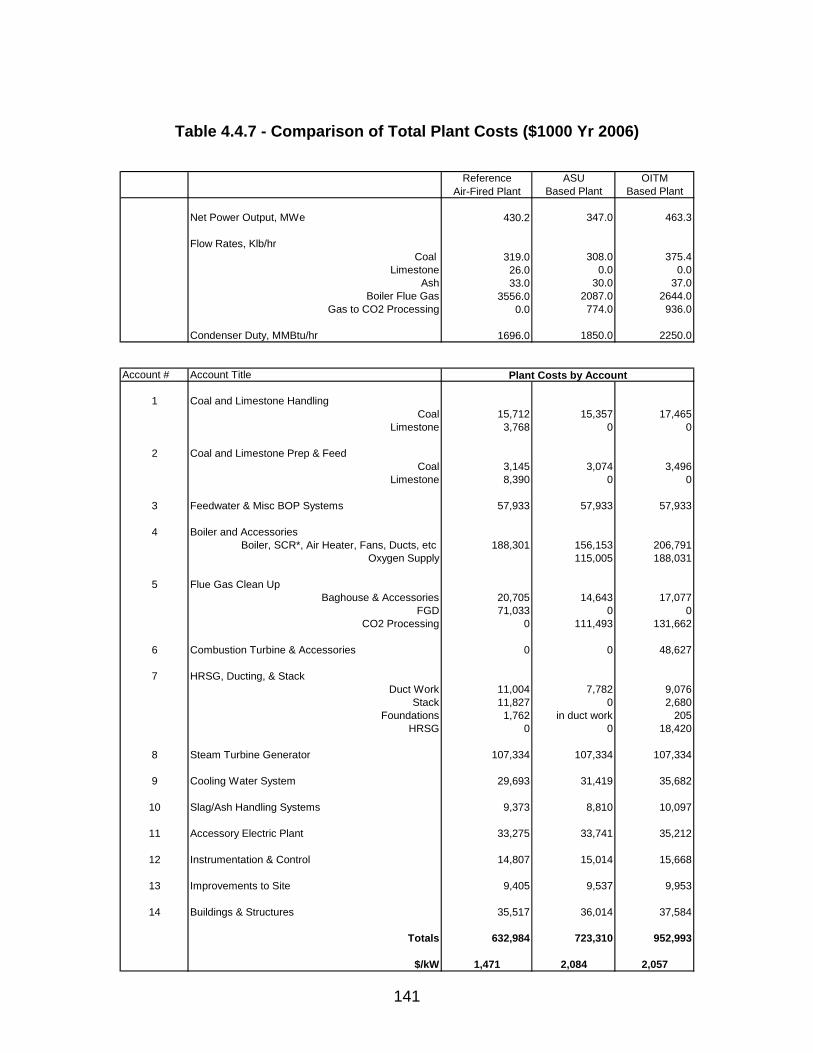
Table 4.4.7 - Comparison of Total Plant Costs ($1000 Yr 2006)
Reference ASU OITM
Air-Fired Plant Based Plant Based Plant
Net Power Output, MWe 430.2 347.0 463.3
Flow Rates, Klb/hrCoal 319.0 308.0 375.4
Limestone 26.0 0.0 0.0Ash 33.0 30.0 37.0
Boiler Flue Gas 3556.0 2087.0 2644.0Gas to CO2 Processing 0.0 774.0 936.0
Condenser Duty, MMBtu/hr 1696.0 1850.0 2250.0
Account # Account Title
1 Coal and Limestone HandlingCoal 15,712 15,357 17,465
Limestone 3,768 0 0
2 Coal and Limestone Prep & FeedCoal 3,145 3,074 3,496
Limestone 8,390 0 0
3 Feedwater & Misc BOP Systems 57,933 57,933 57,933
4 Boiler and AccessoriesBoiler, SCR*, Air Heater, Fans, Ducts, etc 188,301 156,153 206,791
Oxygen Supply 115,005 188,031
5 Flue Gas Clean UpBaghouse & Accessories 20,705 14,643 17,077
FGD 71,033 0 0CO2 Processing 0 111,493 131,662
6 Combustion Turbine & Accessories 0 0 48,627
7 HRSG, Ducting, & StackDuct Work 11,004 7,782 9,076
Stack 11,827 0 2,680Foundations 1,762 in duct work 205
HRSG 0 0 18,420
8 Steam Turbine Generator 107,334 107,334 107,334
9 Cooling Water System 29,693 31,419 35,682
10 Slag/Ash Handling Systems 9,373 8,810 10,097
11 Accessory Electric Plant 33,275 33,741 35,212
12 Instrumentation & Control 14,807 15,014 15,668
13 Improvements to Site 9,405 9,537 9,953
14 Buildings & Structures 35,517 36,014 37,584
Totals 632,984 723,310 952,993
$/kW 1,471 2,084 2,057
Plant Costs by Account
141

4.4.3 Total Plant Investment (TPI) The TPI at date of start-up includes escalation of construction costs and allowance for funds used during construction (AFUDC). AFUDC includes interest during construction as well as a similar concept for timing of equity funds over the construction period. TPI is computed from the TPC based on a linear draw down schedule and the compounded interest (or implied equity rate) in the percentages of debt and equity. Draw down was over the assumed 48-month construction schedule for all three plants. As the analysis is done in constant 2006 dollars, no escalation was applied. The full AFUDC is used in calculating returns on debt and equity, but only the interest during construction is included in the depreciation base.
4.4.4 Total Capital Requirement (TCR) The TCR includes all capital necessary to complete the entire project. TCR consists of TPI, prepaid royalties, pre-production (or start-up) costs, inventory capital, initial chemical and catalyst charge, and land cost: • Royalty Costs have been assumed to be zero, as none apply. • Start-Up/Pre-Production Costs are intended to cover operator training,
equipment checkout, extra maintenance, and use of fuel and other materials during plant start-up. They are estimated as follows: - Hiring and phasing-in prior to and during start up of operating and
maintenance labor, administrative and support labor, variable operating costs ramped up to full capacity (including fuel, chemicals, water, and other consumables and waste disposal charges. These variable costs are assumed to be compensated by electric energy payments during the start up period.
- Costs of spare parts usage, and expected changes and modifications to equipment that may be needed to bring the plant up to full capacity.
• Inventory capital is the value of inventories of fuel, other consumables, and by-products, which are capitalized and included in the inventory capital account. The inventory capital is estimated as follows: - Fuel inventory is based on full-capacity operation for 30 days. - Inventory of other consumables (excluding water) is normally based on
full-capacity operation for the same number of days as specified for the fuel.
- ½ percent of the TPC equipment cost is included for spare parts. • Initial catalyst and chemical charge covers the initial cost of any catalyst or
chemicals that are contained in the process equipment (but not in storage, which is covered in inventory capital). No value is shown because costs are assumed to have been included in the component equipment capital cost.
1. Land cost is based on 100 acres of land at $1,600 per acre.
142
4.4.5 Operating Costs And Expenses Operating costs were expressed in terms of the following categories:
• Operating Labor • Maintenance Cost
- Maintenance labor - Maintenance materials
• Administrative and Support Labor • Consumables • Fuel Cost
These values were calculated consistent with EPRI TAG methodology. All costs were based on a first year basis in January 2006 dollars. The first year costs do not include start-up expenses, which are included in the TCR. The cost categories listed above are calculated, on a dollars per year basis, as follows:
• Operating labor is calculated by multiplying the number of operating personnel with the average annual (burdened) compensation per person.
• Maintenance costs are estimated to be 2.2% of the TPC and are divided
into maintenance labor and maintenance materials
- Maintenance labor is estimated to be 40% of the total maintenance cost
- Maintenance materials are estimated to be 60% of the total maintenance cost
• Administrative and support labor is estimated to be equal to 30% of the
sum of operating and maintenance labor. • Consumables are feedstock and disposal costs calculated from the annual
usage at 100 per cent load and 85 per cent capacity factor. The costs is expressed in year 2006 dollars and levelized over 20 years on a constant dollar basis.
Fuel cost is calculated based on a coal delivered cost of $1.34/MMBtu. Fuel cost is determined on a first year basis and levelized over 20 years on a constant dollar basis. The calculation of first year fuel costs is done as follows: Fuel (tons/day) = Full Load Coal Feed Rate (lb/hr) x 24 hr/day / 2000 lbs/ton Fuel Unit Cost ($/ton) = HHV (Btu/lb) x 2000 lb/ton
143

Fuel Cost (1st year) = Fuel (tons/day) x Fuel Unit Cost ($/ton) x 365 day/yr x 0.85 (CF) The operating and maintenance costs, excluding fuel and consumables, are combined and divided into two components: 1) 90 per cent for Fixed O&M, which is independent of power generation, and 2) 10 per cent for Variable O&M, which is proportional to power generation.
4.4.6 Cost Of Electricity (COE) The COE value is made up of contributions from the capital cost (called the carrying charge), operating and maintenance costs, consumables, and fuel costs. The following relationship is used to calculate COE from these cost components: COE = LCC + LFOM x 100/(8760 x CF) + LVOM + LCM +LFC LCC = Levelized carrying charge, ¢/kWh LFOM = Levelized fixed O&M, $/kW-yr LVOM = Levelized variable O&M, ¢/kWh LCM = Levelized consumables, ¢/kWh LFC = Levelized fuel costs, ¢/kWh CF = plant capacity factor (0.85) The CO2 mitigation cost (MC) shows the cost impact, in dollars per tonne of CO2 that would otherwise be emitted, of a configuration that allows CO2 capture relative to the air-fired reference plant. The MC is calculated as follows: MC = COEwith removal - COEreference x 0.01 $/¢ Ereference – Ewith removal
COE = Cost of electricity in ¢/kWh E = CO2 emission in tonnes/kWh The capital investment and revenue requirements of the three plants are presented in detail in Table 4.4.8 through Table 4.4.10 and summarized in Table 4.4.11. With the oxygen based plants having higher total plant costs than the air-fired reference plant, their interest during construction is higher and they have higher total plant investment costs; start-up and working capital costs, which are somewhat related to total plant costs are also higher and yield total capital requirement costs that are 14 and 51 per cent higher than the air-fired plant.
144

The air-fired reference plant incorporates an ammonia based SCR and a limestone based scrubber to control its NOx and SOx emissions. Although these systems are not required with the oxygen based plants, the latter incorporates oxygen supply and CO2 processing systems. Since the number of systems added equaled the number deleted, it was assumed, in the absence of a detailed staffing study, that all three plants required the same number of operating personnel. Although operator costs are identical, maintenance and administration costs, which key off of total plant costs, are higher for the oxygen-based plants. The consumable requirements of the three plants are given in Table 4.4.12. With the SCR and scrubber systems deleted, the consumable costs of the oxygen-based plants are lower (ammonia and limestone costs are eliminated), but because of their lower efficiency, their fuel costs are higher (per net MWe). The higher fuel and higher operating and maintenance costs exceed the lower consumable cost savings and, as a result, the ASU and OITM plants have higher 20 year levelized production costs of $24.42/MWhr and $22.27/MWhr, respectively, versus $20.93/MWhr for the air-fired plant. When added to their respective higher capital carrying costs of $41.75/MWhr and $41.21/MWhr versus $29.48/MWhr, their costs of electricity of $66.17/MWhr and $63.48/MWhr are 31 and 26 per cent higher than the air-fired reference plant at $50.41/MWhr (see Figure 4.4.1). The breakdown of the COE for the three plants is summarized in Figure 4.4.2, where plant capital cost is divided into CO2 Processing, ASU, Turbines, Boiler, and Balance of Plant (BOP). The CO2 mitigation costs of the ASU and OITM based plants were calculated to be $20.23 and $16.77 per tonne of CO2 sent to the pipeline for sequestering (not including transportation cost). With the OITM based plant offering the promise of a lower CO2 mitigation cost, this analysis has shown that reducing the costs of both the oxygen supply and the CO2 processing systems are a key to reducing both the cost of electricity and CO2 mitigation costs of these sequestration ready power plants.
4.4.7 Tube Weld Overlay As discussed in Section 4.3.4 tube wall weld overlays may be required to mitigate furnace waterwall corrosion. Conservatively assuming weld overlay is applied to the entire furnace adds approximately $7.5 million to the total plant cost. This increases the COE of the cryogenic O2-PC to 66.7 $/MWhr (increase of 0.75%) and the MC to $20.8 per tonne (increase of 3.0%). The weld overlay increases the COE of the OITM O2-PC to 63.7 $/MWhr (increase of 0.3%) and the MC to $17.0 per tonne (increase of 1.5%). Utilizing weld overlays would be more cost effective in mitigating corrosion than FGD since adding an FGD system (upstream of the recycle split) would increase the COE by approximately 9%. Note that adding an FGD system downstream of the recycle split (to remove SOx from the pipeline) would increase the COE by approximately 6%.
145

4.4.8 Reduced Pipeline Pressure The analysis performed herein was conservatively performed for a pipeline pressure of 3000 psia. The Reference 14 guidelines specify a pipeline pressure of 2200 psia. At 2200 psia system efficiency is increased by 0.1% and COE is reduced by 0.3%. The economic effects of adding tube overlay and reducing the pipeline pressure are shown in Table 4.4.13.
146
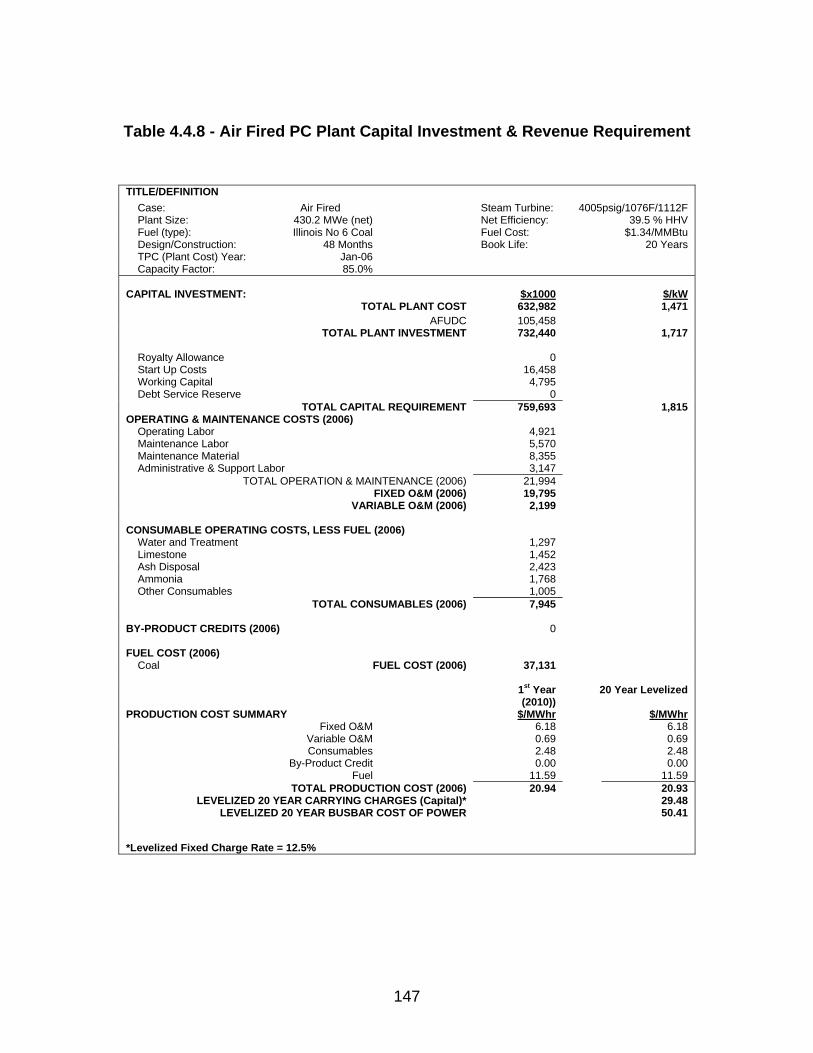
Table 4.4.8 - Air Fired PC Plant Capital Investment & Revenue Requirement
TITLE/DEFINITION Case: Air Fired Steam Turbine: 4005psig/1076F/1112F Plant Size: 430.2 MWe (net) Net Efficiency: 39.5 % HHV Fuel (type): Illinois No 6 Coal Fuel Cost: $1.34/MMBtu Design/Construction: 48 Months Book Life: 20 Years TPC (Plant Cost) Year: Jan-06 Capacity Factor: 85.0%
CAPITAL INVESTMENT: $x1000 $/kW
TOTAL PLANT COST 632,982 1,471 AFUDC 105,458
TOTAL PLANT INVESTMENT 732,440 1,717
Royalty Allowance 0 Start Up Costs 16,458 Working Capital 4,795 Debt Service Reserve 0
TOTAL CAPITAL REQUIREMENT 759,693 1,815 OPERATING & MAINTENANCE COSTS (2006)
Operating Labor 4,921 Maintenance Labor 5,570 Maintenance Material 8,355 Administrative & Support Labor 3,147
TOTAL OPERATION & MAINTENANCE (2006) 21,994 FIXED O&M (2006) 19,795
VARIABLE O&M (2006) 2,199 CONSUMABLE OPERATING COSTS, LESS FUEL (2006)
Water and Treatment 1,297 Limestone 1,452 Ash Disposal 2,423 Ammonia 1,768 Other Consumables 1,005
TOTAL CONSUMABLES (2006) 7,945 BY-PRODUCT CREDITS (2006) 0 FUEL COST (2006)
Coal FUEL COST (2006) 37,131 1st Year
(2010)) 20 Year Levelized
PRODUCTION COST SUMMARY $/MWhr $/MWhrFixed O&M 6.18 6.18
Variable O&M 0.69 0.69 Consumables 2.48 2.48
By-Product Credit 0.00 0.00 Fuel 11.59 11.59
TOTAL PRODUCTION COST (2006) 20.94 20.93 LEVELIZED 20 YEAR CARRYING CHARGES (Capital)* 29.48
LEVELIZED 20 YEAR BUSBAR COST OF POWER 50.41
*Levelized Fixed Charge Rate = 12.5%
147
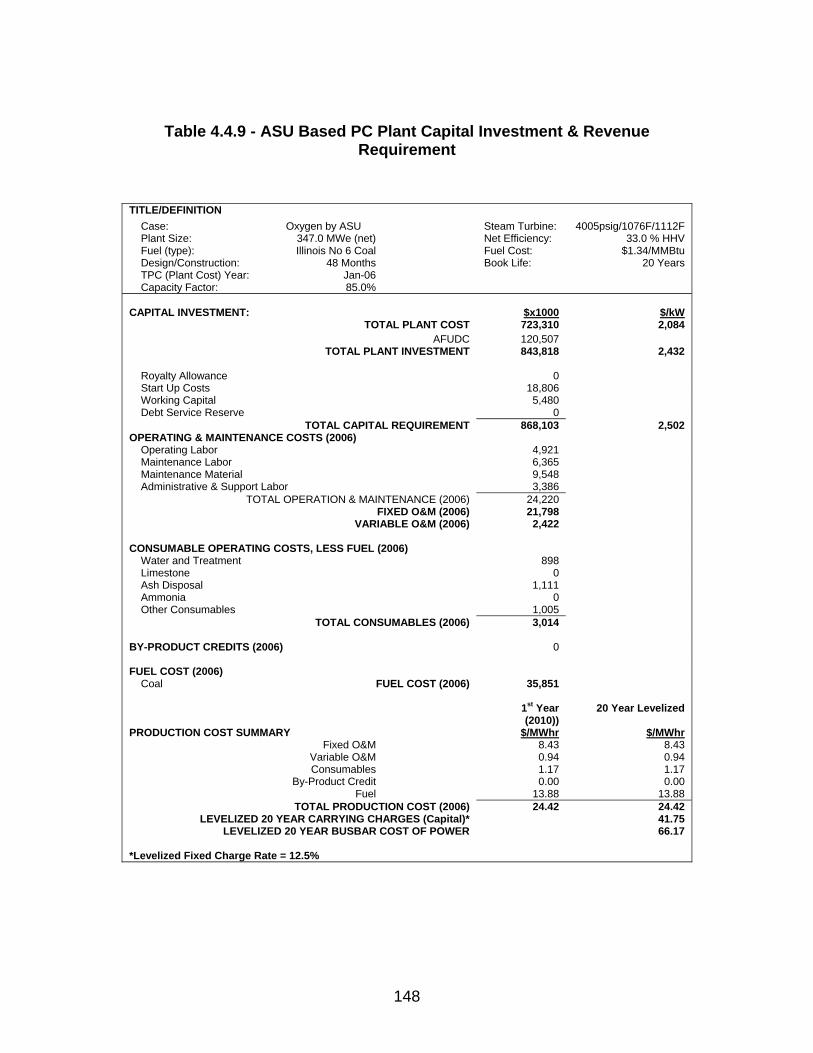
Table 4.4.9 - ASU Based PC Plant Capital Investment & Revenue
Requirement
TITLE/DEFINITION
Case: Oxygen by ASU Steam Turbine: 4005psig/1076F/1112F Plant Size: 347.0 MWe (net) Net Efficiency: 33.0 % HHV Fuel (type): Illinois No 6 Coal Fuel Cost: $1.34/MMBtu Design/Construction: 48 Months Book Life: 20 Years TPC (Plant Cost) Year: Jan-06 Capacity Factor: 85.0%
CAPITAL INVESTMENT: $x1000 $/kW
TOTAL PLANT COST 723,310 2,084 AFUDC 120,507
TOTAL PLANT INVESTMENT 843,818 2,432
Royalty Allowance 0 Start Up Costs 18,806 Working Capital 5,480 Debt Service Reserve 0
TOTAL CAPITAL REQUIREMENT 868,103 2,502 OPERATING & MAINTENANCE COSTS (2006)
Operating Labor 4,921 Maintenance Labor 6,365 Maintenance Material 9,548 Administrative & Support Labor 3,386
TOTAL OPERATION & MAINTENANCE (2006) 24,220 FIXED O&M (2006) 21,798
VARIABLE O&M (2006) 2,422 CONSUMABLE OPERATING COSTS, LESS FUEL (2006)
Water and Treatment 898 Limestone 0 Ash Disposal 1,111 Ammonia 0 Other Consumables 1,005
TOTAL CONSUMABLES (2006) 3,014 BY-PRODUCT CREDITS (2006) 0 FUEL COST (2006)
Coal FUEL COST (2006) 35,851 1st Year
(2010)) 20 Year Levelized
PRODUCTION COST SUMMARY $/MWhr $/MWhrFixed O&M 8.43 8.43
Variable O&M 0.94 0.94 Consumables 1.17 1.17
By-Product Credit 0.00 0.00 Fuel 13.88 13.88
TOTAL PRODUCTION COST (2006) 24.42 24.42 LEVELIZED 20 YEAR CARRYING CHARGES (Capital)* 41.75
LEVELIZED 20 YEAR BUSBAR COST OF POWER 66.17 *Levelized Fixed Charge Rate = 12.5%
148

Table 4.4.10 - OITM Based PC Plant Capital Investment & Revenue
Requirement
TITLE/DEFINITION
Case: Oxygen by Ion Transport Membrane
Steam Turbine: 4005psig/1076F/1112F
Plant Size: 463.3 MWe (net) Net Efficiency: 36.1 % HHV Fuel (type): Illinois No 6 Coal Fuel Cost: $1.34/MMBtu Design/Construction: 48 Months Book Life: 20 Years TPC (Plant Cost) Year: Jan-06 Capacity Factor: 85.0%
CAPITAL INVESTMENT: $x1000 $/kW
TOTAL PLANT COST 952,993 2,057 AFUDC 158,774
TOTAL PLANT INVESTMENT 1,111,767 2,400
Royalty Allowance 0 Start Up Costs 24,778 Working Capital 7,220 Debt Service Reserve 0
TOTAL CAPITAL REQUIREMENT 1,143,764 2,469 OPERATING & MAINTENANCE COSTS (2006)
Operating Labor 4,921 Maintenance Labor 8,386 Maintenance Material 12,579 Administrative & Support Labor 3,992
TOTAL OPERATION & MAINTENANCE (2006) 29,879 FIXED O&M (2006) 26,891
VARIABLE O&M (2006) 2,988 CONSUMABLE OPERATING COSTS, LESS FUEL (2006)
Water and Treatment 899 Limestone 0 Ash Disposal 1,356 Ammonia 0 Other Consumables 1,005
TOTAL CONSUMABLES (2006) 3,259 BY-PRODUCT CREDITS (2006) 0 FUEL COST (2006)
Coal FUEL COST (2006) 43,696 1st Year
(2010)) 20 Year Levelized
PRODUCTION COST SUMMARY $/MWhr $/MWhrFixed O&M 7.79 7.79
Variable O&M 0.86 0.86 Consumables 0.94 0.94
By-Product Credit 0.00 0.00 Fuel 12.67 12.67
TOTAL PRODUCTION COST (2006) 22.27 22.27 LEVELIZED 20 YEAR CARRYING CHARGES (Capital)* 41.21
LEVELIZED 20 YEAR BUSBAR COST OF POWER 63.48 *Levelized Fixed Charge Rate = 12.5%
149

Table 4.4.11 - Summary of Plant Economics and CO2 Mitigation Costs
Reference ASU Based OITM BasedAir-Fired Plant Plant Plant
Net Power Output, MWe 430.2 347.0 463.3
Efficiency, % (HHV) 39.5 33.0 36.1
Coal Flow, Klb/hr 319.0 308.0 375.4
CO2 to StackKlb/hr 739.0
Tonnes/MWhr 0.779CO2 to Pipe Line
Klb/hr 718.0 866.0Tonnes/MWhr 0.939 0.848
Total Plant CostMillions of Dollars 633.0 723.3 953.0
$/kW 1,471 2,084 2,057
Total Capital Requirement in Millions of Dollars 760.0 868.1 1143.8
Levelized Production Costs, $/MWhrOperating & Maintenance 6.86 9.37 8.66
Consummables 2.48 1.17 0.94Fuel 11.59 13.88 12.67
Total 20.93 24.42 22.27
Levelized Capital Carrying Charges, $/MWhr 29.48 41.75 41.21
Levelized COE, $/MWhr 50.41 66.17 63.48
CO2 Mitigation Cost, $/tonne 20.23 16.77
150
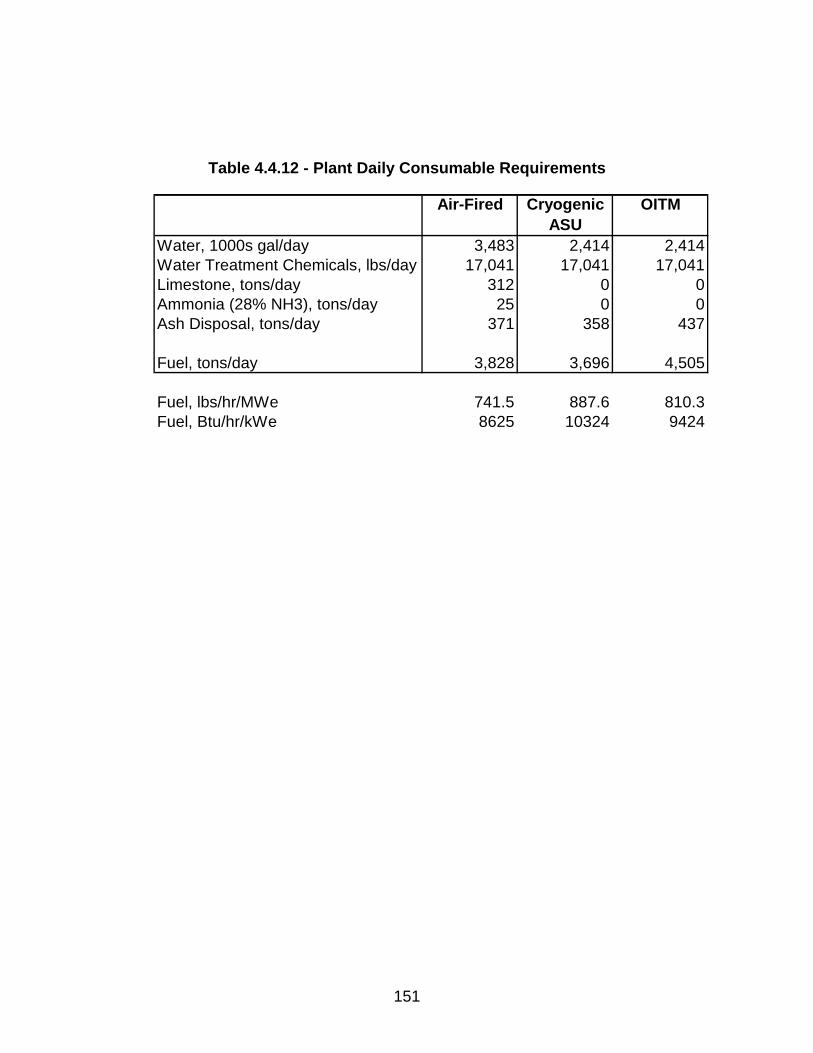
Table 4.4.12 - Plant Daily Consumable Requirements
Air-Fired Cryogenic OITMASU
Water, 1000s gal/day 3,483 2,414 2,414Water Treatment Chemicals, lbs/day 17,041 17,041 17,041Limestone, tons/day 312 0 0Ammonia (28% NH3), tons/day 25 0 0Ash Disposal, tons/day 371 358 437
Fuel, tons/day 3,828 3,696 4,505
Fuel, lbs/hr/MWe 741.5 887.6 810.3Fuel, Btu/hr/kWe 8625 10324 9424
151

Figure 4.4.1 – Increase in COE of O2 Plant Above Air-Fired Reference Plant
0.0%
5.0%
10.0%
15.0%
20.0%
25.0%
30.0%
35.0%
Cryogenic ASU OITM
Incr
ease
in C
OE
152

Figure 4.4.2 – COE Breakdown
0.00
1.00
2.00
3.00
4.00
5.00
6.00
7.00
Air Cryogenic OITM
CO
E (c
ents
/kw
h) CO2 ProcessingASUBOPTurbinesBoilerConsumablesO&MFuel
153

Table 4.4.13 – COE and CO2 MC with Weld Overlay and 2200 psi Pressure
Reference ASU Based OITM BasedAir-Fired Plant Plant Plant
Levelized COE, $/MWhrBase 50.4 66.2 63.5
With tube overlay & 3000 psi pipeline pressure 66.7 63.7With tube overlay & 2200 psi pipeline pressure 66.5 63.6
CO2 Mitigation Cost, $/tonne
Base 20.2 16.8With tube overlay & 3000 psi pipeline pressure 20.8 17.1With tube overlay & 2200 psi pipeline pressure 20.6 16.8
154

4.4.9 Comparison with Other Technologies
An economic comparison was performed between the O2-PC and other competing CO2 removal technologies. For comparison the following alternate technologies were chosen: Air PC: Supercritical PC plant with post-combustion CO2 mitigation (Ref.
[15] case 12). NGCC: Natural Gas Combined Cycle with post combustion (Ref. [15] case
14). IGCC: Integrated Gasification Combined Cycle with pre-combustion CO2
mitigation (Ref. [15] case 4). SUB O2PC: Oxygen-fired subcritical PC (Ref. [3]). The economics of these technologies were compared with the supercritical O2- PC using both the levelized cost of electricity and the CO2 mitigation cost as indexes. The CO2 mitigation cost (MC) shows the cost impact, in dollars per tonne of CO2 that would otherwise be emitted, of a configuration that allows CO2 capture relative to the reference plant. The COE and MC for the Air PC, NGCC, and IGCC were obtained from Ref. 15. Since the economic analysis of Ref. 15 were made for a larger power plant (480-550 MWe net power) they were scaled to a 30% smaller power plant to be consistent with the supercritical O2-PC analyzed herein. The COE and MC for the subcritical O2-PC were obtained from Ref. 3 and adjusted from 2004 to 2006 dollars and from a coal cost of $1.14/MMBtu to $1.34/MMBtu. Figure 4.4.3 and Figure 4.4.4 present a comparison of the COE and MC using an 85% capacity factor. Compared to the COE of the supercritical cryogenic O2-PC, the COE for the other technologies is 52% higher for Air PC, 35% higher for NGCC, 15% higher for IGCC, and 5% higher for the subcritical O2-PC, and 4% lower for the supercritical O2-PC with OITM. Compared to the MC of the supercritical cryogenic O2-PC, the MC for the other technologies is 238% higher for NGCC, 192% higher for Air PC, 25% higher for IGCC, 5% higher for the subcritical O2-PC, and 17% lower for the supercritical O2-PC with OITM. Since based on operating experience an 85% capacity factor for IGCC technology appears too optimistic, the COE and MC with a 70% capacity factor is also shown in Figure 4.4.3 and Figure 4.4.4 (COE is increased by 16% and MC by 18%).
155
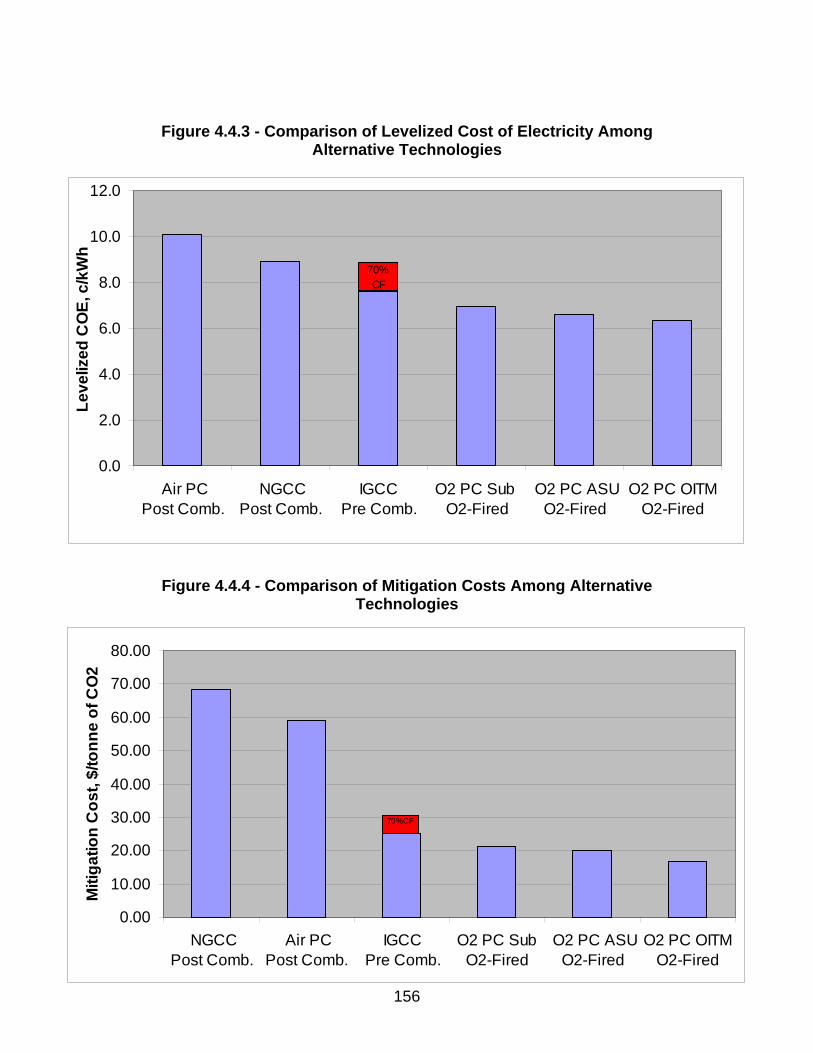
Figure 4.4.3 - Comparison of Levelized Cost of Electricity Among
Alternative Technologies
0.0
2.0
4.0
6.0
8.0
10.0
12.0
Air PC Post Comb.
NGCC Post Comb.
IGCC Pre Comb.
O2 PC Sub O2-Fired
O2 PC ASUO2-Fired
O2 PC OITMO2-Fired
Leve
lized
CO
E, c
/kW
h
70%CF
Figure 4.4.4 - Comparison of Mitigation Costs Among Alternative
Technologies
0.00
10.00
20.00
30.00
40.00
50.00
60.00
70.00
80.00
NGCC Post Comb.
Air PC Post Comb.
IGCC Pre Comb.
O2 PC Sub O2-Fired
O2 PC ASUO2-Fired
O2 PC OITMO2-Fired
Miti
gatio
n C
ost,
$/to
nne
of C
O2
70% CF
156

5.0 Conclusion To assure continued U.S. power generation from its abundant domestic coal resources, new coal combustion technologies must be developed to meet future emissions standards, especially CO2 sequestration. Current conventional coal-fired boiler plants burn coal using 15-20% excess air producing a flue gas, which is only approximately 15% CO2. Consequently, CO2 sequestration requires non-condensable gases stripping, which is both expensive and highly power-consumptive. Several different technologies for concentrating the CO2 by removing the non-condensable gases have been proposed including amine-based absorption and membrane gas absorption. However, these techniques require substantial energy, typically from low-pressure steam. A new boiler is presented where the combustion air is separated into O2 and N2 and the boiler uses the O2, mixed with recycled flue gas, to combust the coal. The products of combustion are thus only CO2 and water vapor. The water vapor is readily condensed, yielding a pure CO2 stream ready for sequestration. The CO2 effluent is in a liquid form and is piped from the plant to the sequestration site. The combustion facility is thus truly a zero emission stackless plant. A conceptual design of a CO2 sequestration-ready oxygen-based 460 MWe supercritical PC boiler plant was developed. The selected O2-fired design case has a system efficiency of 32.9% compared to the air-fired system efficiency of 39.5%. The efficiency and cost-effectiveness of carbon sequestration in oxygen-firing boilers can be optimized by specifically tailoring boiler design by appropriate surface location, combustion system design, material selection, furnace layout, and water/steam circuitry. Boiler efficiencies of near 100% can be achieved by recovery of virtually all of the flue gas exhaust sensible heat. Boiler size can be drastically reduced due to higher radiative properties of O2-combustion versus air-combustion. Furthermore, a wider range of fuels can be burned due to the high oxygen content of the combustion gas and potential for high coal preheat. A conceptual design of a CO2 sequestration-ready oxygen-based 460 MWe supercritical PC boiler plant was developed with integration of advanced oxygen separation techniques, such as OITM and CAR. The optimized OITM O2-fired design case has a CO2 removal specific power penalty of 42 kWh/klbCO2 and a system efficiency of 36.1% compared to the air-fired system efficiency of 39.5%. Considering that CO2 compression itself consumes 40 kWh/klbCO2, the OITM integration into the O2-PC is a breakthrough in CO2 removal. The CAR process efficiency loss and specific power penalty lies approximately midway between the cryogenic ASU and OITM. The O2-fired PC CO2 removal penalty with integration of OITM is nearly a quarter of that from post combustion CO2 removal technologies, and only a half of IGCC.
157
OITM faces significant challenges with respect to the manufacture and stability of membranes, and scale up and design of large plants. A design and analysis of a reference air-fired boiler, an oxygen-fired boiler with cryogenic ASU, and an oxygen-fired boiler with oxygen ion transport membrane were performed. The O2-PC supercritical boiler incorporates the OTU BENSON vertical technology, which uses low fluid mass flow rates in combination with optimized rifled tubing. The following conclusions are made comparing the air-fired furnace with the oxygen-fired furnace design and performance:
1. The oxygen furnace has only approximately 65% of the surface area and approximately 45% of the volume of the air-fired furnace due to the higher heat flux of the oxygen-fired furnace.
2. Due to the higher O2 concentration of the oxygen-fired furnace versus the
air-fired furnace (40% vs. 21%), the maximum flame temperature of the oxygen-fired furnace is approximately 500°F higher.
3. Maximum wall heat flux in the oxygen-fired furnace is about 2.5 times that
of the air-fired furnace (175,000 Btu/hr-ft2 vs. 70,000 Btu/hr-ft2) due to the higher flame temperature and higher H2O and CO2 concentrations.
4. 100% coal burnout is achieved in the oxygen-fired furnace (compared to
99.6% burnout in the air-fired furnace) due to higher furnace temperature and higher concentration of oxygen. The burnout differential between the oxygen-fired boiler and the air-fired boiler is expected to be significantly greater when harder to burn fuels are fired.
5. The higher heat flux of the oxygen-fired furnace significantly increases the
maximum waterwall temperature (from 870°F for the air-fired furnace to 1060°F for the oxygen-fired furnace) requiring the material to be upgraded from T2 to T92.
6. NOx is reduced by oxygen firing (compared to air-firing) by about a factor
of two from 0.38 lb/MMBtu to 0.18 lb/MMBtu.
7. A pressure equalization header is included at an elevation of 80’ to ensure stable operation at low loads.
8. The total heat transfer surface required in the HRA is 35% less than the
air-fired HRA due to more heat being absorbed in the oxygen-fired furnace and the greater molecular weight of the oxygen-fired flue gas. To minimize the required surface area, the HRA design is in series for the cryogenic ASU O2-PC and parallel for the OITM O2-PC.
158

9. To reduce the corrosion in the O2-PC, weld overlays with high Nickel and Chromium contents (e.g. alloy 622) are applied to the waterwalls. This reduces the predicted maximum corrosion from 45 mil/yr to 10 mil/yr.
10. The required HRA tube materials and wall thicknesses are nearly the
same for the air-fired and oxygen-fired design since the flue gas and water/steam temperature profiles encountered by the heat transfer banks are similar.
11. A tubular convective air heater is included in the OITM O2-PC to provide
the necessary air heating for the membrane separation process. The furnace air heater is an Incoloy MA956 three-pass tubular design situated above the furnace nose.
The levelized cost of electricity of the supercritical pressure, air-fired reference plant was calculated to be $50.41/MWhr and it operated with an efficiency of 39.5 per cent. The oxygen supply and CO2 gas processing systems required by the oxygen-based plants significantly increase their plant costs and parasitic power requirements. The cryogenic ASU based plant had a cost of electricity of $66.17/MWhr and an efficiency of 33.0 per cent. The oxygen transport membrane of the OITM based plant operates at 200 psia with air heated to 1600ºF via tubes placed in the boiler. The high cost of this boiler tubing, together with piping, heat exchangers, and the oxygen transport membrane itself, add considerable costs to the plant. Since the nitrogen exhausting from the membrane is hot and at pressure, it can be used for power recovery via a hot gas expander and HRSG. Although addition of these components further increases plant costs, the added power they provide increases the plant efficiency to 36.1 per cent and enables the OITM based plant to operate with a cost of electricity that is less than that of the ASU based plant e.g. $63.48/MWhr versus $66.17/MWhr. As a result the CO2 mitigation cost of the OITM based plant was calculated to be less than that of the ASU based plant e.g. $15.66/tonne versus $17.06/tonne, respectively. The addition of weld overlay increases the COE approximately 0.75%, but reducing the pipeline pressure from 3000 psia to 2200 psia (specified in Ref. 14) reduces the COE by 0.3%. Thus, the combined effect of these two adjustments on the COE is relatively small (+0.4% for cryogenic O2-PC and +0.1% for the OITM O2-PC). The oxygen supply and the CO2 gas processing systems have a major impact on the economics and efficiency of oxygen-based plants. Additional R&D aimed at improving these systems, especially OITMs, is necessary to improve both electricity costs and CO2 mitigation costs. The O2-fired PC CO2 removal penalty is nearly half that of post combustion CO2 removal technologies and 15% to 30% than that of IGCC pre-combustion
159

capture. Furthermore, of the CO2 sequestration-ready technologies, the O2-fired PC is the simplest, requires the least modification of existing proven designs, and requires no special chemicals for CO2 separation. Thus CO2 sequestration with an oxygen-fired combustion plant can be performed in a proven reliable technology while maintaining a low-cost high-efficiency power plant. As new lower power-consuming air separation techniques, such as membrane separation, become commercially available for large-scale operation in O2-fired plants, the CO2 removal power consumption and efficiency reduction will continue to decline.
160

6.0 References
1. White, J.S., Buchanan, T.L., Schoff, R.L. (Parsons); Stiegel, G. (DOE); Holt, N.A., Booras G. (EPRI); Wolk, R. (WITS), “Evaluation of Innovative Fossil Fuel Power Plants with CO2 Removal”, EPRI Report No. 1000316, December 2000.
2. Wilkinson, M., Boden, John (BP), Panesar, R. (Mitsui Babcock), Allam, R.
(Air Products), “CO2 Capture Via Oxygen Firing: Optimisation of a Retrofit Design Concept for a Refinery Power Station Boiler”, First National Conference on Carbon Sequestration, May 15-17, 2001, Washington DC.
3. Seltzer, Andrew and Fan, Zhen, Conceptual Design of Oxygen-Based PC
Boiler, DOE # DE-FC26-03NT41736, September 2005.
4. Philip A. Armstrong, E.P. Foster, Dennis A Horazak, Harry T Morehead, VanEric E. Stein, “Ceramic and Coal: ITM Oxygen for IGCC”, The 22nd Pittsburgh Coal Conference, Sept.11-15, 2005, Pittsburgh, USA
5. Divyanshu Acharya, Krish R. Krishnamurthy, Michael Leison, Scott
MacAdam, Vijay K. Sethi, Marie Anheden, Kristin Jordal, Jinying Yan, “Development of a High Temperature Oxygen Generation Process and Its Application to Oxycombustion Power Plants with Carbon Dioxide Capture”, ibid
6. A.A. Leontiou, A.K. Ladavos, T.V. Bakas, T.C. Vaimakis, & P.J. Pomonis,
“Reverse uptake of oxygen from La1-xSrx(Fe3+/Fe4+)O3 perovskite-type mixed oxides”, Applied Catalyst A: General 241 (2003) p143-154.
7. “Greenhouse Gas Emissions Control By Oxygen Firing In Circulating
Fluidized Bed Boilers: Phase 1 – A Preliminary Systems Evaluation”, Alstom Power Inc. Power Plant Laboratories, PPL Report No. PPL-03-CT-09, DOE/NETL Cooperative Agreement No. DE-FC26-01NT41146, May 15, 2003.
8. Philip A. Armstrong, “Method for Predicting Performance of an Ion
Transport Membrane Unit-Operation”, Air Products and Chemicals, Inc.
9. FW-FIRE, Fossil-fuel Water-walled Furnace Integrated Reaction Emission, Theory and User’s Manual, Foster Wheeler Development Corp., 11/30/99.
10. HEATEX Computer Program, “A Program to Determine the
Thermal/Hydraulic Performance of Gas-Cooled Heat Exchangers”, Revision 24, Foster Wheeler Corporation.
161

11. EMISS Computer Program, “A Program to Determine Gaseous Emissivity”, Foster Wheeler Corporation.
12. STADE2 Computer Program, ”Calculation Program for Pressure Drop and
Heat Transfer in Tubes”, Siemens, Version 4.40.
13. DYNASTAB Computer Program, “Dynamic Stability of the Flow through Evaporator Heating Tubes in Fossil Fired Steam Generators”, Siemens, Version 1.1.
14. “Carbon Capture and Sequestration System Analysis Guidelines”,
DOE/NETL, April 2005.
15. “2006 Cost and Performance Comparison of Fossil Energy Power Plants”, DOE/NETL-401/053106, Draft Final May 2006.
16. “Task 1 Topical Report - IGCC Plant Cost Optimization”, Gasification Plant
Cost and Performance Optimization, DOE/NETL Contract No. DE-AC26-99FT40342, May 2002.
162

7.0 Bibliography N/A
163

8.0 List of Acronyms and Abbreviations ASU Air Separation Unit BOP Balance of Plant CAR Ceramic auto-thermal recovery CDT Compressor discharge temperature CF Capacity Factor CFD Computational fluid dynamics COE Cost of Electricity DNB Departure from nucleate boiling E Emission of CO2 EPRI Electric Power Research Institute FD Forced draft FEGT Furnace exit gas temperature FGD Flue Gas Desulfurization FW Foster Wheeler FW-FIRE Fossil fuel, Water-walled Furnace Integrated Reaction and
Emission Simulation GT Gas turbine HHV Higher Heating Value HIPPS High performance power system HRA Heat recovery area HRSG Heat Recovery Steam Generator ID Induced draft IGCC Integrated gasification combined cycle LCC Levelized Carrying Charge LCM Levelized Consumables LFC Levelized Fuel Costs LFOM Levelized Fixed O&M LHV Lower Heating Value LMPD Log mean pressure difference LMTD Log mean temperature difference LOI Loss on ignition LP Low pressure LVOM Levelized Variable O&M MC Mitigation Cost (CO2) NGCC Natural gas combined cycle NOx Nitrogen Oxides O&M Operation and Maintenance OD Outside diameter OFA Over-fired air OITM Oxygen Ion Transport Membrane OTU Once-through utility PC Pulverized Coal PFBC Pressurized fluidized bed combustion PSA Pressure swing absorption RH Reheater
164

SCR Selective Catalytic Reactor SH Superheater SOx Sulfur Oxides ST Steam Turbine T Temperature TCR Total Capital Requirement TEG Triethyleneglycol TET Turbine Exit temperature TPC Total Plant Cost TPI Total Plant Investment UBC Unburned carbon loss
165